The Na+/K+ pump dominates control of glycolysis in hippocampal dentate granule cells
- Department of Neurobiology, Harvard Medical School, United States
Figures
Figure 1 with 3 supplements
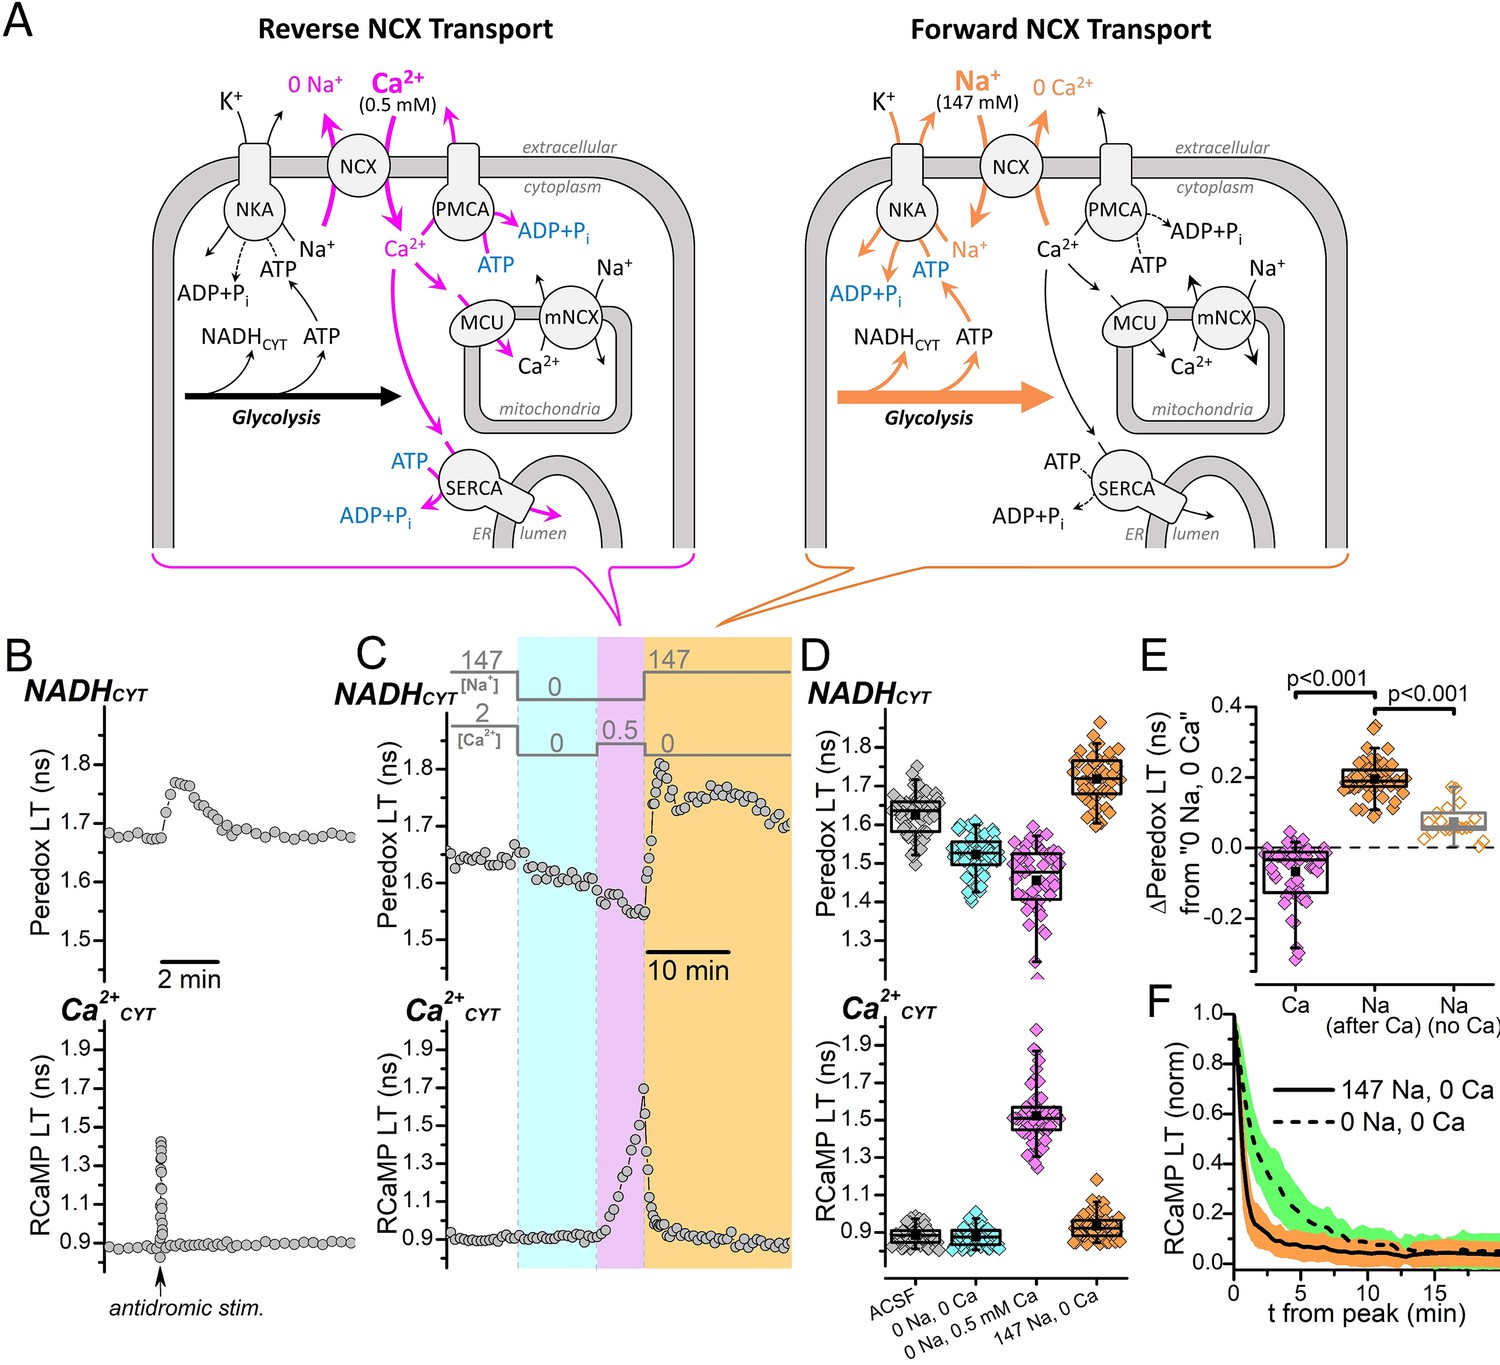
NADHCYT production is strongly influenced by Na+, but not by Ca2+CYT.
(A) Cartoon showing the NCX transport modes activated by different external [Na+] and [Ca2+] conditions and their expected effects on the activities of ion pumps and the production of NADHCYT from glycolysis activation. Reverse NCX transport (left schematic) increases intracellular [Ca2+], which increases the activities Ca2+ pumps and Ca2+ transport into mitochondria (magenta arrows). Forward NCX transport (right schematic) increases intracellular [Na+], which increases the activity of the Na+/K+ pump (orange arrows). The bracket below each schematic indicates the NCX transport mode activated by the external solution changes in (C). Transport stoichiometries are not indicated. Abbreviations: Na+/Ca2+-exchanger (NCX), Na+/K+-ATPase (NKA), plasma membrane Ca2+-ATPase (PMCA), sarco-/endo-plasmic reticulum Ca2+-ATPase (SERCA), mitochondrial Ca2+ uniporter (MCU), mitochondrial Na+/Ca2+-exchanger (mNCX), endoplasmic reticulum (ER). (B) Representative fluorescence lifetime (LT) traces of Peredox (top trace) and RCaMP (bottom trace) from a DGC bathed in ACSF. Antidromic stimulation was delivered at the time point indicated by the arrow along the RCaMP trace, which transiently increases both NADHCYT and Ca2+CYT. (C) Fluorescence LT traces of Peredox (top) and RCaMP (bottom) from a DGC showing how external Na+ and Ca2+ changes affect NADHCYT and Ca2+CYT. The bars above the Peredox trace indicate the external [Na+] and [Ca2+]. NADHCYT was decreased by switching the bath solution from ACSF (147 mM Na+ and 2 mM Ca2+) to a solution with nominally 0 Na+ and 0 Ca2+ (cyan shading). Ca2+CYT was elevated by applying 0.5 mM Ca2+ with 0 Na+ to activate reverse NCX transport (magenta shading), and NADHCYT decreased further. NADHCYT was strongly increased after activating forward NCX transport by the subsequent removal of external Ca2+ and application of 147 mM Na+ (orange shading). (D) Box plots of the fluorescence LTs of Peredox (top) and RCaMP (bottom) showing the effects of the external Na+ and Ca2+ changes performed in panel C across many DGCs (n=53). The external bath conditions for each box plot are listed at the bottom of the RCaMP plot in chronological order from left to right. The colors of each box plot correspond to the colors indicated in (C). The mean Peredox LT values in each condition were: 1.63±0.06 ns in ACSF, 1.52±0.05 ns in 0 Na+ and 0 Ca2+, 1.46±0.09 ns in 0 Na and 0.5 mM Ca2+, and 1.72±0.06 ns in 147 mM Na+ and 0 Ca2+. The mean RCaMP LT values in each condition were: 0.88±0.05 ns in ACSF, 0.88±0.05 ns in 0 Na+ and 0 Ca2+, 1.52±0.15 ns in 0 Na+ and 0.5 mM Ca2+, and 0.93±0.07 ns in 147 mM Na+ and 0 Ca2+. (E) Changes to the Peredox LT relative to the 0 Na+ and 0 Ca2+ condition, after either a Ca2+CYT elevation from reverse NCX transport (Ca, black box, magenta filled diamonds), an influx of Na+ due to forward NCX transport (Na after Ca, black box, orange filled diamonds), or application of Na+ without forward NCX (Na no Ca, gray box, orange open diamonds). The mean Peredox LT changes were: –0.07±0.08 ns (n=53) for Ca2+CYT elevation, 0.20±0.05 ns (n=53) for Na+ influx via forward NCX, and 0.07364±0.04565 ns (n=19) for Na+ application without forward NCX. Statistical significance between ‘Ca’ and ‘Na after Ca’ is indicated by a paired Wilcoxon test and between ‘Na after Ca’ and ‘Na no Ca’ by a Mann-Whitney test. (F) Effect of external Na+ on the return of Ca2+CYT to baseline following a reverse NCX transport-mediated Ca2+ influx. The mean decay of the RCaMP LT following the Ca2+CYT increase (normalized to the peak RCaMP LT value) is shown when the external solution contained either 147 mM Na+ (solid line, orange SD shading, n=53) or 0 Na+ (dashed line, green SD shading, n=49). Decay data in 147 mM Na+ were from the same DGCs as in (D) and (E), while data in 0 Na+ were from the same DGCs as Figure 1—figure supplement 1B; a representative trace of this experiment is shown in Figure 1—figure supplement 1A.
Figure 1—figure supplement 1
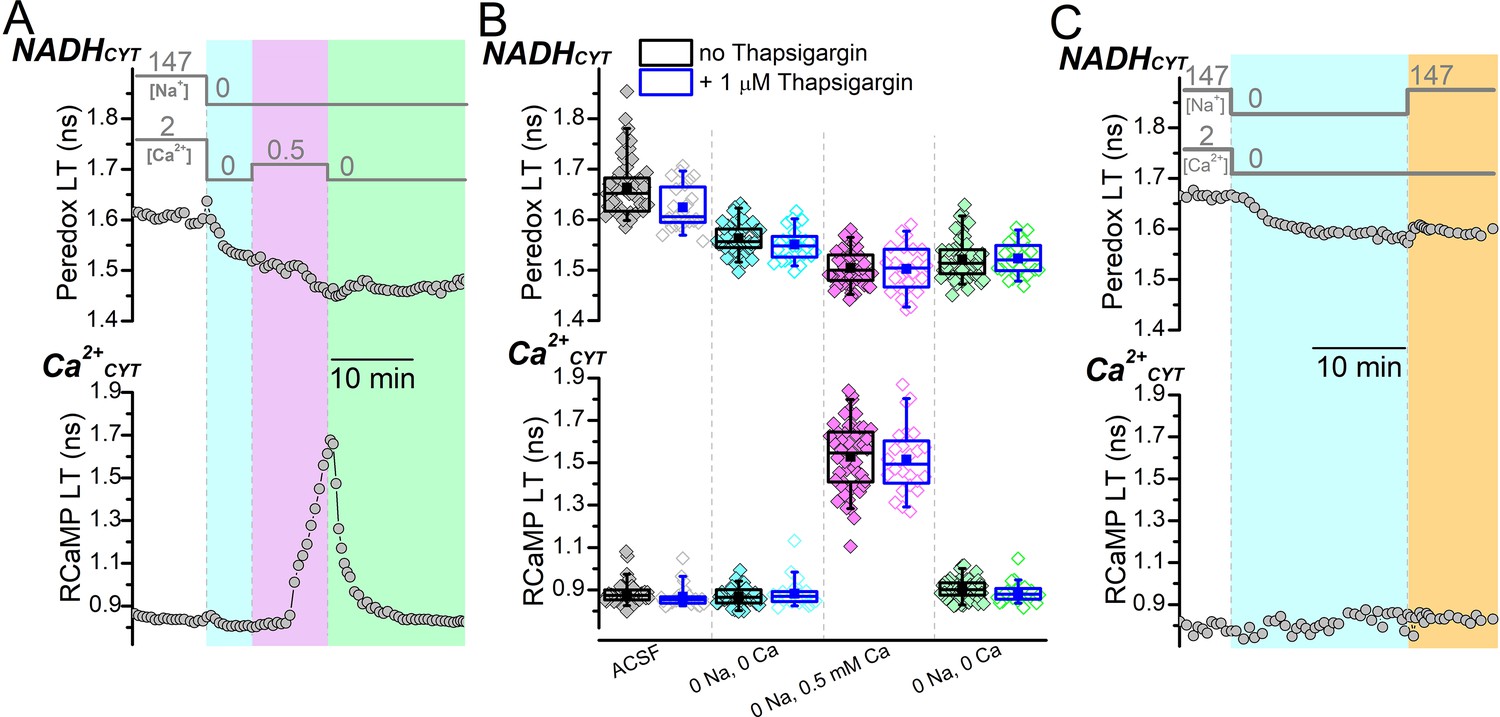
NADHCYT production does not increase following external Ca2+ removal if external Na+ is absent.
(A) Representative traces showing the effects of external [Na+] and [Ca2+] changes on Peredox (top) and RCaMP (bottom) lifetimes (LTs). The bars above the Peredox trace indicate the external [Na+] and [Ca2+]. After removing external Na+ and Ca2+ (cyan shading), Ca2+CYT was increased by applying 0.5 mM Ca2+ in 0 Na+ to stimulate reverse NCX transport (magenta shading). Following the Ca2+CYT increase, external Ca2+ was removed without re-addition of external Na+ (green shading) to follow the NADHCYT and Ca2+CYT levels without stimulating forward NCX transport. (B) Box plots of the fluorescence LTs of Peredox (top) and RCaMP (bottom) summarizing the effects of the external [Na+] and [Ca2+] changes performed in (A) across many DGCs. These experiments were performed either in the absence (black boxes, filled symbols, n=49) or presence of thapsigargin (blue boxes, open symbols, n=24). The external solution conditions for each box plot are listed at the bottom of the RCaMP plot in chronological order from left to right. The coloring of the data corresponds to the shading in (A). The mean Peredox and RCaMP LTs in each external condition are shown in Figure 1—figure supplement 1—source data 1. (C) Representative fluorescence LT traces of Peredox (top) and RCaMP (bottom) from a DGC showing the effect of external Na+ removal for 20 min (cyan shading) and re-addition (orange shading) in the absence of a Ca2+CYT increase on NADHCYT. The external [Na+] and [Ca2+] are indicated by bars above the Peredox trace.
-
Figure 1—figure supplement 1—source data 1
The mean Peredox and RCaMP lifetimes in each external condition for Figure 1—figure supplement 1B.
- https://cdn.elifesciences.org/articles/81645/elife-81645-fig1-figsupp1-data1-v2.zip
Figure 1—figure supplement 2
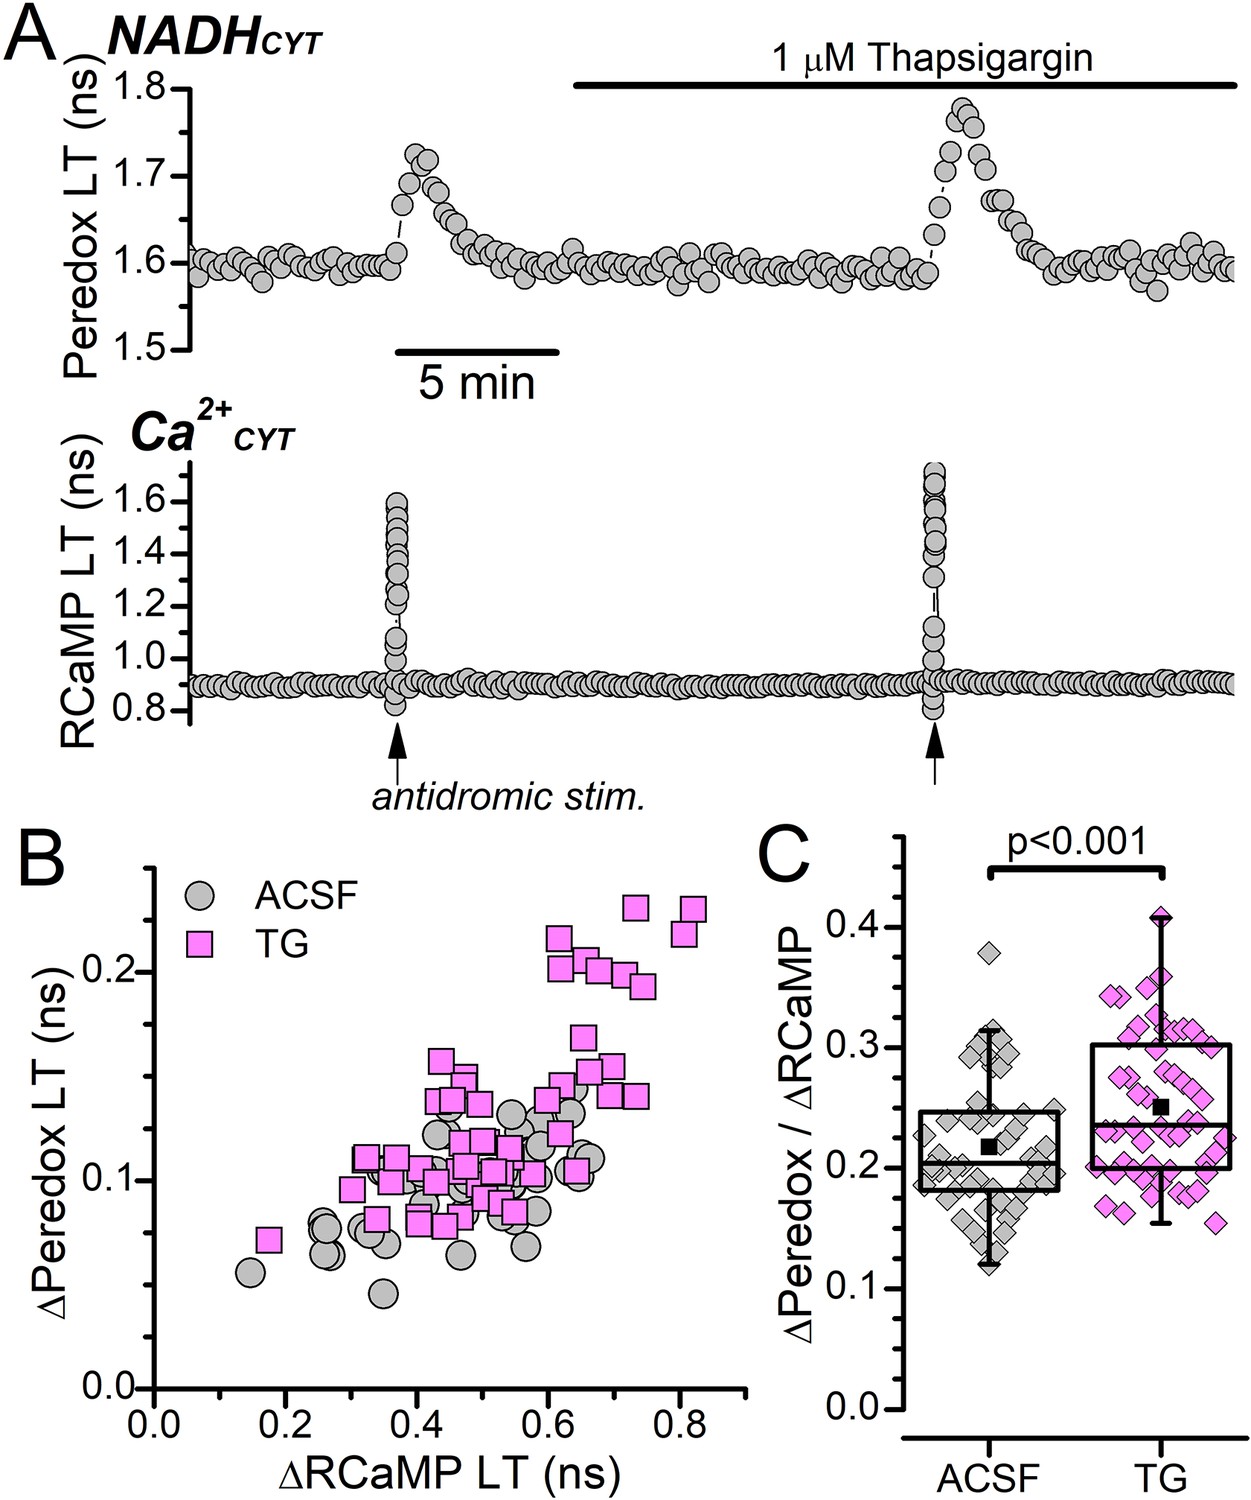
Effect of thapsigargin on antidromic stimulation-induced NADHCYT and Ca2+CYT transients.
(A) Representative fluorescence lifetime (LT) traces of Peredox (top) and RCaMP (bottom) from a DGC bathed in ACSF showing transient increases to NADHCYT and Ca2+CYT induced by antidromic stimulation before and after application of 1 μM thapsigargin. Antidromic stimulation events are indicated by arrows below the RCaMP trace. (B) Scatterplot of the antidromic stimulation-induced transient changes in Peredox LT (∆Peredox) and RCaMP LT (∆RCaMP) before (ACSF, gray circles) or in the presence of 1 μM thapsigargin (TG, magenta squares) across many DGCs (n=52). (C) Box plots showing the effect of thapsigargin (TG) on the ratio of ∆Peredox to ∆RCaMP from the same DGCs as (B). The mean ∆Peredox/∆RCaMP was: 0.22±0.05 in ACSF and 0.25±0.06 with 1 μM TG. Statistical significance of a paired sample t-test is indicated.
Figure 1—figure supplement 3
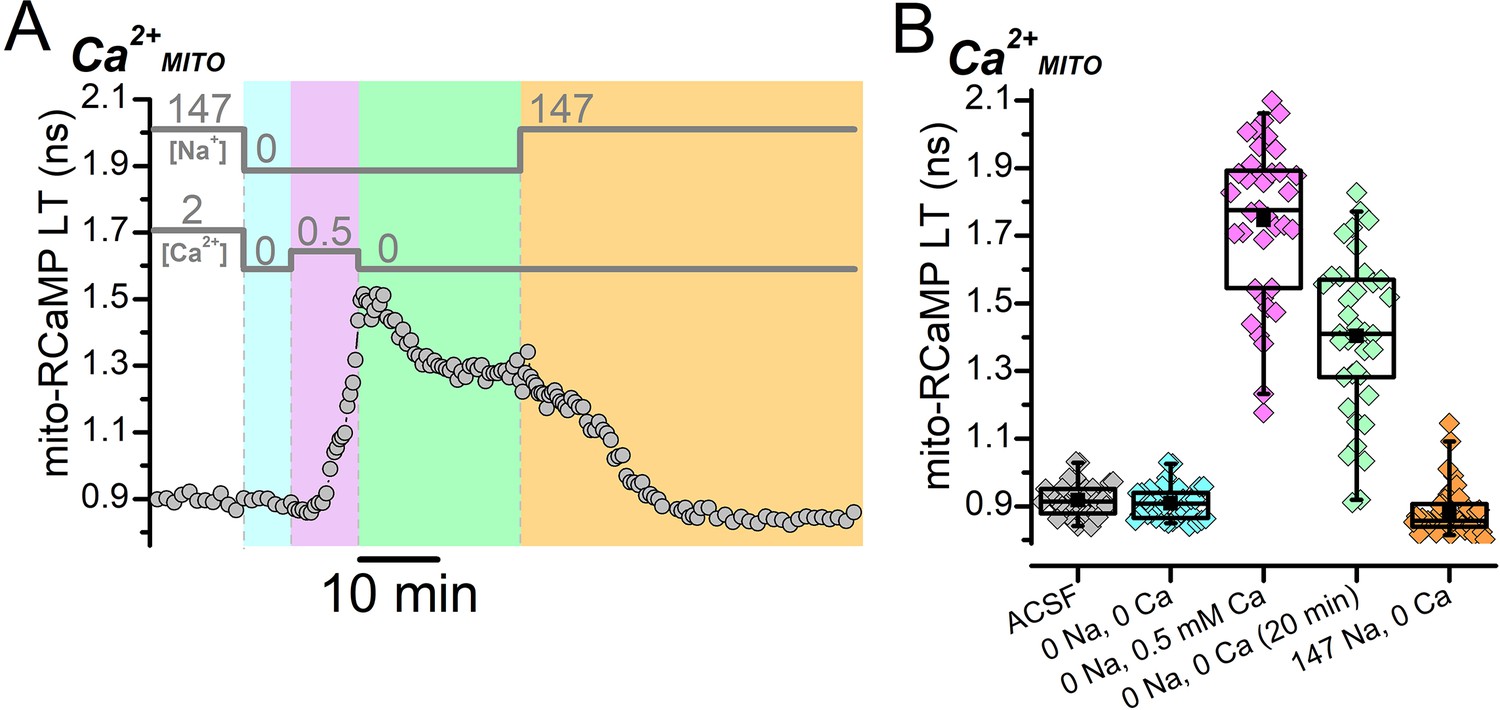
Ca2+ entry from reverse NCX transport increases Ca2+MITO, which depends on Na+ for removal.
(A) Representative fluorescence lifetime (LT) trace of mito-RCaMP from a DGC showing how Ca2+MITO is affected by changes to the external [Na+] or [Ca2+] (indicated by the bars above the trace). Following the removal of external Na+ and Ca2+ (cyan shading), addition of 0.5 mM Ca2+ in the absence of Na+ (magenta shading) to stimulate reverse NCX transport increased Ca2+MITO. The mito-RCaMP LT partially returned to baseline from the subsequent removal of external Ca2+ to turn off reverse NCX transport (green shading) but did not return completely to baseline until external Na+ was applied (orange shading). (B) Box plots showing the changes in mito-RCaMP LT induced by the external [Na+] or [Ca2+] changes performed in (A), across many DGCs (n=37). The external [Na+] and [Ca2+] conditions for each box plot are listed along the bottom in chronological order from left to right. The coloring of the data corresponds to the shading in (A). The LT values for the ‘0 Na, 0 Ca (20 min)’ condition (green symbols) were taken 20 min after removing 0.5 mM external Ca2+ in the absence of external Na+ (i.e., at the end of the green shading in A). The mean mito-RCaMP LT values in each condition are listed in Figure 1—figure supplement 3—source data 1.
-
Figure 1—figure supplement 3—source data 1
The mean Peredox and RCaMP lifetimes in each external condition for Figure 1—figure supplement 3B.
- https://cdn.elifesciences.org/articles/81645/elife-81645-fig1-figsupp3-data1-v2.zip
Figure 2
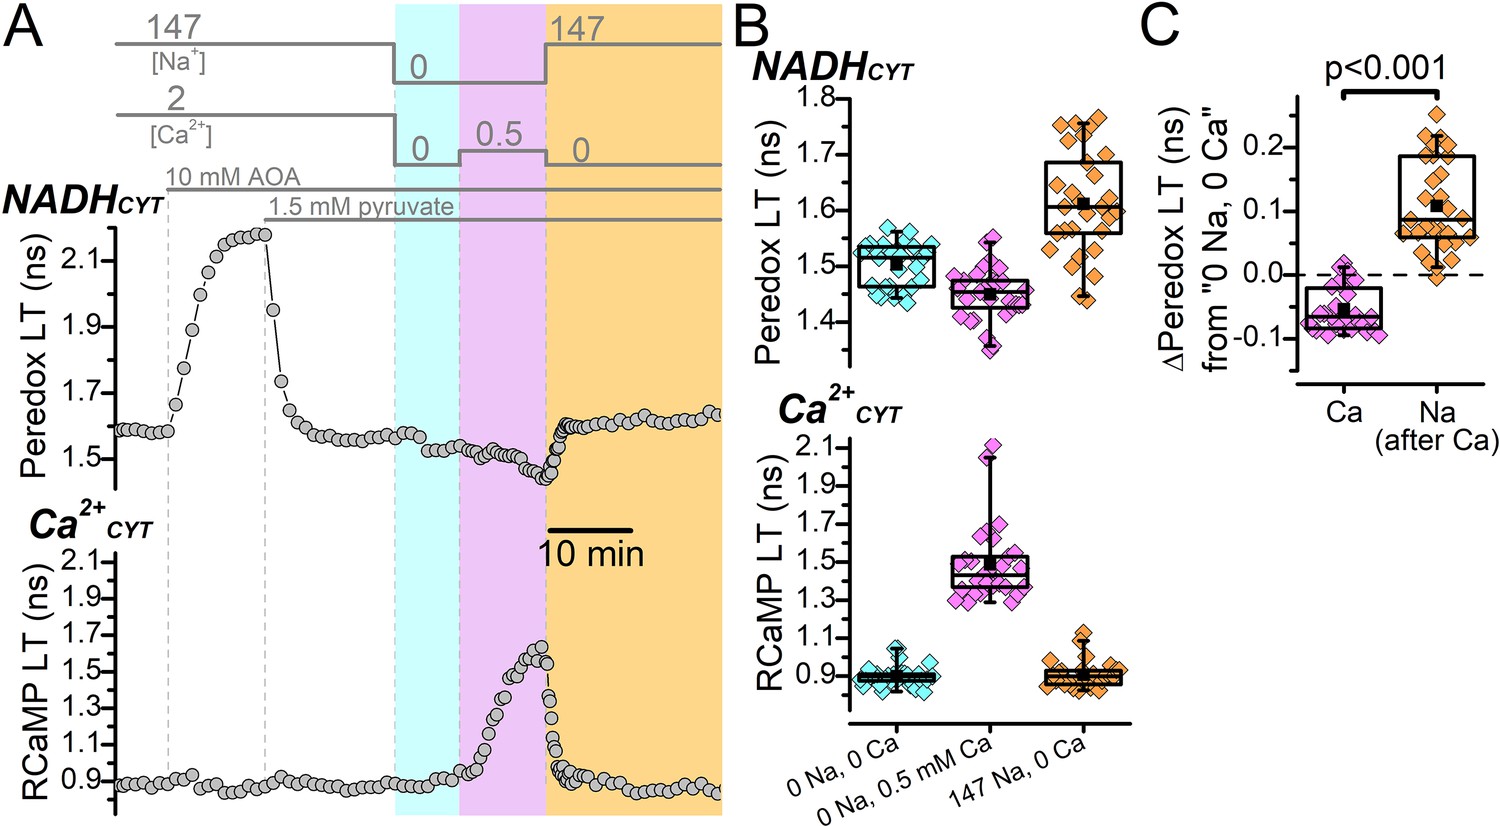
Malate-aspartate shuttle activity does not conceal a possible NADHCYT increase produced by elevated Ca2+CYT.
(A) Representative fluorescence lifetime (LT) traces of Peredox (top) and RCaMP (bottom) from a DGC. External solution changes are indicated by the bars above the Peredox trace. The recording begins in ACSF (147 mM Na+ and 2 mM Ca2+), where the addition of 10 mM AOA strongly increases the Peredox LT. Addition of 1.5 mM pyruvate reverted the Peredox LT approximately back to baseline. Following this, external Na+ and Ca2+ were removed (cyan shading), which slightly decreased the Peredox LT. The addition of 0.5 mM Ca2+ in 0 Na+ to stimulate reverse NCX transport increased the RCaMP LT and further decreased the Peredox LT (magenta shading). Subsequently, the removal of external Ca2+ and re-addition of external Na+ to stimulate forward NCX transport (orange shading) increased the Peredox LT and brought the RCaMP LT back to baseline. (B) Box plots of the Peredox (top) and RCaMP (bottom) fluorescence LTs in the different external solution conditions performed in (A), across many DGCs (n=29). The external [Na+] and [Ca2+] condition after applying AOA and pyruvate is listed across the bottom in chronological order from left to right. The coloring of the data corresponds to the shading in A. The mean Peredox and RCaMP LTs in each external condition were (in ns): 1.50±0.04 in 0 Na+ and 0 Ca2+, 1.45±0.05 in 0 Na+ and 0.5 mM Ca2+, and 1.61±0.09 in 147 Na+ and 0 Ca2+. The mean RCaMP LTs were (in ns): 0.90±0.06 in 0 Na+ and 0 Ca2+, 1.49±0.20 in 0 Na+ and 0.5 mM Ca2+, and 0.91±0.07 in 147 Na+ and 0 Ca2+. (C) Relative change to the Peredox fluorescence LT induced by the addition of 0.5 mM Ca2+ in the absence of external Na+ to stimulate reverse NCX transport (Ca) or 147 mM Na+ in the absence of external Ca2+ to stimulate forward NCX transport (Na). The data are from the same DGCs as in (B). The mean ∆Peredox values were: –0.05±0.04 ns for ‘Ca’ and 0.11±0.07 ns for ‘Na’. Statistical significance from a paired Wilcoxon test is indicated.
Figure 3 with 2 supplements
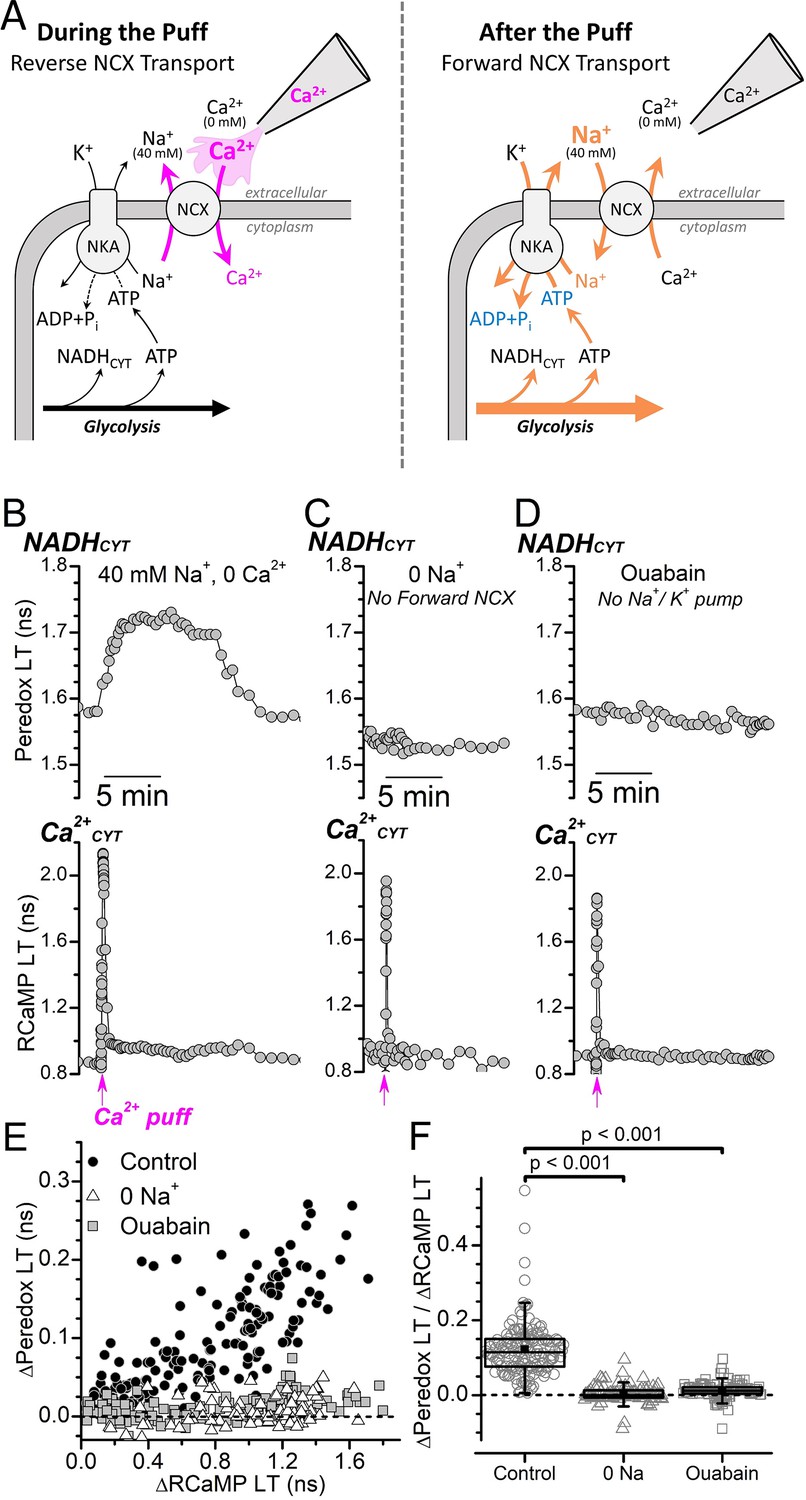
Ca2+CYT transients induced by external Ca2+ puffs only increase NADHCYT production when both forward NCX transport and Na+/K+ pump activity are intact.
(A) Cartoon depicting the expected effect of a local external Ca2+ puff on ion transport by the NCX and subsequent activation of the Na+/K+ pump. (Left) A pipette containing Ca2+ is placed near the soma of a DGC within a slice that is bathed in solution containing 40 mM Na+ and 0 Ca2+ solution. A brief pulse of positive pressure is applied to the pipette to transiently increase the local external [Ca2+] and stimulate reverse NCX transport (magenta arrows), leading to Ca2+ import and an increase to Ca2+CYT. (Right) In the aftermath of the puff, the local external [Ca2+] decreases as the small volume of puffed Ca2+ mixes with large volume of the 40 mM Na+ 0 Ca2+ bath solution, which leads to forward NCX transport that stimulates Na+ extrusion and an increase to Na+/K+ pump activity (orange arrows). Abbreviations: Na+/Ca2+-exchanger (NCX), Na+/K+-ATPase (NKA). (B–D) Representative fluorescence lifetime (LT) traces of Peredox (top traces) and RCaMP (bottom traces) from a DGC bathed in either 40 mM Na+ and 0 Ca2+ solution (B, Control), 0 Na+ and 0 Ca2+ to block forward NCX transport (C, 0 Na+), or in 40 mM Na+ and 0 Ca2+ with 5 mM ouabain to block the Na+/K+ pump (D, Ouabain). Puffs of Ca2+ were delivered at the timepoint indicated along the bottom of the RCaMP LT traces (magenta arrows). (E) Scatterplot of the Ca2+-puff-induced transient changes to the Peredox and RCaMP LTs of DGCs in 40 mM Na+ and 0 Ca2+ (Control, black circles, n=172), in 0 Na+ and 0 Ca2+ (0 Na+, white triangles, n=102), or in 40 mM Na+ and 0 Ca2+ with 5 mM ouabain (Ouabain, gray squares, n=114). The dashed line indicates where ∆Peredox=0. Analysis was restricted to recordings with transient RCaMP LT half-decay times <35 s. (F) Ratio of ∆Peredox to ∆RCaMP for the same Ca2+-puff-induced LT transients as in panel E, except excluding those recordings where the ∆RCaMP LT was <0.2 ns to avoid noisy ratio calculations due to small ∆RCaMP values. The dashed line indicates where ∆Peredox/∆RCaMP=0. The mean ∆Peredox/∆RCaMP in each condition was: 0.12±0.07 in 40 mM Na+ and 0 Ca2+ (Control, n=147), 0.01±0.02 in 0 Na+ and 0 Ca2+ (0 Na+, n=96), and 0.00±0.02 in 40 mM Na+ and 0 Ca2+ with 5 mM ouabain (Ouabain, n=99). Statistical significance from Mann-Whitney tests is indicated.
Figure 3—figure supplement 1
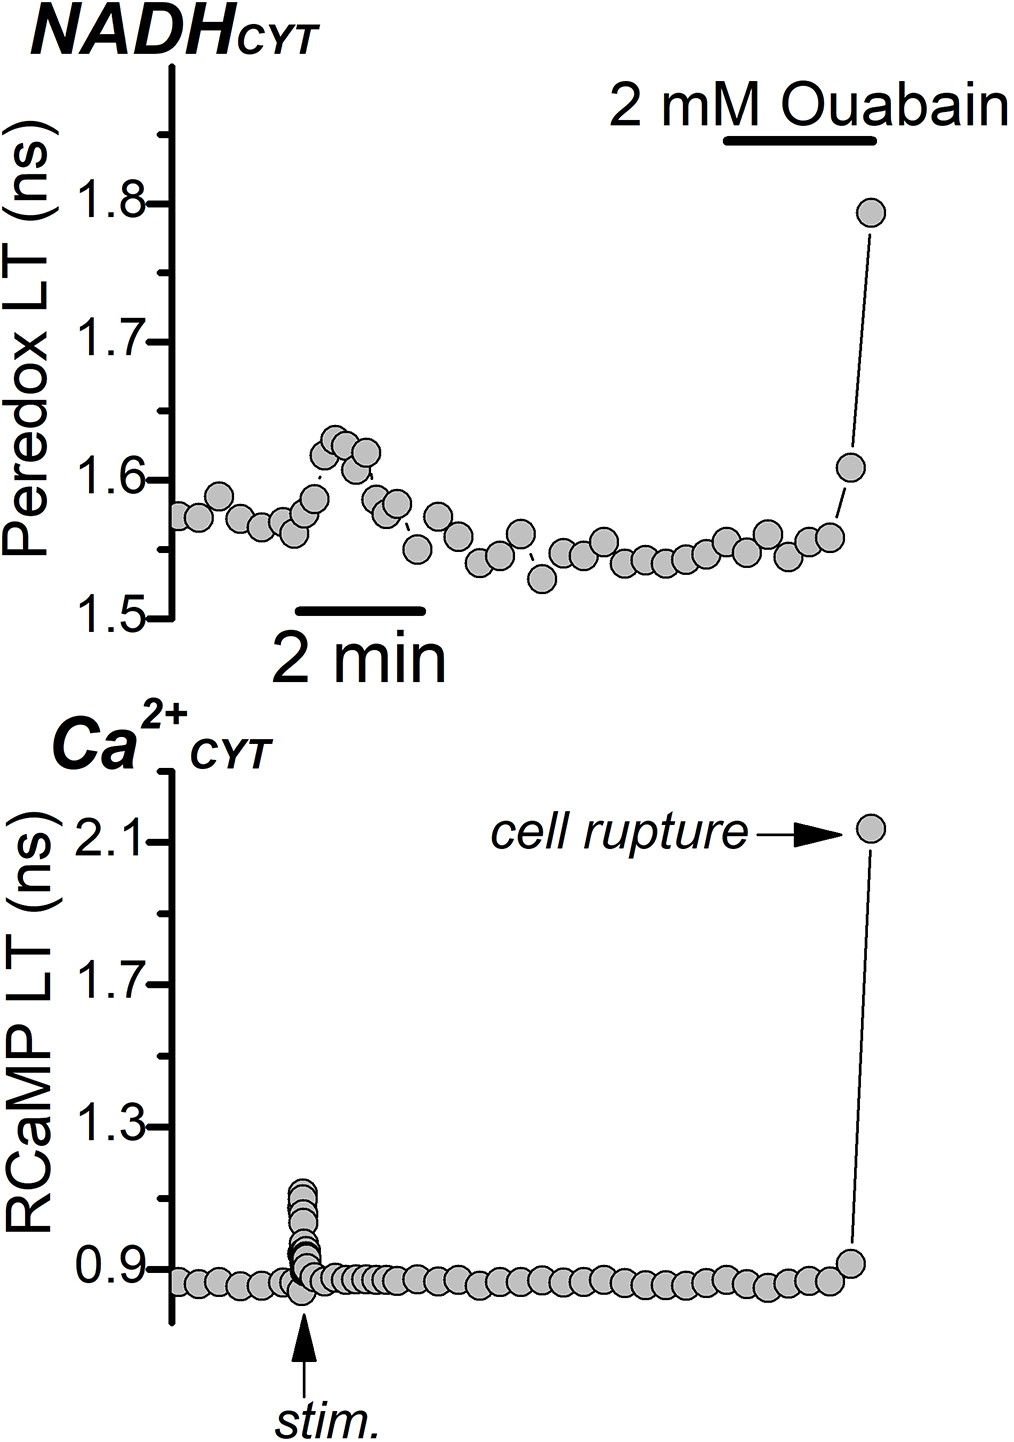
Complete Na+/K+ pump inhibition in ACSF leads to cell rupture.
Representative fluorescence lifetime traces of Peredox (top) and RCaMP (bottom) from a DGC bathed in ACSF. Synaptic stimulation of the afferent fibers in the absence of synaptic blockers (stim, indicated by the arrow at the bottom of the RCaMP trace) transiently increased Ca2+CYT and NADHCYT. Application of 2 mM ouabain irreversibly increased Ca2+CYT and ruptured the DGCs (cell rupture, arrow in the RCaMP trace).
Figure 3—figure supplement 2
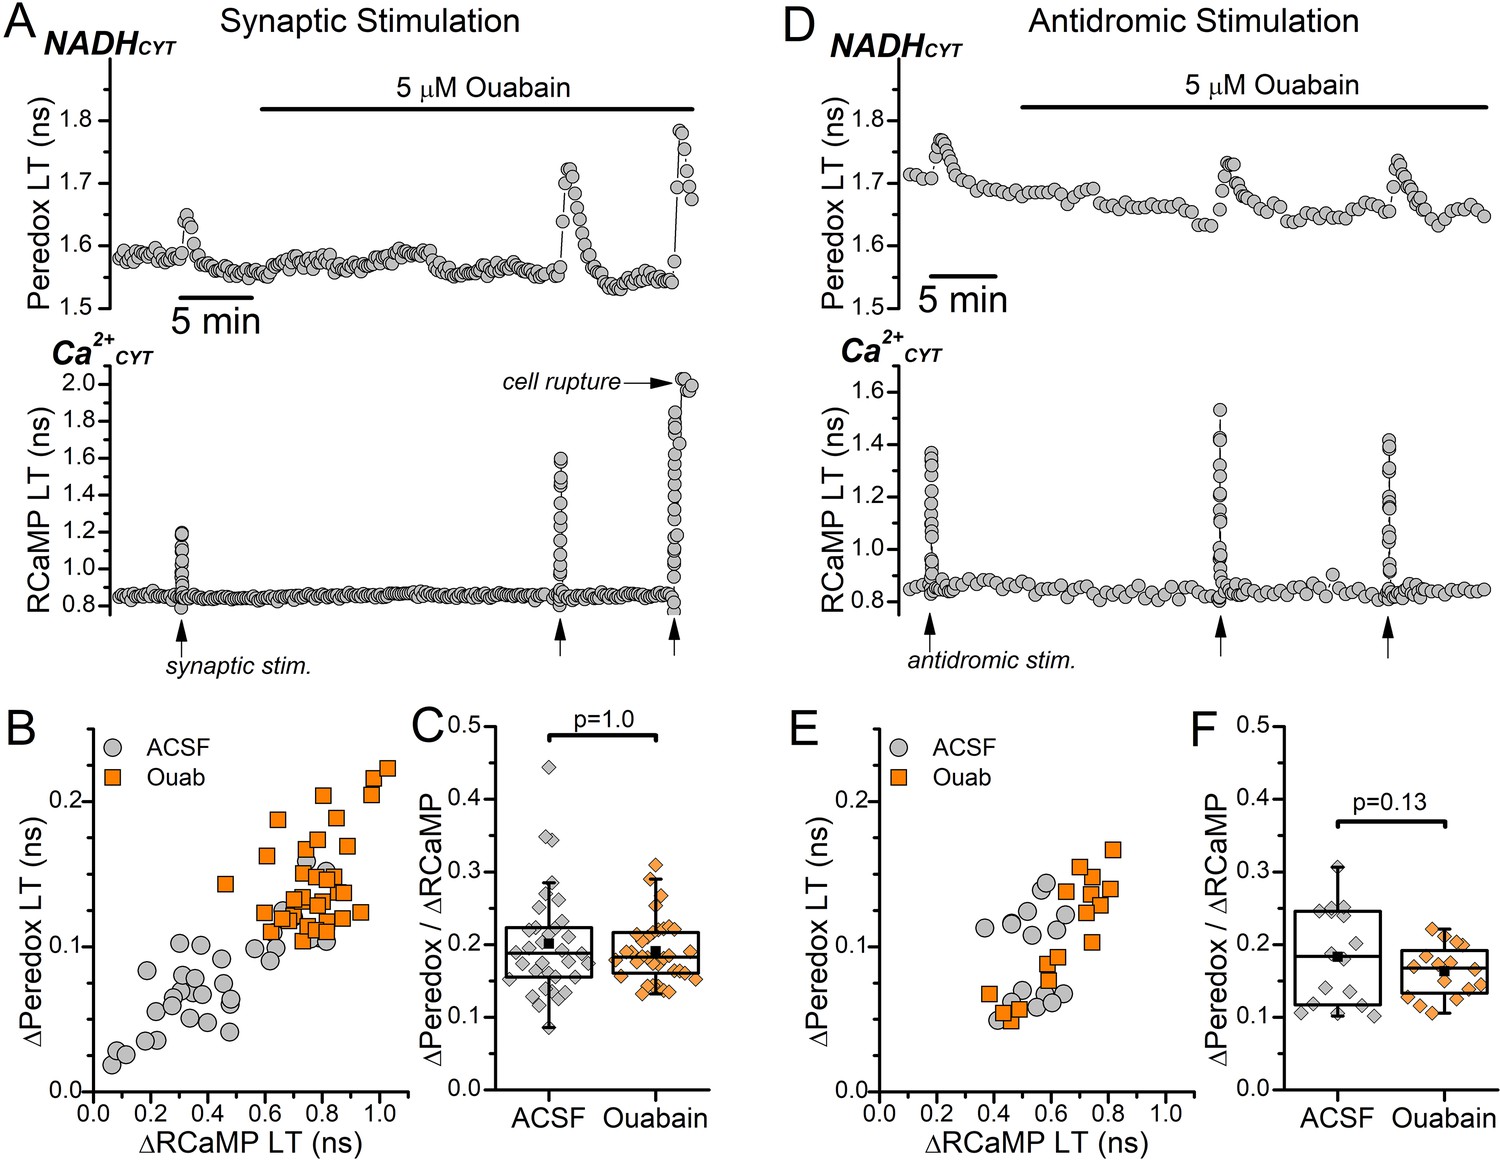
Effect of low dose (5 μM) ouabain on transient Peredox and RCaMP lifetime (LT) increases evoked by synaptic or antidromic stimulation.
(A–C) Effect of low dose ouabain on synaptic stimulation-induced transients in the absence of synaptic blockers. (A) Representative fluorescence LT traces of Peredox (top) and RCaMP (bottom) from a DGC bathed in ACSF. The DGC was stimulated synaptically with an electrode placed in the afferent fibers at the timepoints indicated by the arrows along the bottom of the RCaMP LT trace. Application of 5 μM ouabain is indicated by the bar above the Peredox trace. Repetitive synaptic stimulations in ouabain often ruptured the DGCs (cell rupture, arrow in the RCaMP trace). (B) Scatterplot of the transient Peredox and RCaMP LT increases (n=34) induced by synaptic stimulation in ACSF (ACSF, gray circles) and in 5 μM ouabain (Ouab, orange squares). (C) The ∆Peredox/∆RCaMP ratio from synaptic stimulations in ACSF and with 5 μM ouabain, calculated from the same DGCs as in (B). The mean ∆Peredox/∆RCaMP in each condition was: 0.20±0.07 in ACSF and 0.19±0.04 in ouabain. Statistical significance from a paired Wilcoxon test is indicated. (D–F) Effect of low dose ouabain on antidromic stimulation-induced transients. (D) Representative fluorescence LT traces of Peredox (top) and RCaMP (bottom) from a DGC bathed in ACSF with synaptic blockers. The DGC was stimulated antidromically at the timepoints indicated by the arrows along the bottom of the RCaMP trace. Application of 5 μM ouabain is indicated by the bar above the Peredox trace. (E) Scatterplot of the transient Peredox and RCaMP LT increases (n=16) induced by antidromic stimulation in ACSF with synaptic blockers (ACSF, gray circles) and with 5 μM ouabain (Ouab, orange squares). (F) The ∆Peredox/∆RCaMP ratio from antidromic stimulations in ACSF and in 5 μM ouabain, calculated from the same DGCs as in (E). The mean ∆Peredox/∆RCaMP in each condition was: 0.18±0.07 in ACSF with synaptic blockers and 0.16±0.04 in ouabain. Statistical significance from a paired sample t-test is indicated.
Figure 4 with 1 supplement

Antidromic stimulation-induced [Na+] transients depend strongly on Ca2+ entry.
(A) Cartoon depicting antidromic stimulation-induced Na+ and Ca2+ fluxes. Left, Control: Stimulation in ACSF triggers Na+ and Ca2+ influx through their respective voltage-gated Na+ and Ca2+ channels. Following the Ca2+CYT elevation, the NCX will import Na+ to drive Ca2+ extrusion. Both the Na+ influx through NaV and through the NCX contribute to the total intracellular [Na+] increase (blue arrows). Right, After CaV Block: Inhibiting Ca2+ influx through CaV (indicated by the red X) prevents Ca2+CYT elevation, which strongly reduces Na+ influx through the NCX. Abbreviations: voltage-gated Na+ channel (NaV), voltage-gated Ca2+ channel (CaV), Na+/Ca2+-exchanger (NCX). (B) Representative fluorescence traces showing antidromic stimulation-induced transient changes to SBFI ∆F/F (top) and RCaMP lifetime (LT) (bottom) from a DGC bathed in ACSF with synaptic blockers. The stimulation was delivered at the timepoint indicated by the arrow at the bottom of the RCaMP trace. The SBFI ∆F/F axis is inverted to illustrate an increase to [Na+] as an upward deflection. (C) Antidromic stimulation-induced transient changes to SBFI ∆F/F and RCaMP LT in the presence of 3 μM isradipine and 20 μM CdCl2 for the same DGC as in (B). The stimulation was delivered at the timepoint indicated by the arrow below the RCaMP trace. (D) Average, interpolated, antidromic stimulation-induced SBFI ∆F/F and RCaMP LT transients (n=13) before (ACSF, black trace and shading) and after CaV block (Israd+Cd2+, magenta trace and shading). The means are indicated by the solid line, SEM is indicated by the darker shading, and SD is indicated by the lighter shading. (E) Paired box plots showing the antidromic stimulation-induced peak transient SBFI ∆F/F amplitudes before (ACSF, black box) and after CaV block (Israd+Cd2+, magenta box) for the same DGCs as in (D). The mean peak SBFI ∆F/F values were: –0.29±0.07 in ACSF and –0.15±0.04 with Israd+Cd2+. Statistical significance from a paired sample t-test is indicated. (F) Paired box plots showing the ∆RCaMP LT before (ACSF, black box) after CaV block (Israd+Cd2+, magenta box) for the same DGCs as in (D) and (E). The mean ∆RCaMP LTs were: 0.30±0.13 ns in ACSF and 0.04±0.03 ns with Israd+Cd2+. Statistical significance from a paired sample t-test is indicated. (G) Scatterplot of antidromic stimulation-induced transient changes to SBFI ∆F/F against ∆RCaMP LT before (ACSF, gray circles) and after CaV block (Israd +Cd2+, magenta squares). Data are from the same DGCs as in (D–F).
Figure 4—figure supplement 1
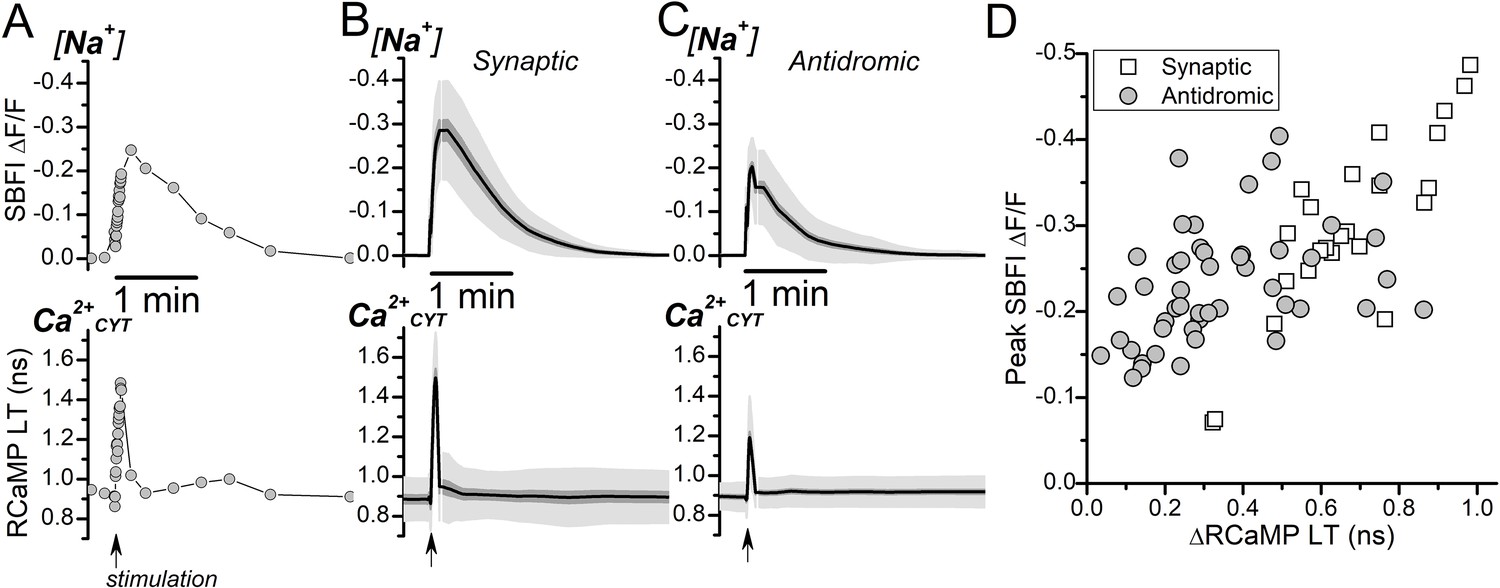
Somatic intracellular [Na+] and Ca2+CYT transients induced by synaptic or antidromic stimulation.
(A) Representative fluorescence traces of SBFI ∆F/F (top) and RCaMP lifetime (LT; bottom) from a DGC when stimulated synaptically in the absence of synaptic blockers (indicated by the arrow along the bottom of the RCaMP trace). The SBFI ∆F/F axis is inverted to illustrate an increase to intracellular [Na+] as an upward deflection. (B–C) Average, interpolated, transient changes to SBFI ∆F/F (top) and RCaMP LT (bottom) triggered by synaptic ((B), n=24) or antidromic ((C), n=48) stimulation. The stimulation was delivered at the time indicated by the arrow at the bottom of the RCaMP trace. The mean is shown as the solid line, SEM is the dark gray shading, and SD is the light gray shading. (D) Scatterplot of the peak transient SBFI ∆F/F against the transient ∆RCaMP LT in response to either synaptic stimulation (Synaptic, open squares) or antidromic stimulation (Antidromic, filled circles) from the same set of DGCs as in (B) and (C).
Tables
Key resources table
| Reagent type (species) or resource | Designation | Source or reference | Identifiers | Additional information |
|---|---|---|---|---|
| Strain, strain background (Mus musculus, M and F) | C57BL/6NCrl | Charles River | RRID:IMSR_CRL:27 | |
| Recombinant DNA reagent | AAV.CAG.Peredox.WPRE.SV40 | Mongeon et al., 2016 | Addgene #73807 | |
| Recombinant DNA reagent | AAV.hSyn.RCaMP1h.WPRE.SV40 | Akerboom et al., 2013 | ||
| Recombinant DNA reagent | AAV.hSyn.mito-RCaMP1h.WPRE.SV40 | Díaz-García et al., 2021a | ||
| Chemical compound, drug | Isradipine | Abcam | Cat: ab120142, CAS: 75695-93-1 | |
| Chemical compound, drug | NBQX (6-Nitro-7- sulfamoylbenzo [f]quinoxaline-2,3-dione, Disodium Salt) | Toronto Research Chemicals | Cat: N550005, CAS: 479347-86-9 | |
| Chemical compound, drug | D-AP5 (D-(-)–2-Amino- 5-phosphonopentanoic acid) | Abcam | Cat: ab120003, CAS: 79055-68-8 | |
| Chemical compound, drug | Picrotoxin | Sigma-Aldrich | Cat: P1675 CAS: 124-87-8 | |
| Chemical compound, drug | CdCl2 | Sigma-Aldrich | Cat: 202908, CAS: 10108-64-2 | |
| Chemical compound, drug | Poly-L-lysine | Sigma-Aldrich | Cat: P4832 | |
| Chemical compound, drug | Aminooxyacetate (O-(carboxymethyl)hydroxylamine hemihydrate) | Sigma-Aldrich | Cat: C13408 CAS: 2921-14-4 | |
| Chemical compound, drug | Pyruvic acid | Sigma-Aldrich | Cat: 107360, CAS: 127-17-3 | |
| Chemical compound, drug | Thapsigargin | Santa Cruz Biotechnology | Cat: sc-24017A, CAS: 67526-95-8 | |
| Chemical compound, drug | Ouabain | Sigma-Aldrich | Cat: O3125, CAS: 11018-89-6 | |
| Chemical compound, drug | SBFI K+ salt (fluorescent dye) | Ion Biosciences | Cat: 2022B | |
| Other | Glass capillaries, Borosilicate, standard wall, no filament, 4 in., O.D. 1.5 mm | WPI | Cat: 1B150-4 | For microelectrodes and pipettes |
| Other | Glass coverslips, 12 mm circle No.1 | VWR | Cat: 48366–251 | For brain slice handling |
Additional files
Download links
A two-part list of links to download the article, or parts of the article, in various formats.
Downloads (link to download the article as PDF)
Open citations (links to open the citations from this article in various online reference manager services)
Cite this article (links to download the citations from this article in formats compatible with various reference manager tools)
The Na+/K+ pump dominates control of glycolysis in hippocampal dentate granule cells
eLife 11:e81645.
https://doi.org/10.7554/eLife.81645


