Discovery of runs-of-homozygosity diplotype clusters and their associations with diseases in UK Biobank
- Department of Computer Science, University of Central Florida, United States
- Center for Precision Health, School of Biomedical Informatics, The University of Texas Health Science Center at Houston, United States
Figures
Figure 1 with 3 supplements
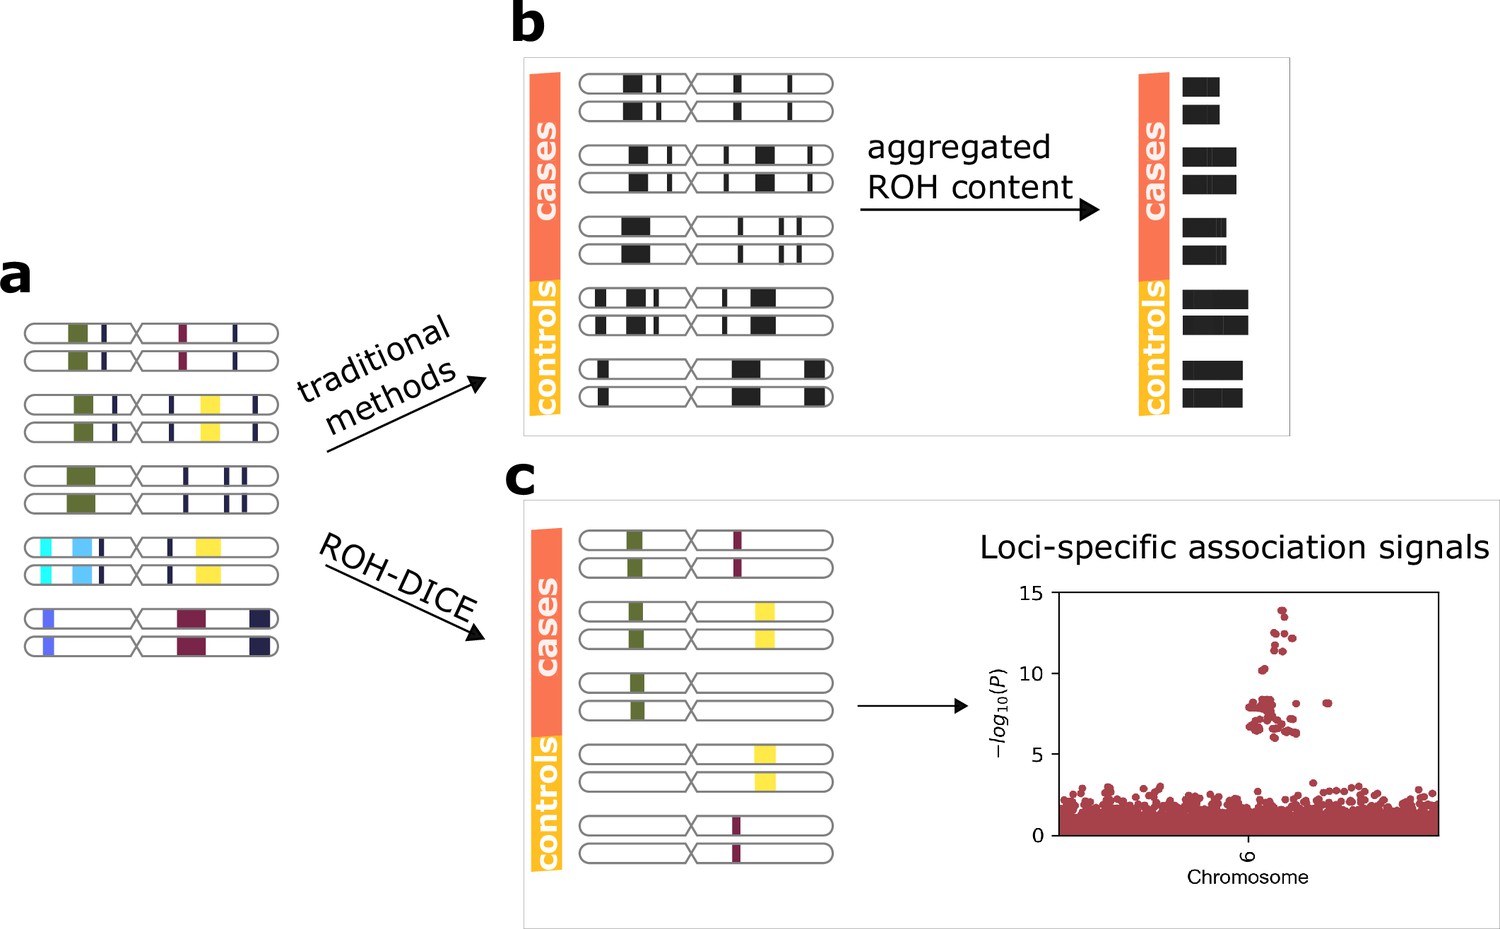
Runs-of-homozygosity (ROH)-DICE enables the discovery of loci-specific association signals of ROH diplotypes.
The actual ROH contents (a) including the locations and sequence identities of ROH (indicated by different colors) were lost in traditional ROH analysis pipelines (b) which aggregate the ROH contents per individual and lose the chances for identifying associating loci. ROH-DICE (c) reveals ROH diplotype clusters that are long and wide enough, thus enabling mapping loci associated with phenotypes.
Figure 1—figure supplement 1
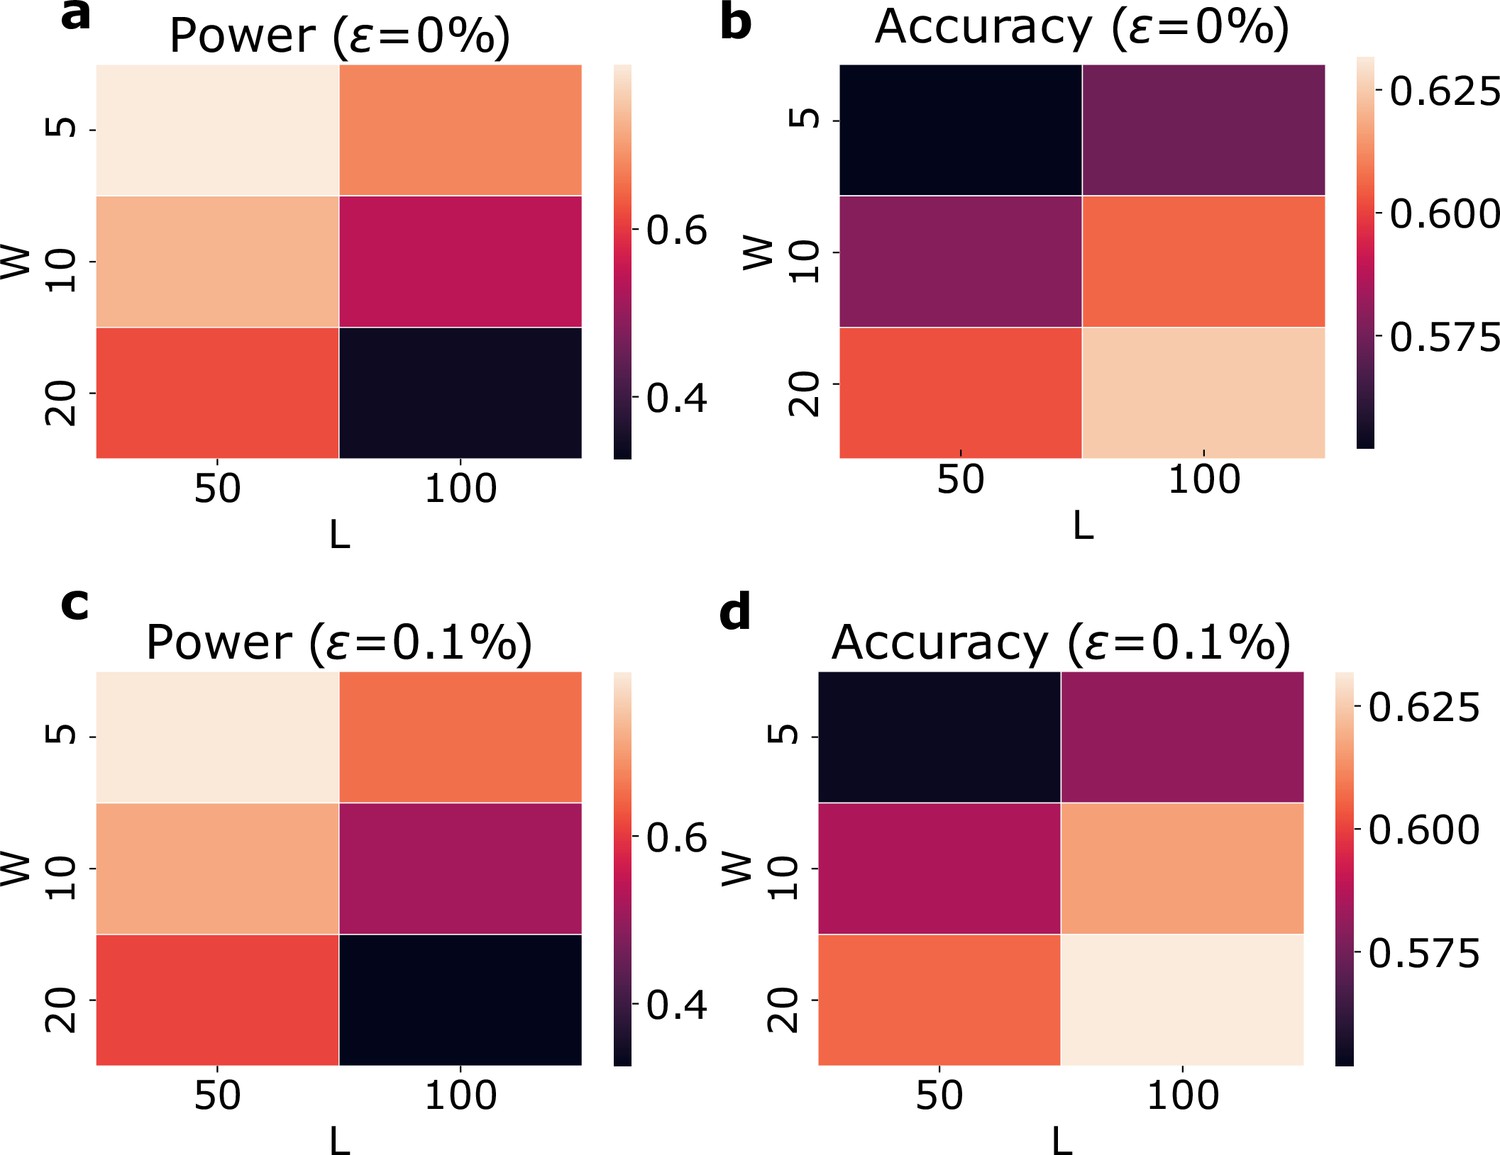
Evaluation of runs-of-homozygosity (ROH) clusters using simulated genotype data with and without genotyping errors.
(a) and (b) show the detection power and accuracy using different L and W values without genotype errors. (c) and (d) show the detection power and accuracy with a genotyping error rate of 0.1% using different L and W values.
Figure 1—figure supplement 2
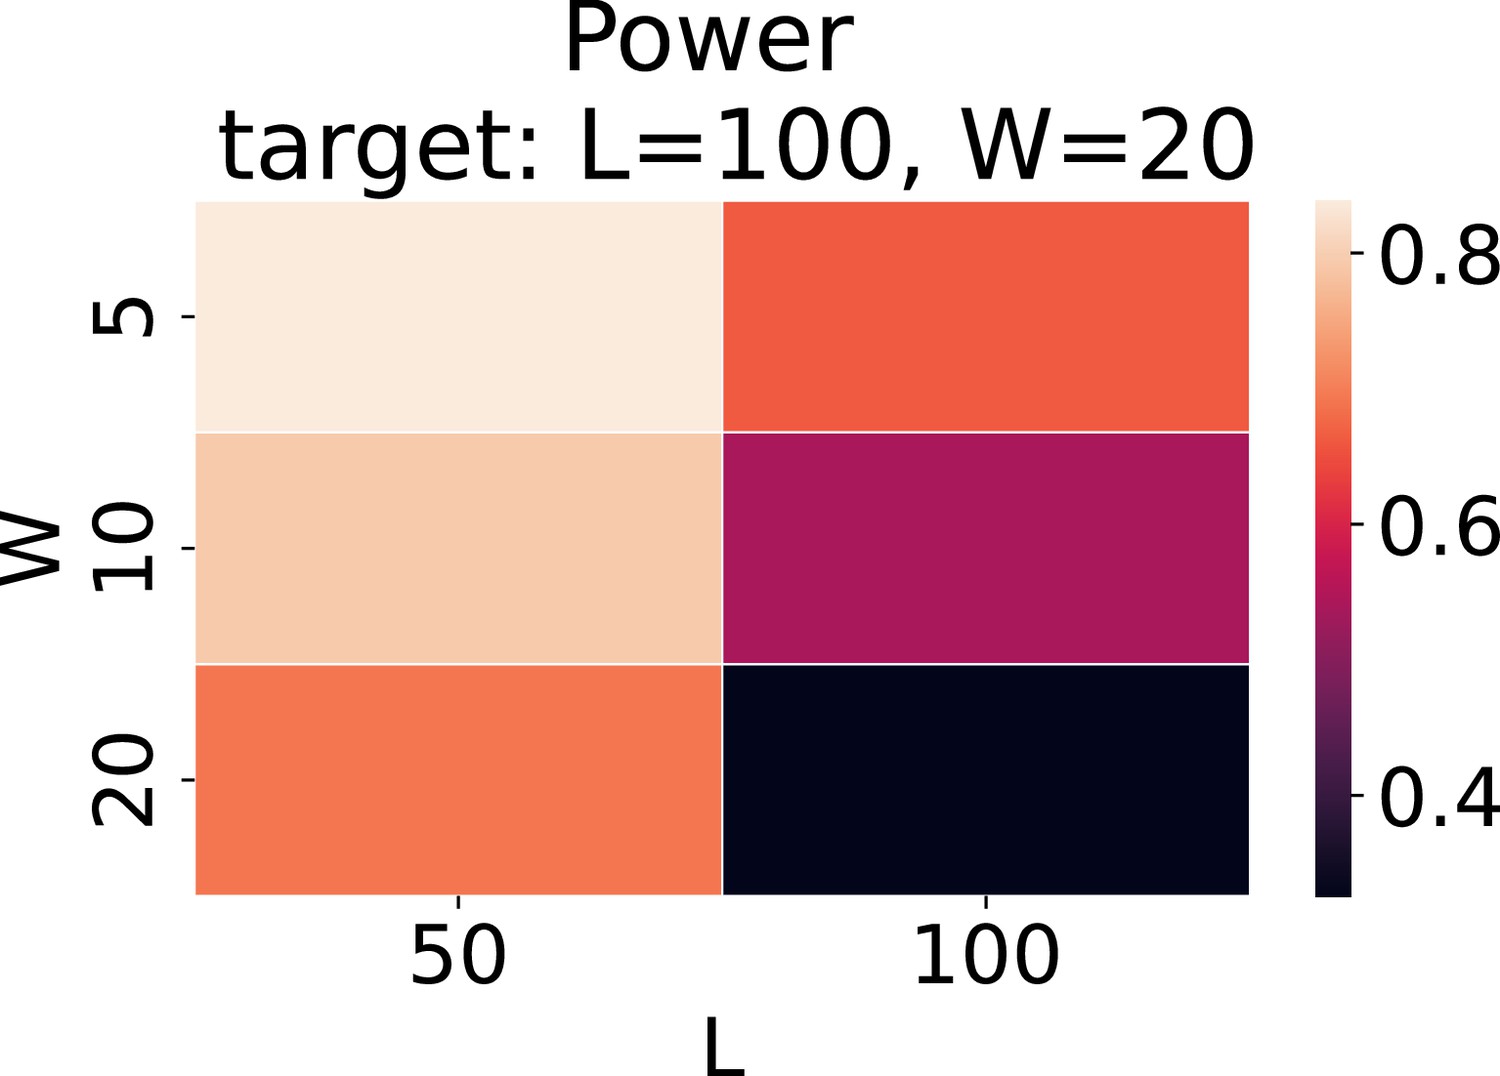
Evaluation of runs-of-homozygosity (ROH) clusters using different cut-off values for the same target length (L) and width (W).
The target was set to L = 100 and W = 20. Various length and width values were used as cut-offs.
Figure 1—figure supplement 3
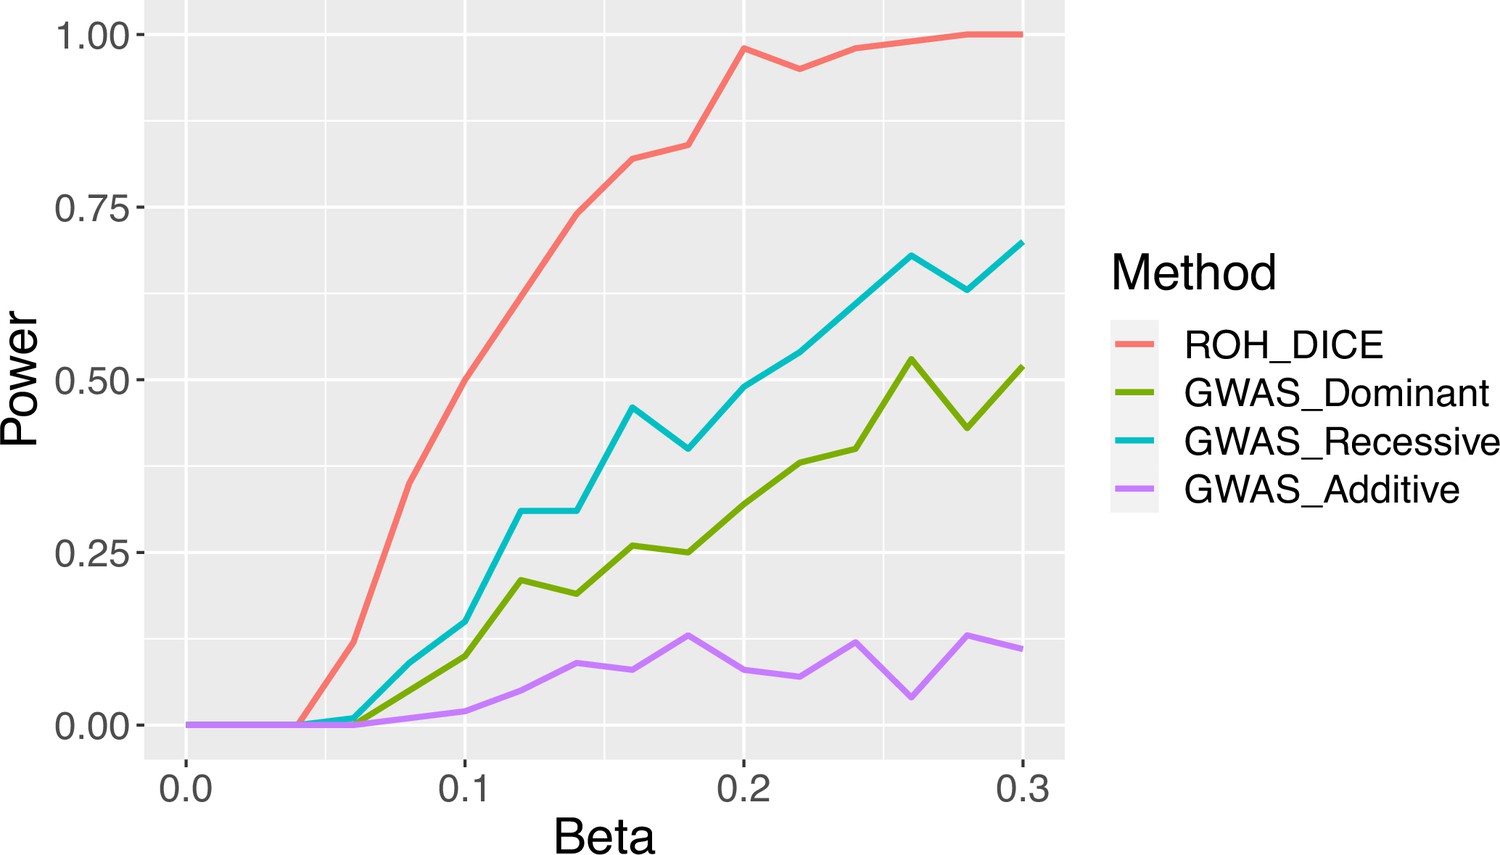
Power of runs-of-homozygosity (ROH)-DICE vs traditional genome-wide association studies (GWAS) for finding associations between phenotypes and ROH clusters using 200 samples with 10 Mbps and 100 consecutive causal variant sites.
Figure 2
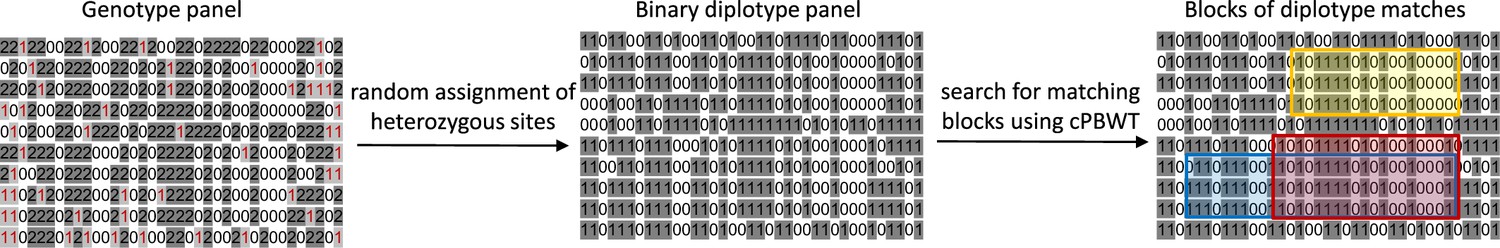
A simple schematic of searching for runs-of-homozygosity (ROH) diplotype clusters in a genotype panel.
The input is a genotype panel where each line represents an individual. The heterozygous sites are depicted in violet in the genotype panel. Input genotype data are converted into a binarized genotype panel where homozygous sites are preserved. The matching blocks (clusters) are searched using consensus PBWT (cPBWT). A matching block is defined by a minimum number of sites, individuals, and also an objective function. The objective can be either maximizing the number of individuals or maximizing the number of sites. The clusters of matches are highlighted in different colors. Red represents a cluster with the maximized number of individuals and blue represents a cluster with the maximized number of sites.
Figure 3 with 1 supplement
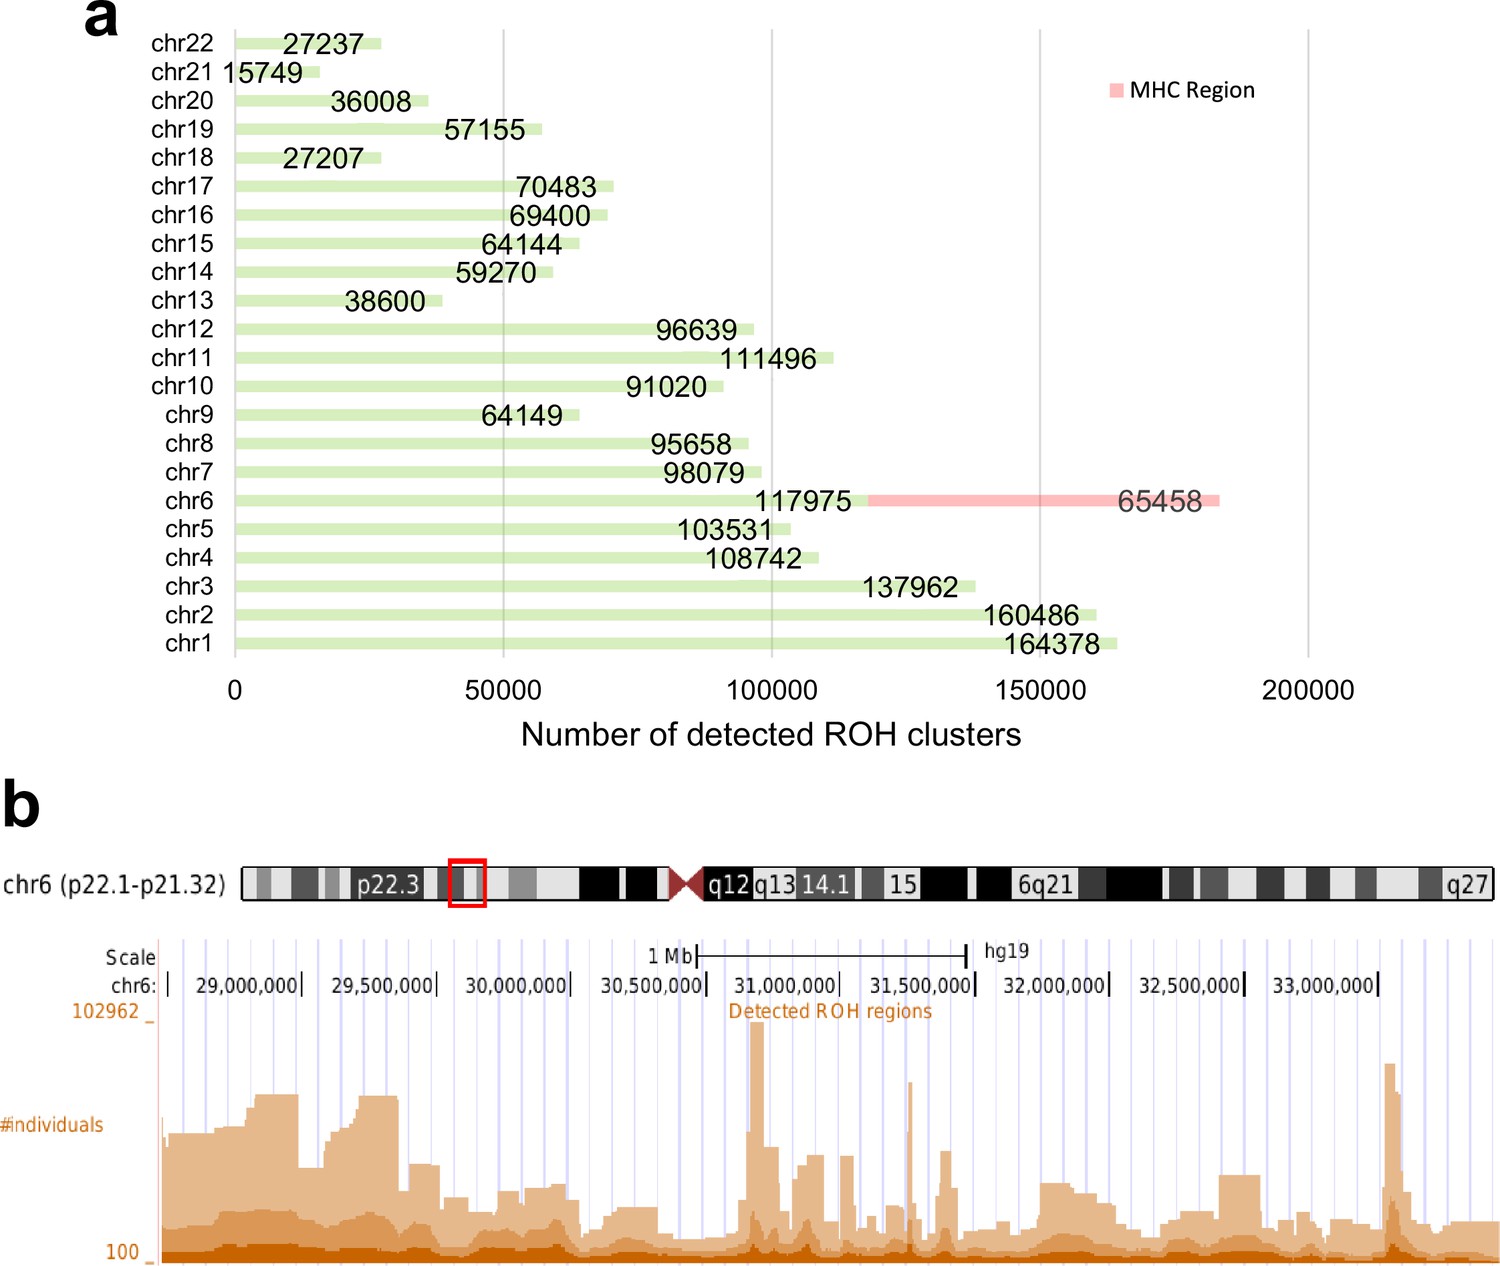
Total number of detected runs-of-homozygosity (ROH) diplotype clusters in each autosomal chromosome (a) and the detected ROH clusters in the major histocompatibility complex (MHC) region (chr6:28477797–33448354) (b) in hg19.
Some regions may contain multiple overlapping clusters comprising different sets of individuals. The minimum length of the ROH regions was set to 100 sites and the minimum number of individuals to 100.
Figure 3—figure supplement 1
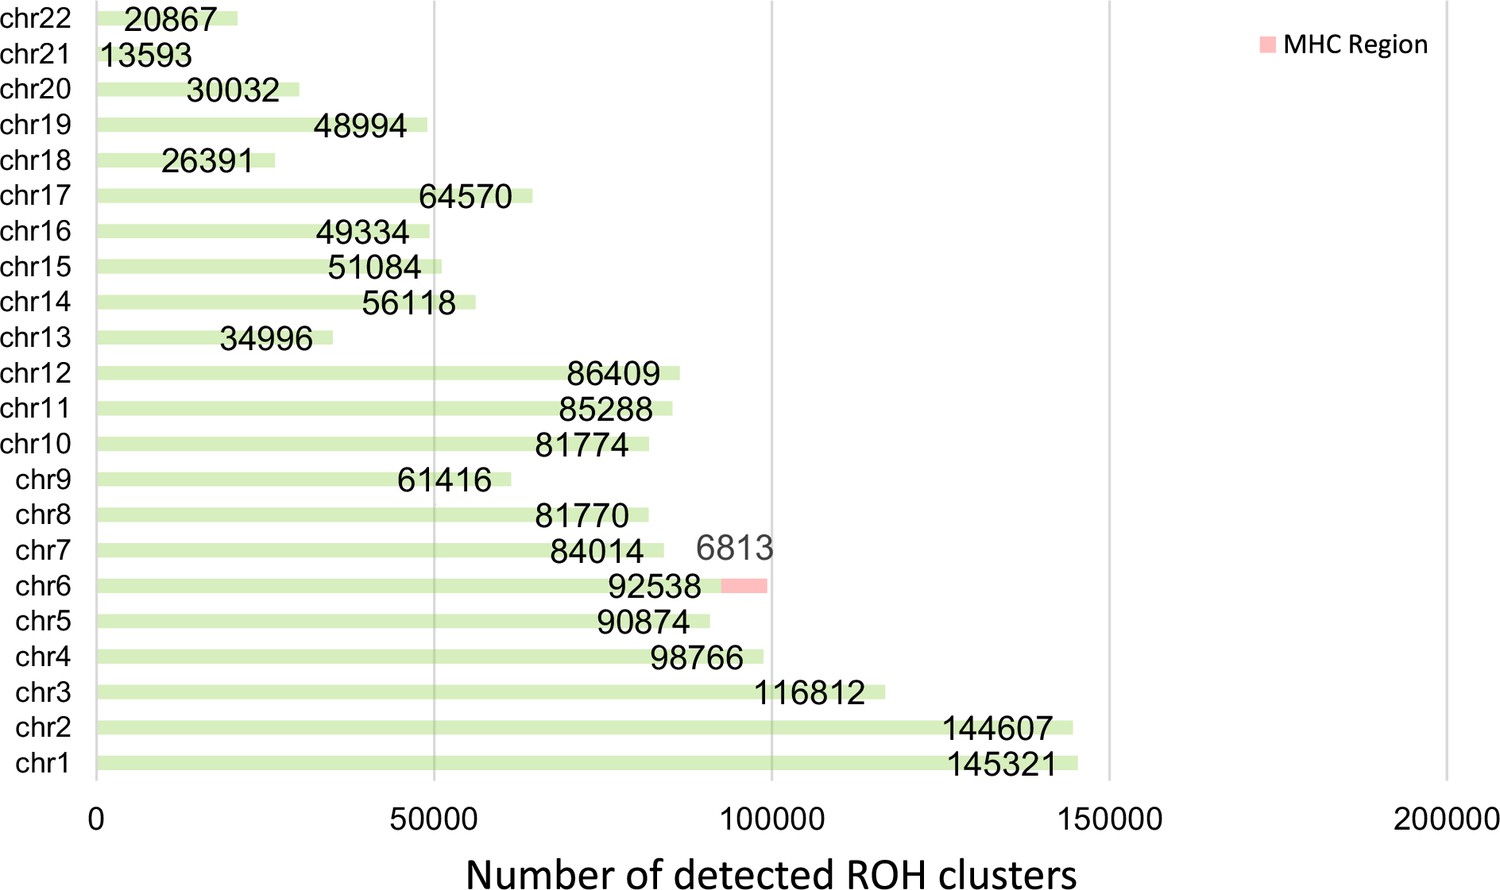
Total number of detected runs-of-homozygosity (ROH) diplotype clusters in each autosomal chromosome in UK Biobank with a minimum length (L) of 100 sites, a minimum genetic length of 0.1 cM, and a minimum width (W) of 100 samples.
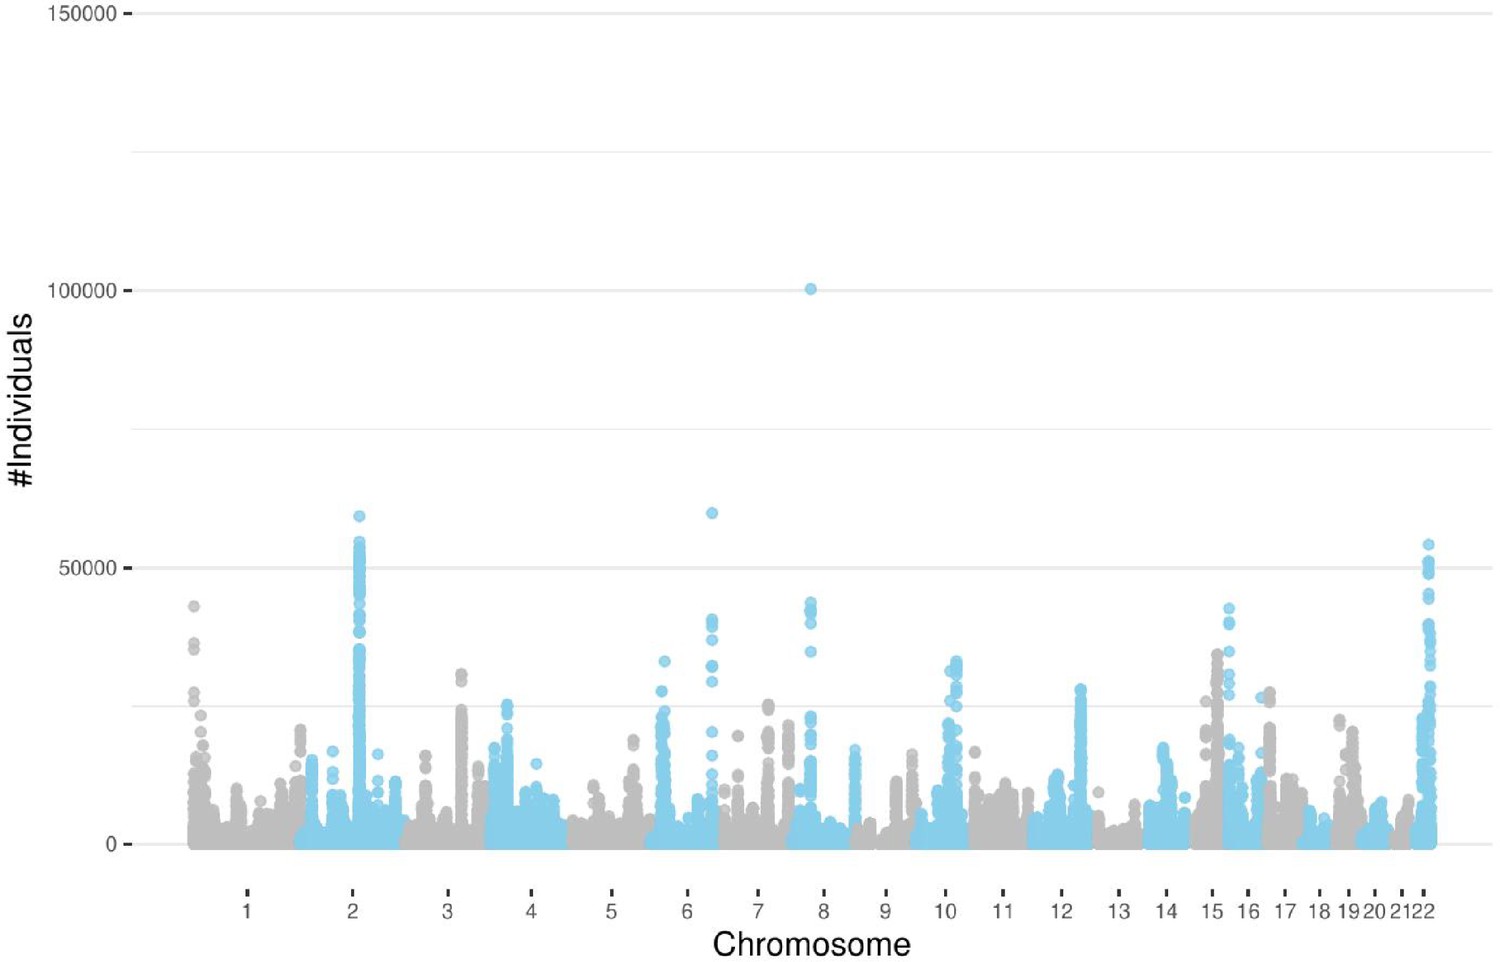
Figure 4 with 1 supplement
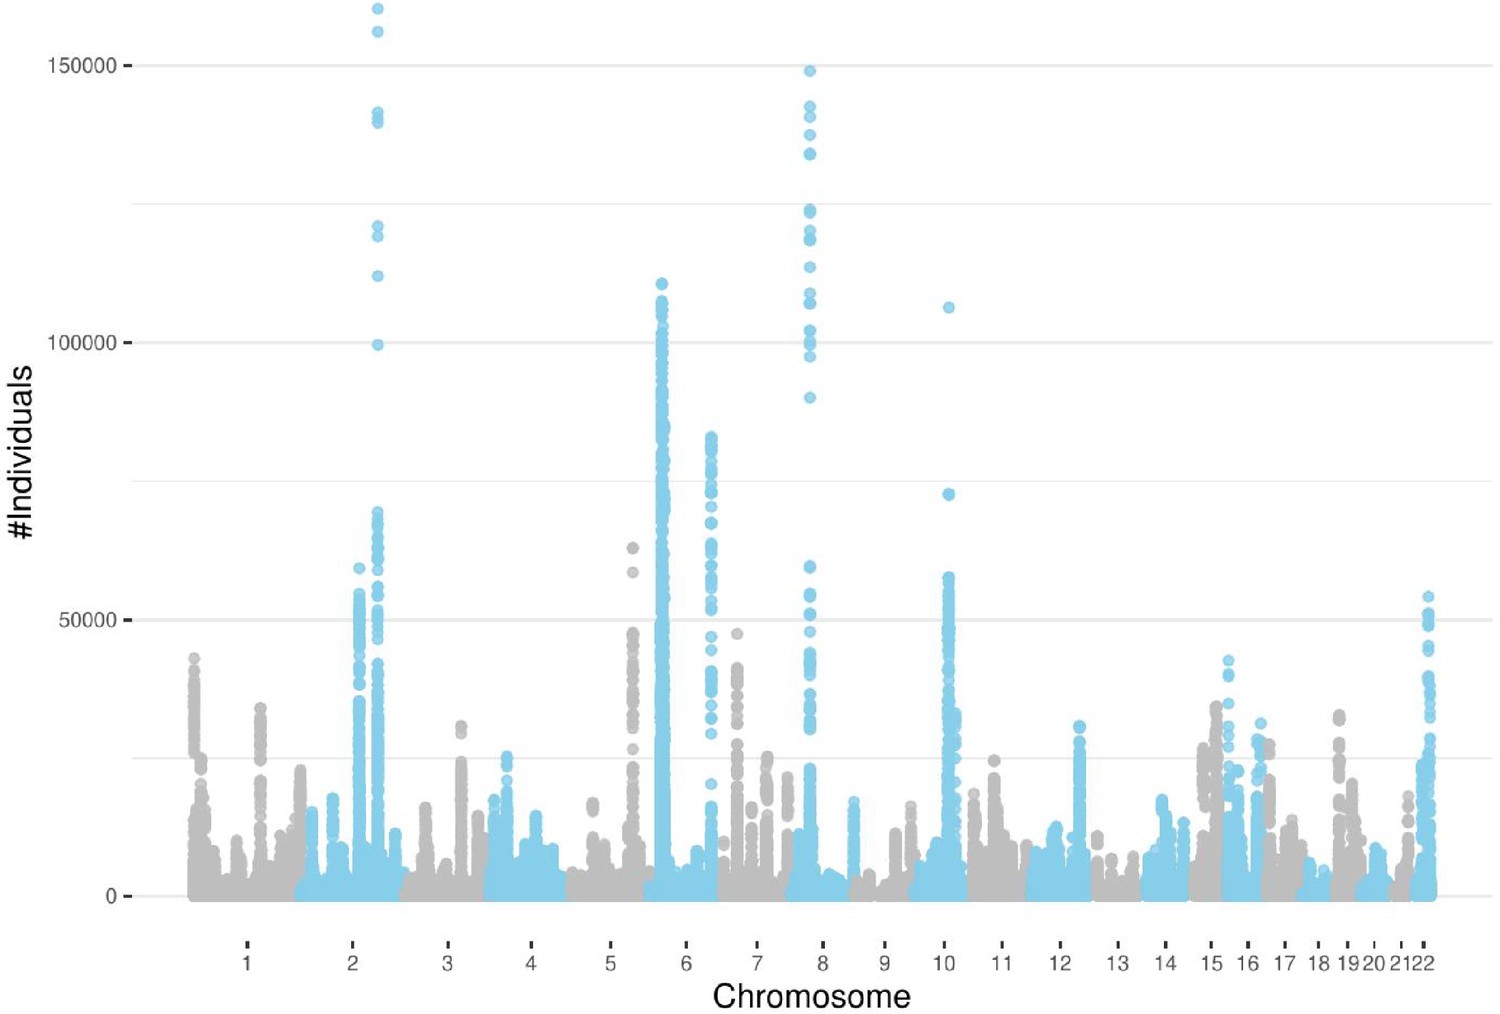
Detected runs-of-homozygosity (ROH) diplotype clusters with at least 100 individuals sharing the same consensus with a minimum number of 100 SNPs.
Chromosome 18 has the lowest peak for individuals sharing an ROH diplotype. Chromosomes 2, 6, and 8 contain diplotypes shared with more than 100,000 individuals.
Figure 4—figure supplement 1
The number of individuals sharing the same runs-of-homozygosity (ROH) consensus with a minimum number of 100 SNPs after filtering out segments shorter than 0.1 cM.
Figure 5
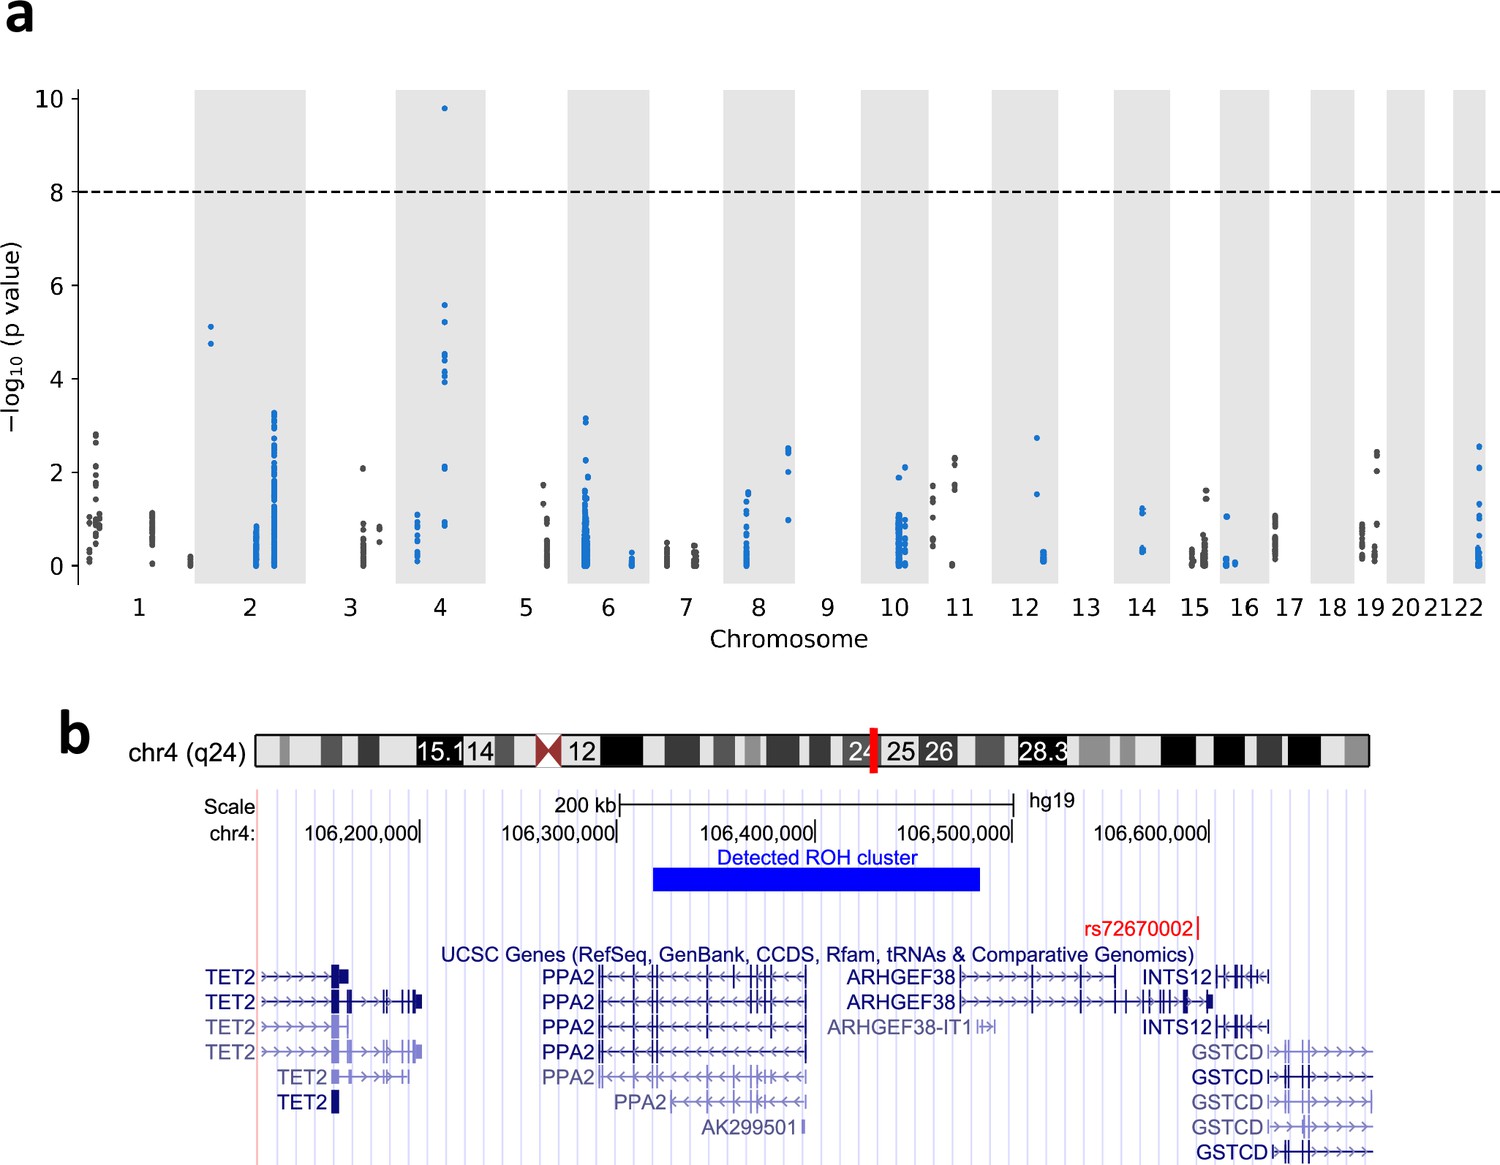
Runs-of-homozygosity (ROH) associations between ROH diplotypes and mortality of COVID-19.
(a) Manhattan plot of ROH diplotypes across all chromosomes and mortality of COVID-19. Diplotypes with less than 10 cases were discarded. (b) UCSC genome browser (https://genome.ucsc.edu) view of the region containing the diplotype with a significant p-value in chromosome 4.
Figure 6

Consensuses of haplotype matches with a minimum length (L) of 3 and a minimum width (W) of 3.
(a) Clusters of haplotypes with two different objectives: maximizing the number of sites and maximizing the number of indivdiuals. The green rectangle ending at site 4 highlights a cluster that meets the requirement of W ≥ 3 and L ≥ 3 while maximizing the number of individuals (width-maximal). The blue rectangles ending at 4 maximize the number of sites (length-maximal). The blue rectangles ending at site 8 show a cluster with W ≥ 3 and L ≥ 3 maximizing the number of sites and number of individuals. This cluster is length-maximal because adding either column 5 or 9 will introduce a mismatch; It is also width-maximal because adding the third haplotype will introduce a mismatch. (b) Two clusters (clusters A and B) with the same starting and ending positions but different consensuses. Therefore, these two clusters are not merged and considered as separate clusters. Each line represents one individual and 0/0 alleles are highlighted in gray, and 1/1 alleles in black.
Tables
Table 1
Clusters of the runs-of-homozygosity (ROH) diplotypes with the lowest p-values in the HLA region for self-reported diseases using the British population in UK Biobank.
Detailed diplotype consensus sequences are available in Supplementary file 5. The p-values were calculated using PHESANT. Only the region with the lowest p-value has been included for each disease. Beta represents the effect size reported by PHESANT and D′ describes the non-random association of an ROH cluster and the overlapping SNP.
| Disease (binary trait) | Diplotype ID | Position (on chr6) | p-value | Beta | Carrier frequency (%) | Odds ratio | Genetic length (cM) | GWAS p-value* | GWAS beta* | GWAS lead SNP* | D′ |
|---|---|---|---|---|---|---|---|---|---|---|---|
| Ankylosing spondylitis | 1 | 31431031–31464050 | 4.62 × 10⁻³⁴ | 0.121 | 0.29 | 8.66 | 0.071198 | 0 | 1.45 × 10⁻² | rs113340460 | 0.61 |
| Hemochromatosis | 2 | 25969631–26108168 | 8.02 × 10−120 | 0.417 | 0.09 | 24.51 | 0.011597 | - | - | - | - |
| Malabsorption/coeliac disease | 3 | 32564985–32629755 | 3.41 × 10−259 | 0.315 | 4.12 | 1.64 | 0.005408 | 0 | 7.74 × 10⁻³ | rs9271352 | 1 |
| Multiple sclerosis | 4 | 32410215–32554129 | 4.36 × 10−45 | 0.192 | 0.37 | 3.79 | 0.012736 | 1.05 × 10−107 | 4.58 × 10⁻³ | rs9268925 | 0.99 |
| Polymyalgia rheumatica | 5 | 31710968–31794592 | 7.31 × 10−09 | 0.080 | 0.23 | 5.90 | 0.006808 | 1.59 × 10−08 | 6.80 × 10⁻³ | rs1150748 | 1 |
| Prostate problem (not cancer) | 6 | 34607958–35163974 | 2.84 × 10−08 | 0.082 | 0.18 | 6.94 | 0.034889 | 9.81 × 10−04 | 9.81 × 10⁻⁴ | rs76117834 | 0.03 |
| Psoriasis | 7 | 31254263–31263216 | 1.20 × 10−122 | 0.214 | 1.21 | 2.73 | 3.07×10–05 | 0 | 1.93 × 10⁻² | rs13214872 | 1 |
| Psoriatic arthropathy | 8 | 33072522–33115762 | 8.54 × 10⁻¹² | 0.122 | 0.20 | 3.97 | 0.008708 | 4.76 × 10⁻¹⁰ | 1.01 × 10⁻³ | rs17221401 | 1 |
| Rheumatoid arthritis | 9 | 32412539–32573760 | 8.15 × 10−122 | 0.208 | 0.23 | 2.34 | 0.01293 | 6.96 × 10−124 | 8.24 × 10⁻³ | rs188575117 | 0.98 |
-
*
p-values are for the reported SNP from http://www.nealelab.is/blog/2017/9/15/heritability-of-2000-traits-and-disorders-in-the-uk-biobank.
Table 2
Clusters of the runs-of-homozygosity (ROH) diplotypes with the lowest p-values outside of the HLA region for self-reported diseases using the British population in UK Biobank.
The p-values were calculated using PHESANT.
| Disease (binary trait) | Diplotype ID | Position | p-value | Beta | Carrier frequency (%) | Odds ratio | Genetic length (cM) | GWAS p-value* | GWAS beta* | GWAS lead SNP* | D′ |
|---|---|---|---|---|---|---|---|---|---|---|---|
| Deep venous thrombosis (dvt) | 10 | chr1:169075589–169528830 | 3.10 × 10⁻²¹ | 0.039 | 2.08 | 10.49 | 0.56 | 7.41 × 10−166 | −3.13 × 10⁻² | rs6025 | 1 |
| Eczema/dermatitis | 11 | chr1:151515188–151902494 | 1.52 × 10⁻²⁷ | 0.044 | 2.85 | 7.31 | 0.36 | 3.45 × 10−36 | 1.43 × 10⁻² | rs55875222 | 1 |
| 12 | chr1:151940401–152280032 | 9.46 × 10⁻²⁴ | 0.053 | 11.76 | 2.07 | 0.12 | 1.35 × 10−64 | 1.84 × 10⁻² | rs61815559 | 1 | |
| 13 | chr1:152493154–152964479 | 1.53 × 10⁻²¹ | 0.039 | 2.85 | 7.35 | 0.36 | 1.01 × 10−42 | 1.62 × 10⁻² | rs61813875 | 1 | |
| Hypothyroidism/myxoedema | 14 | chr12:111910219–112874179 | 4.51 × 10⁻²¹ | 0.062 | 5.06 | 1.25 | 0.04 | 1.88 × 10−80 | 9.87 × 10⁻³ | rs7137828 | 0.99 |
-
*
p-values are for the reported SNP from http://www.nealelab.is/blog/2017/9/15/heritability-of-2000-traits-and-disorders-in-the-uk-biobank.
Additional files
-
Supplementary file 1
Number of individuals in detected runs-of-homozygosity (ROH) clusters in autosomal chromosomes of UKBB.
- https://cdn.elifesciences.org/articles/81698/elife-81698-supp1-v2.zip
-
Supplementary file 2
The overlapping hotspots between runs-of-homozygosity (ROH)-DICE and Pemberton et al., 2012.
- https://cdn.elifesciences.org/articles/81698/elife-81698-supp2-v2.zip
-
Supplementary file 3
The overlapping coldspots between runs-of-homozygosity (ROH)-DICE and Pemberton et al., 2012.
- https://cdn.elifesciences.org/articles/81698/elife-81698-supp3-v2.zip
-
Supplementary file 4
100 clusters of the runs-of-homozygosity (ROH) diplotypes with the lowest p-values for self-reported non-cancerous diseases using the British population in UK Biobank.
- https://cdn.elifesciences.org/articles/81698/elife-81698-supp4-v2.xlsx
-
Supplementary file 5
Runs-of-homozygosity (ROH) diplotype consensuses of the clusters with the lowest p-values.
- https://cdn.elifesciences.org/articles/81698/elife-81698-supp5-v2.xlsx
-
Supplementary file 6
cPBWT algorithms for finding width- and length-maximal matches.
- https://cdn.elifesciences.org/articles/81698/elife-81698-supp6-v2.pdf
-
MDAR checklist
- https://cdn.elifesciences.org/articles/81698/elife-81698-mdarchecklist1-v2.docx
Download links
A two-part list of links to download the article, or parts of the article, in various formats.
Downloads (link to download the article as PDF)
Open citations (links to open the citations from this article in various online reference manager services)
Cite this article (links to download the citations from this article in formats compatible with various reference manager tools)
Discovery of runs-of-homozygosity diplotype clusters and their associations with diseases in UK Biobank
eLife 13:e81698.
https://doi.org/10.7554/eLife.81698


