Coevolution-based prediction of key allosteric residues for protein function regulation
- Center for Quantitative Biology, Academy for Advanced Interdisciplinary Studies, Peking University, China
- BNLMS, Peking-Tsinghua Center for Life Sciences at the College of Chemistry and Molecular Engineering, Peking University, China
- School of Sciences, Anhui Agricultural University, China
- School of Mathematical Sciences, Peking University, China
- Center for Statistical Science, Peking University, China
- Research Unit of Drug Design Method, Chinese Academy of Medical Sciences (2021RU014), China
Figures
Figure 1
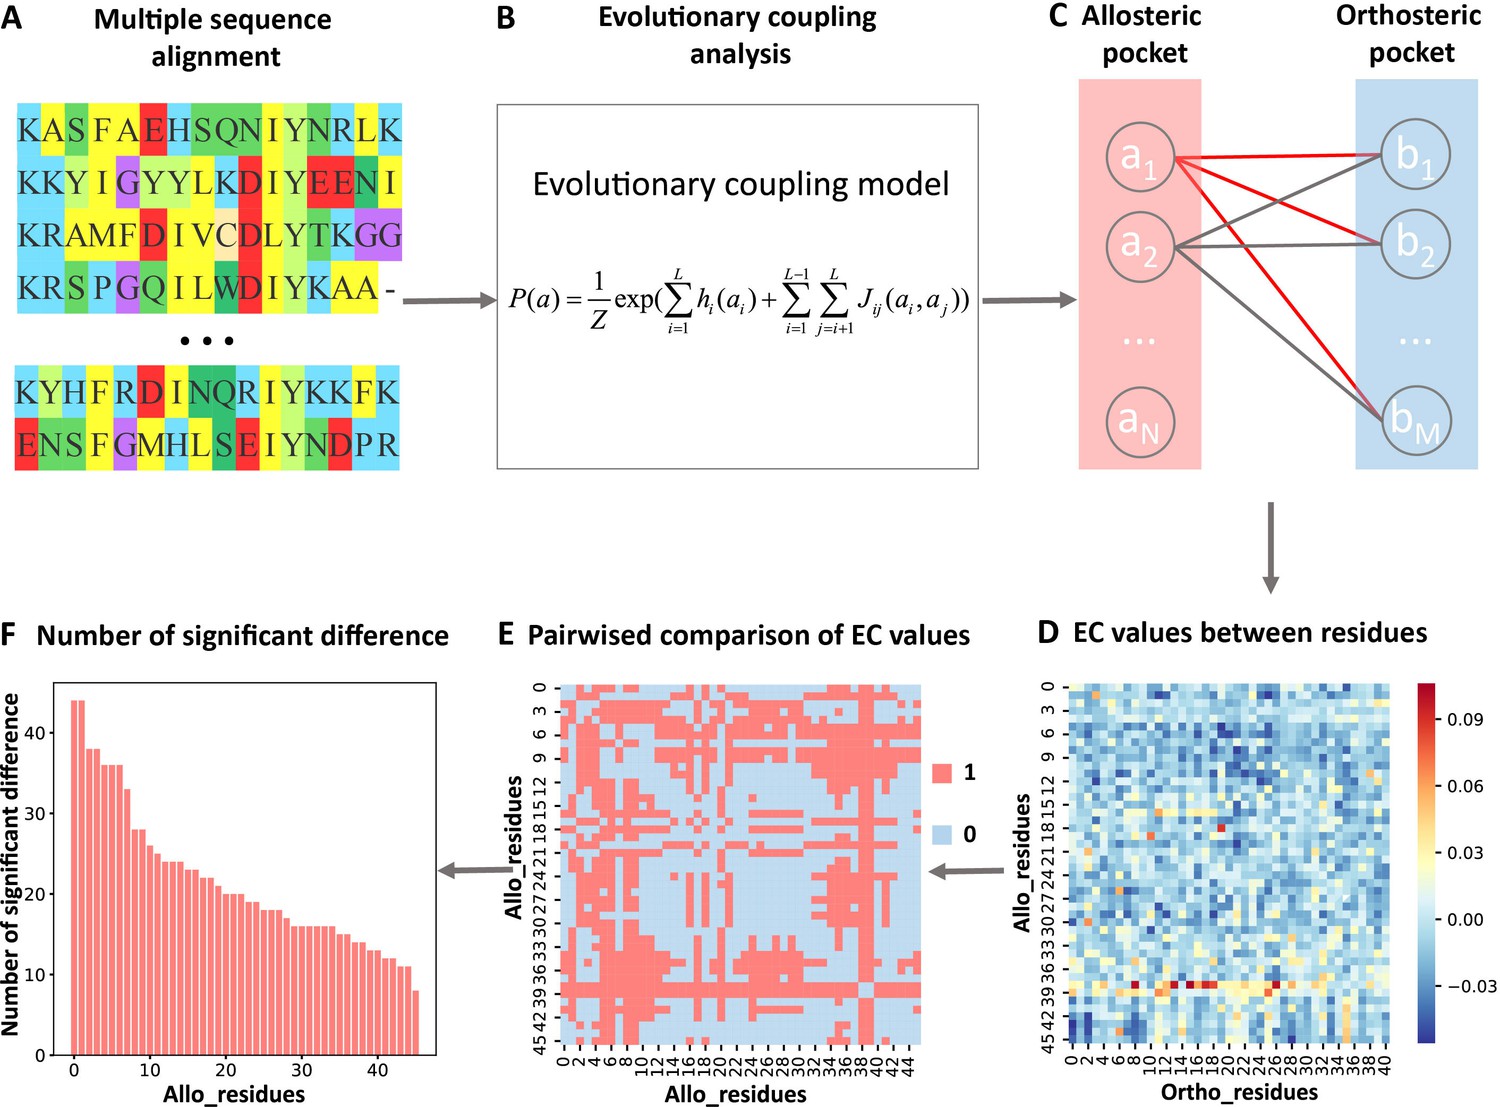
Steps to identify key allo-residues.
(A) Multiple sequence alignment. (B) Evolutionary coupling (EC) analysis. (C–D) Calculation of the EC values between residues in allosteric and orthosteric pockets. (E) Pairwise compared the difference of EC values corresponding to residues in allosteric pocket. (F) The number of significant differences corresponding to each residue in allosteric pocket.
Figure 2 with 3 supplements

Z-scores of allosteric pockets and probabilities of ranking an allosteric pocket in the top 3.
(A) The sequence lengths of all proteins in our data set. (B) The number of homologous sequences. Neff represents the number of effective homologous sequences obtained under 80% reweighting. (C) Z-scores of allosteric pockets on proteins in the data set. Among the 25 allosteric pockets, the Z-scores of 23 allosteric pockets were greater than 0.5. (D) The probabilities that the known allosteric pockets were ranked in the top 1, top 2, and top 3.
-
Figure 2—source data 1
Raw data for Figure 2.
- https://cdn.elifesciences.org/articles/81850/elife-81850-fig2-data1-v2.xlsx
Figure 2—figure supplement 1
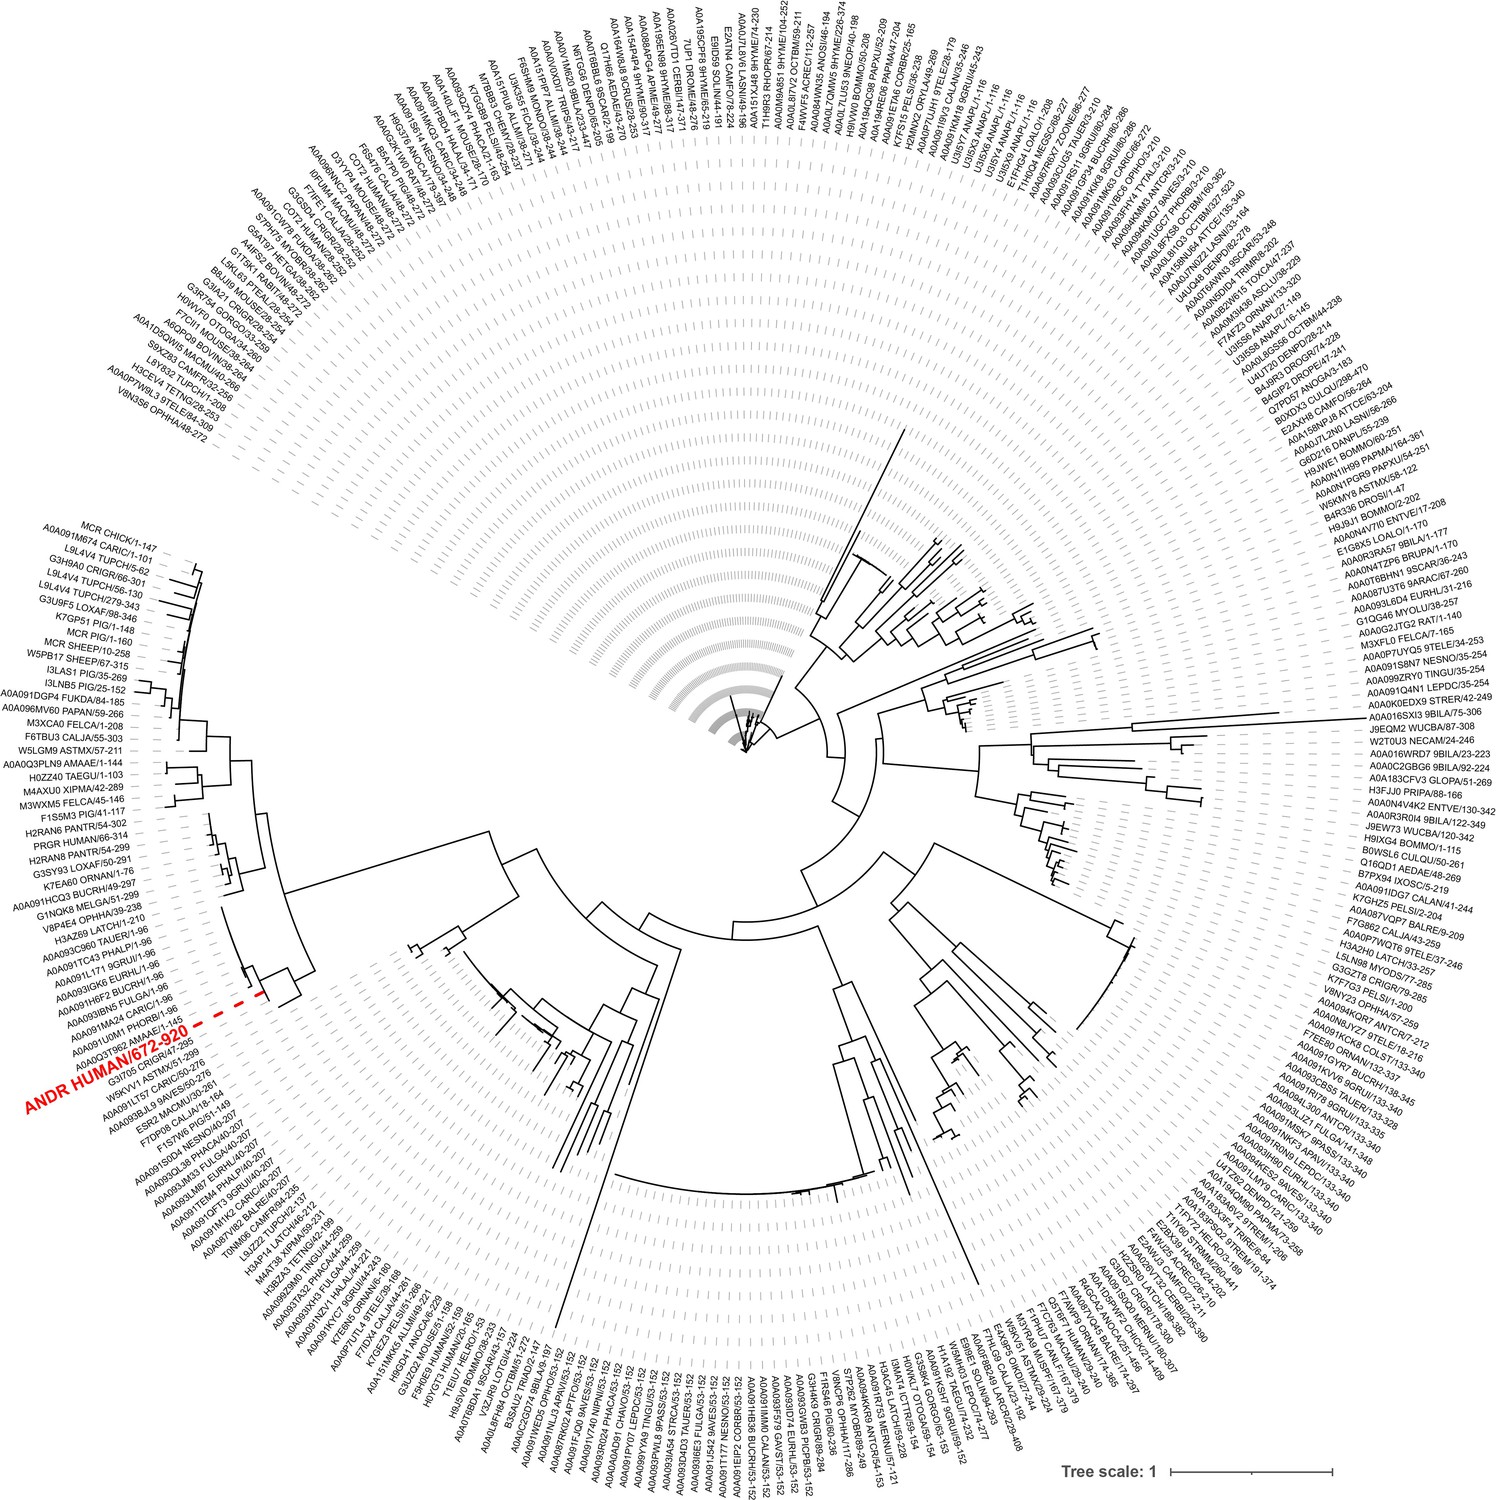
Phylogenetic tree of the androgen receptor.
Figure 2—figure supplement 2

Comparison of evolutionary coupling strength between pockets when all residue pairs and partial residue pairs were used.
(A) Prediction accuracy of using different numbers of residue pairs. We defined that the criterion for successful prediction is that the Z-score of the allosteric pocket is greater than 0.5. (B) The probabilities that the known allosteric pockets were ranked in the top 3 when using different numbers of residue pairs. (C) The distribution of Z-scores for the allosteric pockets when different numbers of residue pairs were used.
-
Figure 2—figure supplement 2—source data 1
Raw data for Figure 2—figure supplement 2.
- https://cdn.elifesciences.org/articles/81850/elife-81850-fig2-figsupp2-data1-v2.xlsx
Figure 2—figure supplement 3
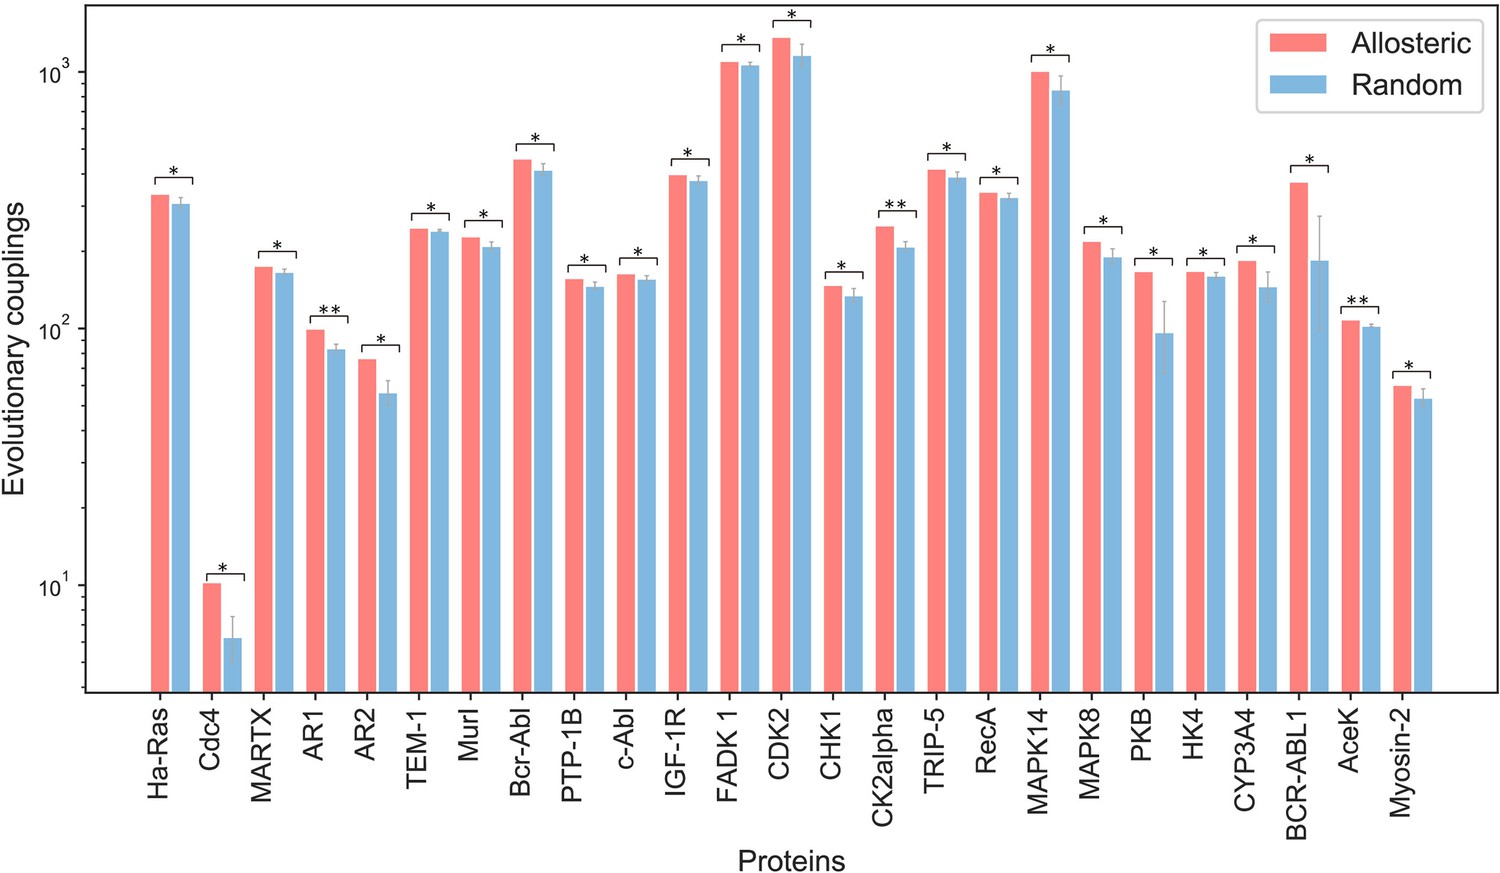
Difference between the evolutionary coupling between orthosteric and allosteric sites and the evolutionary coupling between two random patches.
Two residues that are not part of the orthosteric and allosteric sites were randomly selected from the surface residues of proteins. Among them, one was taken as the first center, and the residues around it with the same number as the residues in orthosteric pocket were selected as patch1; and the other residue was taken as the second center, and the residues around it with the same number as the residues in allosteric pocket were selected as patch2. Then we calculated the evolutionary coupling strength between patch1 and patch2. The process was repeated four times, and the mean and standard deviation of the evolutionary coupling strength were calculated. Finally, we compared the evolutionary coupling strength between patch1 and patch2 with that between orthosteric and allosteric sites by using the student’s t-test. If the p value was less than 0.05, we marked it with an asterisk; if the p value was less than 0.01, we marked it with two asterisks.
-
Figure 2—figure supplement 3—source data 1
Raw data for Figure 2—figure supplement 3.
- https://cdn.elifesciences.org/articles/81850/elife-81850-fig2-figsupp3-data1-v2.xlsx
Figure 3 with 3 supplements

The number of predicted key allo-residues.
Number of residues refers to the number of residues from allosteric pockets, including the number of all residues in allosteric pockets and predicted key allo-residues.
-
Figure 3—source data 1
Raw data for Figure 3.
- https://cdn.elifesciences.org/articles/81850/elife-81850-fig3-data1-v2.xlsx
Figure 3—figure supplement 1
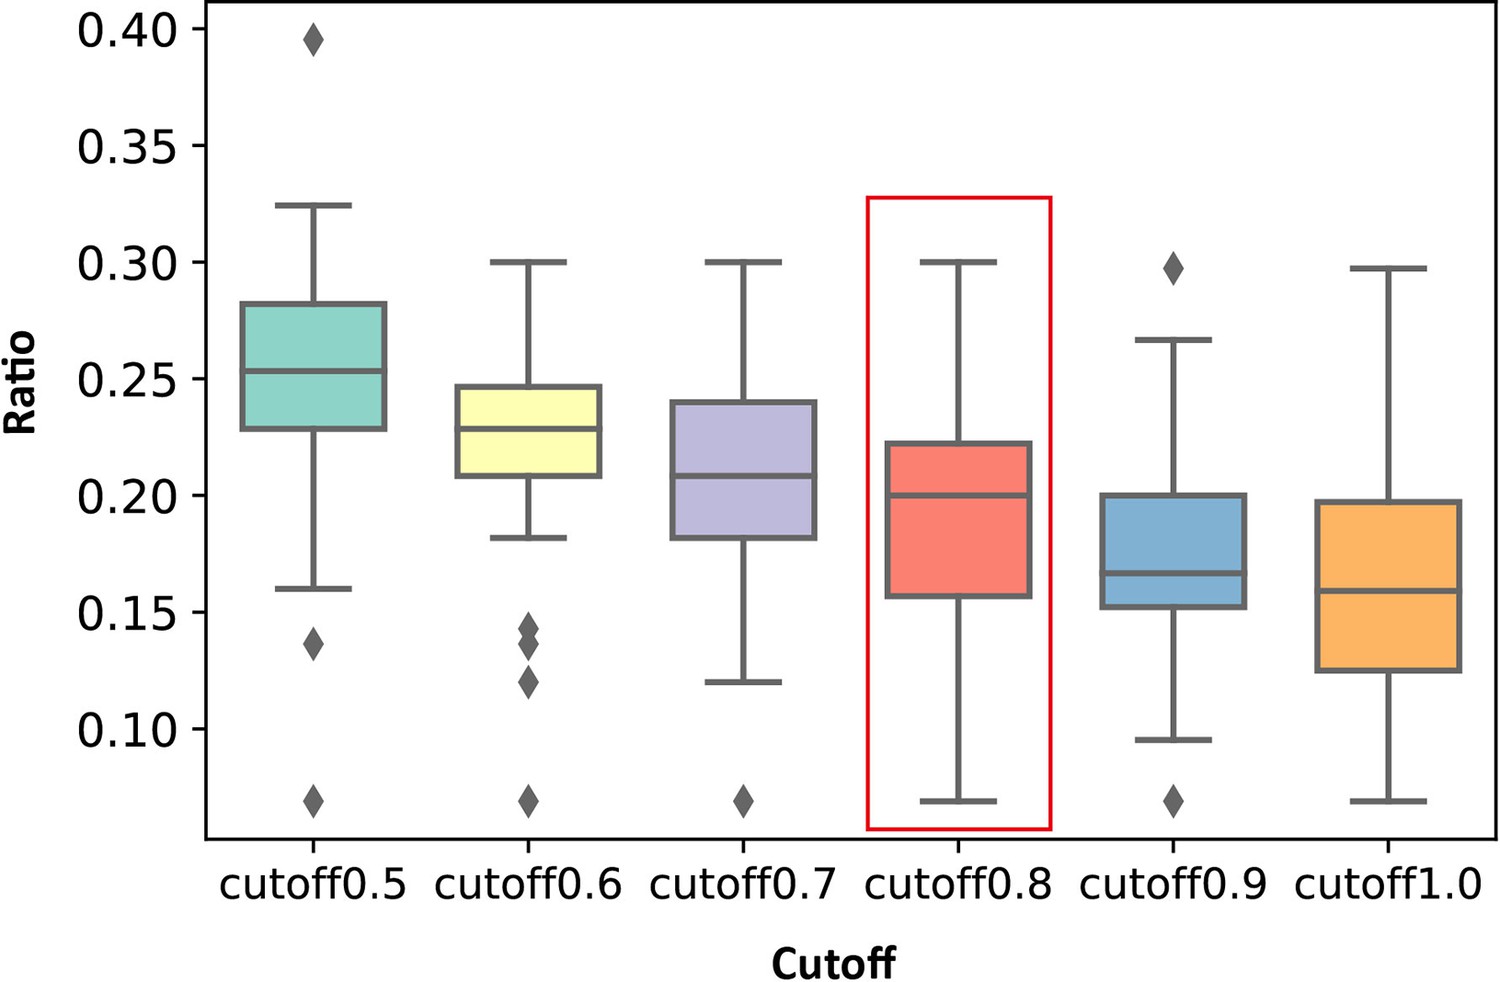
Distribution of the ratios of the number of key allo-residues predicted by KeyAlloSite in the number of all residues in allosteric pockets when using different cutoffs in all proteins.
-
Figure 3—figure supplement 1—source data 1
Raw data for Figure 3—figure supplement 1.
- https://cdn.elifesciences.org/articles/81850/elife-81850-fig3-figsupp1-data1-v2.xlsx
Figure 3—figure supplement 2

Examples of distributions of the statistics corresponding to significant scores obtained from the t-test.
These three distributions are the distributions of the statistics in BCR-ABL1, Tar, and PDZ3.
Figure 3—figure supplement 3

Random sampling of homologous sequences.
For each of the seven proteins, we randomly sampled different numbers of homologous sequences such as 1 L, 2 L, and so on. The ratio refers to the proportion of identical key allo-residues identified by all and different numbers of homologous sequences. The process was repeated three times, and the mean and standard deviation of the ratios were calculated. L: length of protein.
-
Figure 3—figure supplement 3—source data 1
Raw data for Figure 3—figure supplement 3.
- https://cdn.elifesciences.org/articles/81850/elife-81850-fig3-figsupp3-data1-v2.xlsx
Figure 4
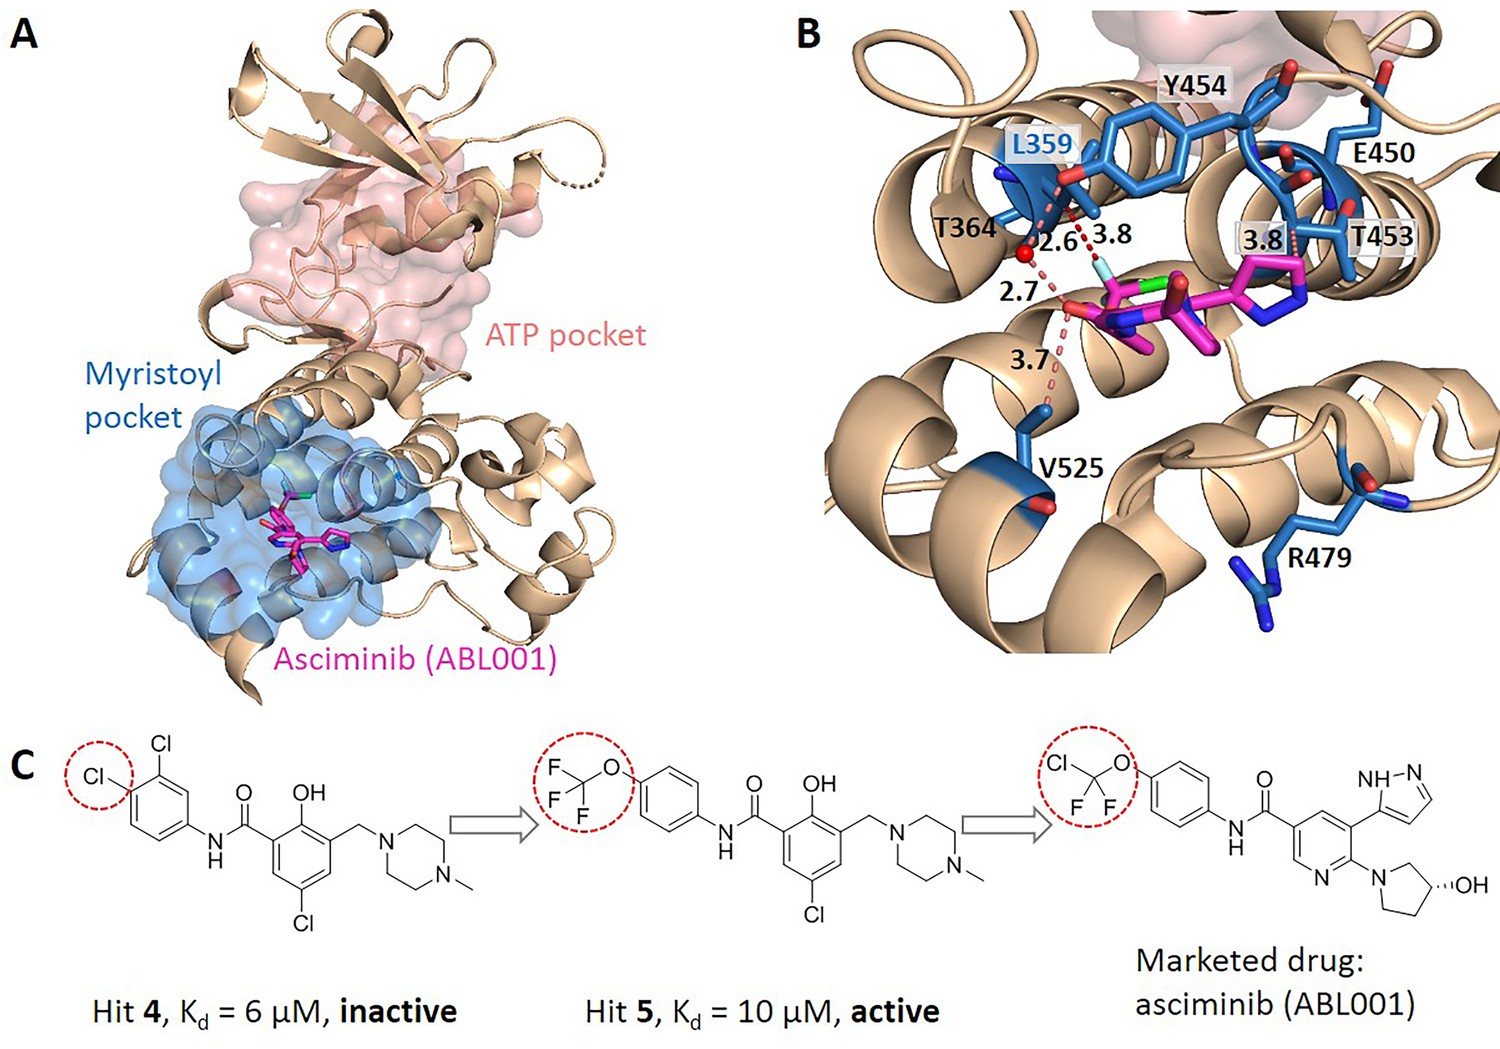
Key allo-residues predicted in BCR-ABL1.
(A) The crystal structure of the kinase domain of BCR-ABL1. The allosteric inhibitor asciminib, represented by sticks, binds to the myristoyl pocket (marine). (B) Predicted key allo-residues in the myristoyl pocket. The predicted key allo-residues are represented by marine sticks. One of the predicted key allo-residues, L359, forms a favorable hydrophobic interaction with a fluorine atom in asciminib, represented by a red dashed line. Water is represented by a red sphere. (C) The structure of fragment-derived hit 4 and hit 5 and the final marketed drug asciminib.
-
Figure 4—source data 1
Raw data for Figure 4.
- https://cdn.elifesciences.org/articles/81850/elife-81850-fig4-data1-v2.xlsx
Figure 5

The key allo-residues predicted by our method in Tar and PDZ3.
(A) The crystal structure of holo-Tar. Aspartate (Asp) is represented by magenta sticks, the allosteric pocket is represented by marine surface, and the salmon helix is selected as the orthosteric site. (B) The key allo-residues predicted at the Asp-binding site. The predicted key allo-residues in the allosteric cavity_2 are represented by marine sticks, among which Y149 and Q152 are the true key allo-residues that have been confirmed by experiments. Hydrogen bonds are shown as red dash lines. (C) The predicted key allo-residues in PDZ3. The peptide bound to the orthosteric site is represented by salmon sticks, the allosteric pocket is represented by marine surface, and the predicted key allo-residues are represented by marine sticks.
-
Figure 5—source data 1
Raw data for Figure 5.
- https://cdn.elifesciences.org/articles/81850/elife-81850-fig5-data1-v2.xlsx
Figure 6

KeyAlloSite predicted key allo-residues for enzymes.
(A) KeyAlloSite predicted key allo-residues for Candida antarctica lipase B. Among the predicted residues, the residues that have been annotated by the literature are shown as marine spheres, and the orthosteric pocket is represented by salmon surface. (B) KeyAlloSite predicted key allo-residues for Escherichia coli chorismate mutase (CM). Experimentally discovered key functional residues of CM are shown as marine spheres, the labels of key allo-residues predicted by KeyAlloSite are shown in marine, and the orthosteric pocket and ligand are represented by salmon surface and sticks.
-
Figure 6—source data 1
Raw data for Figure 6.
- https://cdn.elifesciences.org/articles/81850/elife-81850-fig6-data1-v2.xlsx
Tables
Table 1
Predicted key allo-residues that were mutated in cancers.
| Protein | Gene | Predicted key allo-residues | Mutation* | Cancer type† |
|---|---|---|---|---|
| AR1 | AR | D732 | D732N | SKCM |
| AR2 | AR | M832 | M832I | SKCM |
| PTP-1B | PTPN1 | M282 | M282T | COAD |
| CDK2 | CDK2 | P155 | P155H | UCEC |
| CK2alpha | CSNK2A1 | F54; A110 | F54C; A110T | UCEC; UCEC, GBM |
| MAPK14 | MAPK14 | P191; E192 | P191S; P191H; E192Q | SKCM; KIRC; BLCA |
| MAPK8 | MAPK8 | E195; M200 | E195K; M200I | UCEC; SKCM |
| CYP3A4 | CYP3A4 | F219 | F219L | UCEC |
-
*
Mutation: confirmed disease mutations among the predicted key allo-residues.
-
†
Cancer type: COAD: colon adenocarcinoma; SKCM: skin cutaneous melanoma; UCEC: uterine corpus endometrial carcinoma; GBM: glioblastoma multiforme; KIRC: kidney renal clear cell carcinoma; BLCA: bladder urothelial carcinoma.
Additional files
-
Supplementary file 1
Information of the allosteric proteins in the data set.
- https://cdn.elifesciences.org/articles/81850/elife-81850-supp1-v2.docx
-
Supplementary file 2
List of the Z-scores and ranking of allosteric pockets in the data set.
- https://cdn.elifesciences.org/articles/81850/elife-81850-supp2-v2.docx
-
Supplementary file 3
KeyAlloSite prediction results of Aurora A kinase.
- https://cdn.elifesciences.org/articles/81850/elife-81850-supp3-v2.docx
-
Supplementary file 4
List of the predicted key allo-residues in allosteric pockets.
- https://cdn.elifesciences.org/articles/81850/elife-81850-supp4-v2.docx
-
Supplementary file 5
Key allo-residues predicted by KeyAlloSite with different cutoffs.
- https://cdn.elifesciences.org/articles/81850/elife-81850-supp5-v2.docx
-
Supplementary file 6
KeyAlloSite prediction results of tyrosine-protein kinase ABL1.
- https://cdn.elifesciences.org/articles/81850/elife-81850-supp6-v2.docx
-
Supplementary file 7
The key allo-residues predicted by our method on Candida antarctica lipase B.
- https://cdn.elifesciences.org/articles/81850/elife-81850-supp7-v2.docx
-
Supplementary file 8
The confusion matrices of KeyAlloSite in different scenarios.
- https://cdn.elifesciences.org/articles/81850/elife-81850-supp8-v2.docx
-
Supplementary file 9
Comparison of KeyAlloSite and SCA methods.
- https://cdn.elifesciences.org/articles/81850/elife-81850-supp9-v2.docx
-
MDAR checklist
- https://cdn.elifesciences.org/articles/81850/elife-81850-mdarchecklist1-v2.docx
Download links
A two-part list of links to download the article, or parts of the article, in various formats.
Downloads (link to download the article as PDF)
Open citations (links to open the citations from this article in various online reference manager services)
Cite this article (links to download the citations from this article in formats compatible with various reference manager tools)
Coevolution-based prediction of key allosteric residues for protein function regulation
eLife 12:e81850.
https://doi.org/10.7554/eLife.81850


