Multimodal brain age estimates relate to Alzheimer disease biomarkers and cognition in early stages: a cross-sectional observational study
- Department of Neurology, Washington University in St. Louis, United States
- Department of Radiology, Washington University in St. Louis, United States
- Department of Neurosurgery, Washington University in St. Louis, United States
- Department of Psychiatry, Washington University in St. Louis, United States
- Department of Pathology and Immunology, Washington University in St. Louis, United States
- Department of Cognitive Neurology, Institute for Neurological Research (FLENI), Argentina
- Department of Neurology, Mayo Clinic Florida, United States
- Department of Neurology, Indiana University School of Medicine, United States
- Department of Clinical Neuroscience, Osaka Metropolitan University Medical School, Nagaoka Sutoku University, Japan
- Department of Neurology, Ludwig-Maximilians University, Germany
- German Center for Neurodegenerative Diseases, Germany
Figures
Figure 1 with 4 supplements
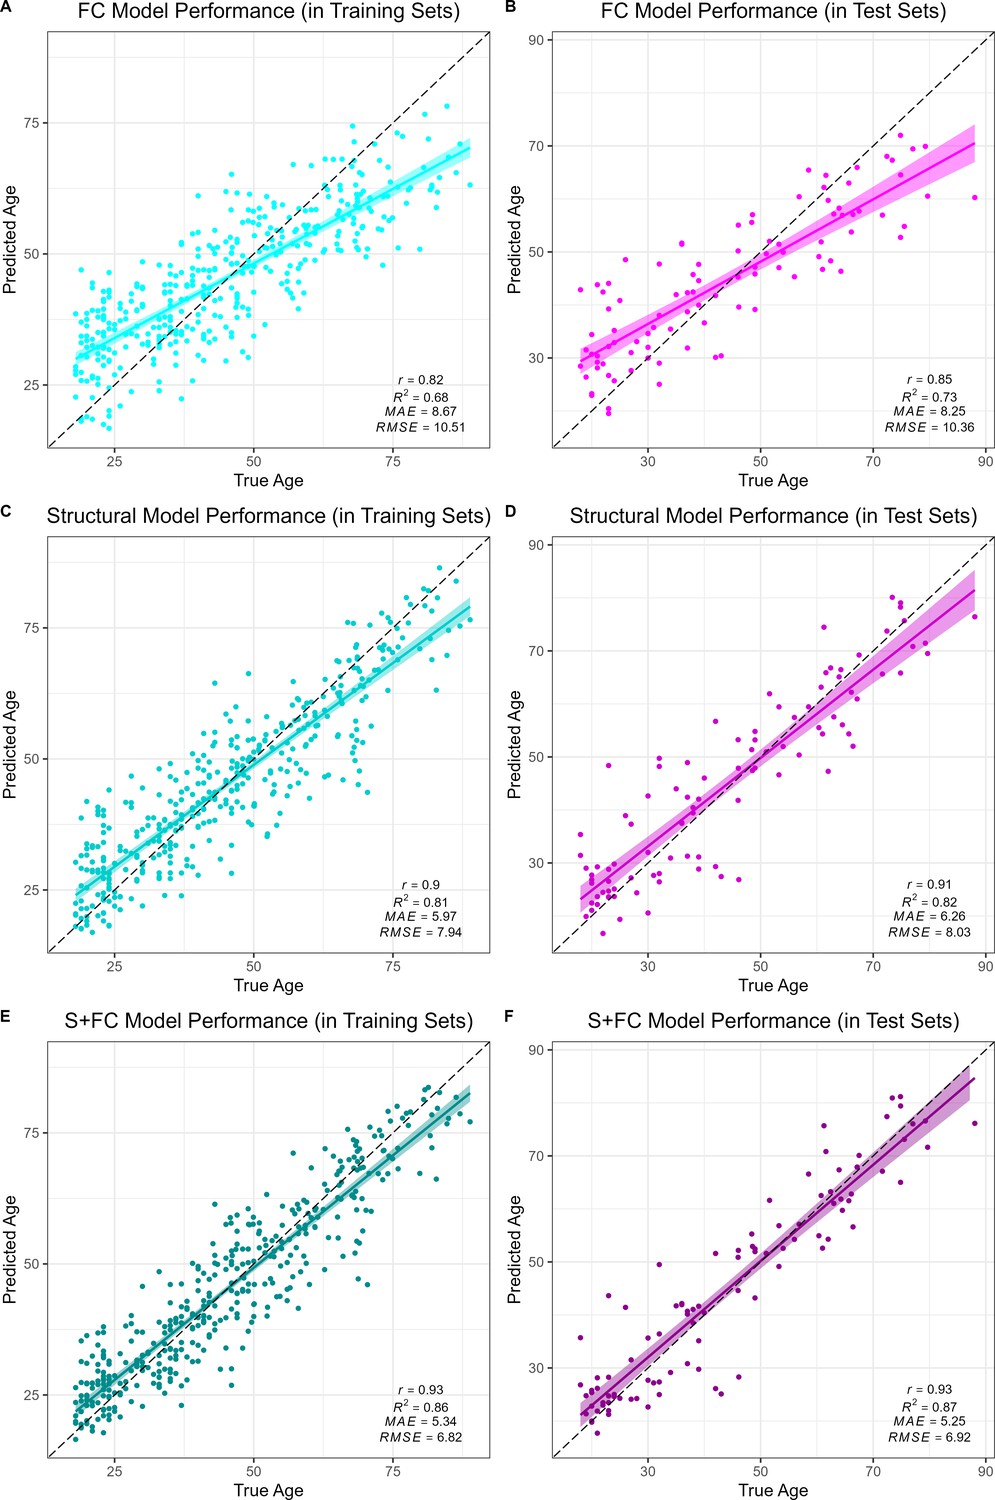
Performance of the brain age models in the training (left column) and test sets (right column) for each modality: functional connectivity (FC; A and B), structural MRI (S; C and D) and multimodal models (S+FC; E and F).
Age predicted by each model (y axis) is plotted against true age (x axis). Colored lines and shaded areas represent regression lines and 95% confidence regions. Dashed black lines represent perfect prediction. Model performance is evaluated by Pearson’s r, proportion of variance explained (R2), mean absolute error (MAE), and root-mean-square error (RMSE).
Figure 1—figure supplement 1
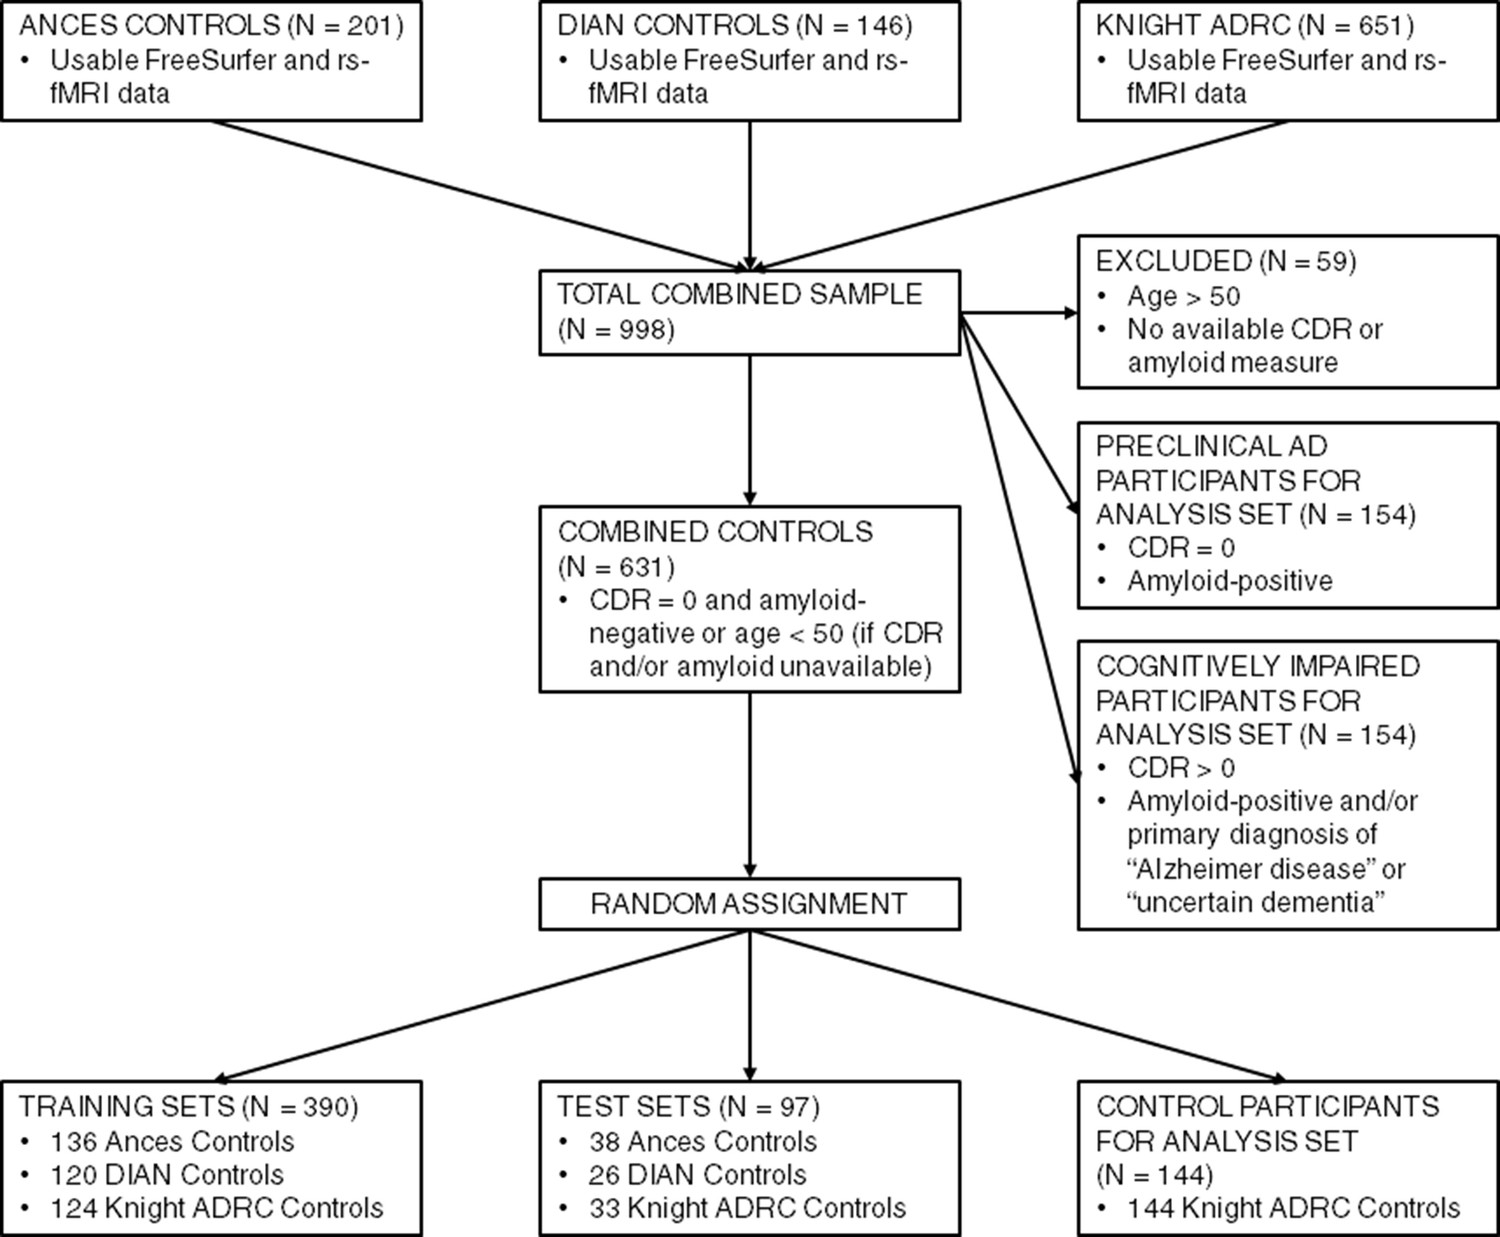
Flow chart of participant inclusion, exclusion, and group assignments.
Figure 1—figure supplement 2
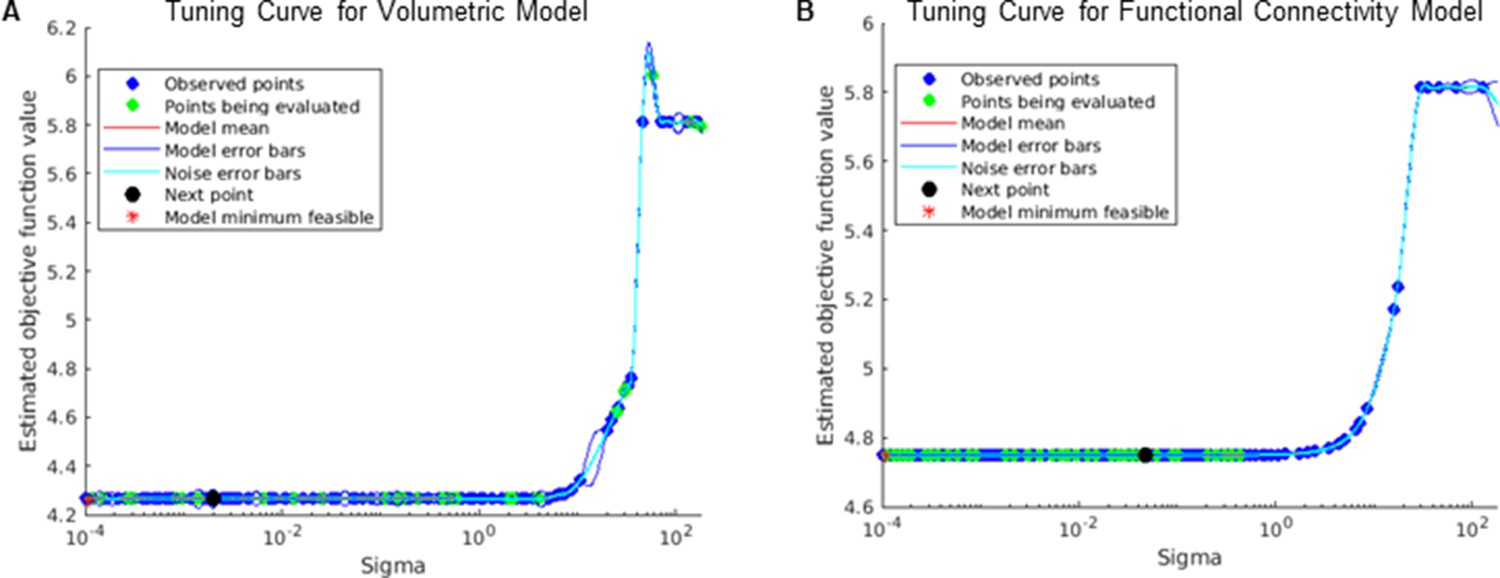
Tuning curves of σ hyperparameter in training for structural (A) and functional connectivity (B) Gaussian process regression (GPR) models.
Figure 1—figure supplement 3
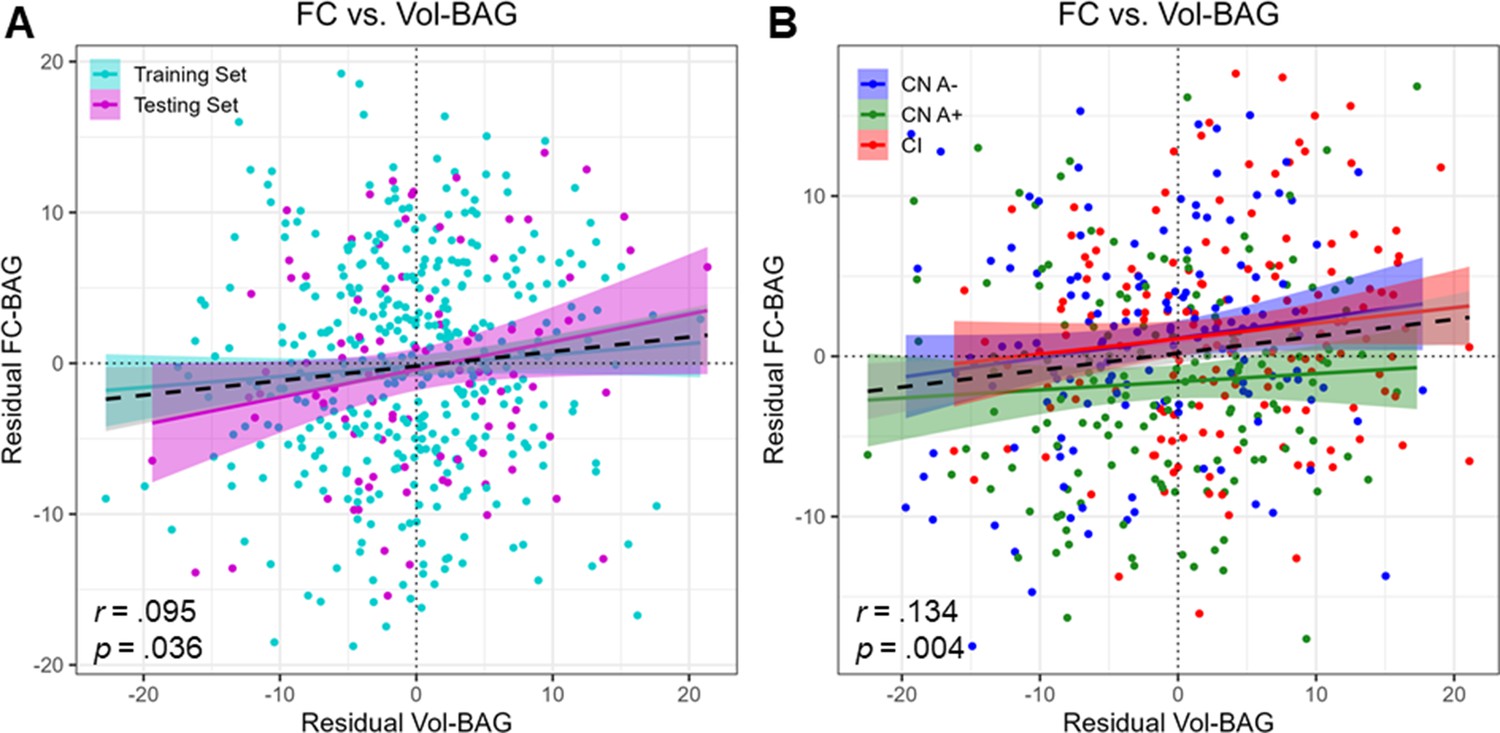
Correlation between S-brain age gap (BAG; x axis) and functional connectivity (FC)-BAG (y axis) estimates in the training and validation sets (A) and analysis sets (B).
Both BAG estimates are residualized for age. Dotted black lines represent no difference between predicted and chronological age for each model. Colored lines and shaded areas represent group-specific regression lines and 95% confidence regions. Dashed black lines represent main effect regression lines across all groups.
Figure 1—figure supplement 4
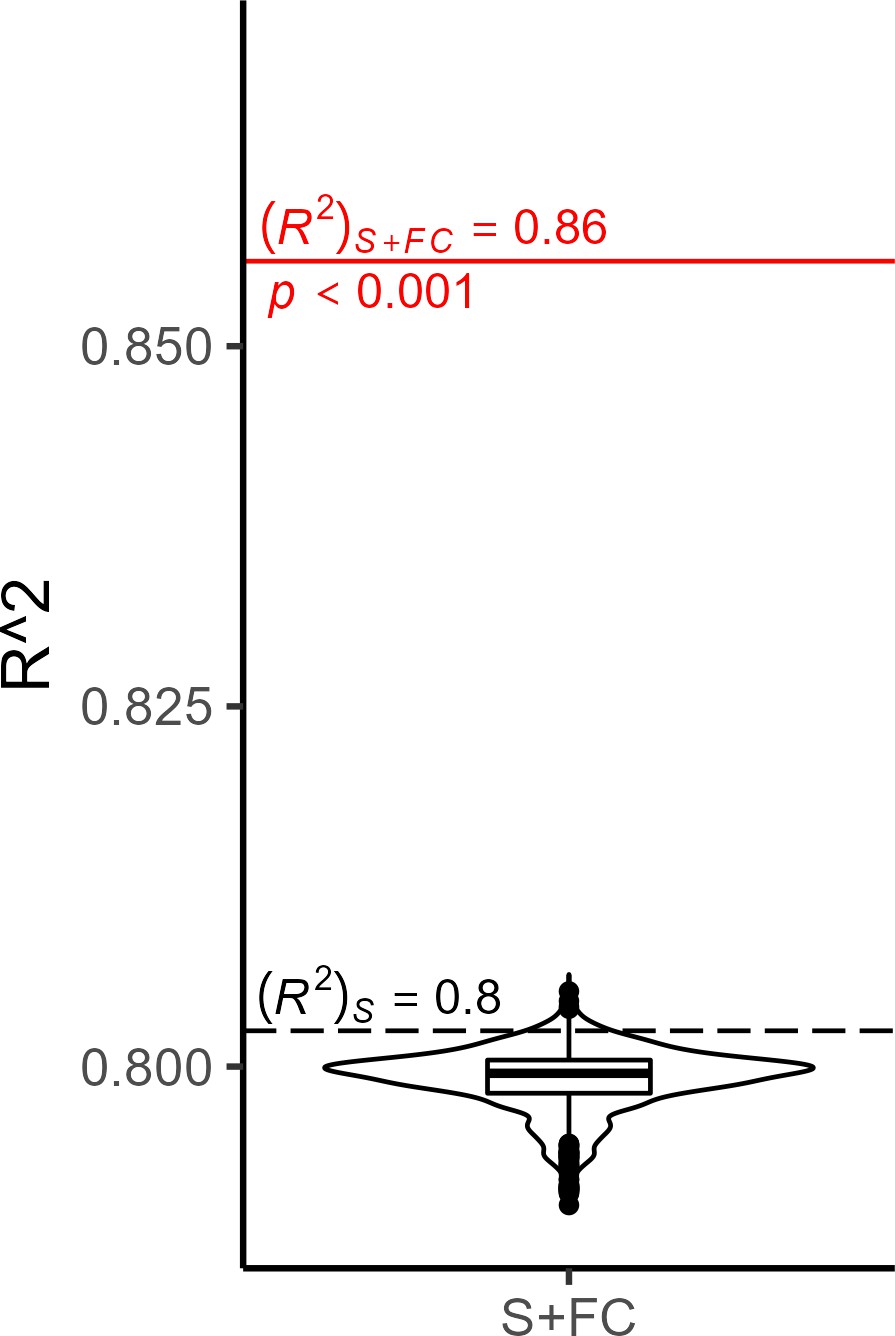
Violin plot of R2 performance estimates from 1000 bootstrapped samples in which a stacked brain age model combined the fully-trained structural MRI model (R2S) with a reshuffled functional connectivity (FC) model (i.e. FC training features were randomly reassigned in each bootstrap sample).
Most bootstrapped stacked models perform about as well or worse than the unimodal structural MRI model (R2S, black dashed line). The fully-trained stacked multimodal model (R2S+FC, red solid line) outperforms all bootstrapped models, suggesting that the modest increase in model performance observed in the multimodal model over the unimodal structural model is due to meaningful age-related FC signal, rather than capitalizing on noise in a larger feature set.
Figure 2 with 1 supplement
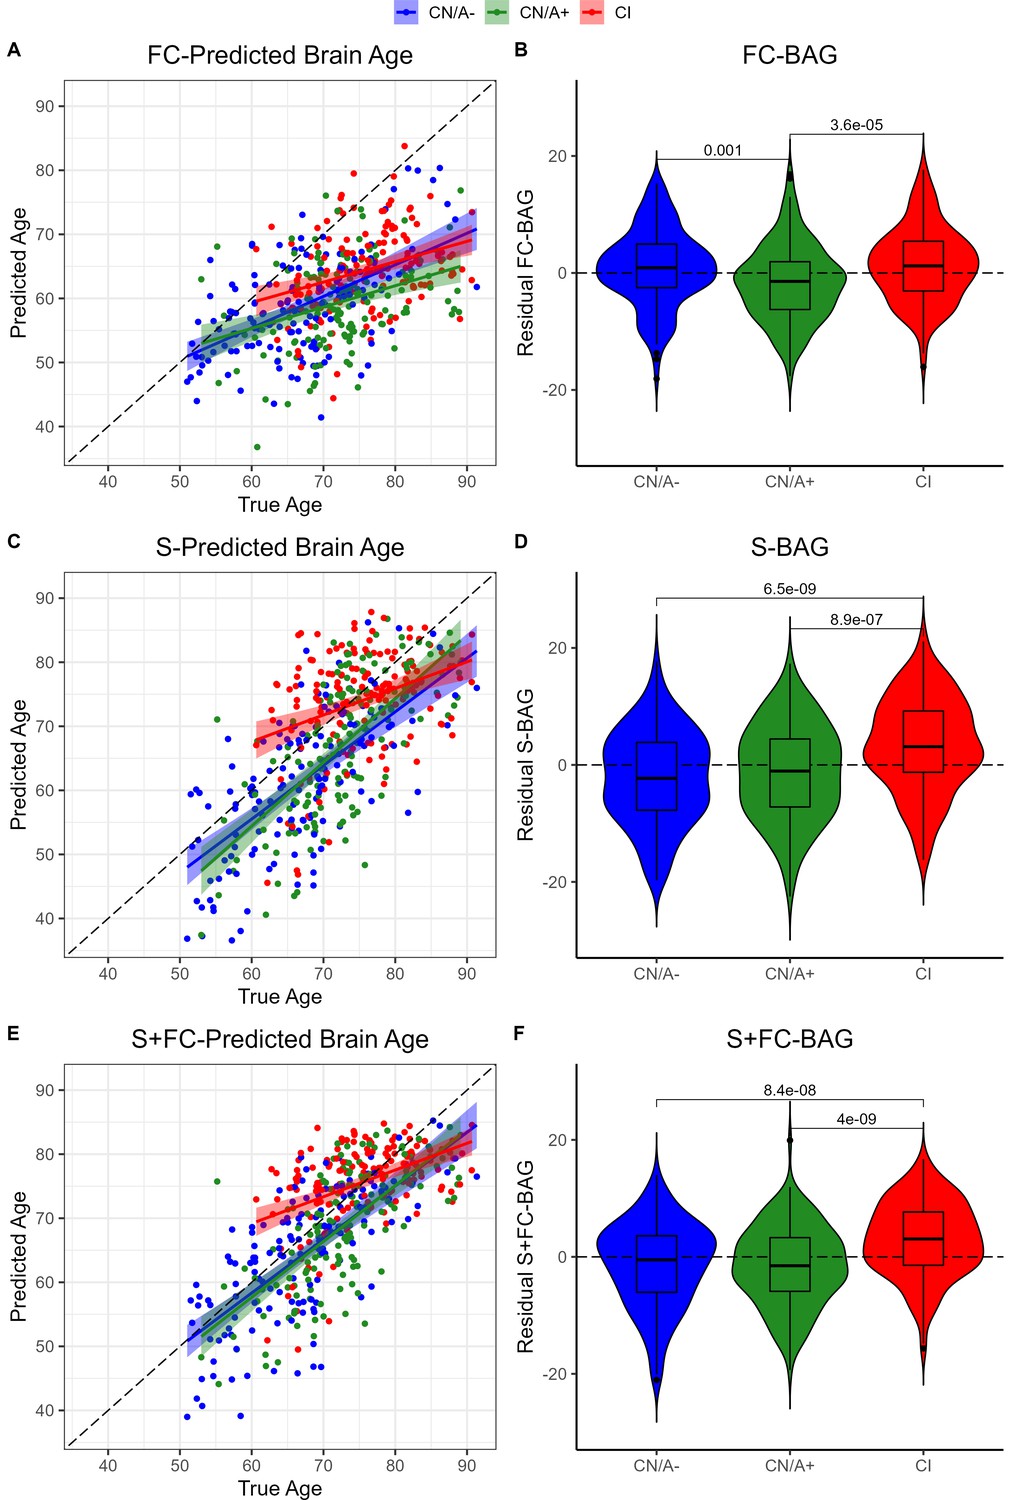
Group differences in functional connectivity (FC; A and B), structural (S; C and D), and multimodal (S+FC; E and F) brain age in the analysis sets.
Comparisons are presented between cognitively normal (Clinical Dementia Rating [CDR] = 0) biomarker-negative controls (CN/A−; blue) vs. CN/A+ (green) vs. cognitively impaired participants (CI, red). Scatterplots (A, C, and E) show predicted vs. true age for each group. Colored lines and shaded areas represent group-specific regression lines and 95% confidence regions. Dashed black lines represent perfect prediction. Violin plots (B, D, and F) show residual FC-brain age gap (BAG; controlling for true age) in each group. p values are reported from pairwise independent-samples t tests.
Figure 2—figure supplement 1
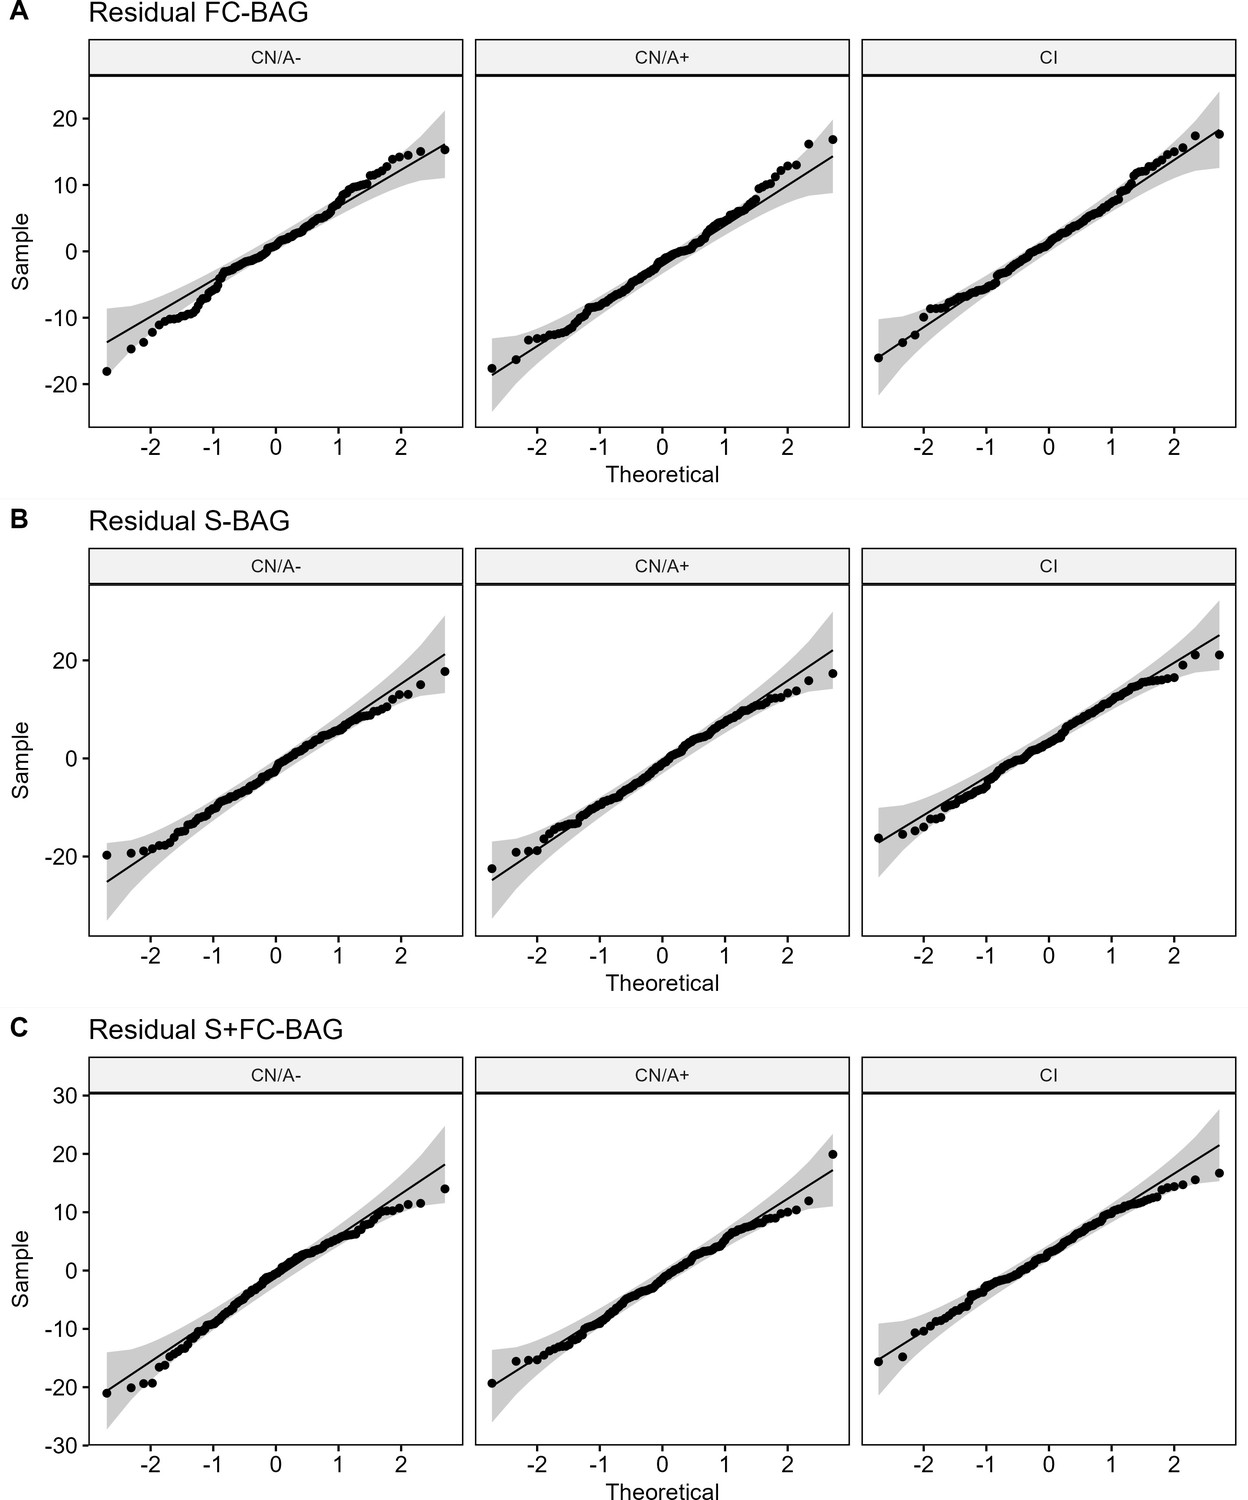
Quantile-quantile plots of brain age gap, controlling for age, in each of the analysis sets (cognitively normal, amyloid negative [CN/A−]; CN/A+; and cognitively impaired [CI]) for functional connectivity [FC; A], structural [S; B] and multimodal [S+FC; C] models.
Figure 3
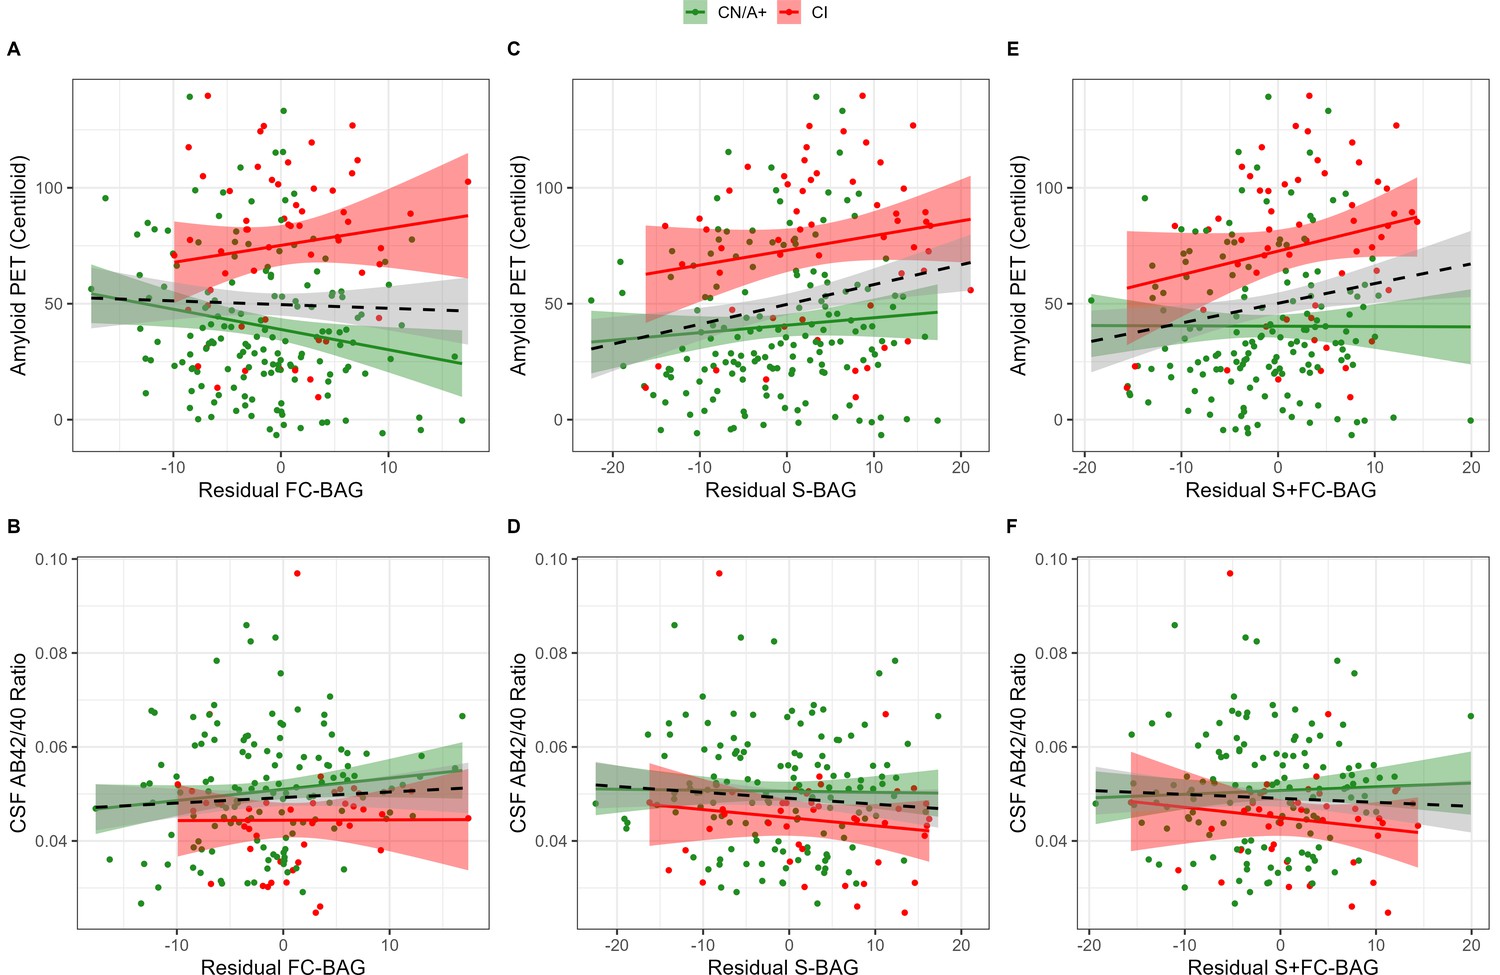
Continuous relationships between amyloid biomarkers and functional connectivity (FC-brain age gap [BAG]; A and B), structural (S-BAG; C and D), and multimodal (S+FC BAG; E and F) BAG in the analysis sets.
Scatterplots show amyloid PET (A, C, and E) and CSF AB42/40 (B, D, and F) as a function of residual BAG (controlling for true age) in each group. Colored lines and shaded areas represent group-specific regression lines and 95% confidence regions. Dashed black lines represent main effect regression lines across all groups.
Figure 4
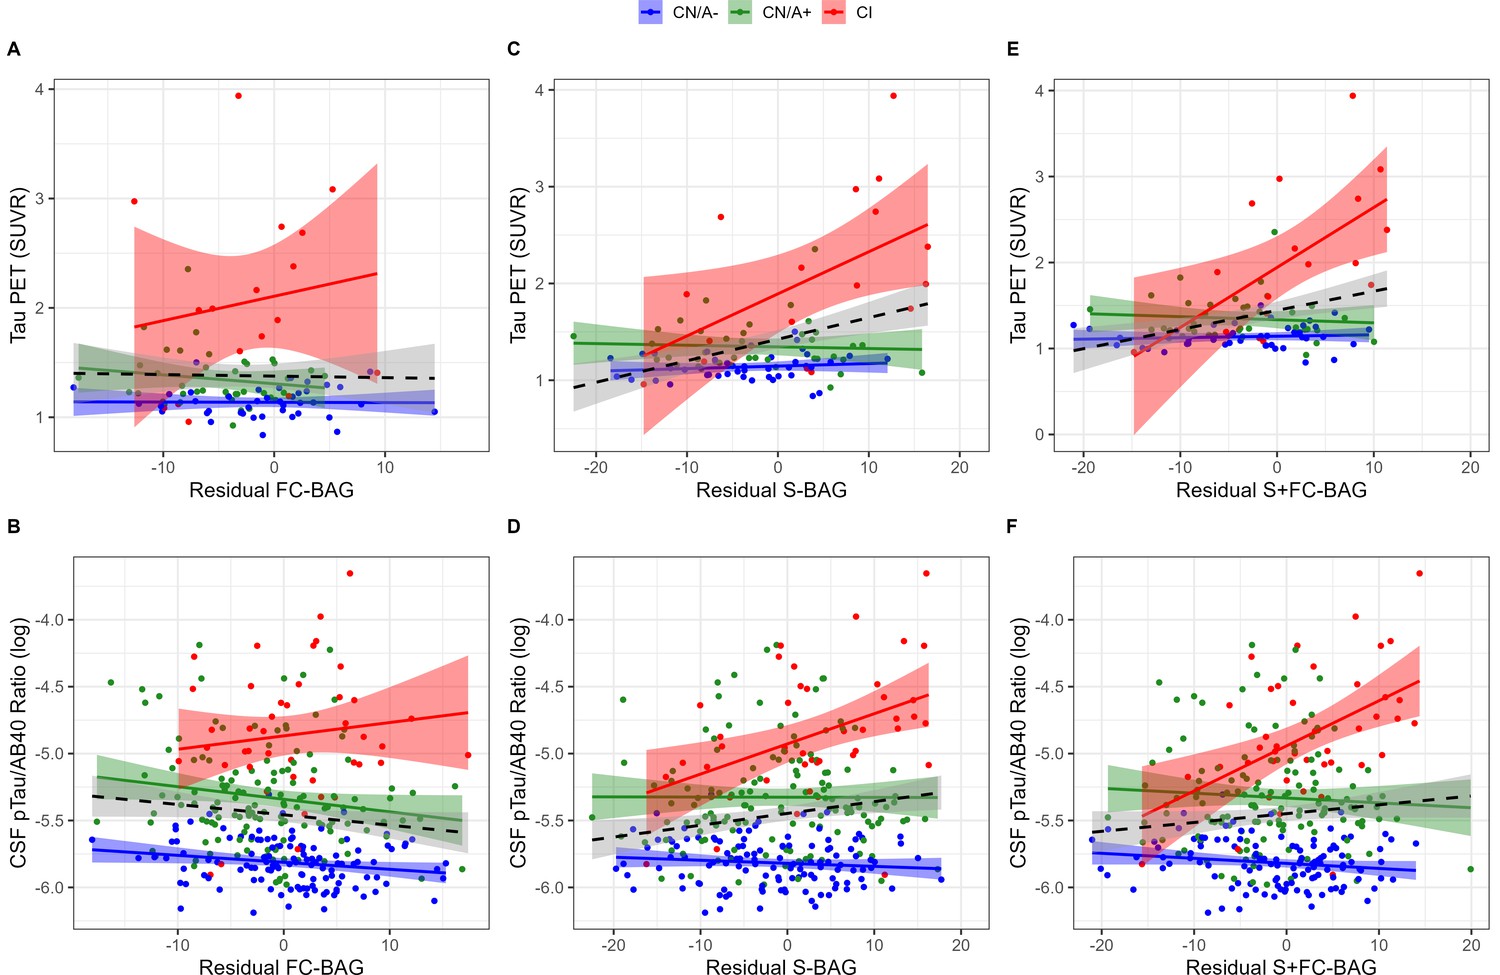
Continuous relationships between tau biomarkers and functional connectivity (FC-brain age gap [BAG]; A and B), structural (S-BAG; C and D), and multimodal (S+FC BAG; E and F) BAG in the analysis sets.
Scatterplots show Tau PET summary (A, C, and E) and log-transformed CSF pTau/Aβ40 (B, D, and F) as a function of residual BAG (controlling for true age) in each group. Colored lines and shaded areas represent group-specific regression lines and 95% confidence regions. Dashed black lines represent main effect regression lines across all groups.
Figure 5
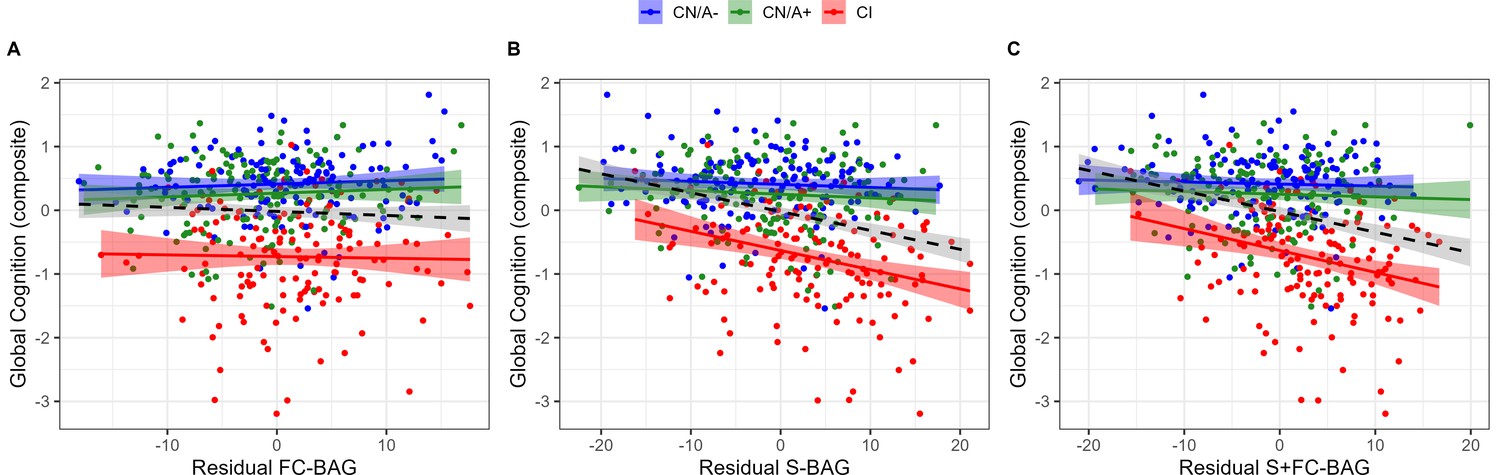
Continuous relationships between global cognition and functional connectivity (FC-brain age gap [BAG]; A), structural (S-BAG; B), and multimodal (S+FC BAG; C) in the analysis sets.
Scatterplots show global cognition as a function of residual BAG (controlling for true age) in each group. Colored lines and shaded areas represent group-specific regression lines and 95% confidence regions. Dashed black lines represent main effect regression lines across all groups.
Tables
Table 1
Demographic information of the combined samples.
| Measure | Training sets (total N=390) | Test sets (total N=97) § | Analysis sets (total N=452) | ||||||
|---|---|---|---|---|---|---|---|---|---|
| Ances Controls(CN/<50) | DIAN Controls(CN/A−) | Knight ADRC Controls(CN/A−) | Ances Controls(CN/<50) | DIAN Controls(CN/A−) | Knight ADRC Controls(CN/A−) | CN/A− | CN/A+ | CI | |
| N | 136 | 120 | 134 | 38 | 26 | 33 | 144 | 154 | 154 |
| Age (mean, SD) | 29.92 (9.92) | 40.02 (10.26) | 64.97 (10.57) | 26.68 (7.11) | 41.46 (12.34) | 64.73 (10.57) | 66.93 (8.53) | 72.56 (7.15)‡ | 75.67 (6.86) ‡ |
| CDR (N 0 / N 0.5 / N 1.0 / N 2.0) | NA | 120 / 0 / 0 / 0 | 134 / 0 / 0 / 0 | NA | 26 / 0 / 0 / 0 | 33 / 0 / 0 / 0 | 144 / 0 / 0 / 0 | 154 / 0 / 0 / 0 | 0 / 119 / 35 / 2 |
| Amyloid status (N + / N -) | NA | 120 / 0 | 134 / 0 | NA | 26 / 0 | 33 / 0 | 144 / 0 | 0 / 154 | 0 / 57 |
| Biomarkers available (N PET / CSF / both) | NA | 30 / 6 / 79 | 11 / 22 / 91 | NA | 3 / 1 / 21 | 5 / 0 / 28 | 24 / 0 / 120 | 17 / 0 / 137 | 14 / 0 / 43 |
| APOE ε4 carrier status (N + / N -) | NA | 76 / 44 | 99 / 34 | NA | 19 / 7 | 28 / 5 | 115 / 29 | 71 / 83 ‡ | 55 / 98 ‡ |
| MMSE (mean, SD) | NA | NA | 29.26 (1.05) | NA | NA | 29.45 (0.94) | 29.13 (1.17) | 28.97 (1.33) | 25.37 (3.55) ‡ |
| Sex (N female / N male) | 70 / 64 | 85 / 35 | 84 / 50 | 19 / 18 | 16 / 10 | 22 / 11 | 89 / 55 | 91 / 63 | 68 / 86† |
| Years of education (mean, SD) | 13.68 (2.16) | 14.78 (3.04) | 16.16 (2.43) | 13.95 (1.99) | 14.92 (2.83) | 16.48 (2.43) | 15.71 (2.65) | 15.90 (2.64) | 15.05 (2.97)* |
| Race (N American Indian or Alaska Native) | 1 | 0 | 0 | 1 | 0 | 0 | 0 | 0 | 0 |
| Race (N Asian) | 1 | 1 | 2 | 0 | 0 | 0 | 0 | 1 | 0 |
| Race (N Black) | 67 | 0 | 20 | 17 | 0 | 7 | 17 | 16 | 20 |
| Race (N Native Hawaiian or Other Pacifc Islander) | 2 | 0 | 0 | 2 | 0 | 0 | 0 | 0 | 0 |
| Race (N White) | 57 | 118 | 112 | 17 | 26 | 26 | 127 | 137 | 134 |
| Site | WUSTL | Multiple sites | WUSTL | WUSTL | Multiple sites | WUSTL | WUSTL | WUSTL | WUSTL |
| Scanner | Siemens Trio | Siemens Trio / Verio | Siemens Trio / Biograph | Siemens Trio | Siemens Trio / Verio | Siemens Trio / Biograph | Siemens Trio / Biograph | Siemens Trio / Biograph | Siemens Trio / Biograph |
| Field strength | 3T | 3T | 3T | 3T | 3T | 3T | 3T | 3T | 3T |
-
CN = Cognitively Normal, <50 = less than age 50, A− = amyloid negative, A+ = amyloid positive, CI = cognitively Impaired, DIAN = Dominantly Inherited Alzheimer Network, ADRC = Alzheimer Disease Research Center, AD = Alzheimer disease, CDR = Clinical Dementia Rating, MMSE = Mini Mental State Examination, WUSTL = Washington University in St. Louis, T = Tesla. Group differences from the CN/A− analysis set were tested with t tests for continuous variables and χ2 tests for categorical variables.
-
*
p < 0.05, ^ p < 0.10.
-
†
p < 0.01.
-
‡
p < 0.001.
-
§
Test sets include randomly-selected, non-overlapping subsets of participants drawn from the same studies as the training sets.
Table 2
Linear regression models predicting functional connectivity (FC)-brain age gap (BAG) (A), S-BAG (B), and FC + S BAG (C).
CDR = Clinical Dementia Rating. FD = framewise displacement.
| A. FC-BAG (df = 348) | B. S-BAG (df = 349) | C. S+FC BAG (df = 348) | ||||||||||||
|---|---|---|---|---|---|---|---|---|---|---|---|---|---|---|
| Estimate | SE | p value | ηp2 | Estimate | SE | p value | ηp2 | Estimate | SE | p value | ηp2 | |||
| Intercept | 30.903 | 3.809 | 0.000 | 5.830 | 4.899 | 0.235 | 11.755 | 4.197 | 0.005 | |||||
| CDR > 0 | 2.169 | 0.997 | 0.030 | 0.013 | 5.105 | 1.287 | 0.000 | 0.043 | 4.305 | 1.099 | 0.000 | 0.042 | ||
| Amyloid+ | –1.640 | 0.776 | 0.035 | 0.013 | 0.900 | 1.002 | 0.369 | 0.002 | 0.060 | 0.855 | 0.944 | 0.000 | ||
| Age (y) | –0.586 | 0.044 | 0.000 | 0.335 | –0.151 | 0.057 | 0.008 | 0.020 | –0.201 | 0.049 | 0.000 | 0.047 | ||
| Sex = female | –1.174 | 0.700 | 0.094 | 0.008 | 1.792 | 0.904 | 0.048 | 0.011 | 0.691 | 0.771 | 0.371 | 0.002 | ||
| Education (y) | –0.006 | 0.127 | 0.964 | 0.000 | –0.155 | 0.164 | 0.345 | 0.003 | –0.152 | 0.140 | 0.276 | 0.003 | ||
| Mean FD | 5.528 | 5.467 | 0.313 | 0.003 | NA | NA | NA | NA | 4.893 | 6.024 | 0.417 | 0.002 | ||
Additional files
-
Supplementary file 1
Summary of acquisition parameters for structural T1 and resting-state functional MRI.
TR = repetition time, TE = echo time.
- https://cdn.elifesciences.org/articles/81869/elife-81869-supp1-v2.docx
-
MDAR checklist
- https://cdn.elifesciences.org/articles/81869/elife-81869-mdarchecklist1-v2.docx
Download links
A two-part list of links to download the article, or parts of the article, in various formats.
Downloads (link to download the article as PDF)
Open citations (links to open the citations from this article in various online reference manager services)
Cite this article (links to download the citations from this article in formats compatible with various reference manager tools)
Multimodal brain age estimates relate to Alzheimer disease biomarkers and cognition in early stages: a cross-sectional observational study
eLife 12:e81869.
https://doi.org/10.7554/eLife.81869


