Fetal growth delay caused by loss of non-canonical imprinting is resolved late in pregnancy and culminates in offspring overgrowth
- Centre for Reproductive Health, Hudson Institute of Medical Research and Department of Molecular and Translational Science, Monash University, Australia
- Department of Molecular and Biomedical Sciences, School of Biological Sciences, University of Adelaide, Australia
- School of Biomedical Sciences, University of New South Wales, Australia
- School of BioSciences, University of Melbourne, Australia
- School of Psychology and Public Health, La Trobe University, Australia
- Bone Cell Biology and Disease Unit, St. Vincent’s Institute of Medical Research and Department of Medicine at St. Vincent’s Hospital, University of Melbourne, Australia
Figures
Figure 1 with 1 supplement
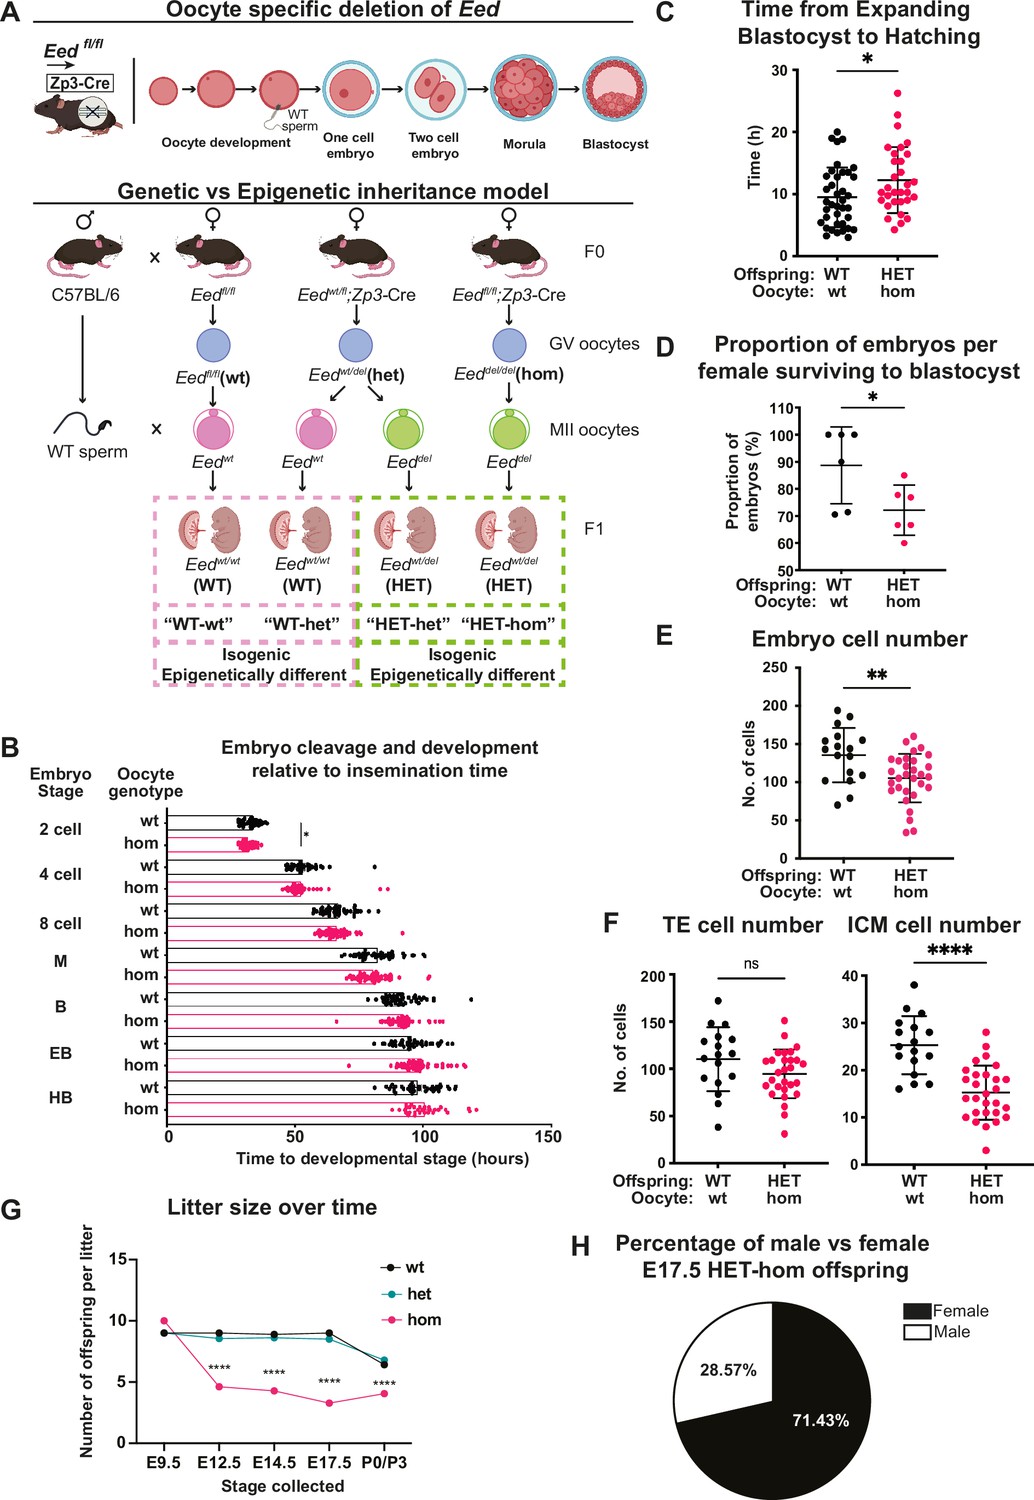
Maternal Embryonic ectoderm development (Eed) deletion impacted pre-implantation development.
(A) Model used to generate heterozygous isogenic offspring from oocytes that lacked or retained Eed. Females producing Eed wild-type (Eed-wt), Eed heterozygous (Eed-het), and Eed-homozygous (Eed-hom) oocytes were mated with wild-type males to produce offspring from oocytes with wt or het EED-dependent programming or from oocytes that lack EED-dependent programming, respectively. Eed-wt oocytes produce wild-type (WT) offspring (WT-wt control), Eed-het oocytes produce WT or HET offspring (WT-het and HET-het) from GV oocytes, and Eed-hom oocytes produce HET offspring (HET-hom). HET-het and HET-hom offspring are isogenic but were derived from oocytes that had different EED-dependent programming. (B) Cell cleavage and development times of embryos from Eed-wt or Eed-hom oocytes in ex vivo culture. Data is presented as time to reach 2-, 4-, 8-cell, morula (M), blastocyst (B), expanded blastocyst (EB), and hatched blastocyst (HB). *p<0.05, two-tailed student’s t-test, n=49 embryos from Eed-wt oocytes, 57 embryos from Eed-hom oocytes. (C) Time taken for expanded blastocysts to hatch. Data represents the time difference between hatched blastocysts and expanded blastocysts. *p<0.05, n=38 embryos from Eed-wt oocytes, 31 embryos from Eed-hom oocytes. (D) Proportion of embryos from Eed-wt or Eed-hom oocytes surviving to blastocyst. *p<0.05, Data represent the proportion of surviving embryos from each female, n=6 females. (E) Total number of cells per embryo. **p<0.005, n=17 embryos from Eed-wt oocytes, 30 embryos from Eed-hom oocytes. (F) Proportion of trophectoderm (TE) and inner cell mass (ICM) cells per embryo. Data represents the mean proportion of cells allocated to TE versus ICM for embryos from Eed-wt or Eed-hom oocytes. **p<0.05, n=17 embryos from Eed-wt oocytes, 28 embryos from Eed-hom oocytes. (G) Offspring litter size over time. ****p<0.0001. (H) Pie chart depicting the proportion of male and female HET-hom offspring at E17.5. N=32. For (B–G) a two-tailed student’s t-test was used. Error bars: mean ± SD.
Figure 1—figure supplement 1

Maternal Embryonic ectoderm development (Eed) deletion impacted pre-implantation development.
(A) Proportion of embryos from Eed wild-type (Eed)-wt or Eed-homozygous (Eed-hom) oocytes surviving to expanded blastocyst (left) and hatched blastocyst (right). Data represent the proportion of surviving embryos from each female, n=6 females. (B) Representative example of a blastocyst differentially stained with propidium iodide and bisbenzimide to identify inner cell mass (ICM; purple cells) and trophectoderm (TE; pink cells). (C) Proportion of TE and ICM cells per embryo. Data represents the mean proportion of cells allocated to TE versus ICM for embryos from Eed-wt or Eed-hom oocytes. **p<0.05, n=17 embryos from Eed-wt oocytes, 28 embryos from Eed-hom oocytes. (A, C): Two-tailed student’s t-test; Error bars represent mean ± SD.
Figure 2 with 1 supplement
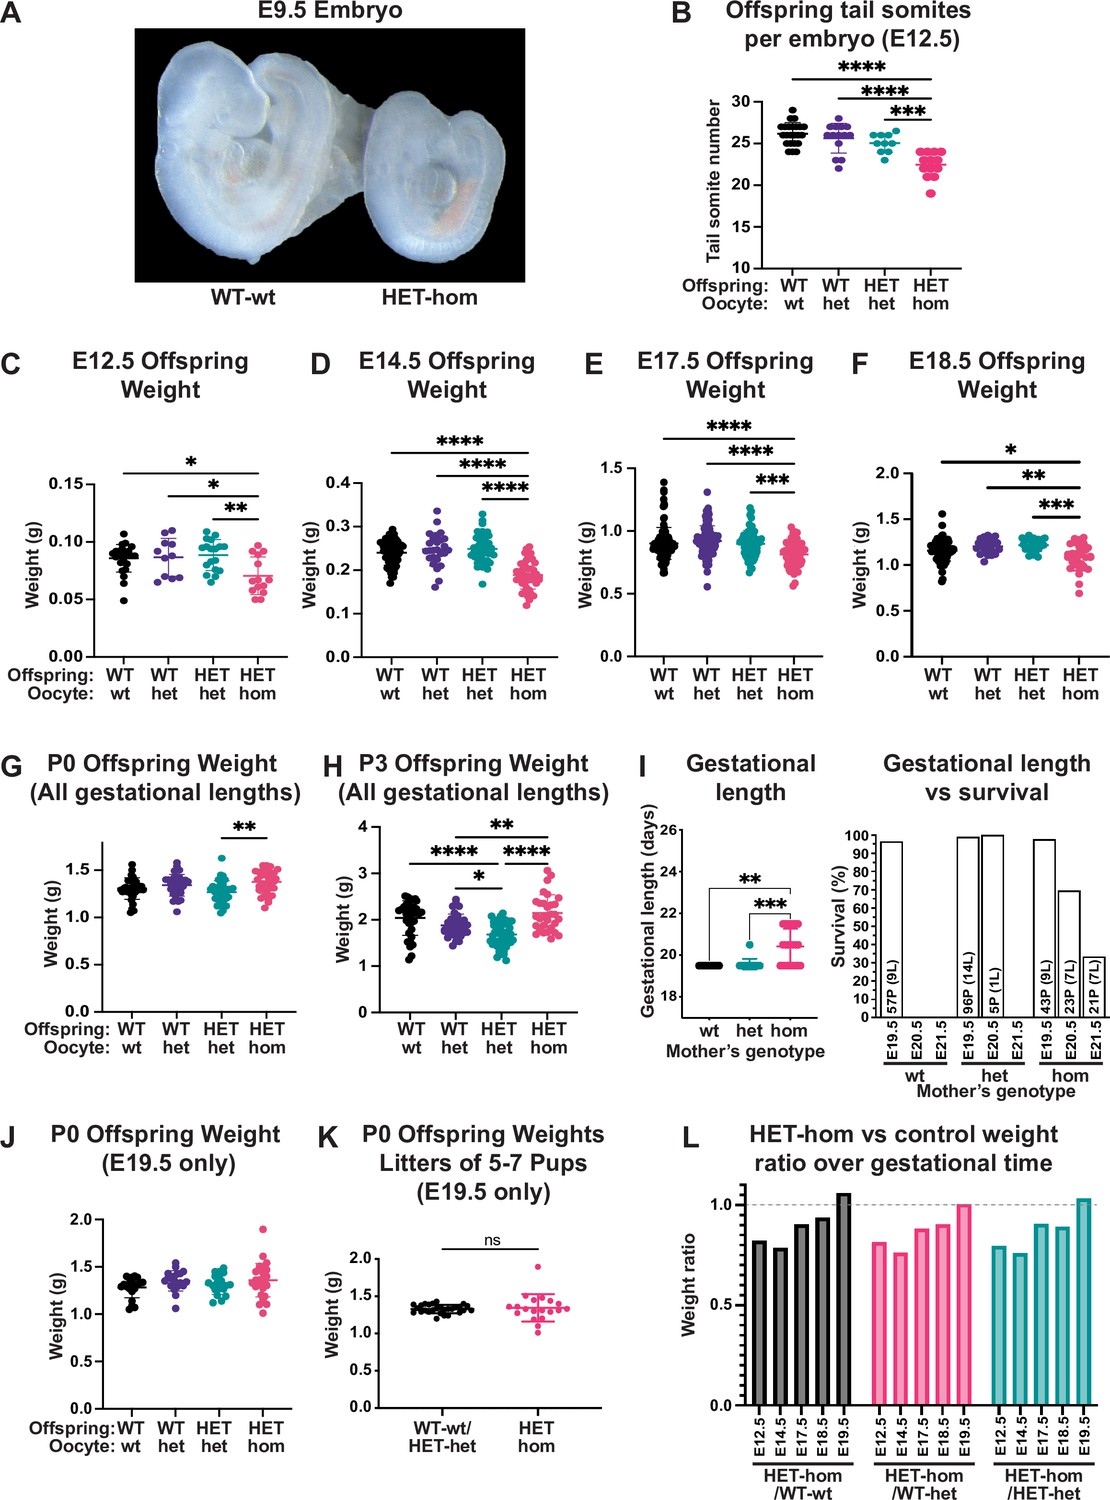
Loss of Embryonic ectoderm development (EED)-dependent oocyte programming resulted in fetal loss and offspring developmental delay.
(A) Representative wholemount images of E9.5 embryos. Images representative of 2–3 litters/genotype. (B) Number of tail somites in E12.5 Eed WT-wt, WT-het, HET-het and HET-hom embryos. ***p<0.0005, ****p<0.0001, n=10–23/genotype. (C–F) Fetal weight at E12.5, E14.5, E17.5, and E18.5. **p<0.005, ***p<0.0005, ****p<0.0001, n=11–117/genotype. (G–H) Offspring body weights at P0 and P3 from litters of all gestational lengths. *p<0.05, **p<0.005, ****p<0.0001, n=30–50/genotype. (I) Gestational length and survival in litters from Eed-wt, Eed-het, and Eed-hom oocytes. **p<0.01, ***p<0.001. Data for each genotype include: Eed-wt 57 pups (P) from 9 litters (L) all born on E19.5; Eed-het 96 pups from 14 litters born on E19.5 and five pups from 1 litter born on E20.5; Eed-hom 43 pups from 9 litters born on E19.5, 23 pups from 7 litters born on E20.5, and 21 pups from 7 litters born on E21.5. (J) Offspring body weight for litters born on E19.5. n=19–28/genotype. (K) Offspring body weights of litters containing 5–7 pups and were born on E19.5. ns = non-significant difference, unpaired t-test, n=19–28/group. (L) Ratios of HET-hom offspring weight to WT-wt, WT-het, and HET-het control weight at E12.5, E14.5, E17.5, E18.5, and E19.5. E19.5 data included only litters born on E19.5. (B–J) Statistically analysed using one-way ANOVA plus Tukey’s multiple comparisons. Error bars: mean ± SD.
Figure 2—figure supplement 1
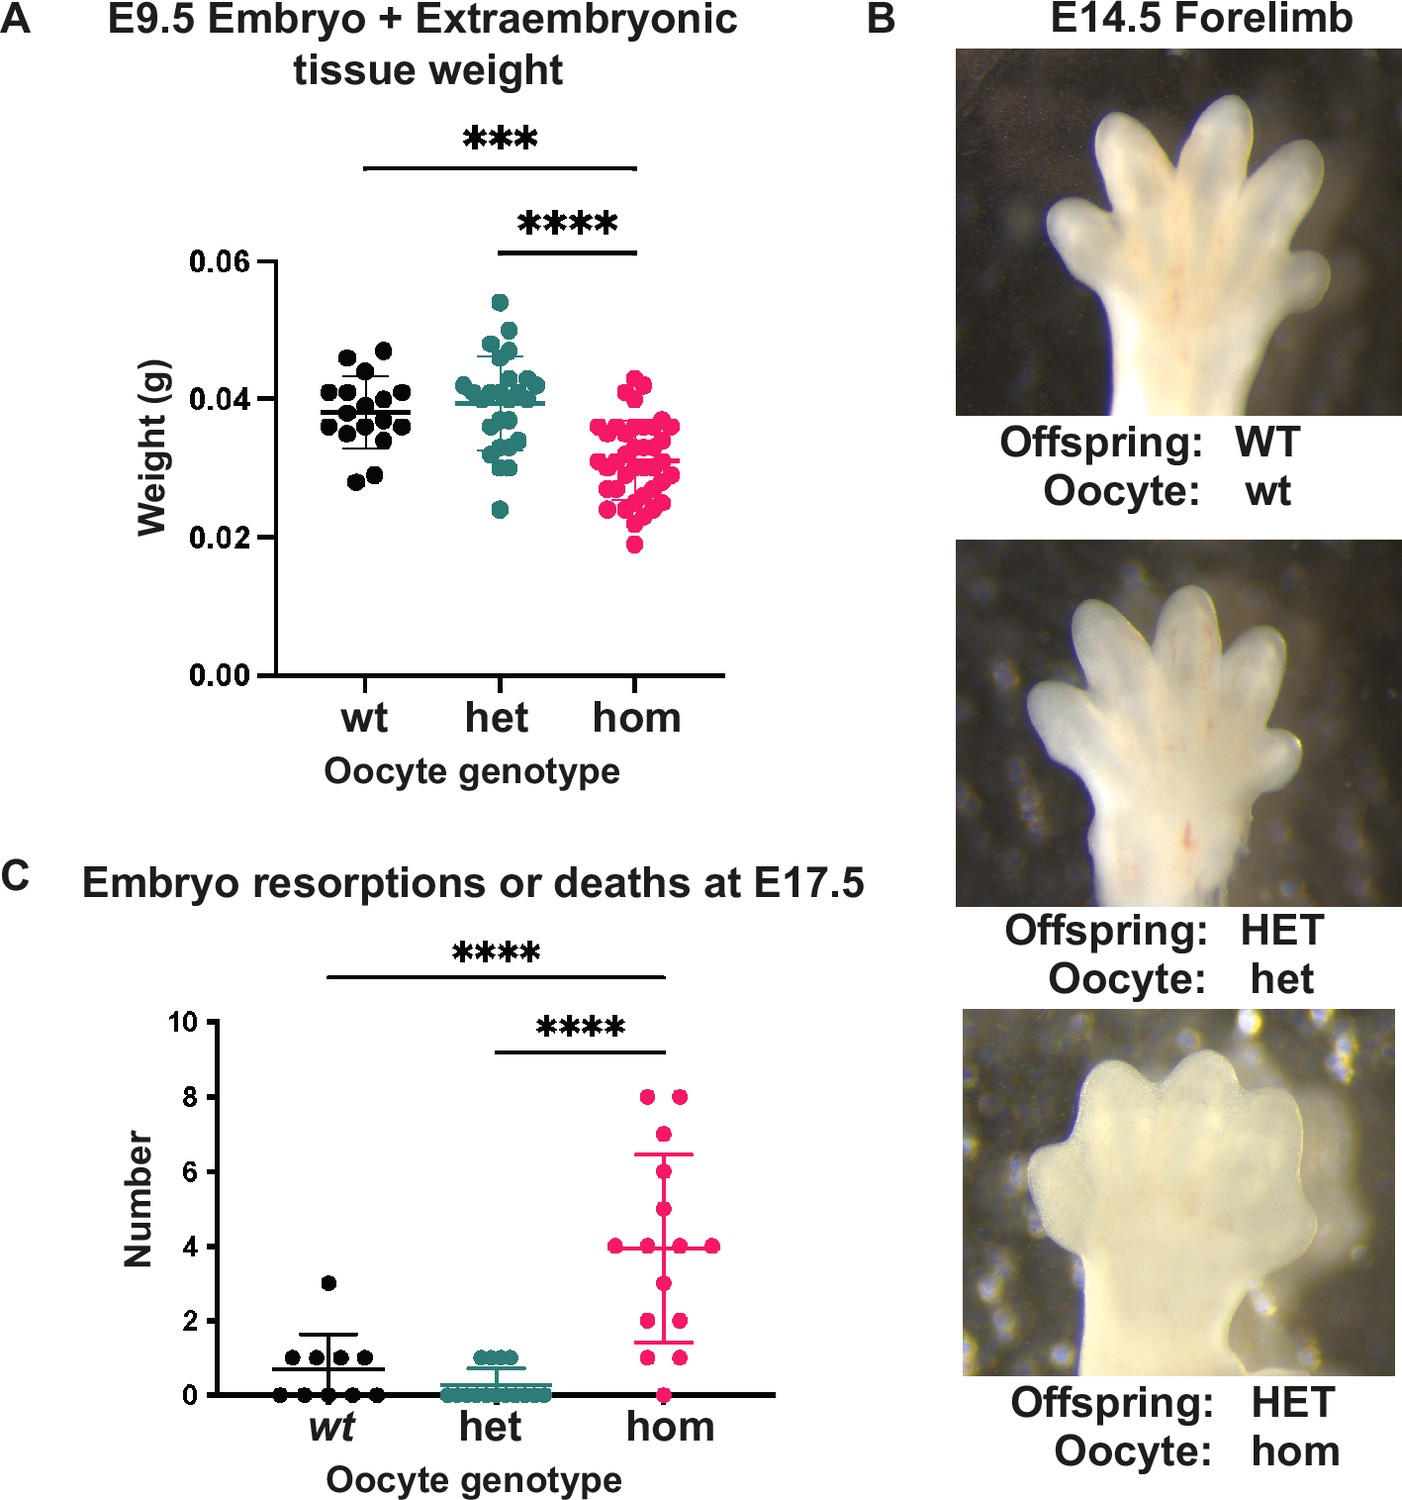
Loss of Embryonic ectoderm development (EED)-dependent oocyte programming altered fetal and neonatal development.
(A) Embryo and extraembryonic tissue weight at E9.5. ***p<0.0005, ****p<0.0001, n=17–40/genotype. (B) Representative wholemount images of E14.5 forelimbs reveal reduced inter-digital tissue regression in Eed HET-hom offspring. (C) Number of reabsorbed and/or dead embryos per litter at E17.5. ****p<0.0001, n=10–15 litters/genotype. (A, C) One-way ANOVA with Tukey’s multiple comparisons. Error bars represent mean ± SD.
Figure 3 with 1 supplement
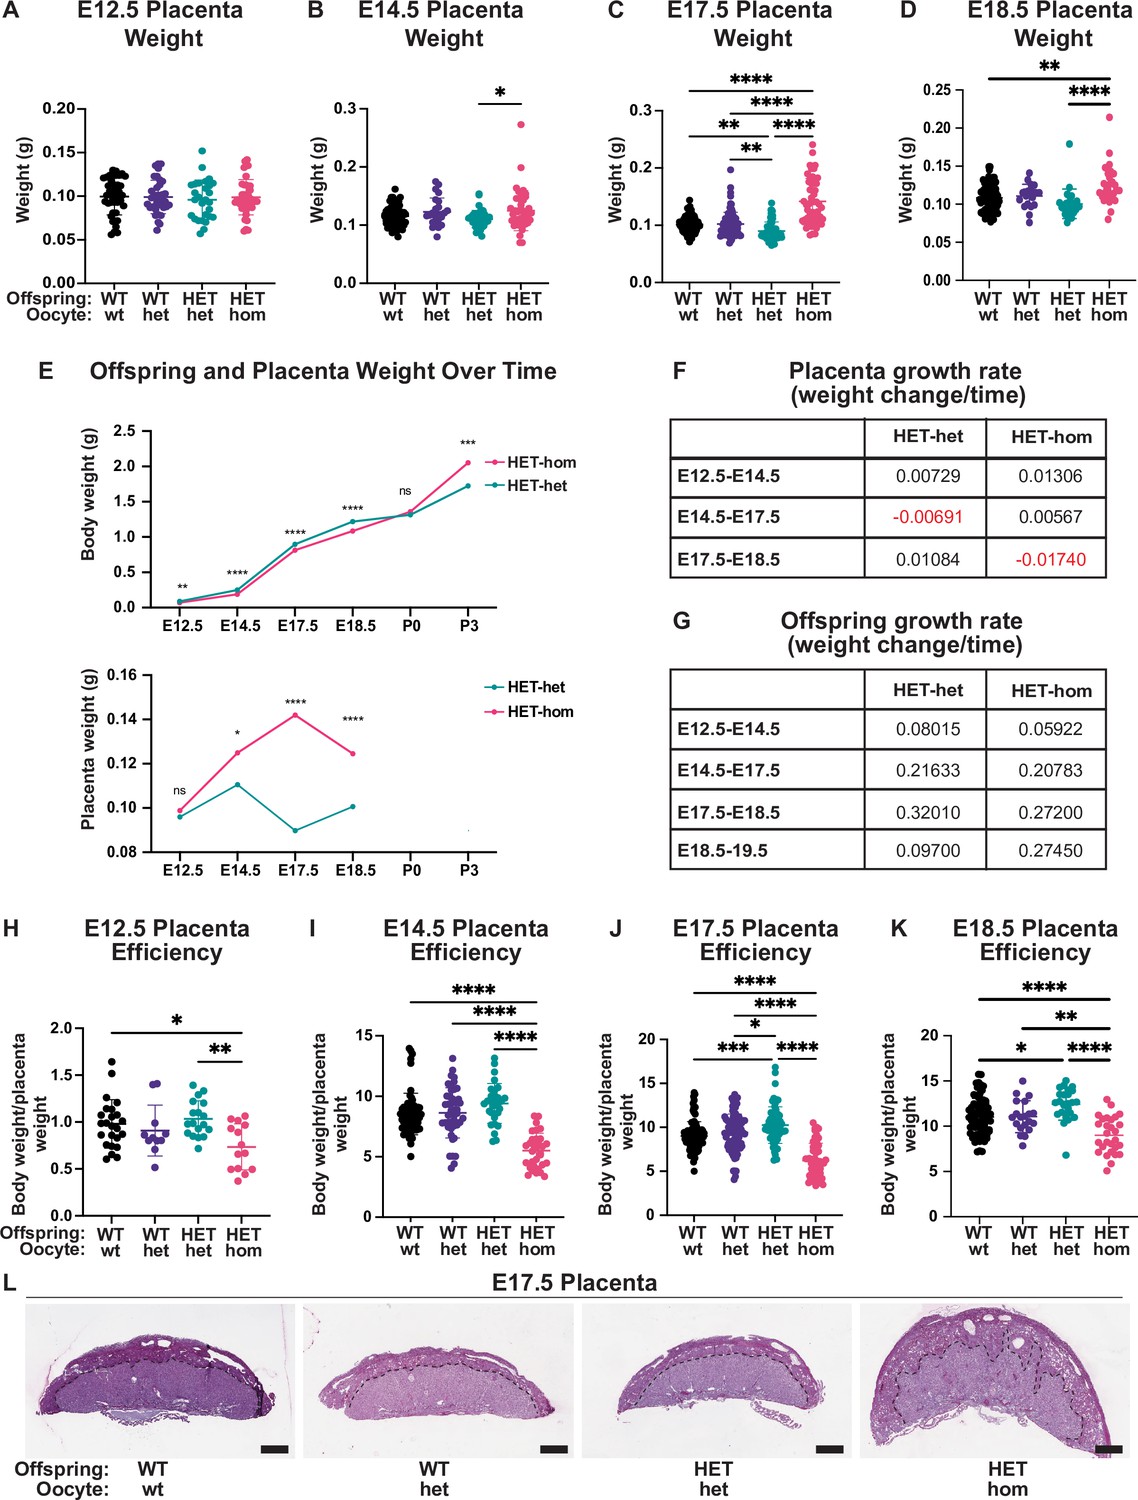
Placental differences observed in heterozygous offspring from oocytes that lacked Embryonic ectoderm development (Eed).
(A–D) Placental weight at E12.5, E14.5, E17.5, and E18.5, *p<0.05, **p<0.005, ****p<0.0001, n=20–110/genotype. (E) Heterozygous offspring and placenta average weight over time. ns = non-significant difference, *p<0.05, **p<0.005, ***p<0.0005, ****p<0.0001 unpaired t-test, n=14–64/genotype. (F–G) Tables depicting Eed HET-het and HET-hom offspring and placenta growth rates across three to four time points throughout gestation. (H–K) Ratio of placental weight to fetal weight at E12.5, E14.5, E17.5, and E18.5. *p<0.05, **p<0.005, ***p<0.0005, ****p<0.0001, n=11–108/genotype. (L) Placental cross-sections at E17.5 stained with periodic shiff (PAS). Scale bars = 800 μm. (A–D, H–K). One-way ANOVA with Tukey’s multiple comparisons. Error bars: mean ± SD.
Figure 3—figure supplement 1
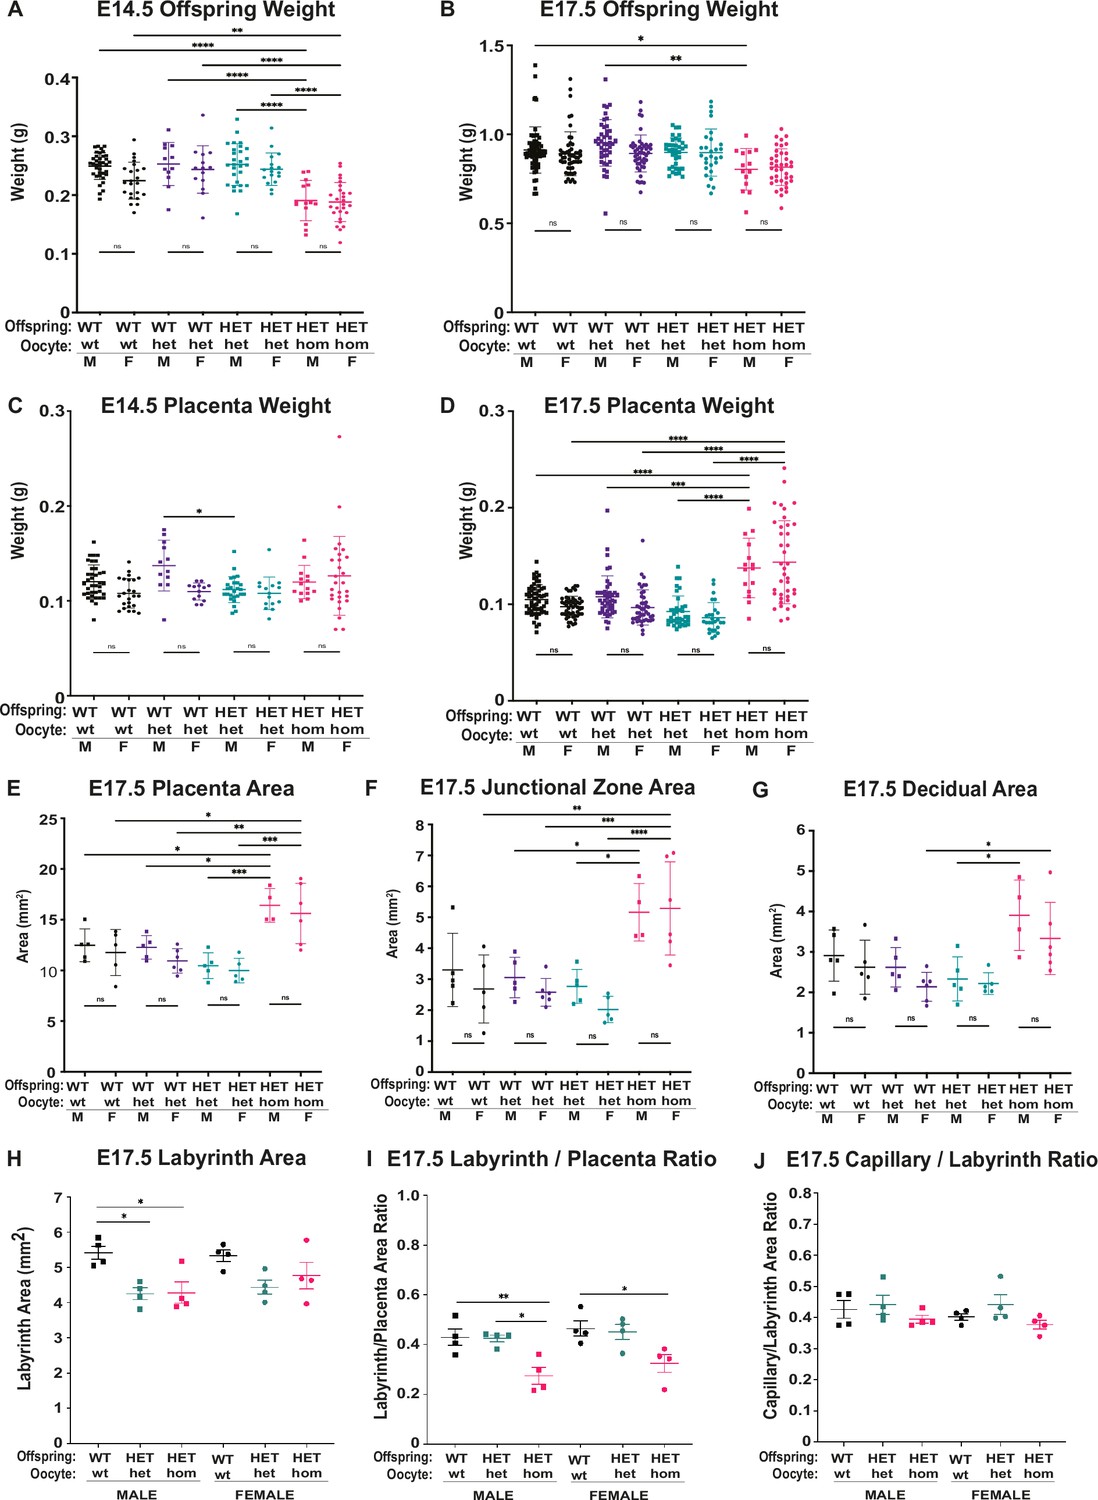
Deletion of Embryonic ectoderm development (Eed) in the oocyte resulted in similar changes in male and female offspring and placental growth at E14.5 and E17.5.
(A–D) Separated female and male weight data for Eed WT-wt, WT-het, HET-het and HET-hom offspring and placenta at E14.5 and E17.5 n=12–63/genotype. (E–H) Separated female and male cross-sectional area data for placenta, junctional zone, and decidua based on assessment of hematoxylin and eosin (H&E) stained sections through the midpoints of female and male WT-wt, WT-het, HET-het, and HET-hom placenta at E14.5 and E17.5 shown in Figure 4. n=4–6/genotype. (H–J) Separated female and male cross-sectional area data and ratios for labyrinth and area occupied by CD31 positive capillaries (right images) from Figure 5c; (H) labyrinth area (I) labyrinth/placenta area ratio (J) capillary/labyrinth area ratio. (A–H) *p<0.05, **p<0.01, ***p<0.0005, ****p<0.0001, One-way ANOVA with Tukey’s multiple comparisons. Error bars represent mean ± SD.
Figure 4 with 1 supplement
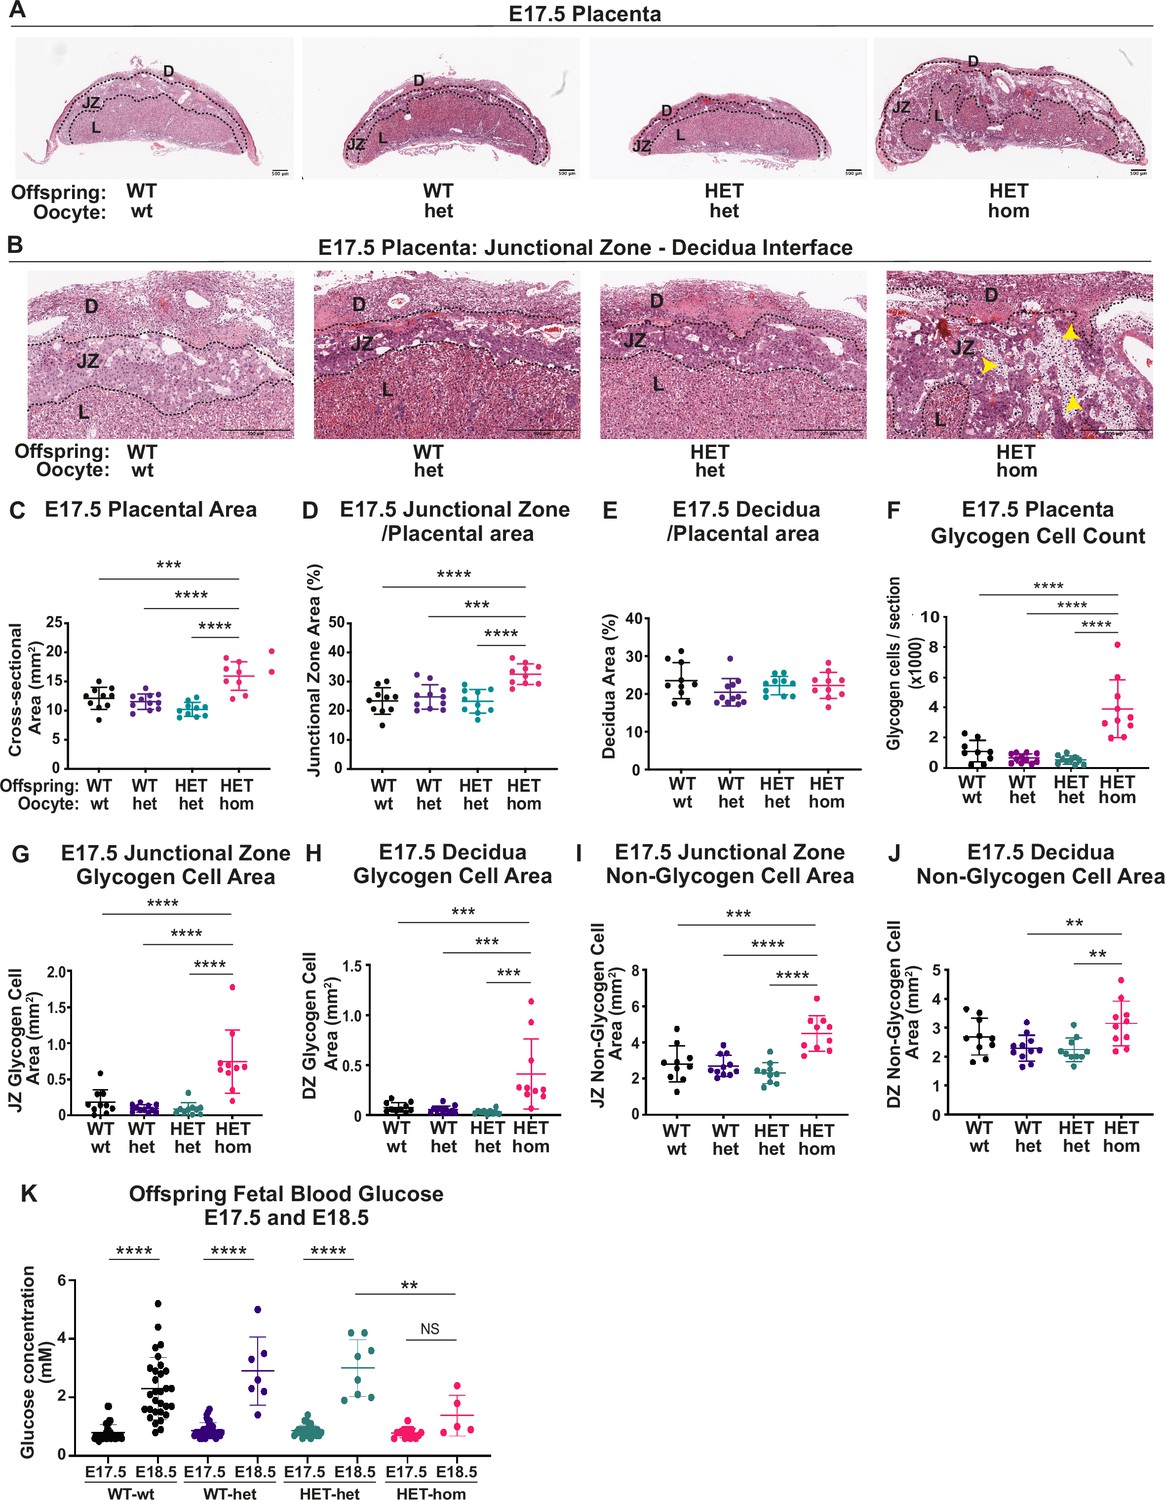
Deletion of embryonic ectoderm development (Eed) in the oocyte altered placental morphology in offspring.
(A,B) Placental cross-sections at E17.5 stained with hematoxylin and eosin (H&E), black dotted line indicates the borders between the decidua (D), the junctional zone (JZ), and the labryrinth (L). Images are representative of four placentas from 10 biological replicates. Yellow arrows indicate expanded regions of glycogen cells in Eed HET-hom placentas. Scale bars = 500 μm. (C–E) Cross-sectional area of the placenta and percentage of placental cross-sectional area occupied by the junctional zone and decidua at E17.5. (F) Average number of glycogen cells/E17.5 placenta cross-section. (G–J) Area occupied by glycogen and non-glycogen enriched cells in the junctional zone and decidua at E17.5 For C-L: **p<0.005, ***p<0.0005, ****p<0.0001, n=10/genotype. (K) E17.5 and E18.5 fetal offspring blood glucose concentration. *p<0.05, n=5–30/genotype. All statistical analyses are one-way ANOVA plus Tukey’s multiple comparisons. Error bars: mean ± SD.
Figure 4—figure supplement 1
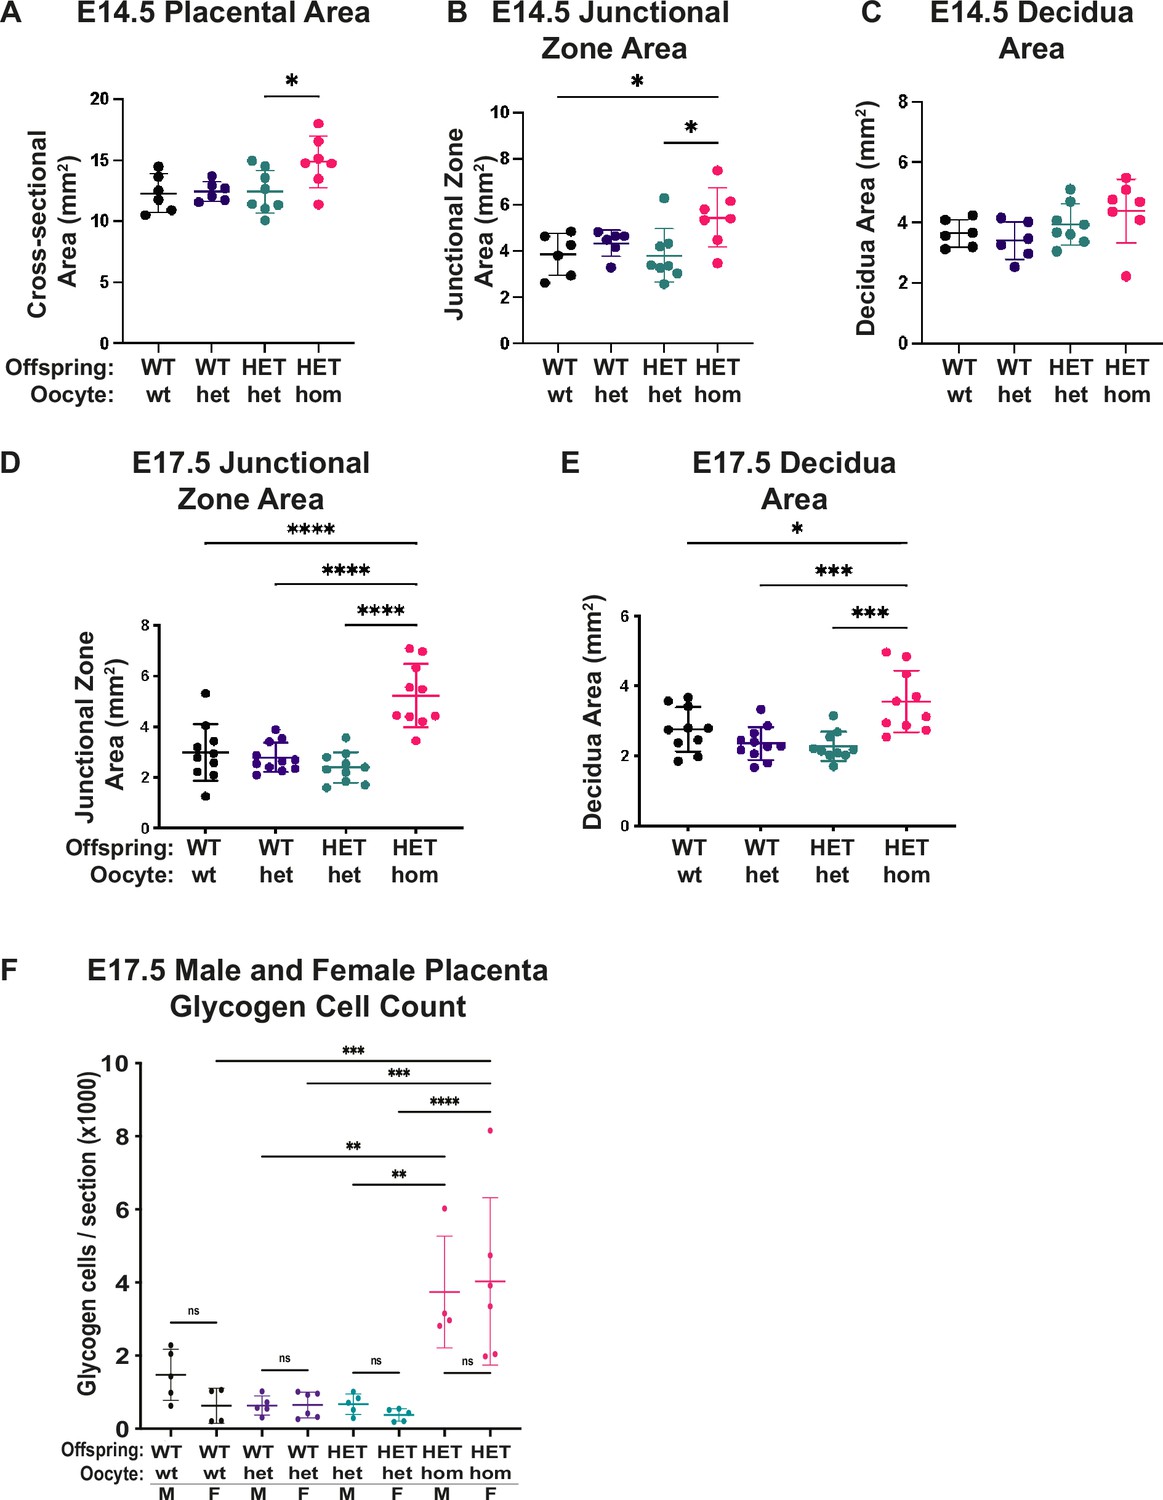
Deletion of Embryonic ectoderm development (Eed) in the oocyte caused general placental hyperplasia, with pronounced impacts on junctional zone expansion and increased glycogen cell count.
(A–E) Cross-sectional areas of placenta, junctional zone, and decidua in sections through the midpoints of Eed WT-wt, WT-het, HET-het, and HET-hom placenta at E14.5 and E17.5 (sexes combined). n=6–11/genotype. (F) Glycogen cell count in sections through the midpoints of female and male WT-wt, WT-het, HET-het and HET-hom placenta at E17.5. n=4–6/genotype. (A–F) *p<0.05, **p<0.01, ***p<0.0005, ****p<0.0001, one-way ANOVA with Tukey’s multiple comparisons. Error bars represent mean ± SD.
Figure 5
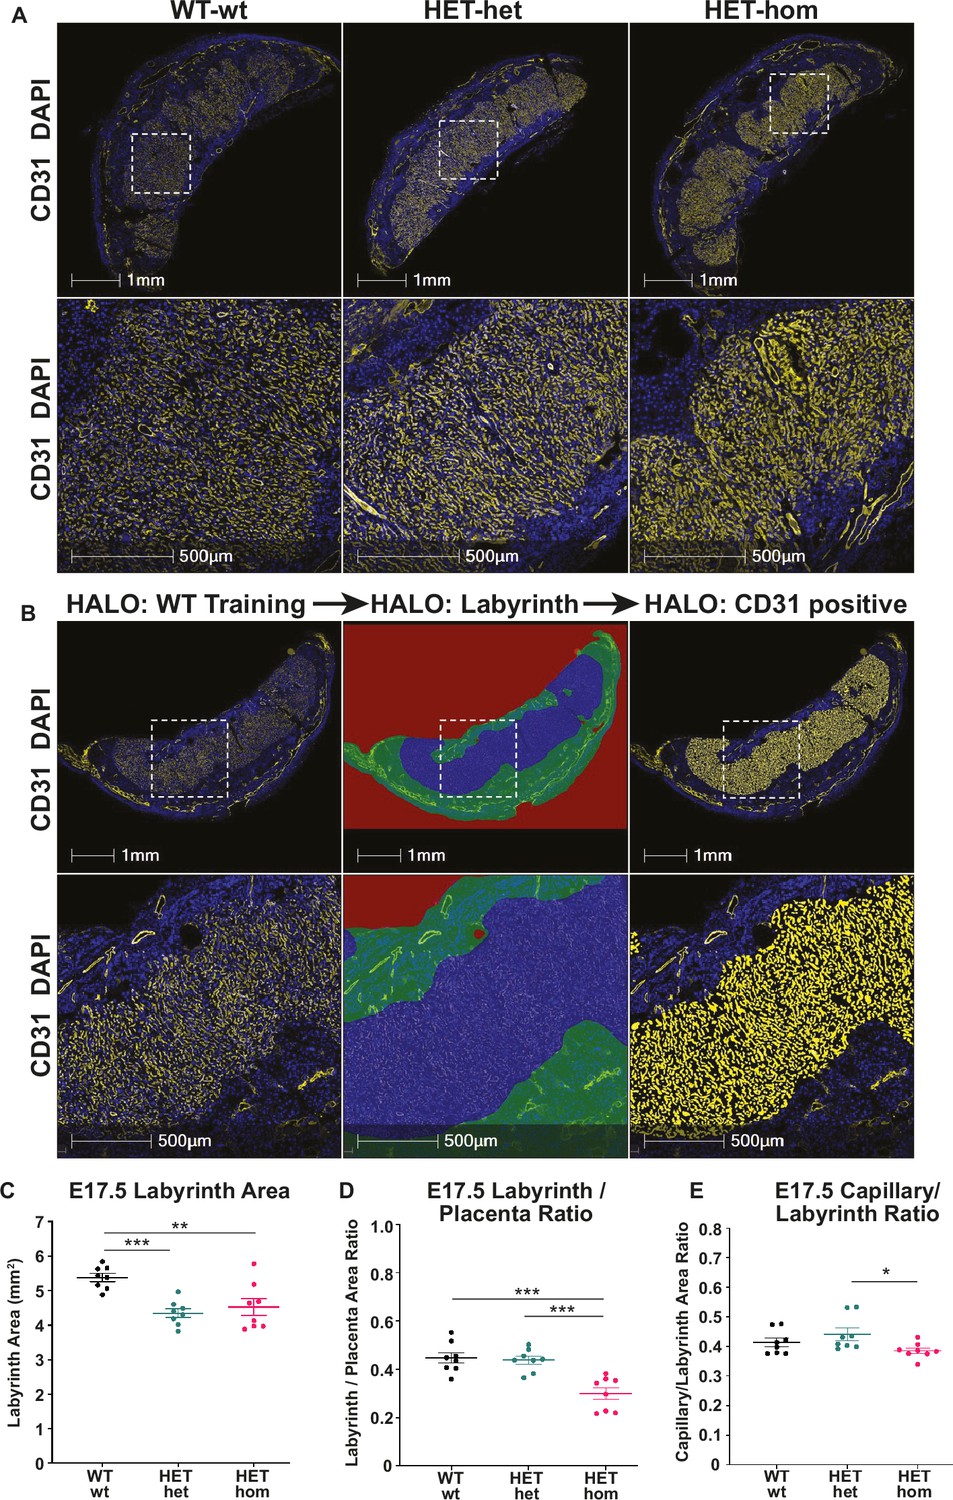
Labyrinth area and capillary/labyrinth ratios were reduced in offspring from Embryonic ectoderm development (Eed)-null oocytes.
(A) Immunofluorescent analysis of male and female E17.5 placental sections through the middle of Eed WT-wt, HET-het and HET-hom placentas using CD31 to detect placental vasculature and DAPI to stain cell nuclei. (B) Examples of the strategy used to quantitatively analyse the total placental area and the CD31 positive staining in the labyrinth using CD31 staining (left images), the total labyrinth area, with non-capillary vasculature excluded (middle images), and the total labyrinth area and area occupied by CD31 positive capillaries (right images). (C) Labyrinth area; (D) labyrinth placenta ratio; (E) capillary/labyrinth ratio. One-way ANOVA plus Tukey’s multiple comparisons. *p<0.05, **p<0.005, ***p<0.001, n=8 WT-wt (four male and four female; nine and eight sections), eight HET-het (four male and four female; 9 and 12 sections) and 8 HET-hom (four males and four femalse; 16 and 8 sections) placentas. Error bars: mean ± SD.
Figure 6 with 3 supplements
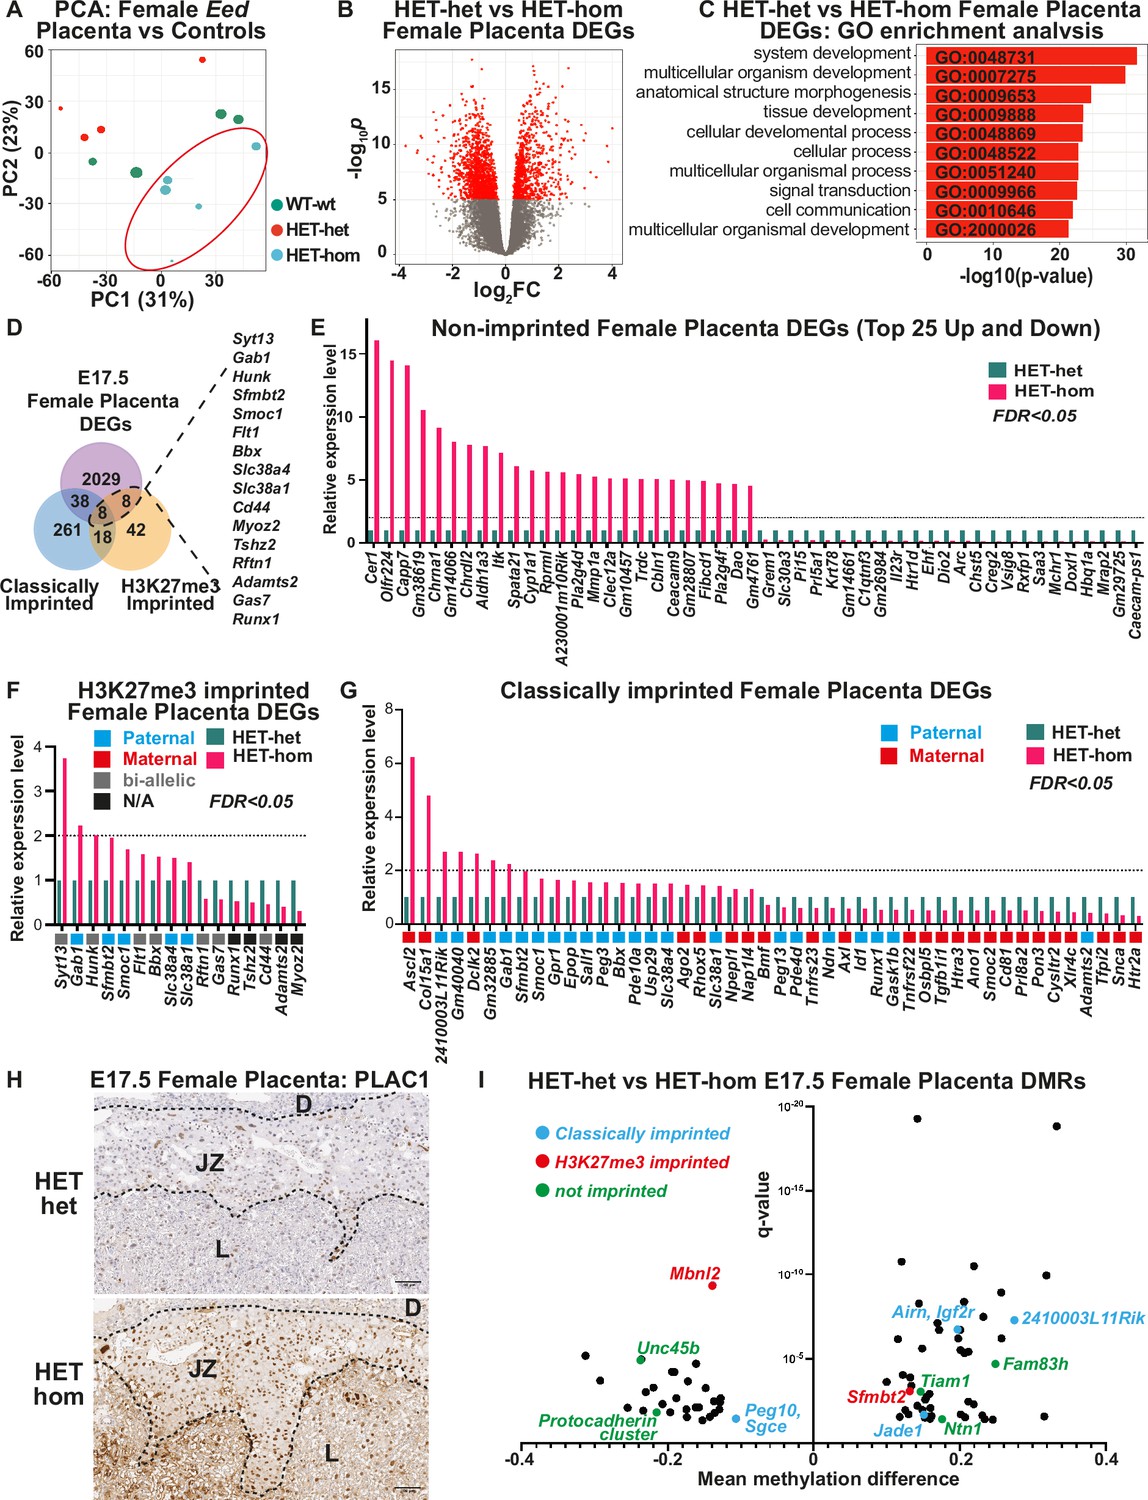
Loss of Embryonic ectoderm developmen (EED)-dependent oocyte programming altered placental transcription.
(A) Principal Component Analysis (PCA) of E17.5 female Eed HET-hom, HET-het, and WT-wt placenta bulk RNA-seq data. n=4–5/genotype. (B) Differential gene expression analysis of E17.5 HET-het vs HET-hom placenta represented by a volcano plot showing logFC against statistical significance. Genes with false discovery rate (FDR)-adjusted FDR <0.05 are coloured in red. Deletion of Eed in the oocyte resulted in 2083 differentially expressed genes (DEGs) in HET-hom placenta (Eed placental DEGs). (C) GO enrichment analysis of HET-het vs HET-hom DEGs representing the top 10 significantly different biological processes impacted. (D) Venn analysis of DEGs identified between E17.5 female HET-het and HET-hom placentas showing non-imprinted, classically imprinted, and H3K27me3 imprinted genes. (E–G) Relative transcription levels of female E17.5 HET-hom placental DEGs including (E) the top 25 non-imprinted genes that were higher and lower in HET-hom vs HET-het samples, (F) H3K27me3 imprinted genes identified (G) Classically imprinted genes identified. Only DEGs with significant expression differences and an FDR <0.05 are shown. In (F) and (G) the typical maternal (red) /paternal (blue)/bi-allelic (gray) expression pattern is indicated below each graph. The dotted black line shows the level for a twofold increase in expression. (H) Representative immunohistochemical analysis of PLAC1 (encoded by the X-linked gene Plac1) in mid-cross sections of E17.5 HET-het and HET-hom placentas. The black dotted lines show boundaries between the decidua (D), the junctional zone (JZ), and the labryrinth (L). n=4/genotype. Scale bars = 500 um (top), 100 um (bottom). (I) Mean methylation difference vs significance for Differentially methylated CpG-rich regions (DMRs) in E17.5 female HET-het vs HET-hom placentas with DMRs within 1 kb of classically imprinted (blue), histone 3 Lysine 27 trimethylation (H3K27me3)-imprinted (red), and differentially expressed non-imprinted genes (green) shown.
Figure 6—figure supplement 1

Transcriptional analysis using a confidence level of p<0.05 revealed commonly altered genes between E17.5 female vs male Eed HET-hom placentas.
(A) Principal Component Analysis (PCA) of E17.5 male Eed HET-hom, HET-het and WT-wt placenta RNA-seq data. n=3–4/genotype. (B) Venn diagram showing overlap between E17.5 female and male placental differentially expressed genes (DEGs) using p<0.05 confidence level, without False Detection Rate applied.
Figure 6—figure supplement 2
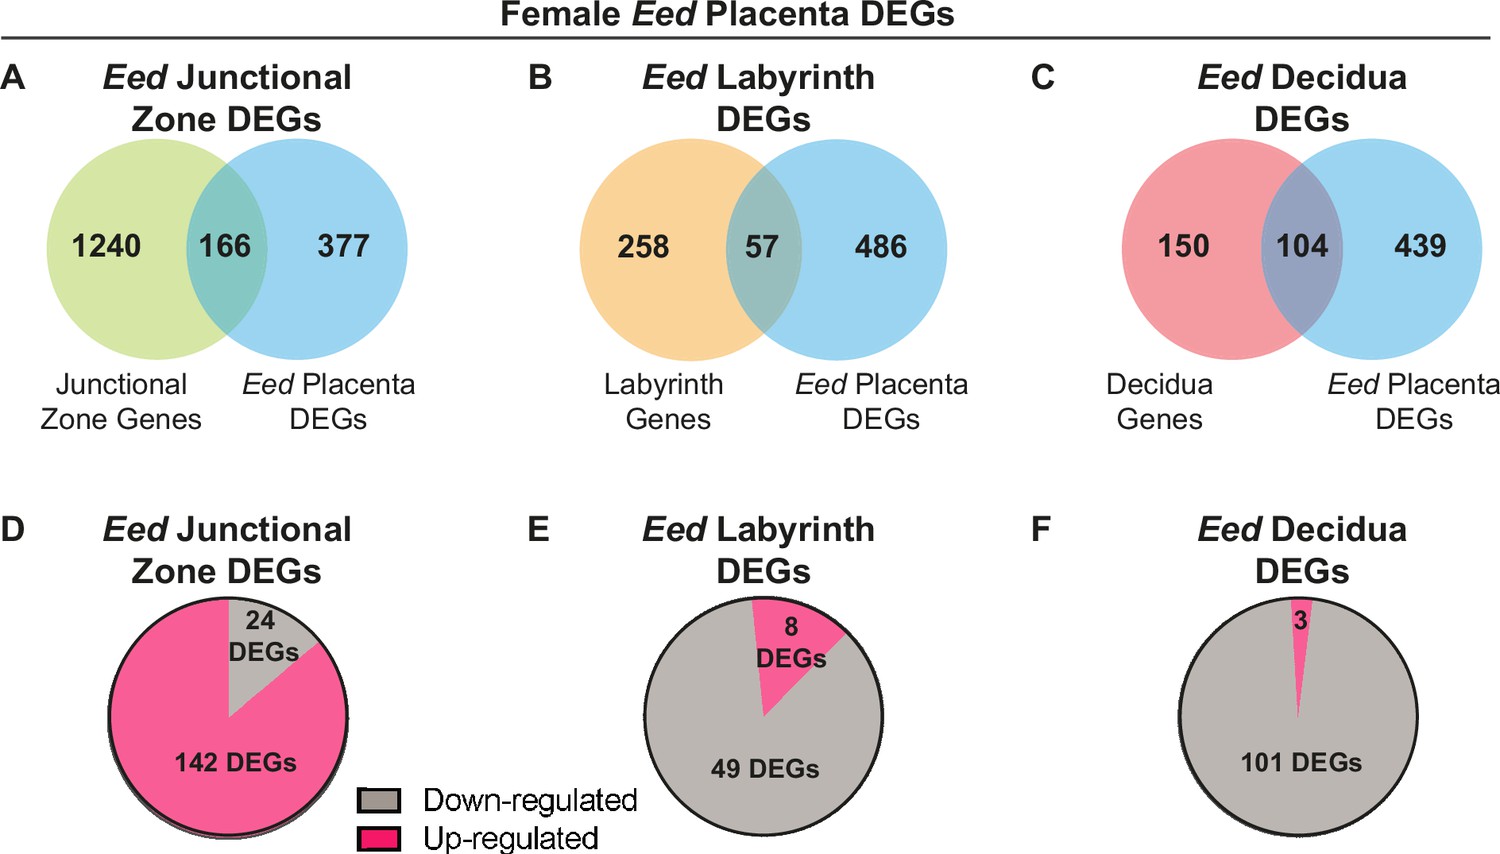
Comparison of female placenta differentially expressed genes (DEGs) revealed differential transcriptional impacts in the junctional zone, labyrinth, and decidua in Eed HET-hom placentas.
(A–C) Overlap of placental DEGs with genes preferentially expressed in the junctional zone (Eed junctional zone DEGs), labyrinth (Eed labyrinth DEGs) or decidua (Eed decidua DEGs) in E14.5 wild-type placentas. E14.5 tissue-specific data from Han et al., 2018, Cell (Ref 36). (D–F) Number of Eed junctional zone DEGs, Eed labyrinth DEGs, and Eed decidua DEGs with increased or decreased expression in HET-hom placentas.
Figure 6—figure supplement 3

Loss of Embryonic ectoderm development (EED) in the oocyte increased PLAC1 expression in the developing placenta, but did not result in overrepresentation for increased expression of X-linked genes.
Representative images showing immunohistochemical analysis of PLAC1 in mid-cross sections of female Eed WT-wt, HET-het and HET-hom placentas. The black dotted lines show boundaries between the decidua (D), the junctional zone (JZ), and the labyrinth (L). n=4/genotype. Scale bars = 500 um (top), 100 um (bottom).
Figure 7
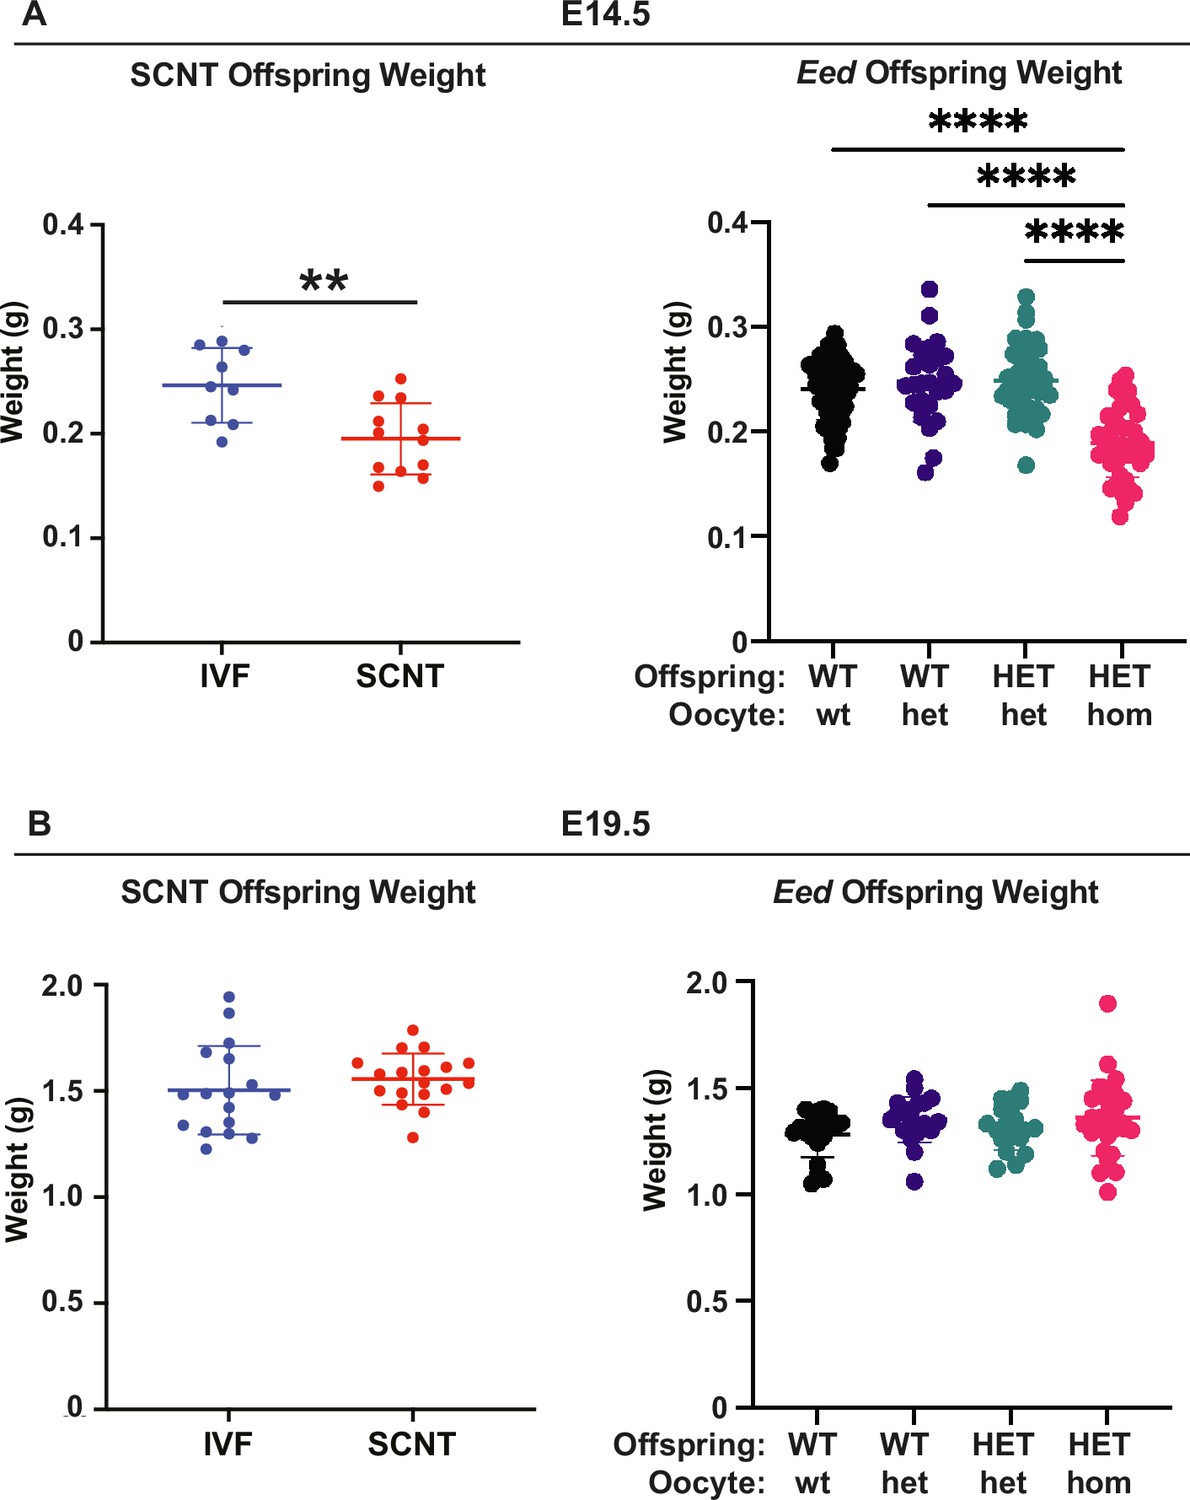
Eed HET-hom offspring demonstrate similar growth profiles to somatic cell nuclear transfer (SCNT) mice.
Comparison of fetal weights of SCNT mice from Xie et al., (Xie et al., 2022) and offspring from the Eed-ZP3-Cre mouse model at (A) E14.5 and (B) E19.5. N values - E14.5: IVF 9; SCNT 12; Eed WT-wt 64; WT-het 26; HET-het 45; HET-hom 43. E19.5 IVF 17; SCNT 18; Eed WT-wt 21; WT-het 20; HET-het 19; HET-hom 28. **p<0.005, ****p<0.0001. One-way ANOVA with Tukey’s multiple comparisons. Error bars: mean ± SD.
Figure 8
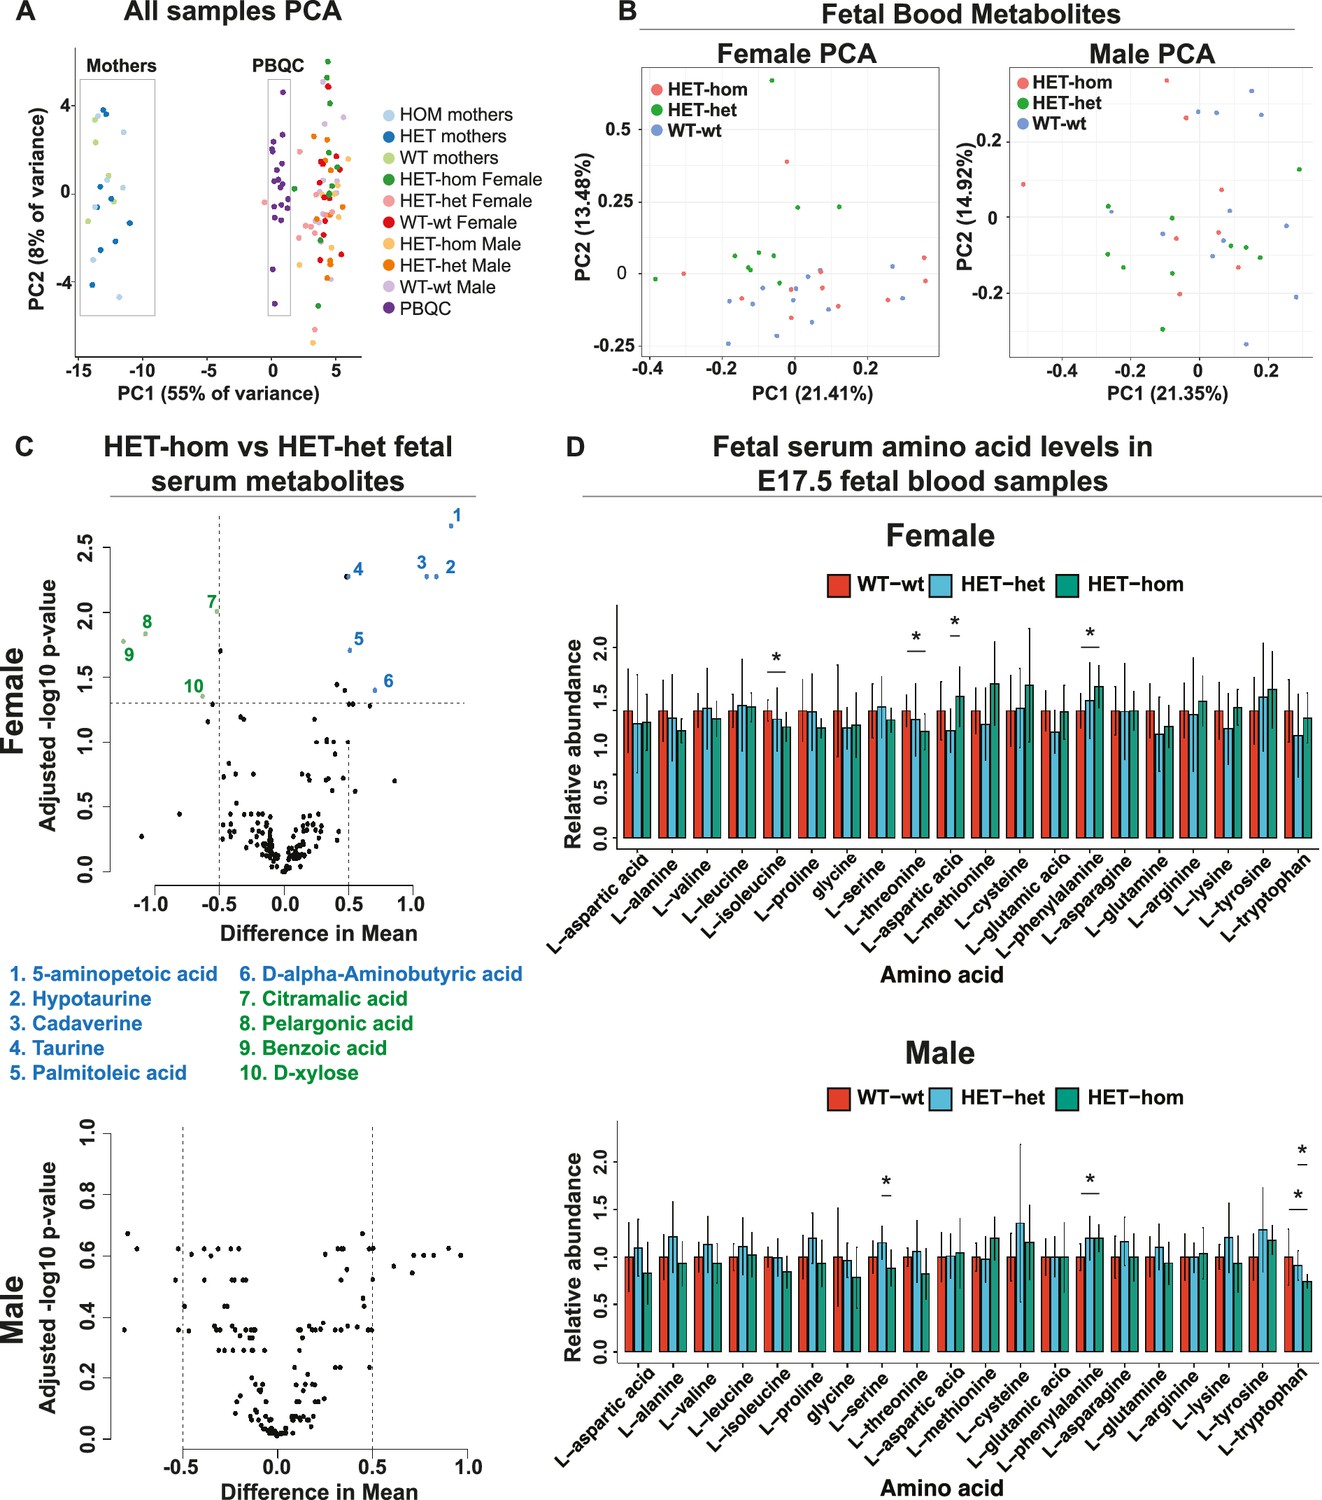
Loss of Embryonic ectoderm development (EED) in the oocyte did not overtly affect the fetal blood metabolomic state in late gestation offspring.
(A) Principal component analysis (PCA) of male and female E17.5 fetal serum samples, matched maternal serum samples, and pooled serum quality controls (B) PCA plots for metabolites in male and female fetal serum samples from Eed WT-wt, HET-het and HET-hom offspring. (C) Volcano plots showing significant differences and difference in mean levels for metabolites and relative amino acid levels in male and female HET-hom vs HET-het fetal serum samples (D) Relative serum levels for all amino acids in female and male WT-wt, HET-het, and HET-hom offspring. Students t-test. *p<0.05; N=8–12. Error bars: mean ± SD. (A–D) Total sample set: 85 samples: n=8–12 for fetal serum samples (Female: 12 WT-wt; 10 HET-het; 12 HET-hom. Male: 12 WT-wt; 10 HET-het; 8 HET-hom). n=5–9 for maternal serum samples (5 wt; 9 het; 7 hom). Of 356 metabolites tested, 160 were reliably detected in the fetal serum samples.
Figure 9
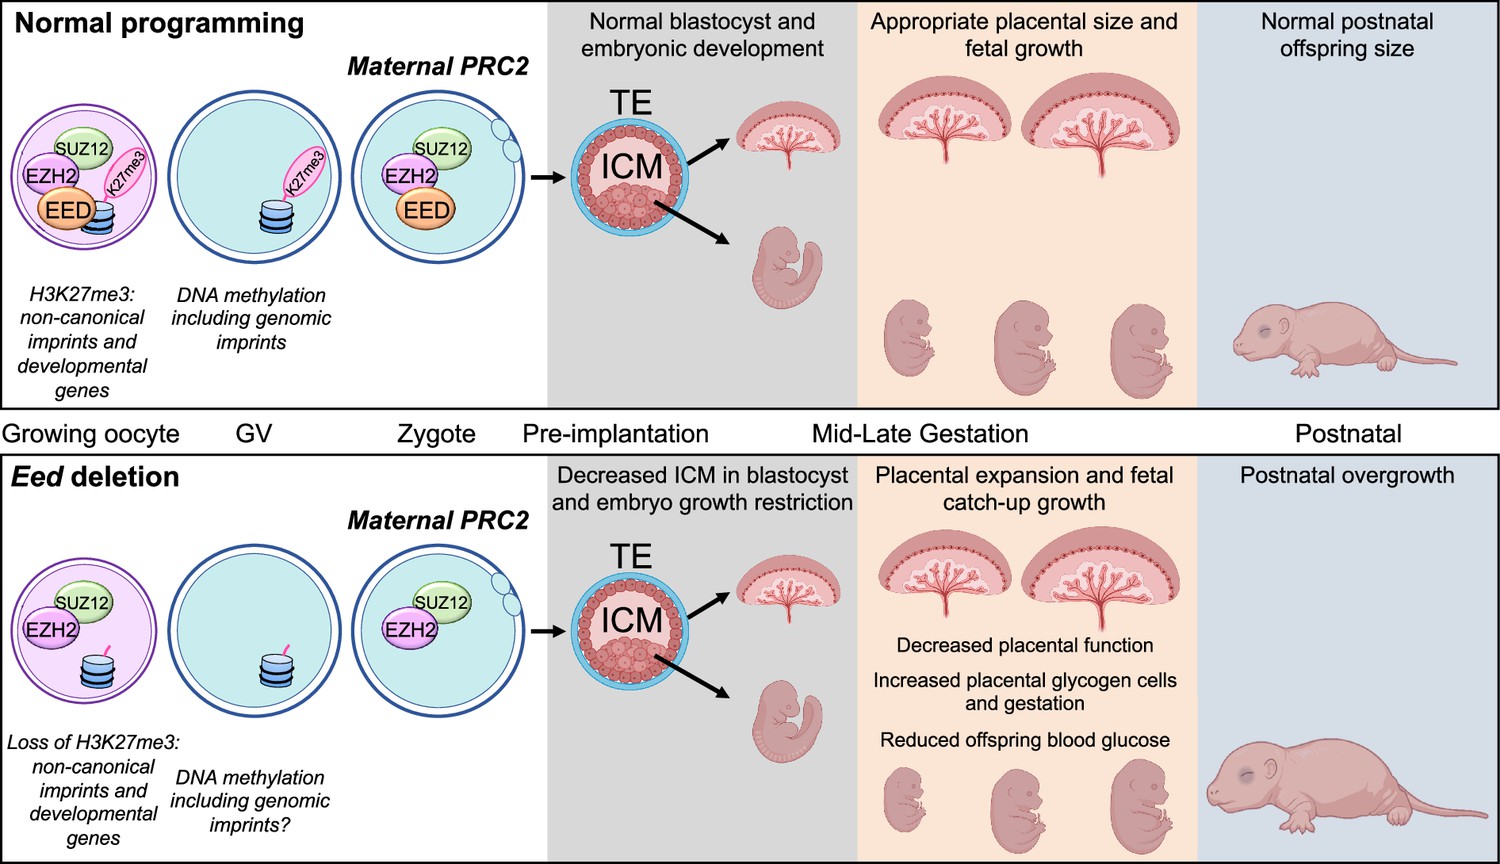
Summary of the placental and offspring growth response due to Embryonic ectoderm development (EED) loss in the oocyte.
During oocyte growth, all three subunits of polycomb repressive complex 2 (PRC2) are present at the primary to secondary stages, which is important for the silencing of developmental genes and Histone 3 Lysine 27 trimethylation (H3K27me3)-dependent imprinting (Inoue et al., 2017; Inoue et al., 2018; Matoba et al., 2022; Jarred et al., 2022). Deletion of Eed in oocyte results in loss of maternal H3K27me3 and PRC2, early growth restriction, followed by placental hyperplasia and late gestation fetal catch-up growth, outcomes consistent with loss of H3K27me3-dependent imprinting observed in SCNT offspring (Matoba et al., 2018; Inoue et al., 2020; Wang et al., 2020). Placentas generated from oocytes lacking EED have expanded glycogen-enriched cells in the junctional zone and significant gene dysregulation in the placenta. Despite placental hyperplasia and reduced placental efficiency late in gestation, offspring catch-up growth observed in this model may be explained by loss of imprinting for Slc38a4, increased placental amino acid transport, and extended gestational length, explaining why these offspring are overgrown immediately after birth (Prokopuk et al., 2018).
Additional files
-
Supplementary file 1
Summary of genomic and metabolomic data collected from offspring generated from Eed wild-type (Eed-wt), Eed heterozygous (Eed-het), and Eed homozygous (Eed-hom) oocytes.
(A) Eed Placenta differentially expressed genes (DEGs) - List of significant Eed female Placenta DEGs (HET-hom vs HET-het; false discovery rate, FDR <0.05; 2083 DEGs) (B) Differential Gene Expression Analysis Male HET-hom Placenta vs HET-het Placenta (No FDR; p<0.05) (C) Differential Gene Expression Analysis Female HET-hom vs HET-het Placenta (No FDR; p<0.05) (D) Genes Commonly Differentially Expressed in Male and Female HET-hom vs HET-het Placenta (No FDR; P<0.05) (E) Eed Placenta DEGs vs E14.5 single-cell RNA-seq: Comparison of Eed Placenta DEGs list with published single-cell RNA-seq data from E14.5 C57BL/6 placentas (F) Eed Placenta DEGs vs Imprinted genes: Comparison of Eed Placenta DEGs vs Mouse Imprinted genes (G) Eed Placenta DEG relative enrichment per chromosome (H) Eed Placental DMRs HET-het vs HET-hom: List of significant Eed female placenta differentially methylated regions (FDR/q<0.05). (I) Eed Placental DMRs WT-wt vs HET-hom: List of significant Eed female placenta differentially methylated regions (FDR/q<0.05). (J) Eed Placental DMRs WT-wt vs HET-het: List of significant Eed female placenta differentially methylated regions (FDR/q<0.05). (K) Metabolites detected at significantly different levels between E17.5 female HET-hom and HET-het fetal blood samples (FDR <0.05) (L) Metabolites detected at significantly different levels between E17.5 female HET-hom and WT-wt fetal blood samples (FDR <0.05) (M) Metabolites detected at significantly different levels between E17.5 female HET-het and WT-wt fetal blood samples (FDR <0.05).
- https://cdn.elifesciences.org/articles/81875/elife-81875-supp1-v2.xlsx
-
MDAR checklist
- https://cdn.elifesciences.org/articles/81875/elife-81875-mdarchecklist1-v2.pdf
Download links
A two-part list of links to download the article, or parts of the article, in various formats.
Downloads (link to download the article as PDF)
Open citations (links to open the citations from this article in various online reference manager services)
Cite this article (links to download the citations from this article in formats compatible with various reference manager tools)
Fetal growth delay caused by loss of non-canonical imprinting is resolved late in pregnancy and culminates in offspring overgrowth
eLife 13:e81875.
https://doi.org/10.7554/eLife.81875


