Prediction of diabetic kidney disease risk using machine learning models: A population-based cohort study of Asian adults
- Singapore Eye Research Institute, Singapore
- Ophthalmology and Visual Sciences Academic Clinical Program, Duke-NUS Medical School, Singapore
- Department of Statistics and Data Science, National University of Singapore, Singapore
- Department of Renal Medicine, Singapore General Hospital, Singapore
Figures
Figure 1
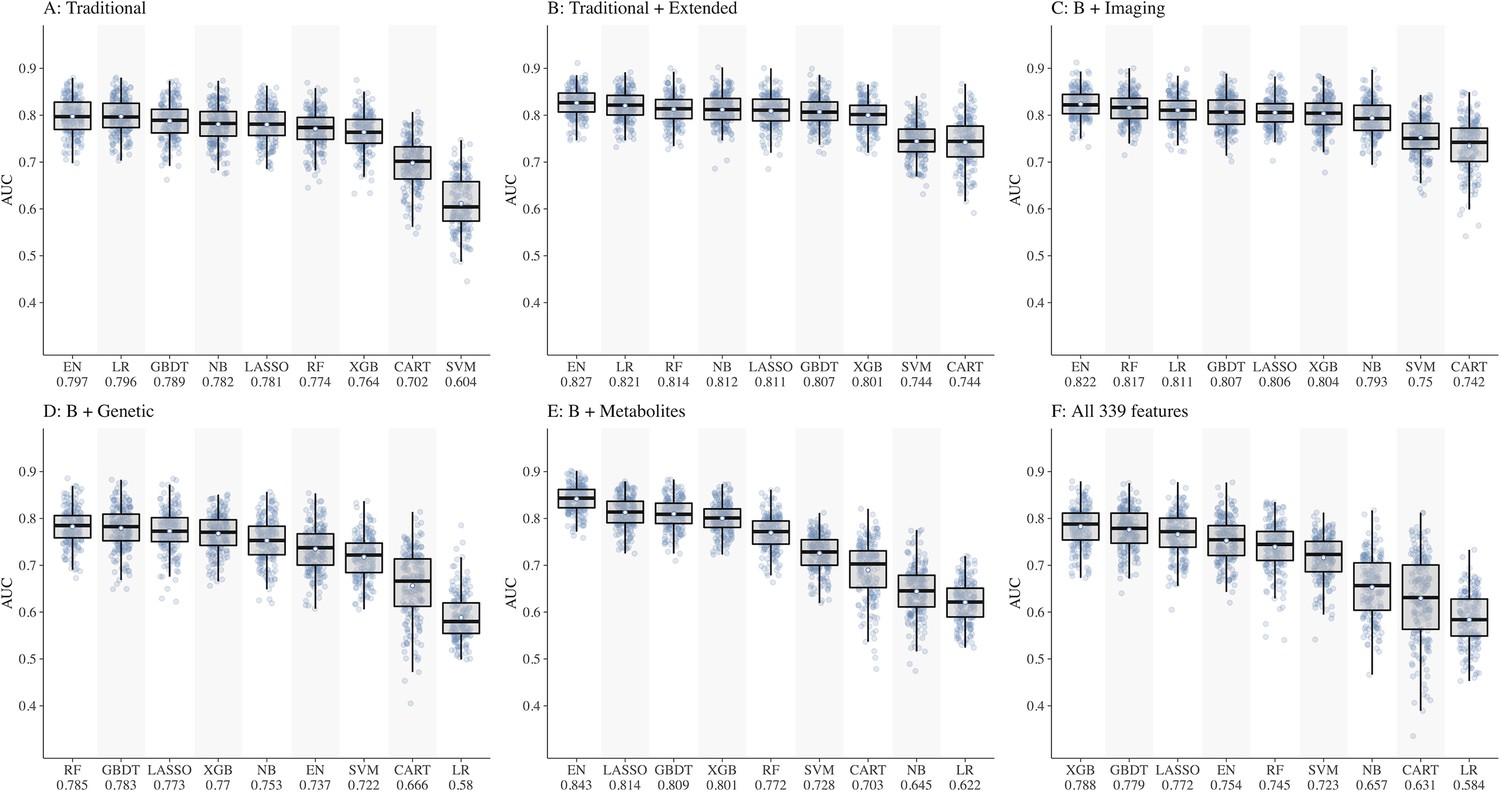
Comparison of nine machine learning models for diabetic kidney disease (DKD) incidence prediction using different sets of features (Panel A-F).
Abbreviations: CART, classification and regression tree; EN, elastic net; GBDT, gradient boosting decision tree; LASSO, least absolute shrinkage and selection operator; LR, logistic regression; NB, naïve Bayes; RF, random forest; SVM, support vector machine; XGB, extreme gradient boosting.
Figure 2

Performance of the top 3 machine learning (ML) models based on selected variables in dataset E (risk factors + blood metabolites) compared to LR using seven established features.
Abbreviations: EN, Elastic net; GBDT, gradient boosting decision tree; LASSO; least absolute shrinkage and selection operator; LR, logistic regression.
Figure 3
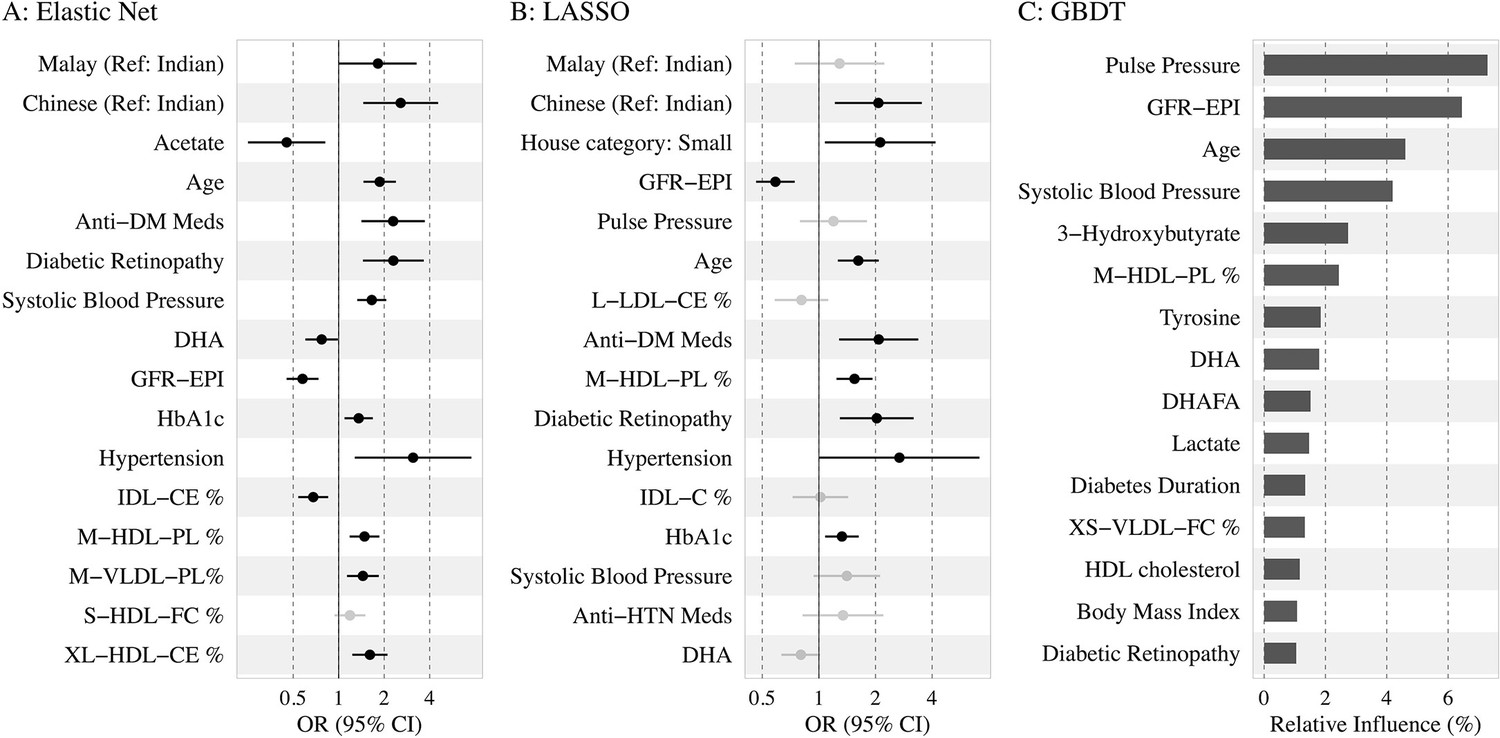
Association of the top 15 machine learning (ML)-selected predictors with incident diabetic kidney disease (DKD).
Abbreviations: LASSO, least absolute shrinkage and selection operator; GBDT, Gradient boosting decision tree.
Variables: anti-HTN Meds, anti hypertensive medications; DM, diabetes mellitus; GFR-EPI, glomerular filtration rate estimated using CKD-EPI equation; HDL, high-density lipoprotein.
Metabolites: DHA: 22:6, docosahexaenoic acid; DHAFA, Ratio of 22:6 docosahexaenoic acid to total fatty acids; IDL-CE%, Cholesterol esters to total lipids ratio in IDL; M-HDL-PL%, Phospholipids to total lipids ratio in medium HDL; M-VLDL-PL%, Phospholipids to total lipids ratio in medium VLDL; S-HDL-FC% Free cholesterol to total lipids ratio in small HDL; XL-HDL-CE%, Cholesterol esters to total lipids ratio in very large HDL; L-LDL-CE%, Cholesterol esters to total lipids ratio in large LDL; M-HDL-PL%, Phospholipids to total lipids ratio in medium HDL; IDL-C% Total cholesterol to total lipids ratio in IDL; M-HDL-PL% Phospholipids to total lipids ratio in medium HDL.
Tables
Table 1
Baseline characteristics of SEED diabetic participants by incident DKD status.
| Characteristics | No DKD(n = 1203) | DKD(n = 162) | p-value | Overall(n = 1365) |
|---|---|---|---|---|
| Age (years) | 57.95 (8.78) | 64.63 (7.98) | <0.001 | 58.74 (8.95) |
| Sex, female | 580 (48.2) | 87 (53.7) | 0.219 | 667 (48.9) |
| Ethnicity | <0.001 | |||
| Indians (ref) | 599 (49.8) | 49 (30.2) | 648 (47.5) | |
| Malays | 310 (25.8) | 70 (43.2) | 380 (27.8) | |
| Chinese | 294 (24.4) | 43 (26.5) | 337 (24.7) | |
| Primary/below education (%) | 706 (58.7) | 121 (74.7) | <0.001 | 827 (60.6) |
| Current smoker (%) | 173 (14.4) | 16 (9.9) | 0.15 | 189 (13.9) |
| Alcohol consumption (%) | 111 (9.2) | 11 (6.8) | 0.389 | 122 (9.0) |
| Hypertension (%) | 845 (70.4) | 155 (95.7) | <0.001 | 1000 (73.4) |
| Diabetic retinopathy (%) | 228 (19.2) | 56 (35.4) | <0.001 | 284 (21.1) |
| Cardiovascular disease (%) | 153 (12.7) | 32 (19.8) | 0.02 | 185 (13.6) |
| Duration of diabetes (years) | 2.68 [0.00, 8.56] | 6.08 [1.44, 11.63] | <0.001 | 3.20 [0.00, 9.37] |
| Antidiabetic medication (%) | 681 (56.6) | 122 (75.3) | <0.001 | 803 (58.8) |
| Insulin use (%) | 39 (3.3) | 11 (7.1) | 0.036 | 50 (3.8) |
| Body mass index (kg/m2) | 26.96 (4.62) | 27.05 (4.36) | 0.764 | 26.97 (4.59) |
| Systolic blood pressure (mm Hg) | 139.42 (18.95) | 155.24 (20.01) | <0.001 | 141.29 (19.74) |
| Diastolic blood pressure (mm Hg) | 78.25 (9.74) | 79.14 (10.70) | 0.278 | 78.35 (9.85) |
| Random blood glucose (mmol/L) | 9.53 (4.26) | 10.44 (5.01) | 0.052 | 9.64 (4.36) |
| HbA1c (%) | 7.61 (1.58) | 8.04 (1.83) | 0.003 | 7.66 (1.62) |
| Blood total cholesterol (mmol/L) | 5.14 (1.14) | 4.98 (1.15) | 0.124 | 5.12 (1.15) |
| Blood HDL cholesterol (mmol/L) | 1.12 (0.31) | 1.16 (0.35) | 0.178 | 1.12 (0.32) |
| eGFR (mL/min/1.73 m2) | 89.98 (14.34) | 79.40 (11.69) | <0.001 | 88.72 (14.46) |
-
Values for categorical variables are presented as number (percentages); values for continuous variables are given as mean (SD) or median [IQR]. p-values are given by χ2 test or Mann–Whitney U test as appropriate for the variable.
-
DKD, diabetic kidney disease; HDL, high-density lipoprotein cholesterol; IQR, interquartile range; SD, standard deviation; SEED, Singapore Epidemiology of Eye Diseases.
Table 2
Machine learning model for predicting incident CKD in literature.
| Author, journal | Study cohort,country | Study populationFollow-up | CKD definition and incidence | Number of predictors | ML performance |
|---|---|---|---|---|---|
| Ravizza et al., 2019, Nature Medicine | EHR data from the IBM Explorys and INPC datasets, the United States | Development cohort (IBM): >500,000 adults with diabetes. Validation (INPC) = 82,912 adults with T2DM; FU = 3 y. | ICD 9/10 codes | 300 features | Based on seven prioritized features, AUC by RF = 0.833 and the Roche/IBM supervised algorithm by LR = 0.827 |
| Song et al., 2020., JMIR | EHR data, the United States (2007–2017) | 14,039 adults with T2DM. FU = 1 y. | eGFR < 60 or UACR ≥30 mg/g; 34.1% | >3000 | GBM AUC = 0.83 |
| Huang et al., 2020a., Diabetes | KORA cohort, Germany | 1838 adults with prediabetes and T2DM. FU = 6.5 y. | eGFR < 60 or UACR ≥30 mg/g at FU; 10.9% | 125 mets + 14 clinical factors | SVM, RF, Ada Boost Best set: Mets-SM and PC + age, TC, FPG, eGFR, UACR, AUC = 0.857 Traditional LR using 14 variables, AUC = 0.809 |
| Sabanayagam et al., 2023, current study | SEED population data, Singapore | 1365 adults with diabetes. FU = 6 y. | eGFR < 60 + 25% decline in eGFR from baseline | 339 features | EN + RFE selected 15 features, AUC = 0.851 vs. 0.795 using seven features by traditional LR |
-
AUC, area under the receiver operating characteristic curve; CKD, chronic kidney disease; eGFR, estimated glomerular filtration rate; EHR, electronic health records; EN, Elastic Net; FPG, Fasting plasma glucose; FU, follow-up; GBM, Gradient Boosting Machine; ICD, International Classification of Diseases; INPC, Indiana Network for Patient Care; LR, logistic regression; ML, machine learning; RF, random forest; RFE, recursive feature selection; SEED, Singapore Epidemiology of Eye Diseases; SVM, support vector machine; T2DM, type 2 diabetes mellitus; TC, total cholesterol; UACR, urine albumin-creatinine ratio.
Additional files
-
Supplementary file 1
Description of variables in each dataset and results from supplementary analyses (Table 1a- 1g).
(Table 1a) Characteristics of the preprocessed datasets A–F. (Table 1b) List of variables used for DKD prediction. (Table 1c) Median AUC [IQR] performance of the ML models using datasets A–F. (Table 1d) Median SN%/SP% performance of the ML models using datasets A–F. (Table 1e) Source data linked to Figure 3. (Table 1f) Top ML-selected predictors for incident DKD in each of the three ethnic groups by EN and RFE. (Table 1g) Baseline characteristics of SEED diabetic participants by ethnicity (n = 1365).
- https://cdn.elifesciences.org/articles/81878/elife-81878-supp1-v2.docx
-
MDAR checklist
- https://cdn.elifesciences.org/articles/81878/elife-81878-mdarchecklist1-v2.pdf
Download links
A two-part list of links to download the article, or parts of the article, in various formats.
Downloads (link to download the article as PDF)
Open citations (links to open the citations from this article in various online reference manager services)
Cite this article (links to download the citations from this article in formats compatible with various reference manager tools)
Prediction of diabetic kidney disease risk using machine learning models: A population-based cohort study of Asian adults
eLife 12:e81878.
https://doi.org/10.7554/eLife.81878


