Dysregulation of the PRUNE2/PCA3 genetic axis in human prostate cancer: from experimental discovery to validation in two independent patient cohorts
- University of New Mexico Comprehensive Cancer Center, United States
- Division of Hematology/Oncology, Department of Internal Medicine, University of New Mexico School of Medicine, United States
- Department of Pathology, University of Utah, United States
- Rutgers Cancer Institute of New Jersey, United States
- Division of Cancer Biology, Department of Radiation Oncology, Rutgers New Jersey Medical School, United States
- Department of Biochemistry, Institute of Chemistry, University of São Paulo, Brazil
- Department of Pathology, University of New Mexico, United States
- Department of Biostatistics, University of Arkansas for Medical Sciences, United States
- Department of Biostatistics, University of Florida, United States
- Division of Quantitative Sciences, University of Florida Health Cancer Center, United States
- Section of Hematology and Oncology, Department of Medicine, Baylor College of Medicine, United States
- Division of Molecular Medicine, Department of Medicine, United States
- Division of Urology, University of São Paulo Medical School, Brazil
- Syrian-Lebanese Hospital, Brazil
- Laboratory of Medical Genomics, A.C. Camargo Cancer Center, Brazil
- Laboratory of Bioinformatics and Computational Biology, A.C. Camargo Cancer Center, Brazil
- MBrace Therapeutics, United States
- Ludwig Institute for Cancer Research, University of California, San Diego, United States
- Division of Hematology/Oncology, Department of Medicine, Rutgers New Jersey Medical School, United States
Figures
Figure 1 with 1 supplement

Analyses of discovery prostate cancer cohort.
(A) PRUNE2 and PCA3 expression in tumor (n=107) (Figure 1—source data 1) and nonneoplastic (n=24 for PRUNE2, n=21 for PCA3) (Figure 1—source data 1) prostatic samples. Calculated values available in Figure 1—source data 1. (B) Tumor PCA3 expression by biochemical recurrence status. PCA3 expression in patients without versus with biochemical recurrence in the discovery cohort (n=102). No significant difference in median expression was seen in this cohort. Box plots of gene expression (normalized expression) in the discovery cohort. The horizontal line within each box represents the median value, while the box represents the interquartile range, and the whiskers extend out to 1.5 times the interquartile range. Outliers are represented by circles. p-Values are noted for the indicated comparisons.
-
Figure 1—source data 1
Analyses of discovery prostate cancer cohort.
Raw values of PRUNE2 and PCA3 expression in tumor prostatic samples.
- https://cdn.elifesciences.org/articles/81929/elife-81929-fig1-data1-v3.csv
-
Figure 1—source data 2
Analyses of discovery prostate cancer cohort.
Raw values of PRUNE2 and PCA3 expression in nonneoplastic prostatic samples.
- https://cdn.elifesciences.org/articles/81929/elife-81929-fig1-data2-v3.csv
-
Figure 1—source data 3
Analyses of discovery prostate cancer cohort.
Calculated values of PRUNE2 and PCA3 expression in tumor and nonneoplastic prostatic samples.
- https://cdn.elifesciences.org/articles/81929/elife-81929-fig1-data3-v3.txt
Figure 1—figure supplement 1
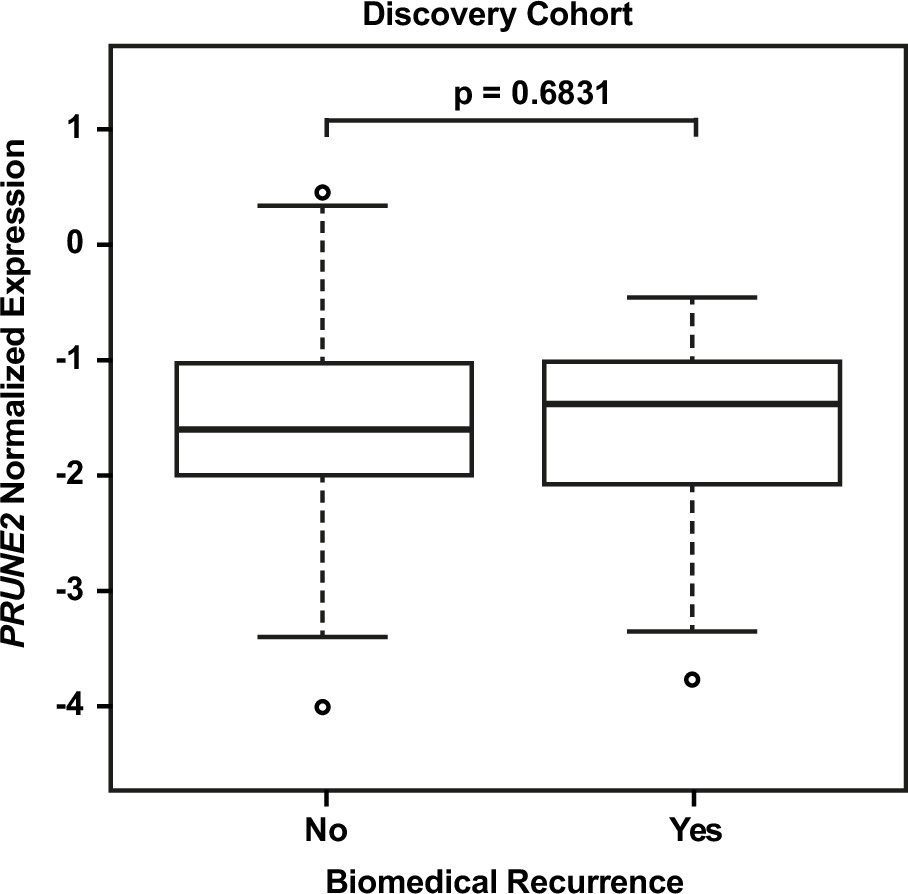
Discovery cohort – no significant difference in tumor PRUNE2 expression by biochemical recurrence status.
Figure 2
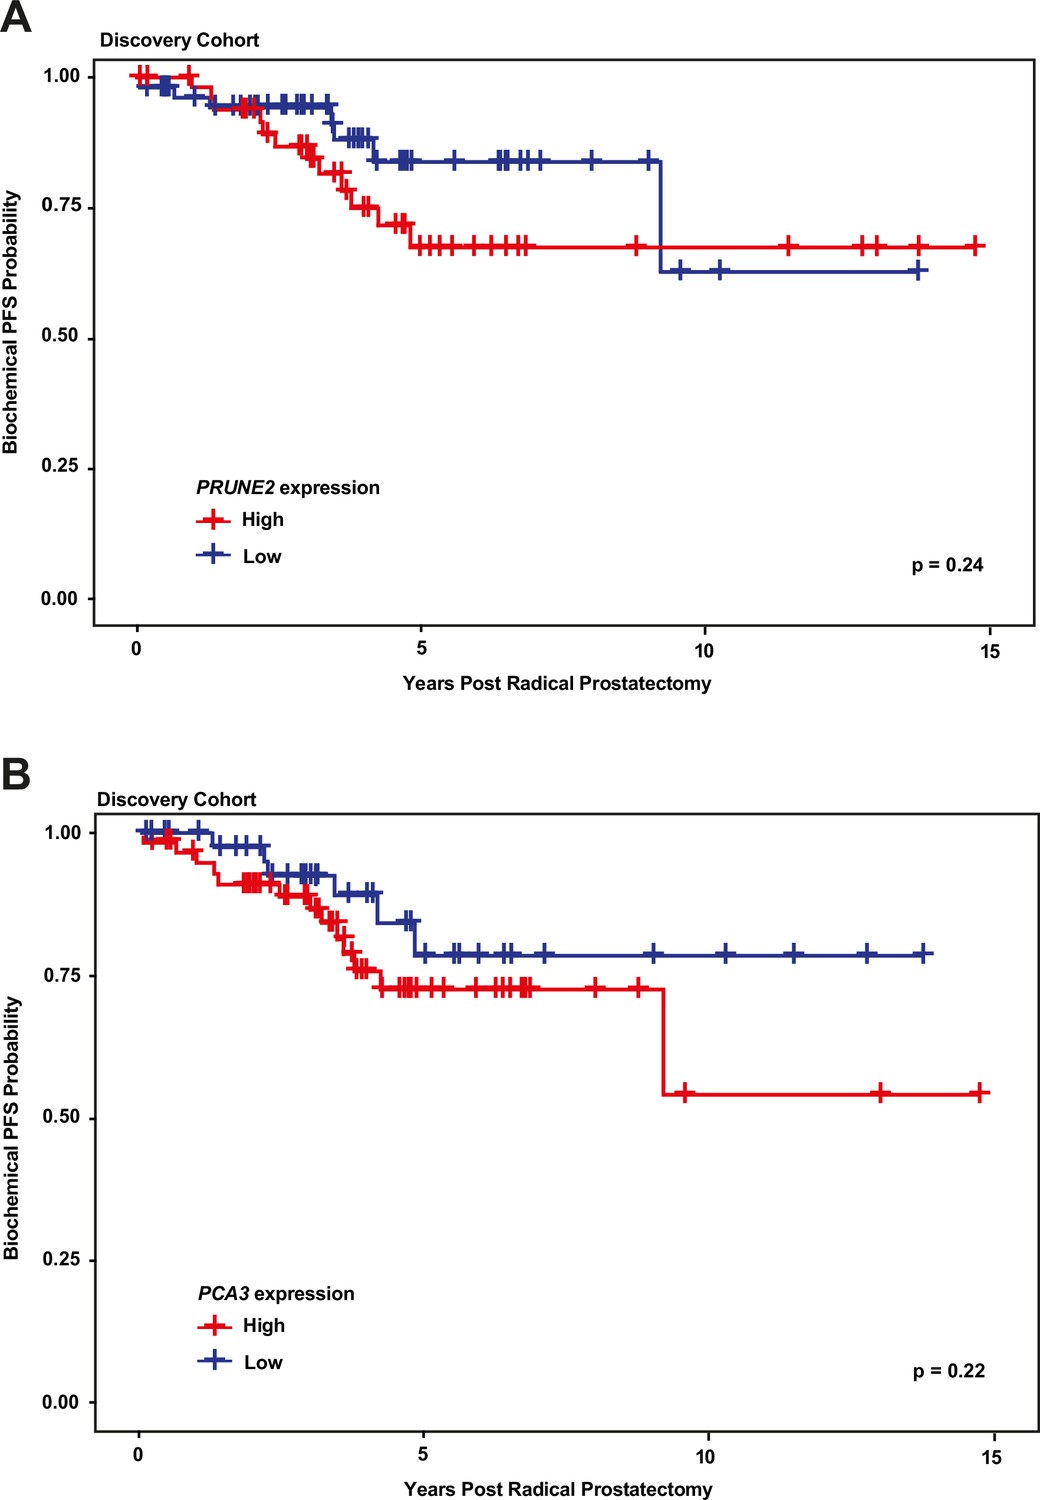
Kaplan-Meier curves illustrating time to event (biochemical recurrence) among patients post-prostatectomy from the discovery cohort, stratified by ‘high’ gene expression (greater than mean expression, red line) versus ‘low’ gene expression (less than or equal to mean expression, blue line), for (A) tumor PRUNE2 expression, and (B) tumor PCA3 expression.
There was no significant association of high versus low expression levels and time to recurrence by log-rank testing for either PRUNE2 or PCA3.
Figure 3 with 1 supplement
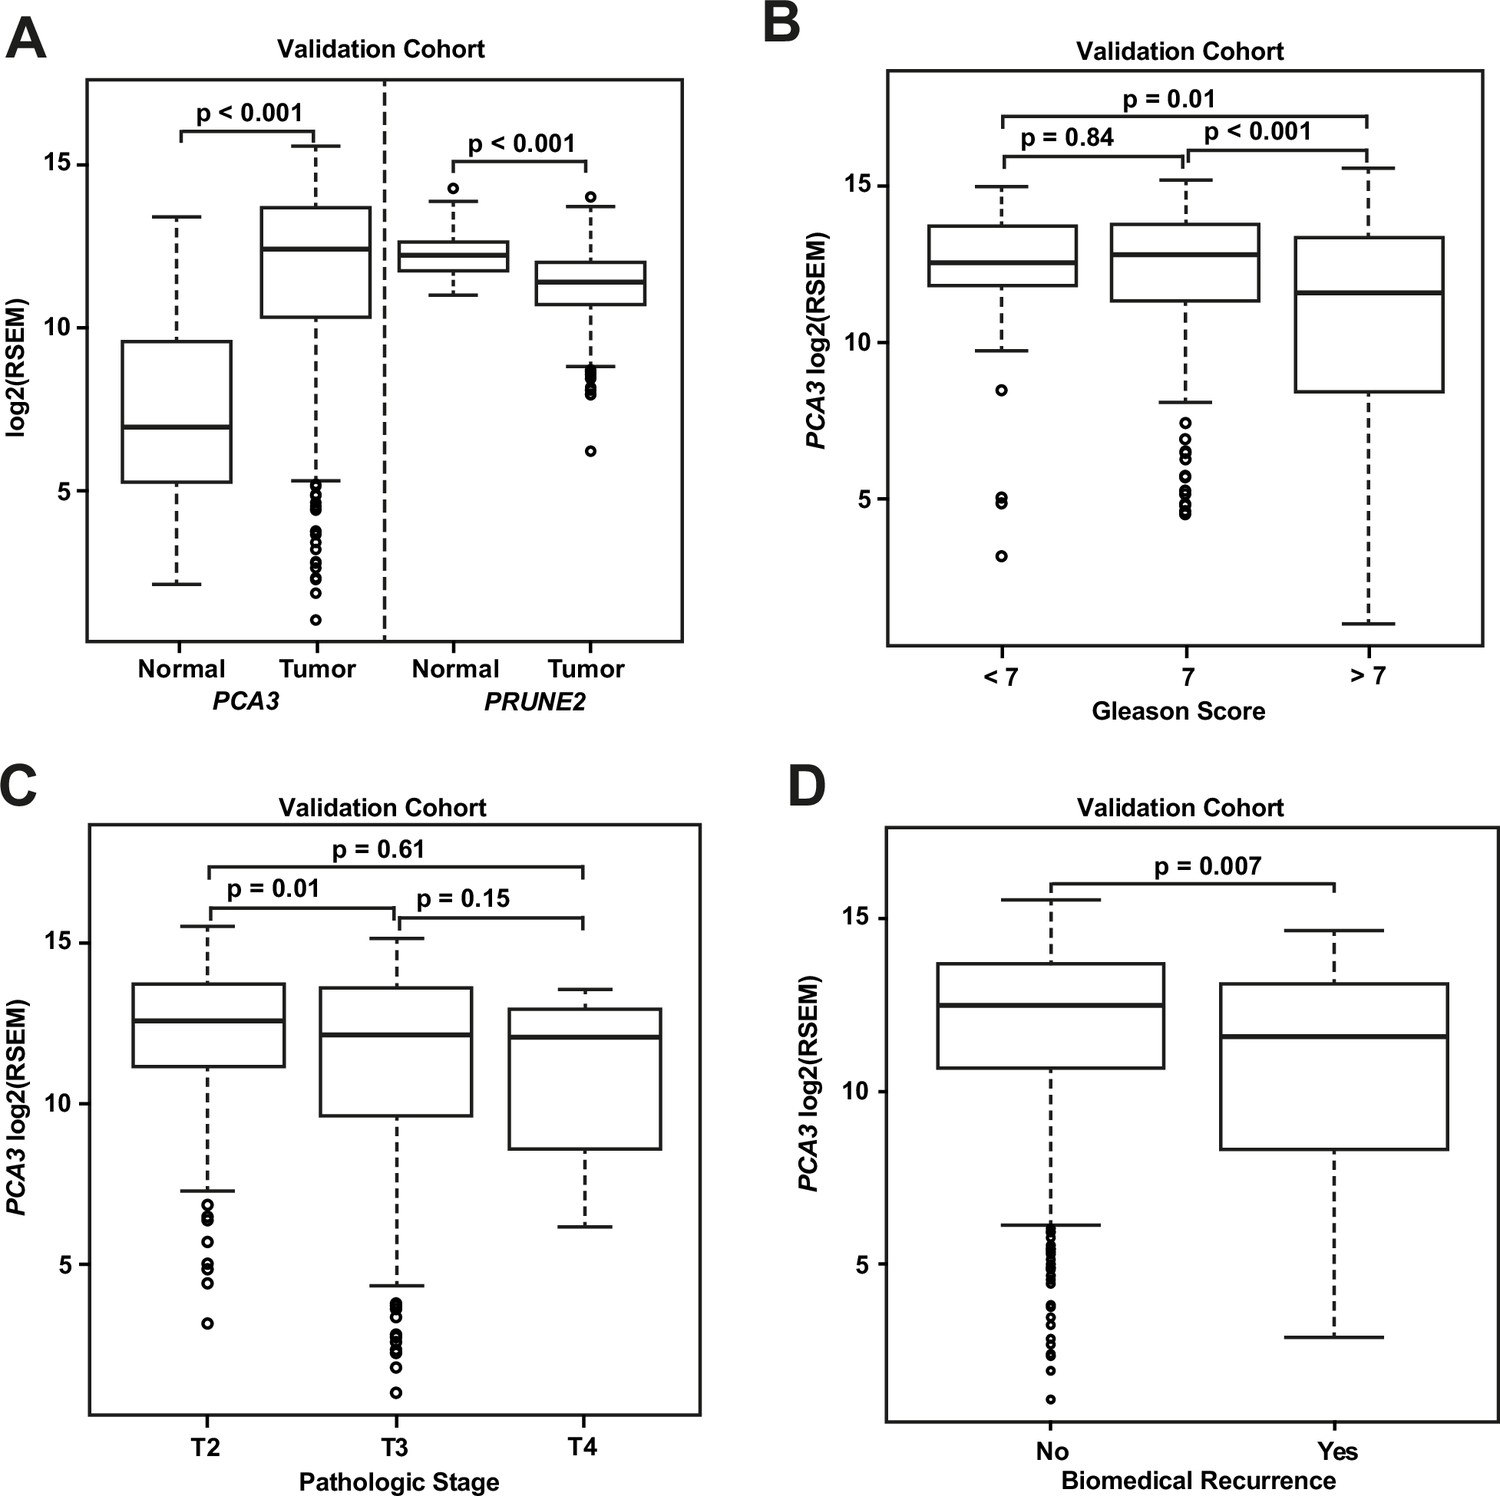
Analyses of TCGA prostate cancer validation cohort.
(A) PCA3 and PRUNE2 expression in nonneoplastic prostatic glandular tissue and in prostatic adenocarcinoma in the TCGA cohort illustrating consistent gene expression differences between tumor (n=497) and nonneoplastic (n=52) prostate in both cohorts. (B, C) PCA3 expression in the cohort from TCGA (n=497) across Gleason grades (B) showing lower expression in higher grade (>7) tumors and across tumor stages (C) showing lower expression in higher stage tumors. All illustrated tumor grades and stages show higher expression than nonneoplastic prostatic epithelium. (D) PCA3 expression in patients without versus with biochemical recurrence in the TCGA cohort (n=429). In the TCGA cohort, lower PCA3 median expression was associated with biochemical recurrence. Box plots of gene expression in the TCGA cohort is reported as log2RSEM data. The horizontal line within each box represents the median value, while the box represents the interquartile range, and the whiskers extend out to 1.5 times the interquartile range. Outliers are represented by circles. p-Values are noted for the indicated comparisons. RSEM: RNA-Seq by Expectation-Maximization.
Figure 3—figure supplement 1
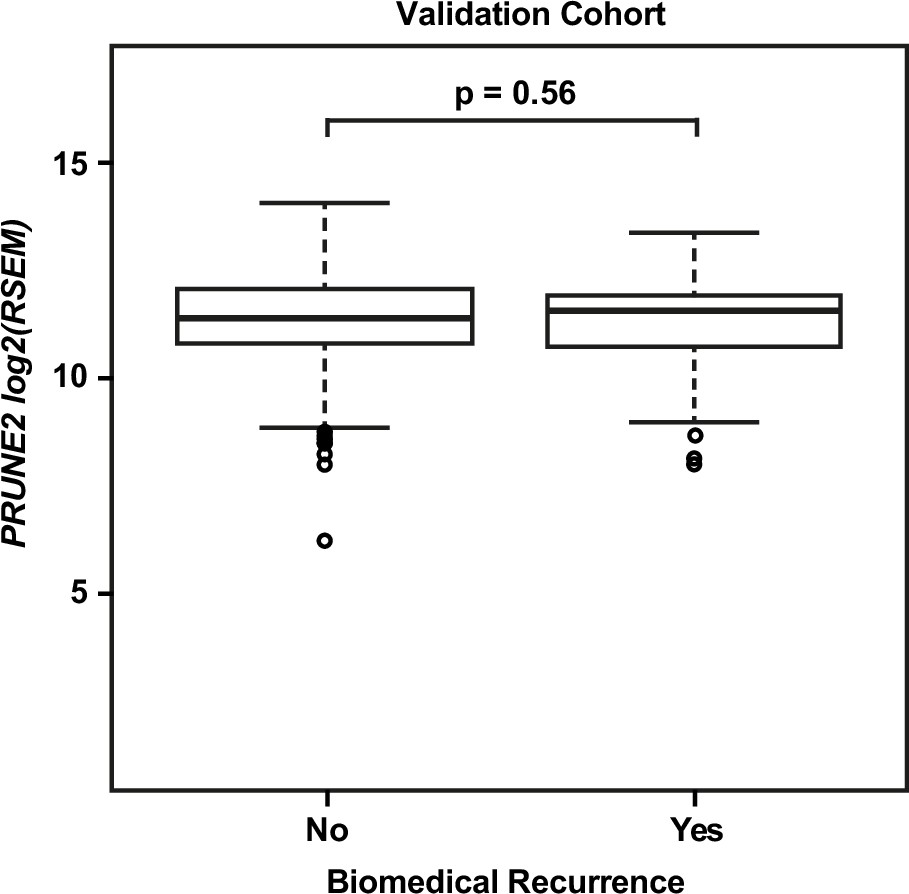
Validation cohort – no significant difference in tumor PRUNE2 expression by biochemical recurrence status.
Figure 4 with 1 supplement
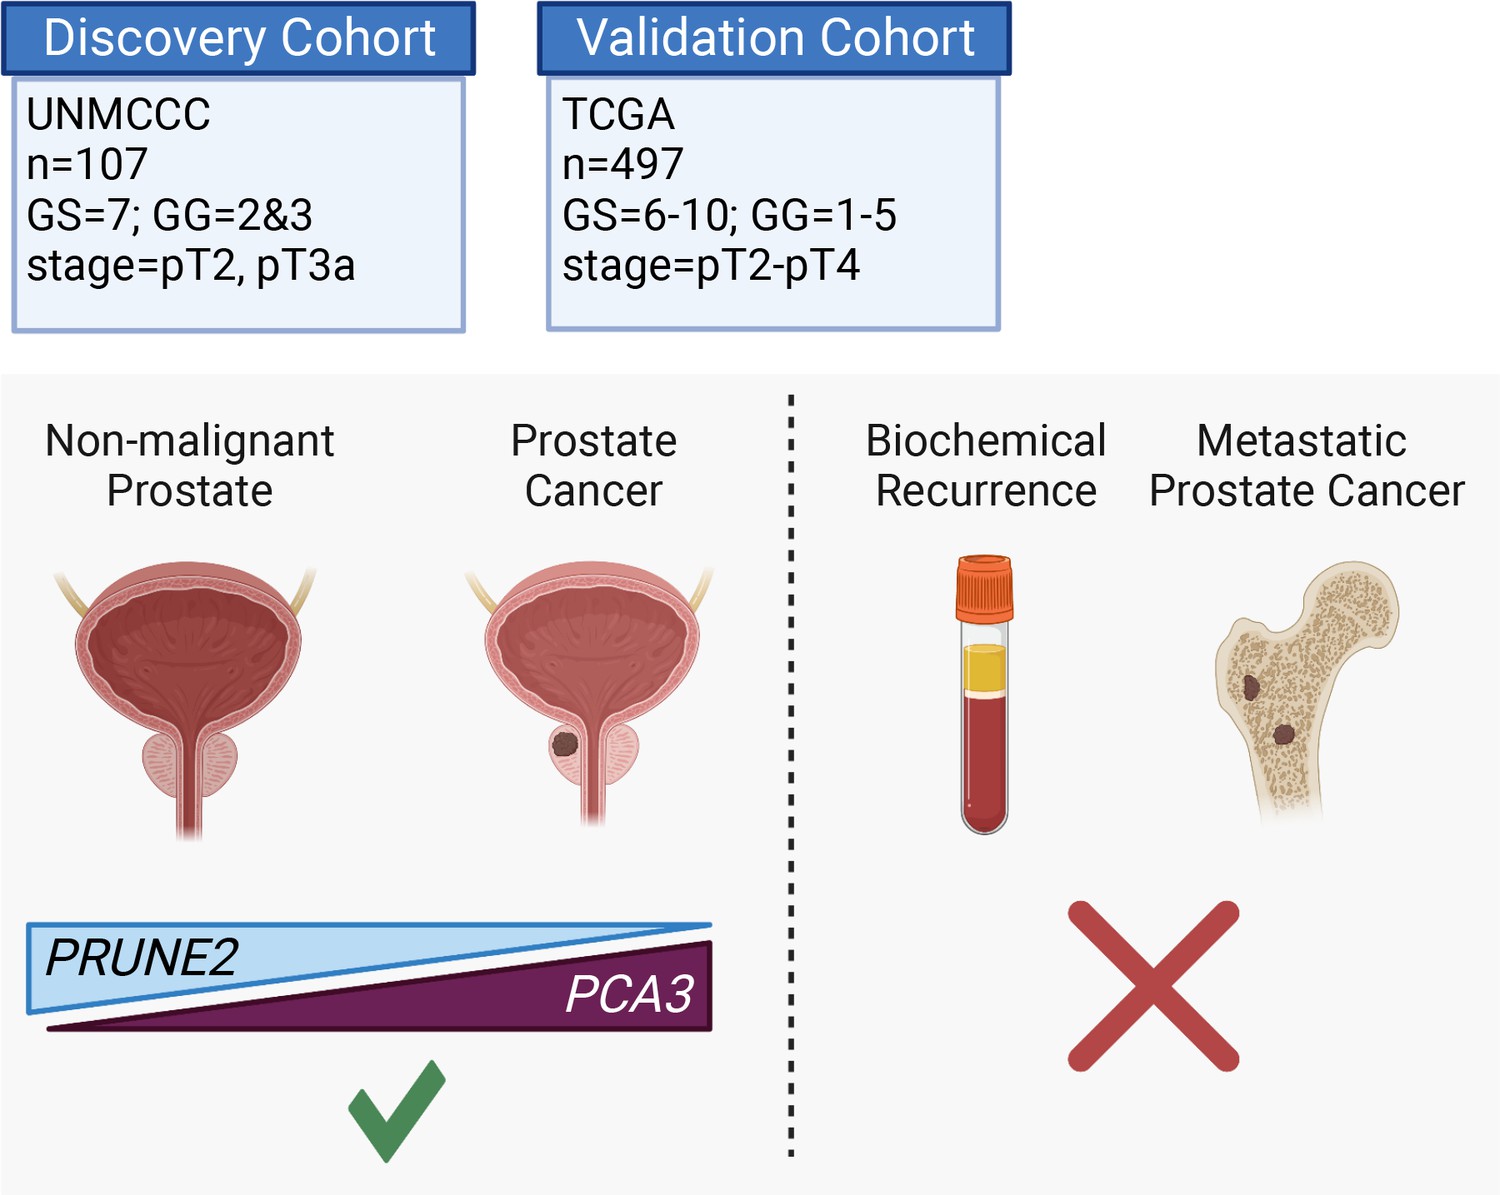
Graphical summary of the analyses.
PCA3 and PRUNE2 gene expression relationship in paired prostate cancer and adjacent normal prostate was analyzed in two independent retrospective cohorts of clinically annotated cases post-radical prostatectomy: a single-institutional discovery cohort (n=107; Figure 4—figure supplement 1) and a multi-institutional validation cohort (n=497). We also serially examined clinical/pathological variables including time to disease recurrence. Created with BioRender.com.
Figure 4—figure supplement 1
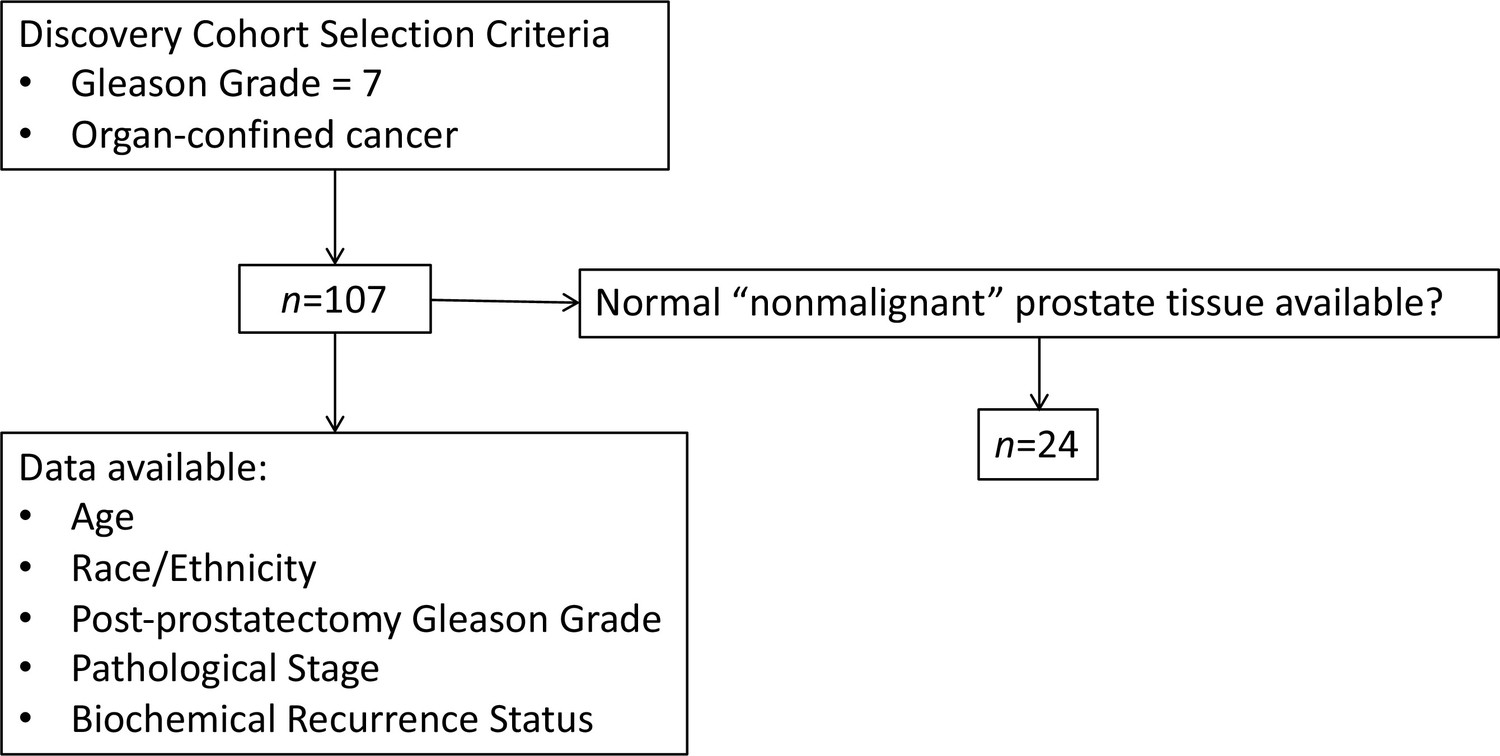
Flow diagram of discovery cohort selection criteria and clinicopathological characteristics available.
Tables
Table 1
Discovery cohort: clinicopathological features of the 107patients in this study who had radical prostatectomy at UNM for localized prostatic adenocarcinoma (further details in Table 1—source data 1).
| Variable | Number | % or Mean (STD; range) |
|---|---|---|
| Age (years) | 107 | 62.8 (8.4; 45–84) |
| Race | ||
| Non-Hispanic White | 91 | 85 |
| Hispanic | 8 | 7.5 |
| American Indian | 3 | 2.8 |
| African American | 3 | 2.8 |
| Other | 2 | 1.9 |
| Post-prostatectomy Gleason Grade (Grade Group) | ||
| 3+4 = 7 (Grade Group 2) | 93 | 86.9 |
| 4+3 = 7 (Grade Group 3) | 14 | 13.1 |
| Pathological stage | ||
| pT2 | 80 | 74.8 |
| pT3a | 27 | 25.2 |
| Biochemical recurrence status | ||
| No | 83 | 77.6 |
| Yes | 19 | 17.8 |
| LTF | 5 | 4.7 |
-
STD, standard deviation; LTF, lost to follow up.
-
Table 1—source data 1
Discovery cohort.
Clinicopathological features of the 107 patients in this study who had radical prostatectomy at UNM for localized prostatic adenocarcinoma.
- https://cdn.elifesciences.org/articles/81929/elife-81929-table1-data1-v3.csv
Table 2
Number of patients at risk over time (see Figure 2A).
| Years post radical prostatectomy | ||||
|---|---|---|---|---|
| PRUNE2 expression | 0 | 5 | 10 | 15 |
| High | 51 | 15 | 5 | 0 |
| Low | 56 | 14 | 2 | 0 |
Table 3
Number of patients at risk over time (see Figure 2B).
| Years post radical prostatectomy | ||||
|---|---|---|---|---|
| PCA3 expression | 0 | 5 | 10 | 15 |
| High | 59 | 16 | 2 | 0 |
| Low | 48 | 13 | 5 | 0 |
Table 4
Validation cohort: clinicopathological features of the 497 patients in the prostate cancer TCGA dataset, with a total of 549 tissue samples included.
| Variable | Number | % or Mean (STD; range) |
|---|---|---|
| Age (years) | 497 | 61 (6.8; 41–78) |
| Vital status | ||
| Alive | 487 | 97.9 |
| Dead | 10 | 2.1 |
| Sample type | ||
| Primary tumor | 497 | |
| Normal (non-malignant) prostate | 52 | |
| Post-prostatectomy Gleason Grade (Grade Group) | ||
| 6 (Grade Group 1) | 45 | 9 |
| 7 (Grade Groups 2 and 3) | 247 | 49.7 |
| 8 (Grade Group 4) | 64 | 12.9 |
| 9 (Grade Group 5) | 137 | 27.6 |
| 10 (Grade Group 5) | 4 | 0.8 |
| Pathological stage | ||
| pT2a | 13 | 2.6 |
| pT2b | 10 | 2 |
| pT2c | 164 | 33 |
| pT3a | 158 | 32 |
| pT3b | 135 | 27 |
| pT4 | 10 | 2 |
| Unknown | 7 | 1.4 |
| Biochemical recurrence status | ||
| No | 371 | 74.6 |
| Yes | 58 | 11.7 |
| Unknown | 68 | 13.7 |
-
STD, standard deviation.
Appendix 1—table 1
Discovery cohort multivariable model.
| Model | Akaike information criterion score |
|---|---|
| PS_GG model | 157.2 |
| PRUNE2 model | 162.9 |
| PCA3 model | 166.2 |
| Ratio model | 162.2 |
Appendix 1—table 2
Validation cohort multivariable Cox model.
| Hazard ratio (HR) | 95% CI | p-Value | |
|---|---|---|---|
| PCA3 | 0.963 | 0.888–1.044 | 0.36 |
| Gleason Grade | 1.558 | 1.147–2.117 | <0.01 |
| Pathological stage T3 | 3.596 | 1.360–9.512 | <0.01 |
| Pathological stage T4 | 1.860 | 0.206–16.82 | 0.58 |
| Age at diagnosis | 1.000 | 0.960–1.043 | 0.99 |
Additional files
-
MDAR checklist
- https://cdn.elifesciences.org/articles/81929/elife-81929-mdarchecklist1-v3.docx
-
Reporting standard 1
STROBE Checklist.
- https://cdn.elifesciences.org/articles/81929/elife-81929-repstand1-v3.docx
-
Source code 1
R code and SAS code of descriptive statistics.
- https://cdn.elifesciences.org/articles/81929/elife-81929-code1-v3.zip
Download links
A two-part list of links to download the article, or parts of the article, in various formats.
Downloads (link to download the article as PDF)
Open citations (links to open the citations from this article in various online reference manager services)
Cite this article (links to download the citations from this article in formats compatible with various reference manager tools)
Dysregulation of the PRUNE2/PCA3 genetic axis in human prostate cancer: from experimental discovery to validation in two independent patient cohorts
eLife 12:e81929.
https://doi.org/10.7554/eLife.81929


