Homeostatic regulation through strengthening of neuronal network-correlated synaptic inputs
- Department of Brain Sciences, Division of Neuroscience, Imperial College London, Hammersmith Hospital Campus, United Kingdom
- UK Dementia Research Institute at Imperial College, United Kingdom
- Friedrich Miescher Institute for Biomedical Research, Switzerland
- Department of Neuroscience, Physiology and Pharmacology, University College London, United Kingdom
Figures
Figure 1 with 1 supplement
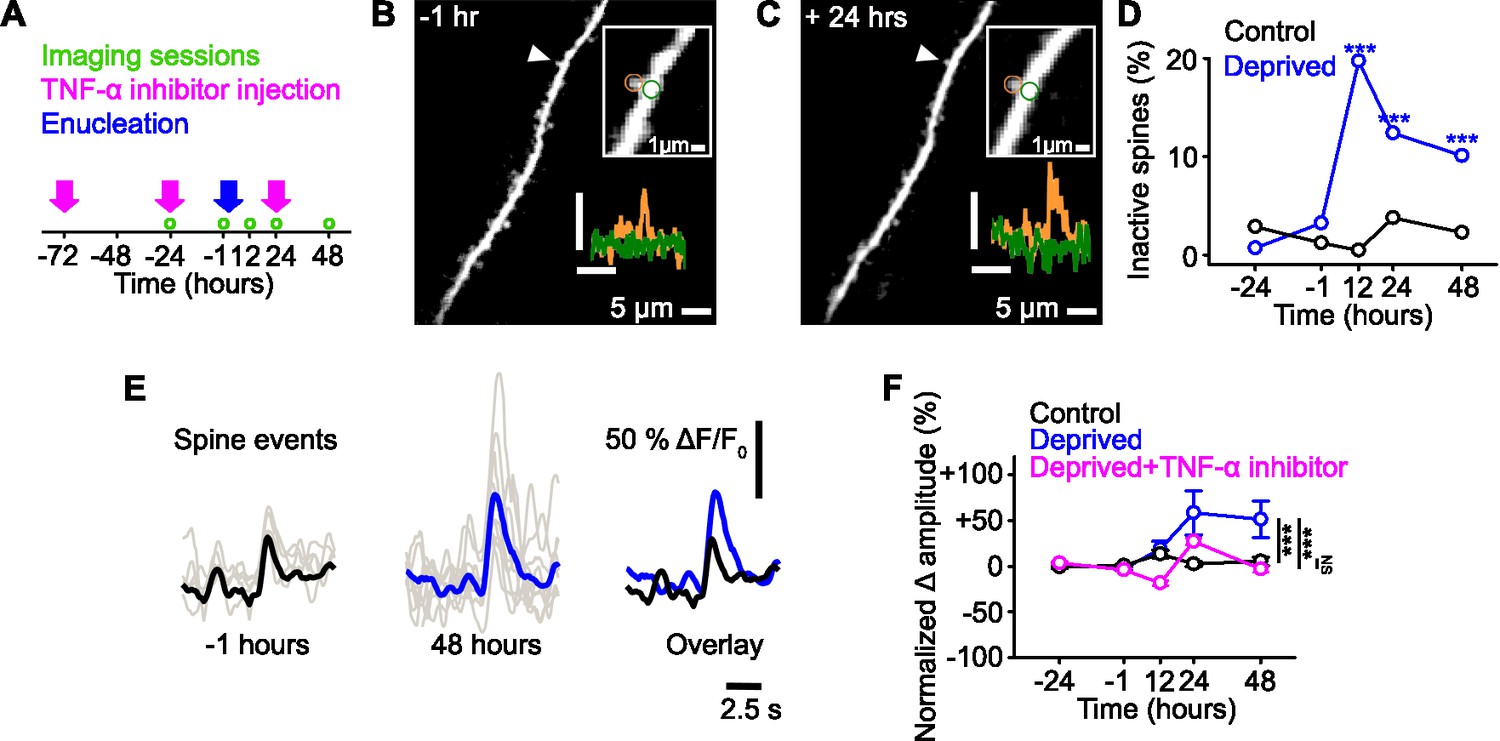
Functional strengthening of dendritic spines following sensory deprivation.
(A) Experimental timeline. Green circles denote imaging time points, pink arrows denote time of tumor necrosis factor alpha (TNF-α) inhibitor injections, and blue arrow shows time of monocular enucleation (0 hr). (B,C) Maximum intensity projection of activity for a dendritic stretch of a layer 5 pyramidal cell measured before (B, –1 hr) and after (C, 24 hr) deprivation. Upper inset, higher magnification image of highlighted (arrowhead) individual spine, in which circles show the region of interest for the dendritic spine (orange) and the dendrite (green). Lower inset, calcium fluorescence signals measured at the dendritic spine (orange) and adjacent dendrite (green). Axons were removed from the background of the image for clarity. Scale bar, 25% ΔF/F0, 5 s. (D) Percentage of spines that become inactive at each time point in control (black) and deprived (blue) mice. All spines included were active during at least one imaging time point. Asterisks denote comparison of deprived and control values. (E) Single trial (gray) and average (black/blue) events, aligned by peak, of an example spine at –1 hr (left, black) and 48 hr (middle, blue) from deprivation (0 hr), and the overlay of both (right). (F) Percent change in amplitude normalized to baseline (–24 and –1 hr) of calcium transients measured in persistent (active at all time points) dendritic spines in control (black), deprived (blue) and deprived with TNF-α inhibitor (pink) conditions. Deprivation occurs at 0 hr. For all statistics, see Figure 1—source data 1. ***p<0.001, NS, no significance. Error bars, standard error of the mean (SEM).
-
Figure 1—source data 1
Statistical comparisons for Figure 1.
- https://cdn.elifesciences.org/articles/81958/elife-81958-fig1-data1-v2.docx
Figure 1—figure supplement 1
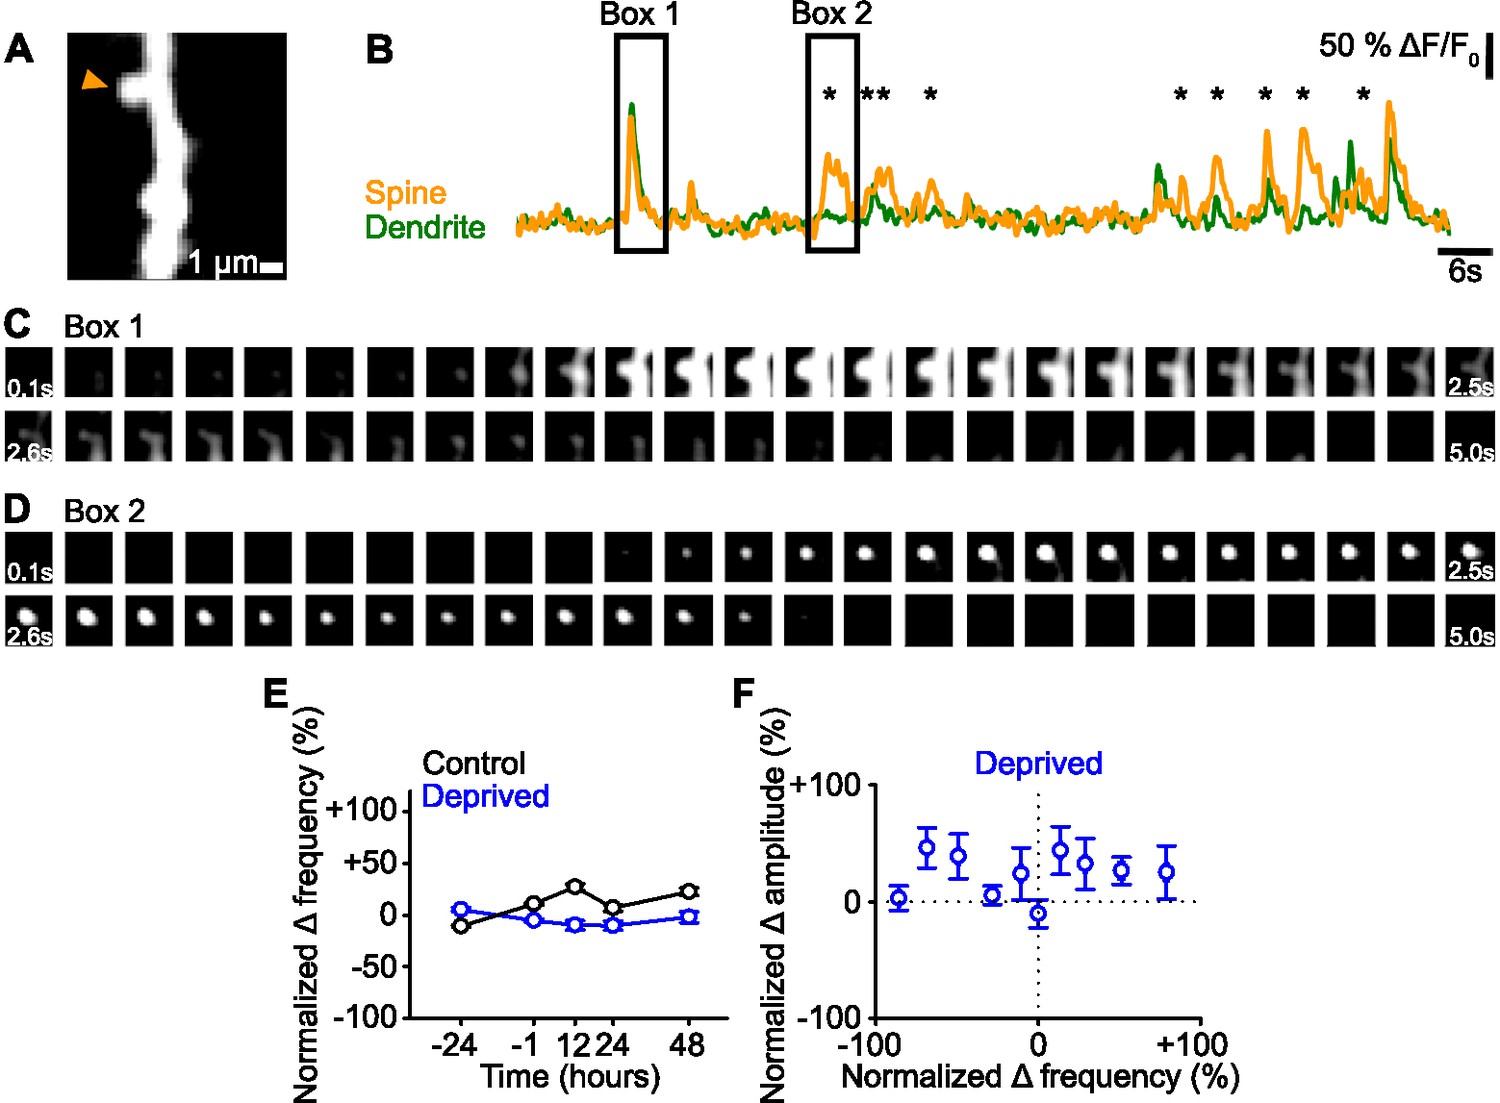
Spine event frequency.
(A) Maximum intensity projection of activity of an example dendritic segment. (B) ΔF/F0 signals of the dendrite (green) and spine (orange) denoted (arrowhead) in the maximum intensity projection in Panel A. Asterisks mark spine-only events. (C,D) Fluorescence time course of the dendritic spine and dendrite in Panel A, corresponding to the ΔF/F0 signals in Panel B in Box 1 (C) and Box 2 (D). Panel C shows spine and dendrite co-active. Panel D shows only the spine active, with the same field of view as C. Each box shows an average over 100 ms. (E) Percent change in frequency normalized to baseline (–24 and –1 hr) of calcium transients for persistent (active at all time points) dendritic spines in control (black) and deprived (blue) mice. (F) Normalized percent change in calcium transient frequency at 12 hours (relative to baseline: –24 and –1 hr) versus normalized percent change in amplitude at 48 hr (relative to baseline: –24 and –1 hr) post-enucleation for all persistent (active at all time points) spines in deprived mice. For statistics, see Figure 1—figure supplement 1—source data 1. Error bars, standard error of the mean (SEM).
-
Figure 1—figure supplement 1—source data 1
Statistical comparisons for Figure 1—figure supplement 1.
- https://cdn.elifesciences.org/articles/81958/elife-81958-fig1-figsupp1-data1-v2.docx
Figure 2
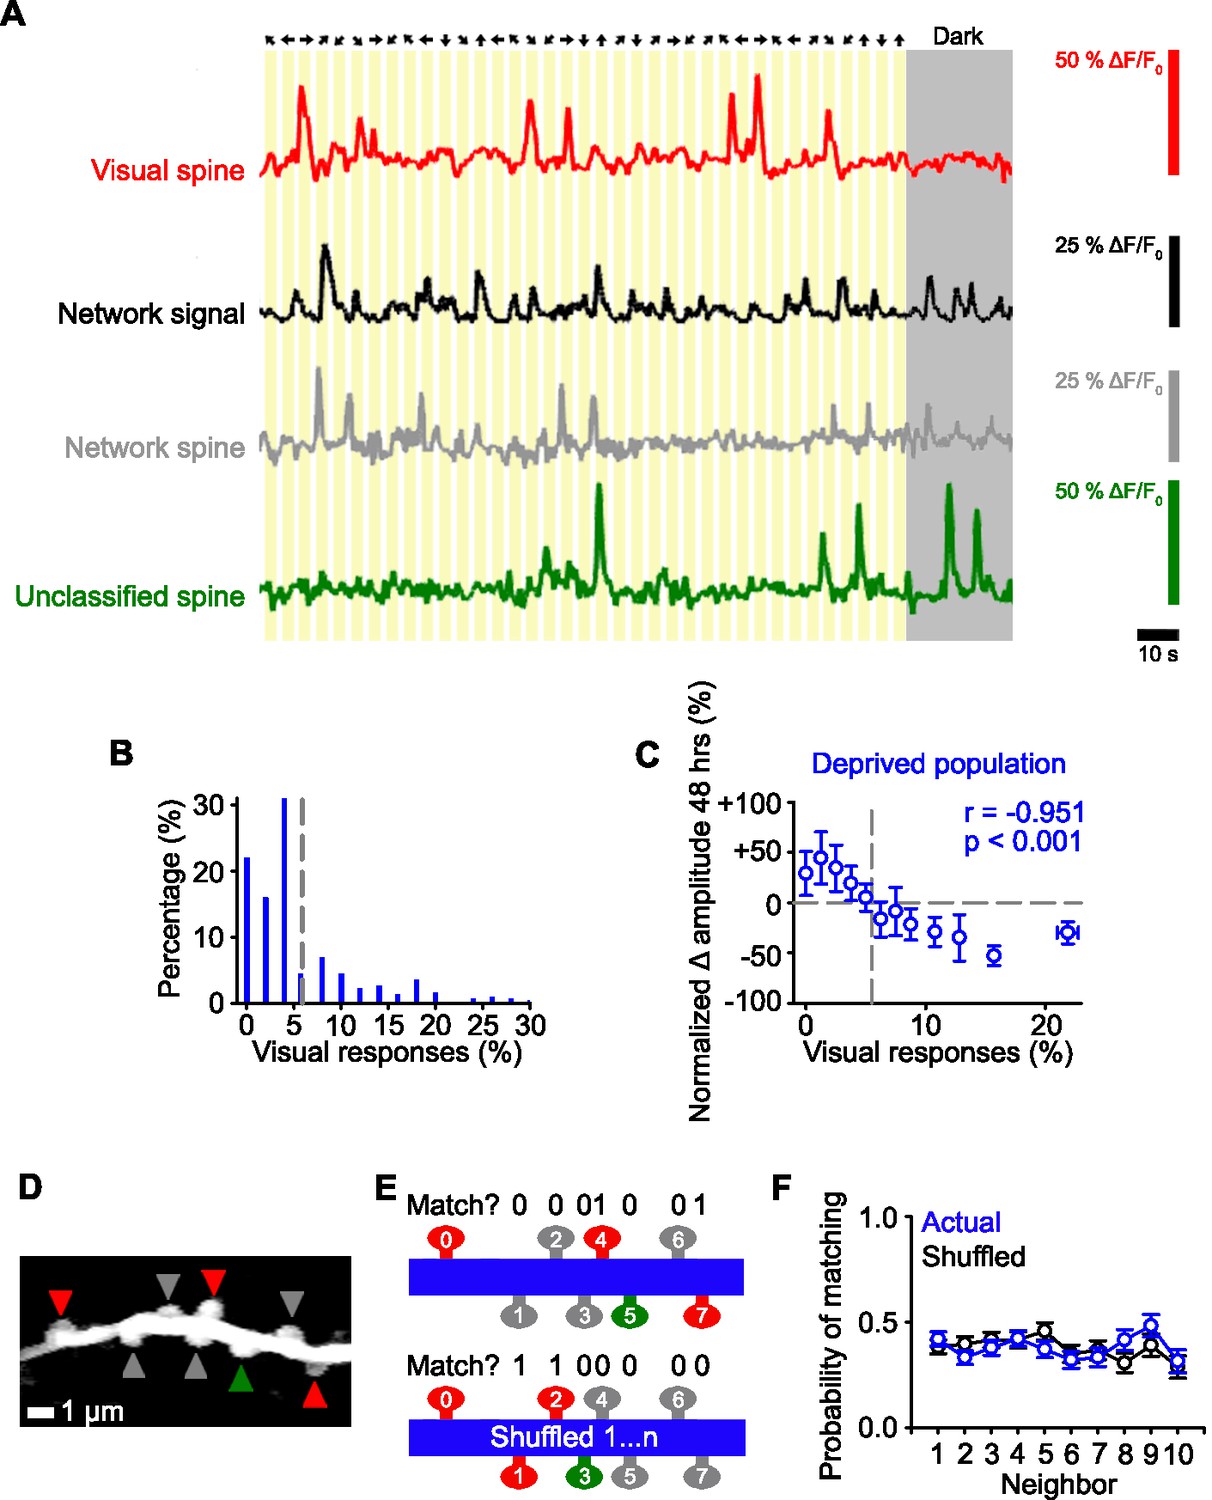
Identifying functional subsets of dendritic spines in visual cortex.
(A) Schematic of the stimulus orientation and direction (top) and calcium responses of an individual visually responsive spine (red), the average network response (black), an individual network-correlated spine (gray), and an individual unclassified spine (green). Dark gray shading indicates the mouse was stationary in the dark. (B) Distribution of the percentage of visual stimuli that elicit a time-locked response for all deprived spines during baseline (–24 and –1 hr). Gray dashed line indicates the number of time-locked responses to visual stimuli expected by chance (5.5%, see Methods). (C) Percent change in spine amplitude at 48 hr normalized to baseline (–24 and –1 hr) for the entire population of spines in deprived mice as a function of the percent of visual stimuli out of all visual presentations that elicit time-locked responses, measured during baseline (–24 and –1 hr). Gray dashed line indicates chance levels (see Methods) for percentage of visual responses (vertical) and no change in spine amplitude relative to baseline (horizontal). (D) Maximum intensity projection of activity of a dendritic segment with network-correlated (gray), visually responsive (red), and unclassified (green) spines. (E) Schematic of functional property clustering analysis for first iteration of spine0 (top) and shuffled condition (bottom), for the example dendrite in Panel D. Spines match (value of 1) when they have the same functional class (network-correlated [gray], visually responsive [red], unclassified [green]) as spine0. (F) Population data for probability of matching the functional properties of a neighboring spine for the actual data (blue) and randomly shuffled position (black) of a given spine on a dendritic branch. For statistics, see Figure 2—source data 1. Error bars, standard error of the mean (SEM).
-
Figure 2—source data 1
Statistical comparisons for Figure 2.
- https://cdn.elifesciences.org/articles/81958/elife-81958-fig2-data1-v2.docx
Figure 3 with 1 supplement
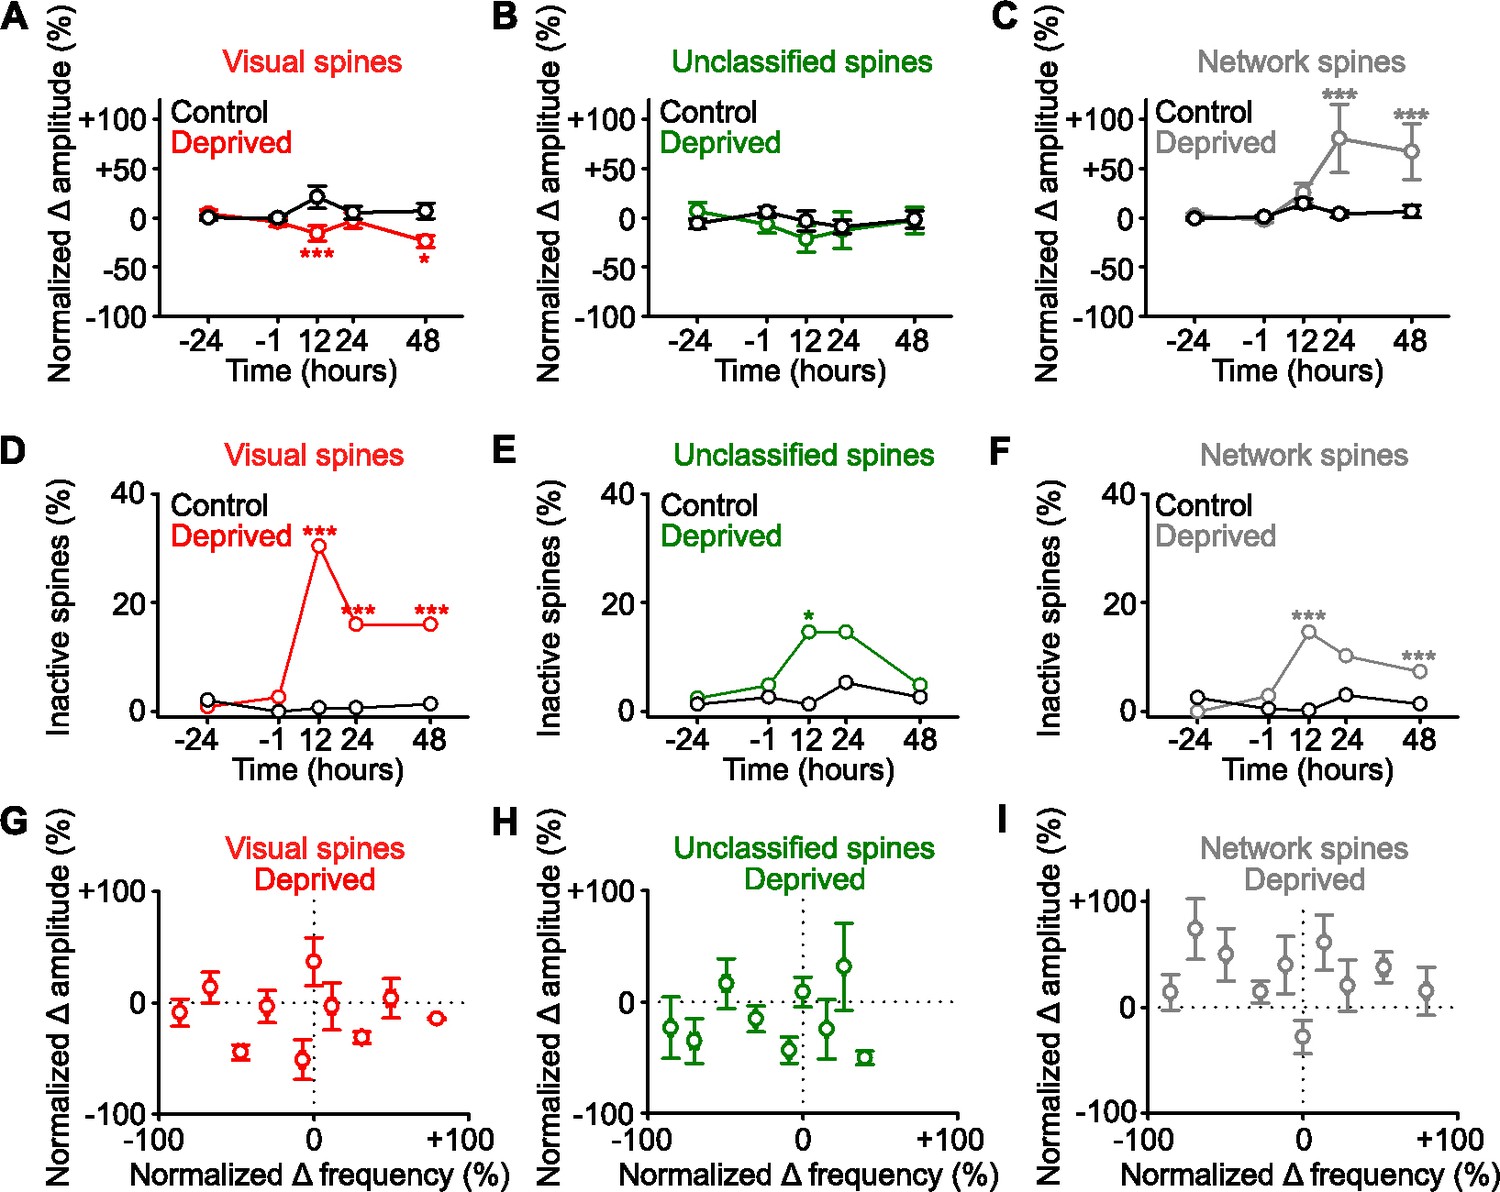
Functional strengthening occurs in network-correlated spines.
(A,B,C) Percent change in spine amplitude normalized to baseline (–24 and –1 hr) of calcium transients for persistent (active at all time points) spines that were classified during baseline as visually responsive (A, red), unclassified (B, green), and network-correlated (C, gray), either following enucleation (0 hr) or sham-enucleated controls (black). (D,E,F) Percentage of spines that become inactive that were classified during baseline as visually responsive (D, red), unclassified (E, green), and network-correlated (F, gray), either following enucleation (0 hr) or sham-enucleated controls (black). All spines included are active during at least one imaging time point. (G,H,I) In deprived mice, normalized percent change in calcium transient frequency at 12 hr (relative to baseline: –24 and –1 hr) versus normalized percent change in amplitude at 48 hr (relative to baseline: –24 and –1 hr) for individual persistent (active at all time points) spines classified as visually responsive (G), unclassified (H), and network-correlated (I). For statistics, see Figure 3—source data 1. *p<0.05, ***p<0.001. Error bars, standard error of the mean (SEM).
-
Figure 3—source data 1
Statistical comparisons for Figure 3.
- https://cdn.elifesciences.org/articles/81958/elife-81958-fig3-data1-v2.docx
Figure 3—figure supplement 1
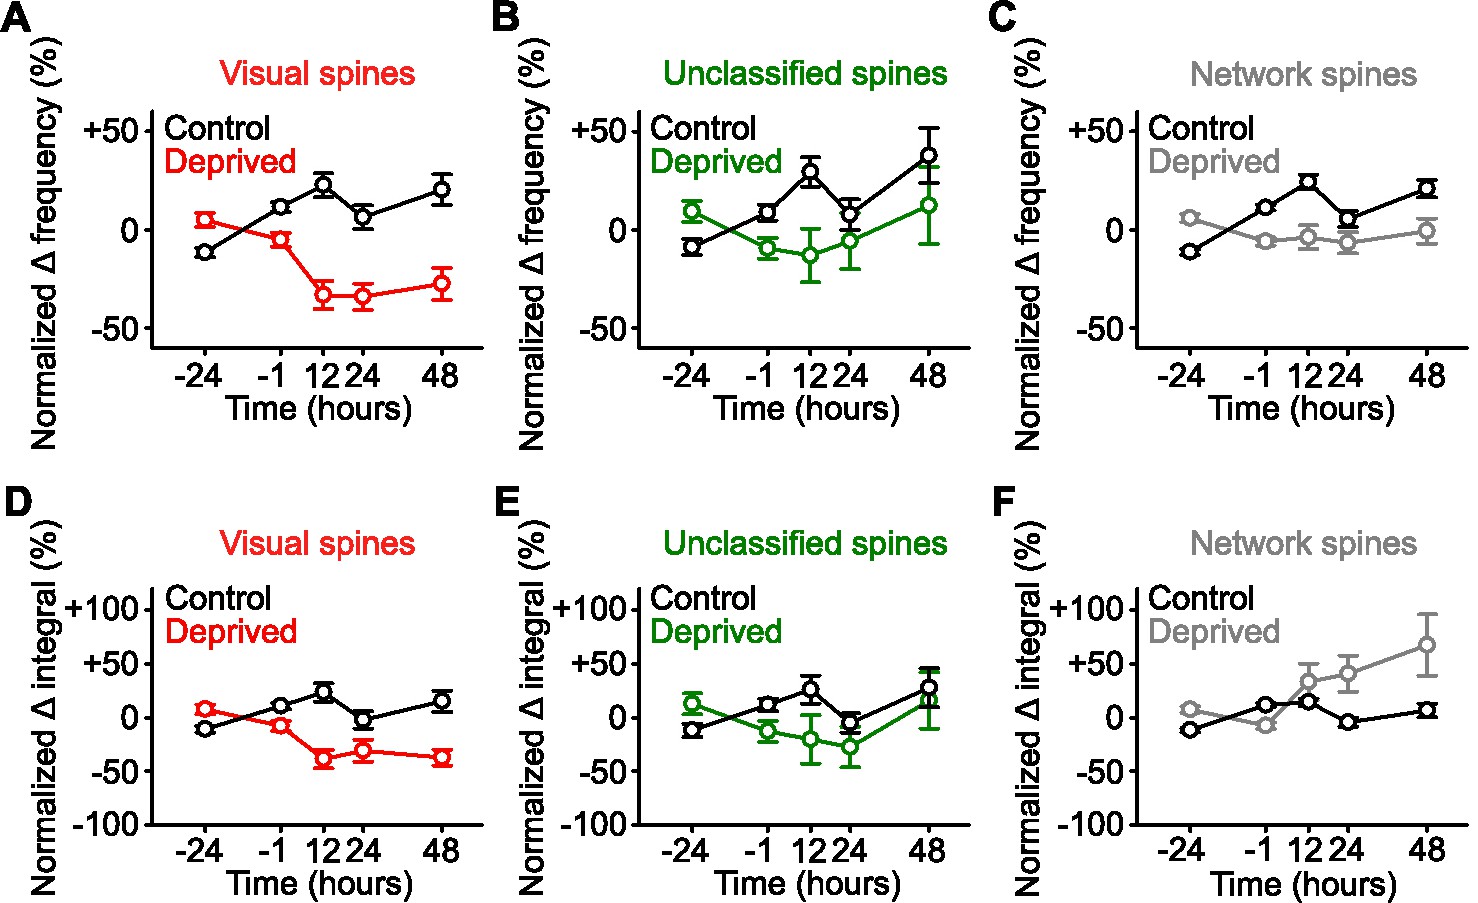
Network-correlated spines are functionally strengthened in visual cortex.
(A,B,C) Percent change in frequency normalized to baseline (–24 and –1 hr) of calcium transients for persistent (active at all time points) spines classified during baseline as visually responsive (A, red), unclassified (B, green), and network-correlated (C, gray) following enucleation (0 hr) or sham-enucleated controls (black). (D,E,F) Percent change in spine calcium transient total integral normalized to baseline (–24 and –1 hr) for persistent (active at all time points) spines classified during baseline as visually responsive (D, red), unclassified (E, green), and network-correlated (F, gray) following enucleation (0 hr) or sham-enucleated controls (black). Asterisks left off for clarity. For statistics, see Figure 3—figure supplement 1—source data 1. Error bars, standard error of the mean (SEM).
-
Figure 3—figure supplement 1—source data 1
Statistical comparisons for Figure 3—figure supplement 1.
- https://cdn.elifesciences.org/articles/81958/elife-81958-fig3-figsupp1-data1-v2.docx
Figure 4 with 1 supplement
Identified sensory responsive spines are not functionally strengthened after sensory deprivation.
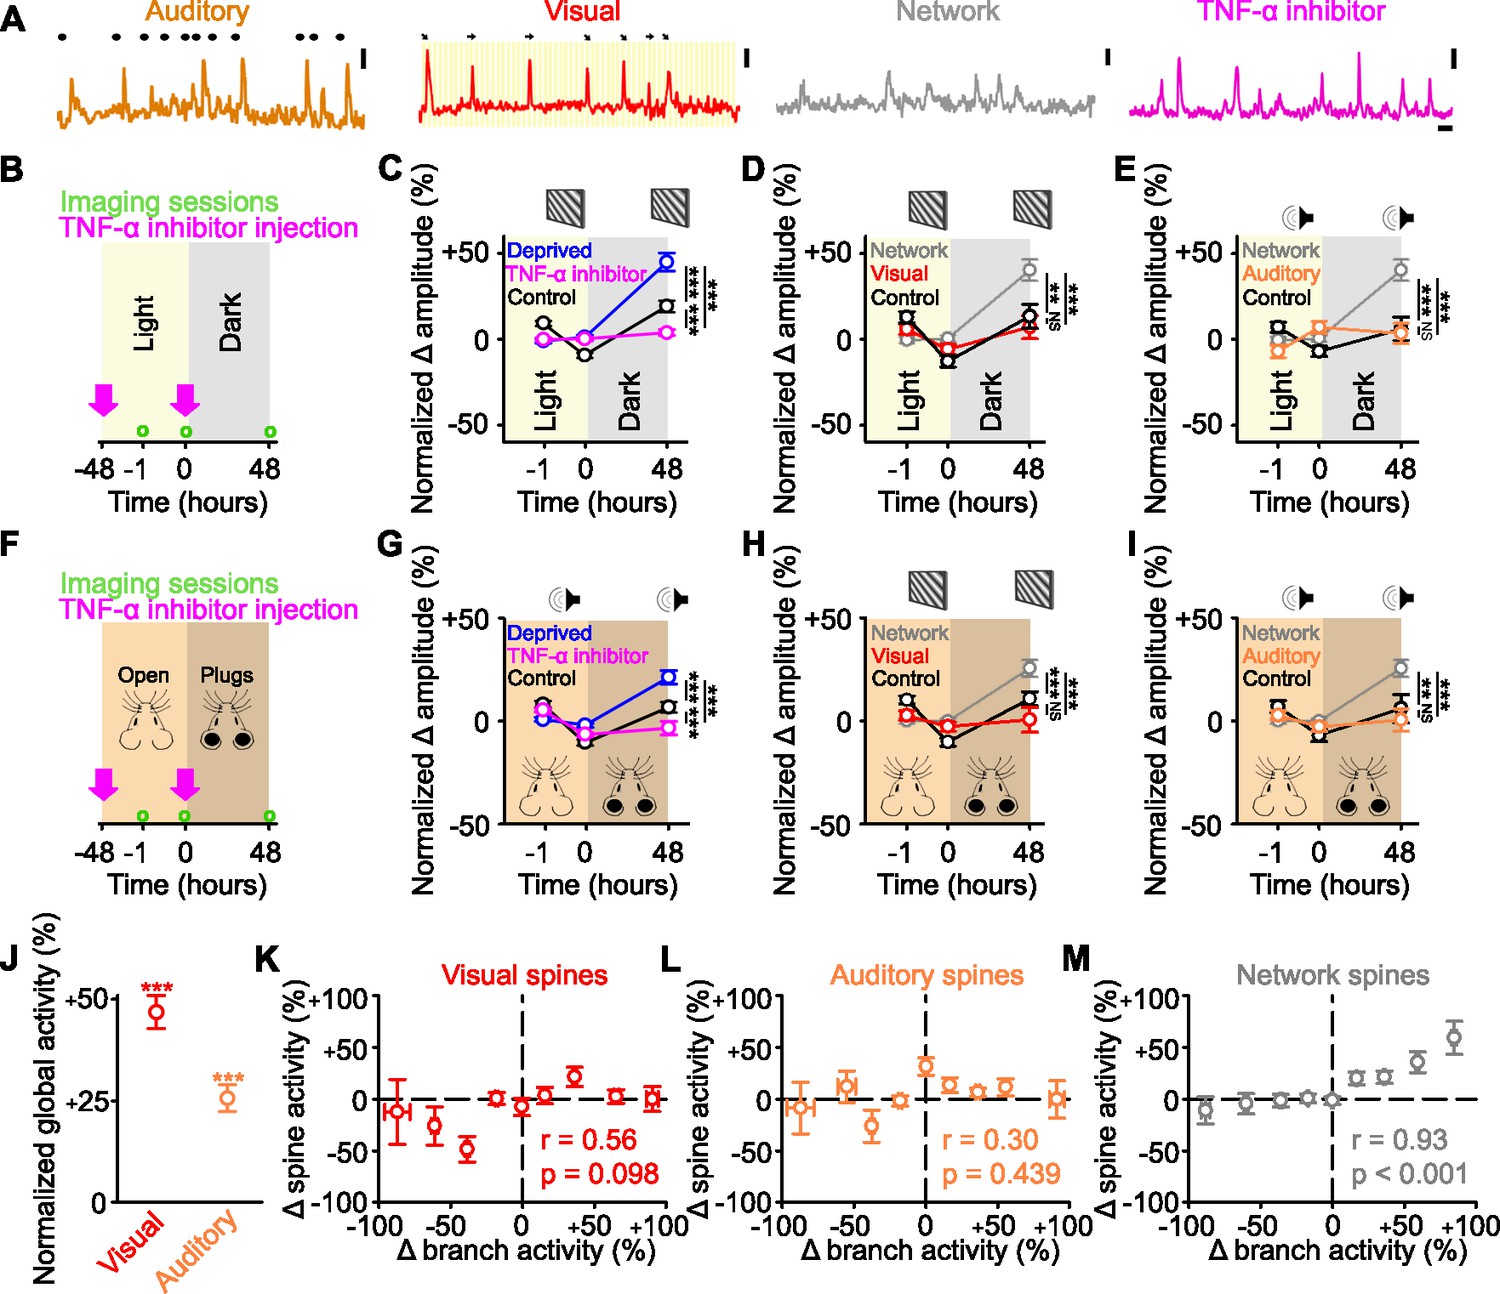
(A) Example activity of auditory responsive (orange), visually responsive (red), and network-correlated (gray) spines, as well as following tumor necrosis factor alpha (TNF-α) inhibitor injections (pink). Auditory: black dots above the trace indicate the timing of auditory stimuli. Visual: orientation and direction of presented visual stimuli that evoked a response are shown above the trace. Scale bars, 50% ΔF/F0 and 10 s. (B,F) Experimental timeline for dark exposure (B) or auditory ear plug (F) deprivation experiments showing imaging time points (green circles) and timing of TNF-α inhibitor injections (pink arrows). (C,G) Percent change in amplitude normalized to baseline (–1 and 0 hr) of all spines following visual (C) or auditory (G) deprivation (blue), control (black) or deprivation with TNF-α inhibition (pink) in response to drifting gratings (C) or auditory stimulation (G). (D,H) During presentation of drifting gratings, percent change in amplitude normalized to baseline (–1 and 0 hr) for control visually responsive spines (black), deprived network-correlated spines (gray), or deprived visually responsive spines (red) following visual deprivation (D) or auditory deprivation (H). (E,I) During auditory stimulation, percent change in amplitude normalized to baseline (–1 and 0 hr) for control auditory responsive spines (black), deprived network-correlated spines (gray), or deprived auditory responsive spines (orange) following visual deprivation (E) or auditory deprivation (I). (J) Forty-eight hours after visual deprivation, average global response amplitude (measured in dendritic branches) in response to drifting gratings (red) or auditory stimulation (orange), normalized to the response of the same branches to the same stimulus during baseline (–1 and 0 hr). (K,L,M) Change in activity 48 hr after visual deprivation normalized to baseline (–1 and 0 hr) for parent global dendritic branch activity and for spine activity for visually responsive (K), auditory responsive (L), and network-correlated (M) spines on that branch. For statistics, see Figure 4—source data 1. **p<0.01, ***p<0.001, NS, no significance. Error bars, standard error of the mean (SEM). Asterisks in C–I denote comparisons at 48 hr.
-
Figure 4—source data 1
Statistical comparisons for Figure 4.
- https://cdn.elifesciences.org/articles/81958/elife-81958-fig4-data1-v2.docx
Figure 4—figure supplement 1
Network-correlated spines are functionally strengthened in retrosplenial cortex (RSC).
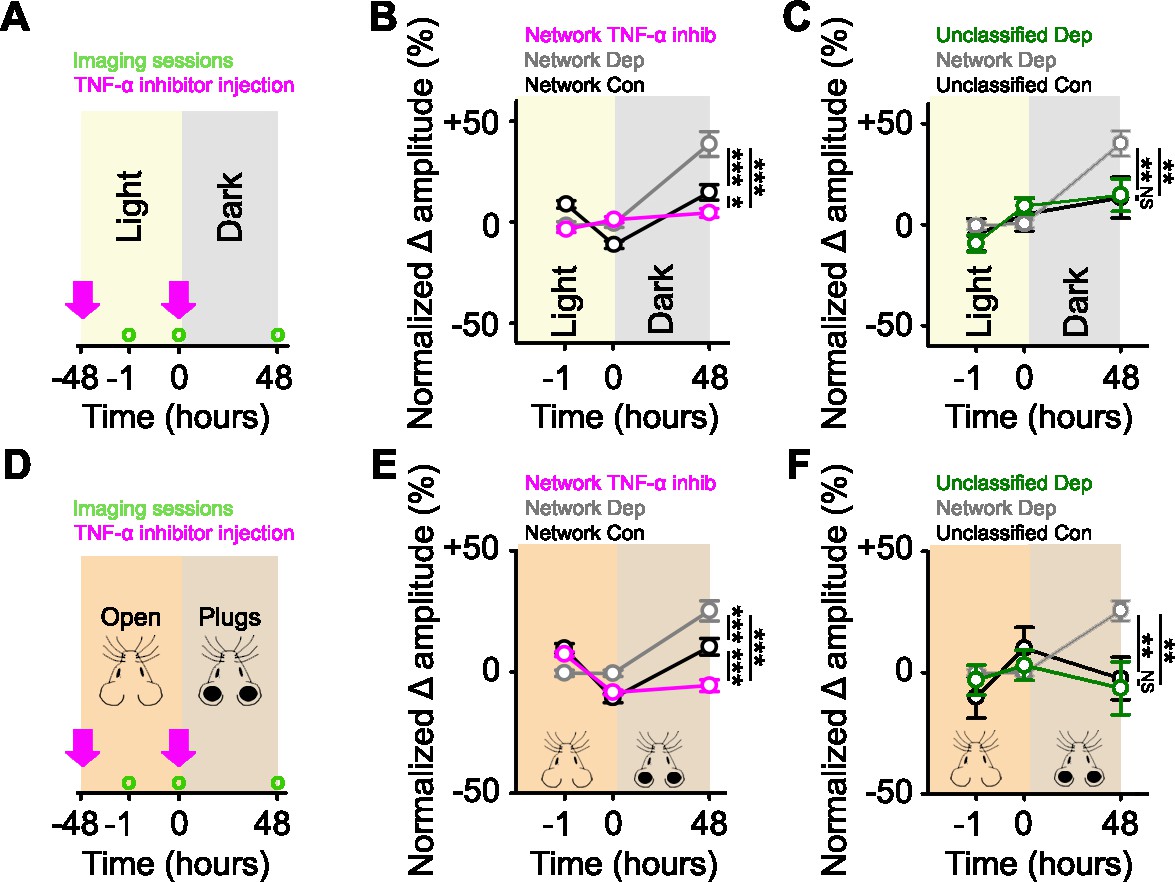
(A,D) Experimental timeline for dark exposure (A) or auditory ear plug (D) deprivation experiments in RSC showing imaging time points (green circles) and timing of tumor necrosis factor alpha (TNF-α) inhibitor injections (pink arrows). (B,E) Percent change in spine response amplitude normalized to baseline (–1 and 0 hr) of control network-correlated spines (black), deprived network-correlated spines (gray), or deprived network-correlated spines with TNF-α inhibition (pink), following visual (B) or auditory (E) deprivation in RSC. (C,F) Percent change in spine response amplitude normalized to baseline (–1 and 0 hr) of control unclassified spines (black), deprived unclassified spines (green), or deprived network-correlated spines (gray) following visual (C) or auditory (F) deprivation in RSC. For statistics, see Figure 4—figure supplement 1—source data 1. *p<0.05, **p<0.01, ***p<0.001, NS, no significance. Error bars, standard error of the mean (SEM). Asterisks denote comparisons at 48 hr.
-
Figure 4—figure supplement 1—source data 1
Statistical comparisons for Figure 4—figure supplement 1.
- https://cdn.elifesciences.org/articles/81958/elife-81958-fig4-figsupp1-data1-v2.docx
Tables
Key resources table
| Reagent type (species) or resource | Designation | Source or reference | Identifiers | Additional information |
|---|---|---|---|---|
| Strain, strain background (AAV) | AAV2/1-ef1a-GCaMP6s | FMI vector core | N/A | |
| Strain, strain background (Mus musculus) | C57BL/6J | Charles River | N/A | |
| Chemical compound, drug | XPRo1595 | Xencor, Inc | N/A |
Additional files
Download links
A two-part list of links to download the article, or parts of the article, in various formats.
Downloads (link to download the article as PDF)
Open citations (links to open the citations from this article in various online reference manager services)
Cite this article (links to download the citations from this article in formats compatible with various reference manager tools)
Homeostatic regulation through strengthening of neuronal network-correlated synaptic inputs
eLife 11:e81958.
https://doi.org/10.7554/eLife.81958


