Human DUX4 and mouse Dux interact with STAT1 and broadly inhibit interferon-stimulated gene induction
- Human Biology Division, Fred Hutchinson Cancer Research Center, United States
- Department of Biochemistry and Molecular Genetics, University of Colorado Anschutz Medical Campus, United States
- Clinical Research Division, Fred Hutchinson Cancer Research Center, United States
- Department of Neurology, University of Washington, United States
Figures
Figure 1 with 2 supplements
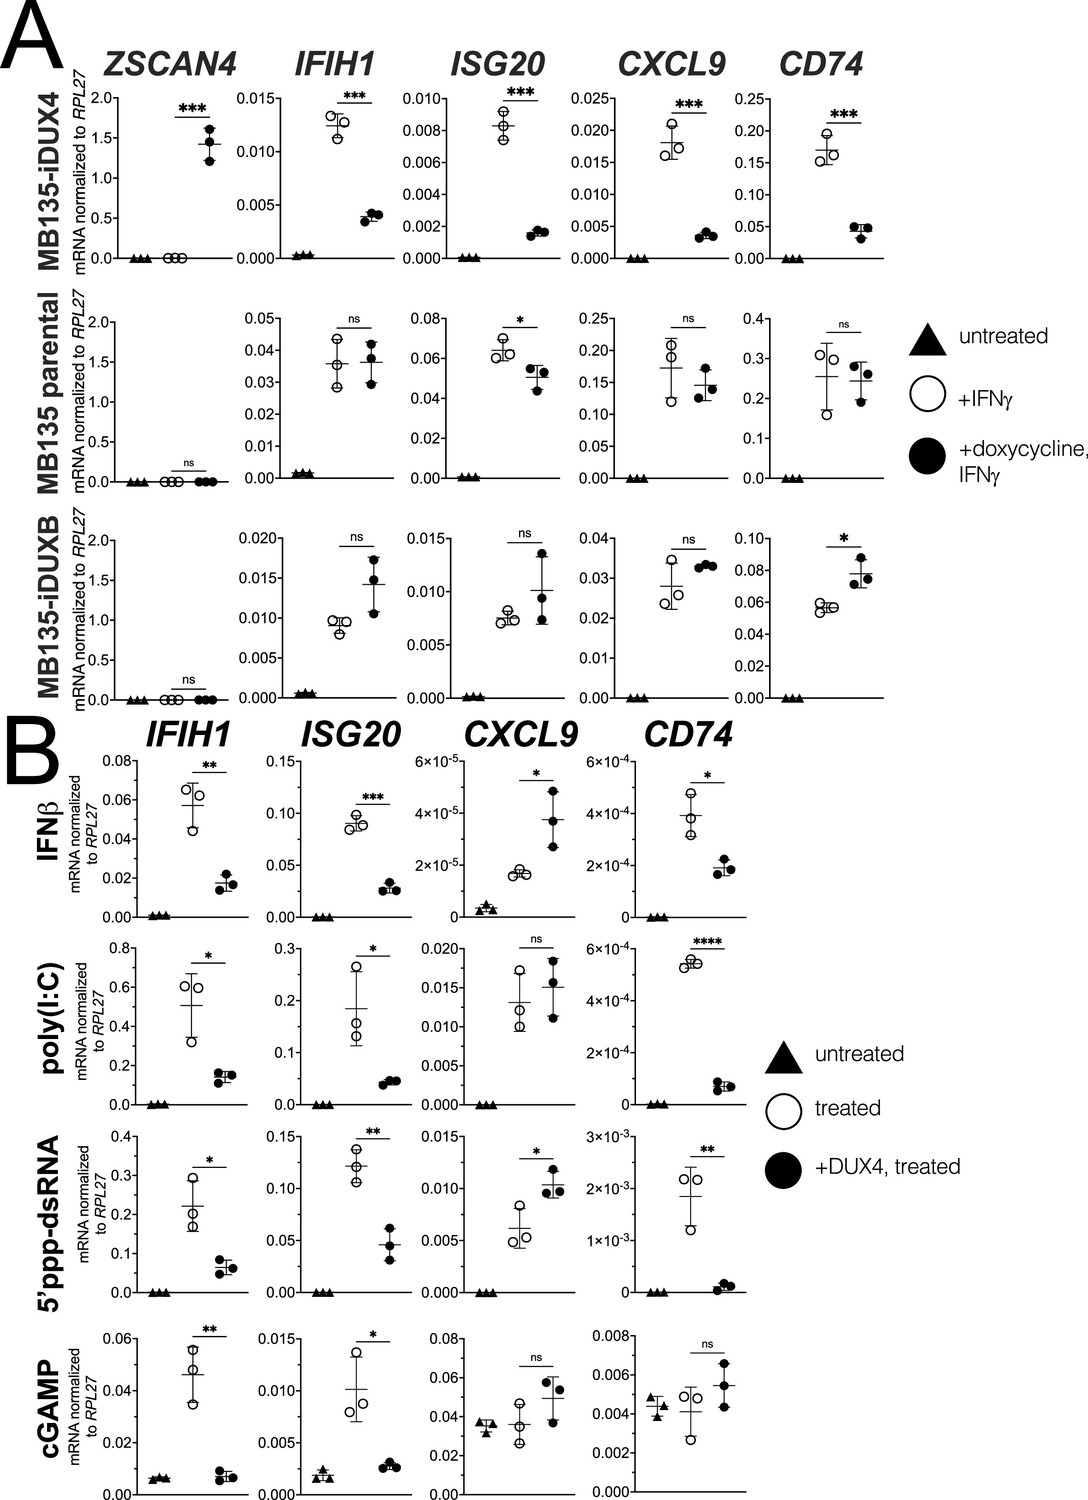
DUX4 suppresses interferon-stimulated gene (ISG) induction.
(A) MB135 cells expressing doxycycline-inducible DUX4 (MB135-iDUX4), parental MB135 cells, or MB135 cells expressing doxycycline-inducible DUXB (MB135-iDUXB) were untreated, treated with IFNγ, or treated with doxycycline and IFNγ. RT-qPCR was used to evaluate expression of a DUX4 target gene, ZSCAN4, and ISGs IFIH1, ISG20, CXCL9, and CD74. Ct values were normalized to the housekeeping gene RPL27. Data represent the mean ± SD of three biological replicates with three technical replicates each. See Figure 1—figure supplement 2 for biological replicates in independent cell lines. (B) MB135-iDUX4 cells were untreated, treated with either IFNβ (type 1 IFN pathway), poly(I:C) (IFIH1/MDA5 pathway), 5’ppp-dsRNA (DDX58/RIG-I pathway), or cGAMP (cGAS/STING pathway), or treated with doxycycline and the same immune reagent. RT-qPCR was used to evaluate expression of IFIH1, ISG20, CXCL9, and CD74. Ct values were normalized to the housekeeping gene RPL27. Data represent the mean ± SD of three biological replicates with three technical replicates each (unpaired t-test; ****p<0.0001, ***p<0.001, **p<0.01, *p<0.05, ns p>0.05).
Figure 1—figure supplement 1
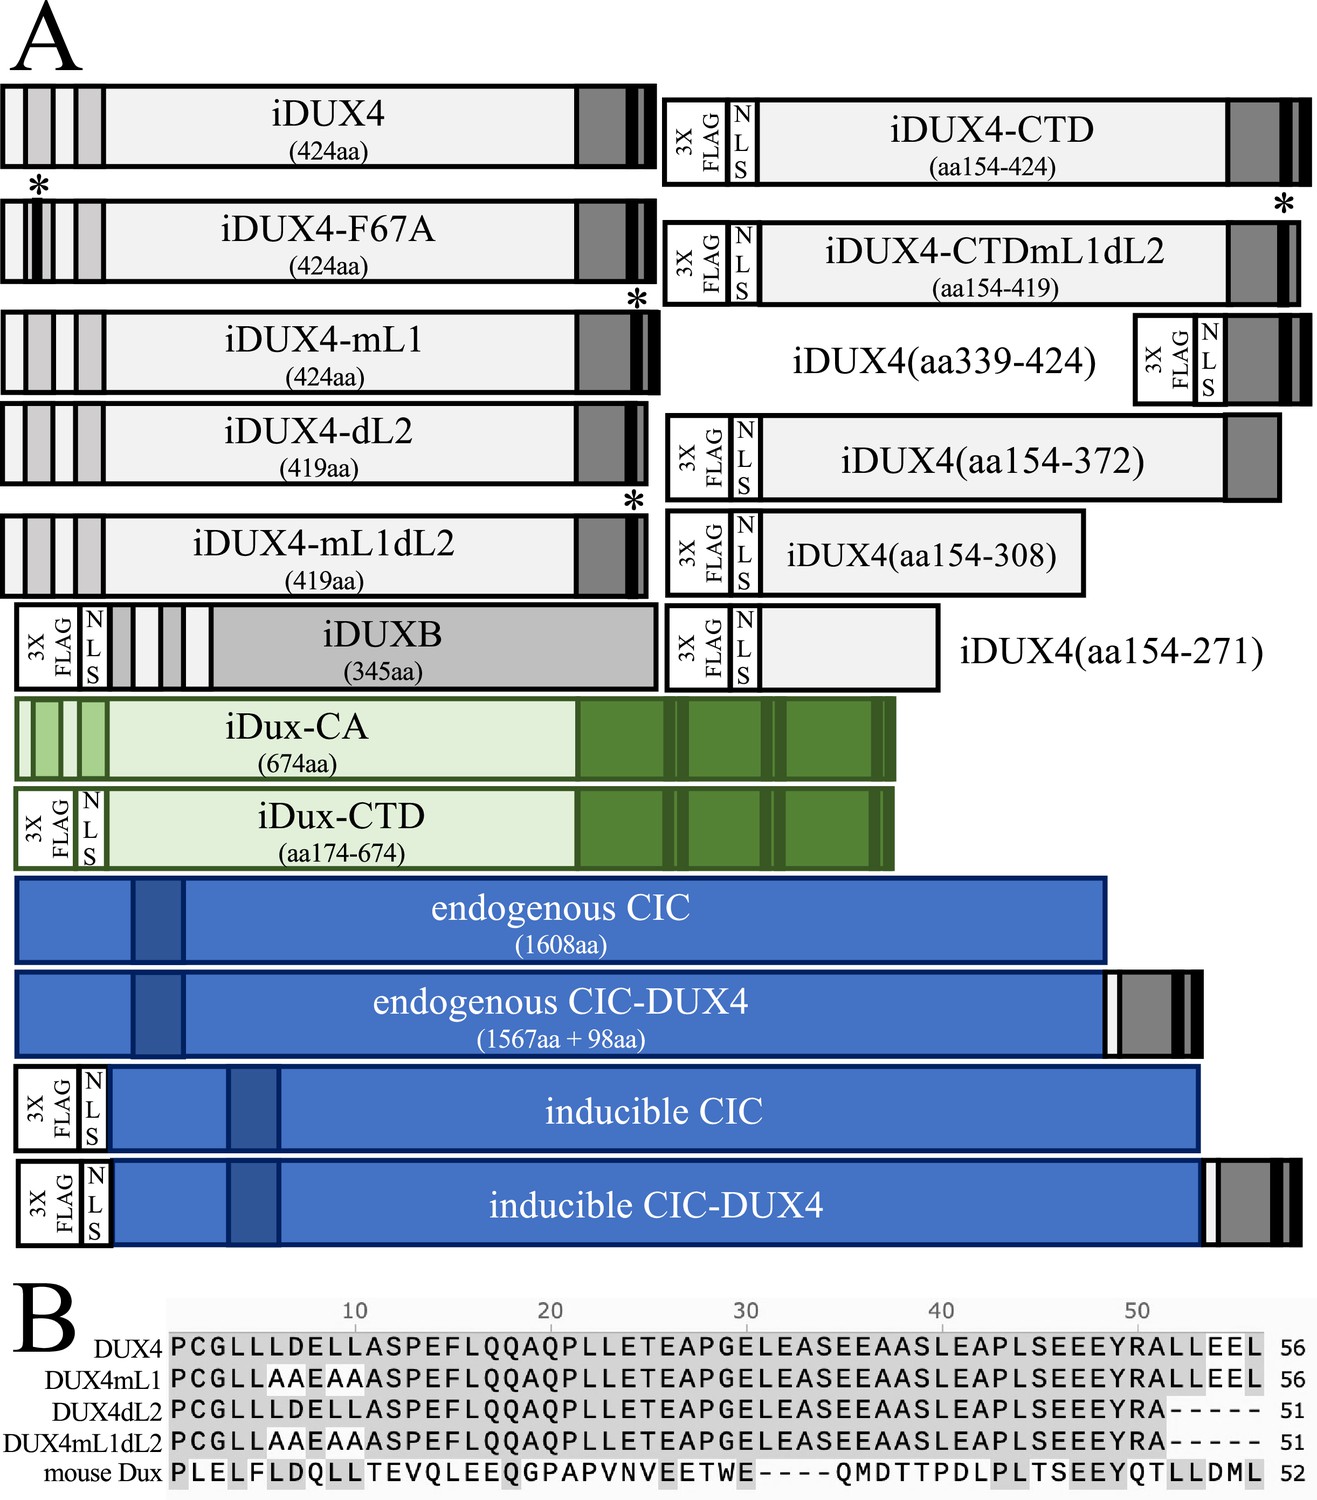
Schematics of constructs cloned for use in this study.
(A) Schematic depiction of each transgene used in this study highlighting the N-terminal homeodomains (light gray in DUX4, no fill in DUXB, light green in mDux), DNA-binding HMG box (dark blue in CIC and CIC-DUX4), conserved C-terminal domain (medium gray in DUX4 and CIC-DUX4, medium green in mouse Dux), (L)LxxL(L) (black in DUX4 and CIC-DUX4, dark green in mouse Dux), mutations (* and black bar F67A, * replacement of LDELL with AAEAA), and 3xFLAG-NLS cassette regions (no fill). ‘3XFLAG’ refers to a triplicated FLAG tag sequence. ‘NLS’ refers to two independent NLS sequences, derived from SV40 and the eight amino acid NLS from SMCHD1 (PPKRMRRE), which have been mapped functionally (Hiramuki and Tapscott, 2018). (B) MUSCLE alignment of the terminal ~50 aa of the human DUX4, mutated human DUX4 (mL1, dL2, mL1dL2), and mouse Dux constructs used in this study.
Figure 1—figure supplement 2
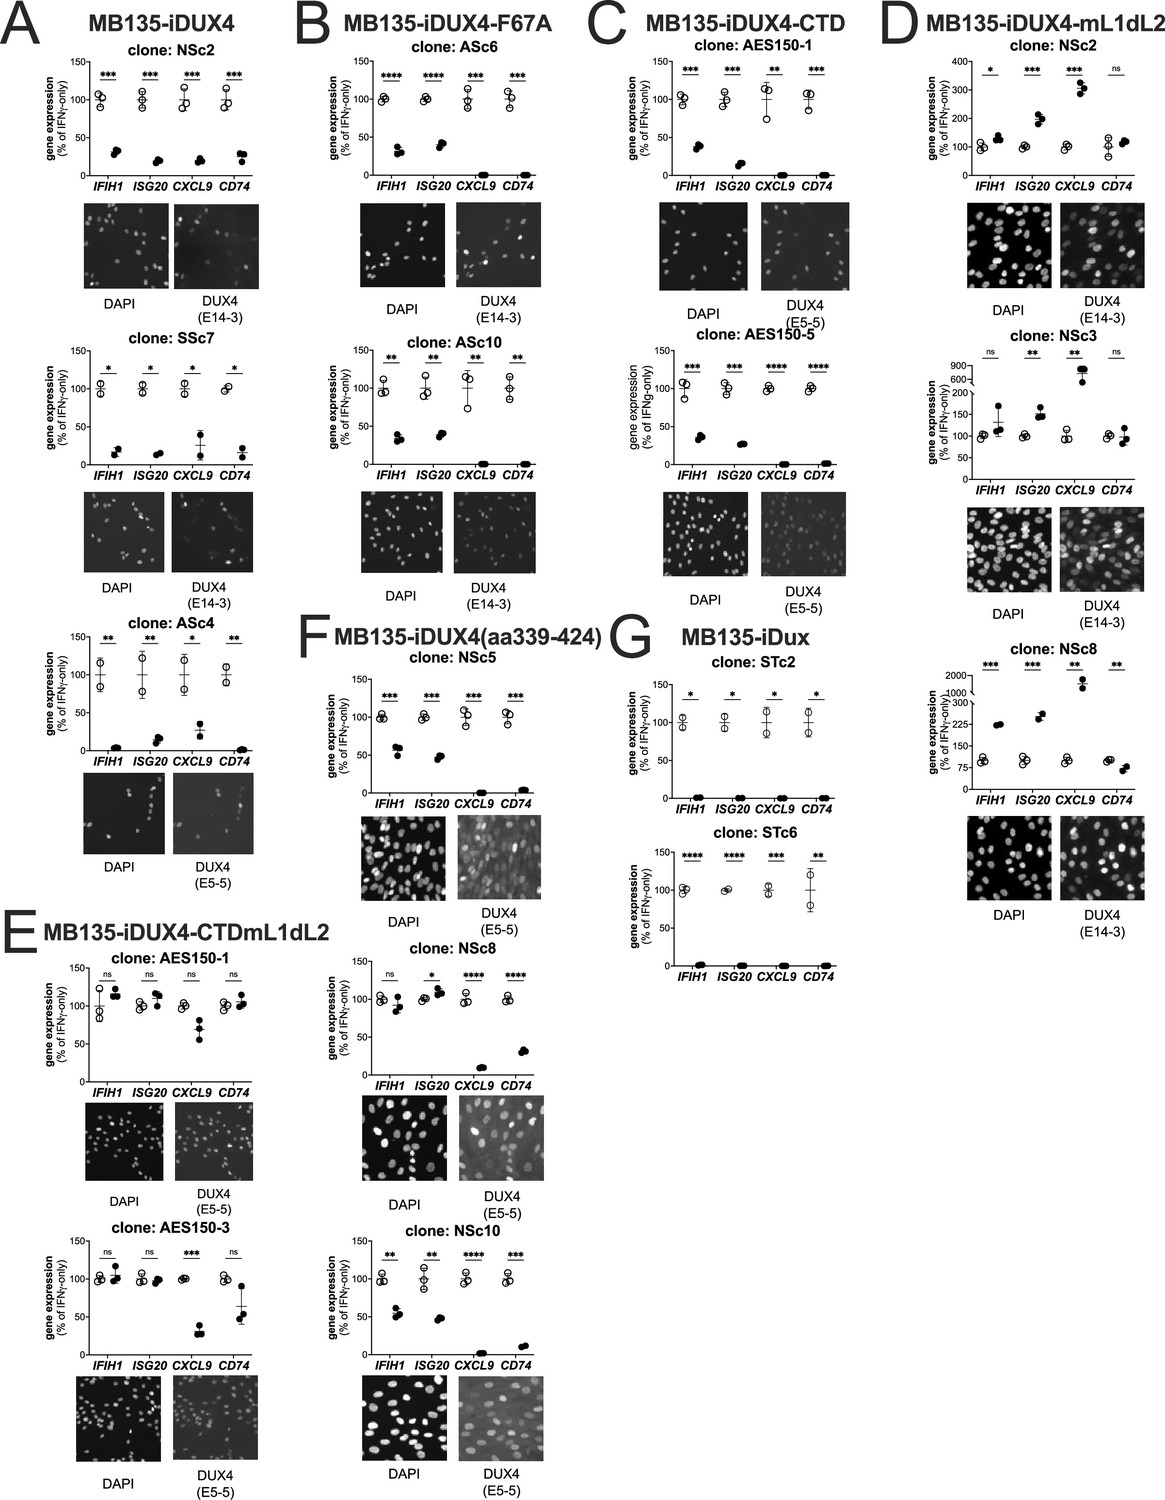
Biological replicates in independent cell lines for each DUX4 construct.
Additional subcloned MB135 cell lines of the iDUX4 (A), iDUX4-F67A (B), iDUX4-CTD (C), iDUX4mL1dL2 (D), iDUX4-CTDmL1dL2 (E), iDUX4aa339-324 (F), and iDux (G) treated with IFNγ ± doxycycline. RT-qPCR shows interferon-stimulated gene (ISG) expression graphed as a % of IFNγ-only. Data represent the mean ± SD of two or three biological replicates (see individual construct data points) with three technical replicates each (unpaired t-test, ****p<0.0001, ***p<0.005, **p<0.01, *p<0.05, ns = nonsignificant). Immunofluorescence panels show protein expression and nuclear localization using an antibody against the N-terminal (anti-DUX4 [E14-3]) or C-terminal (anti-DUX4 [E5-5]) residues of DUX4 as appropriate for the construct.
Figure 2
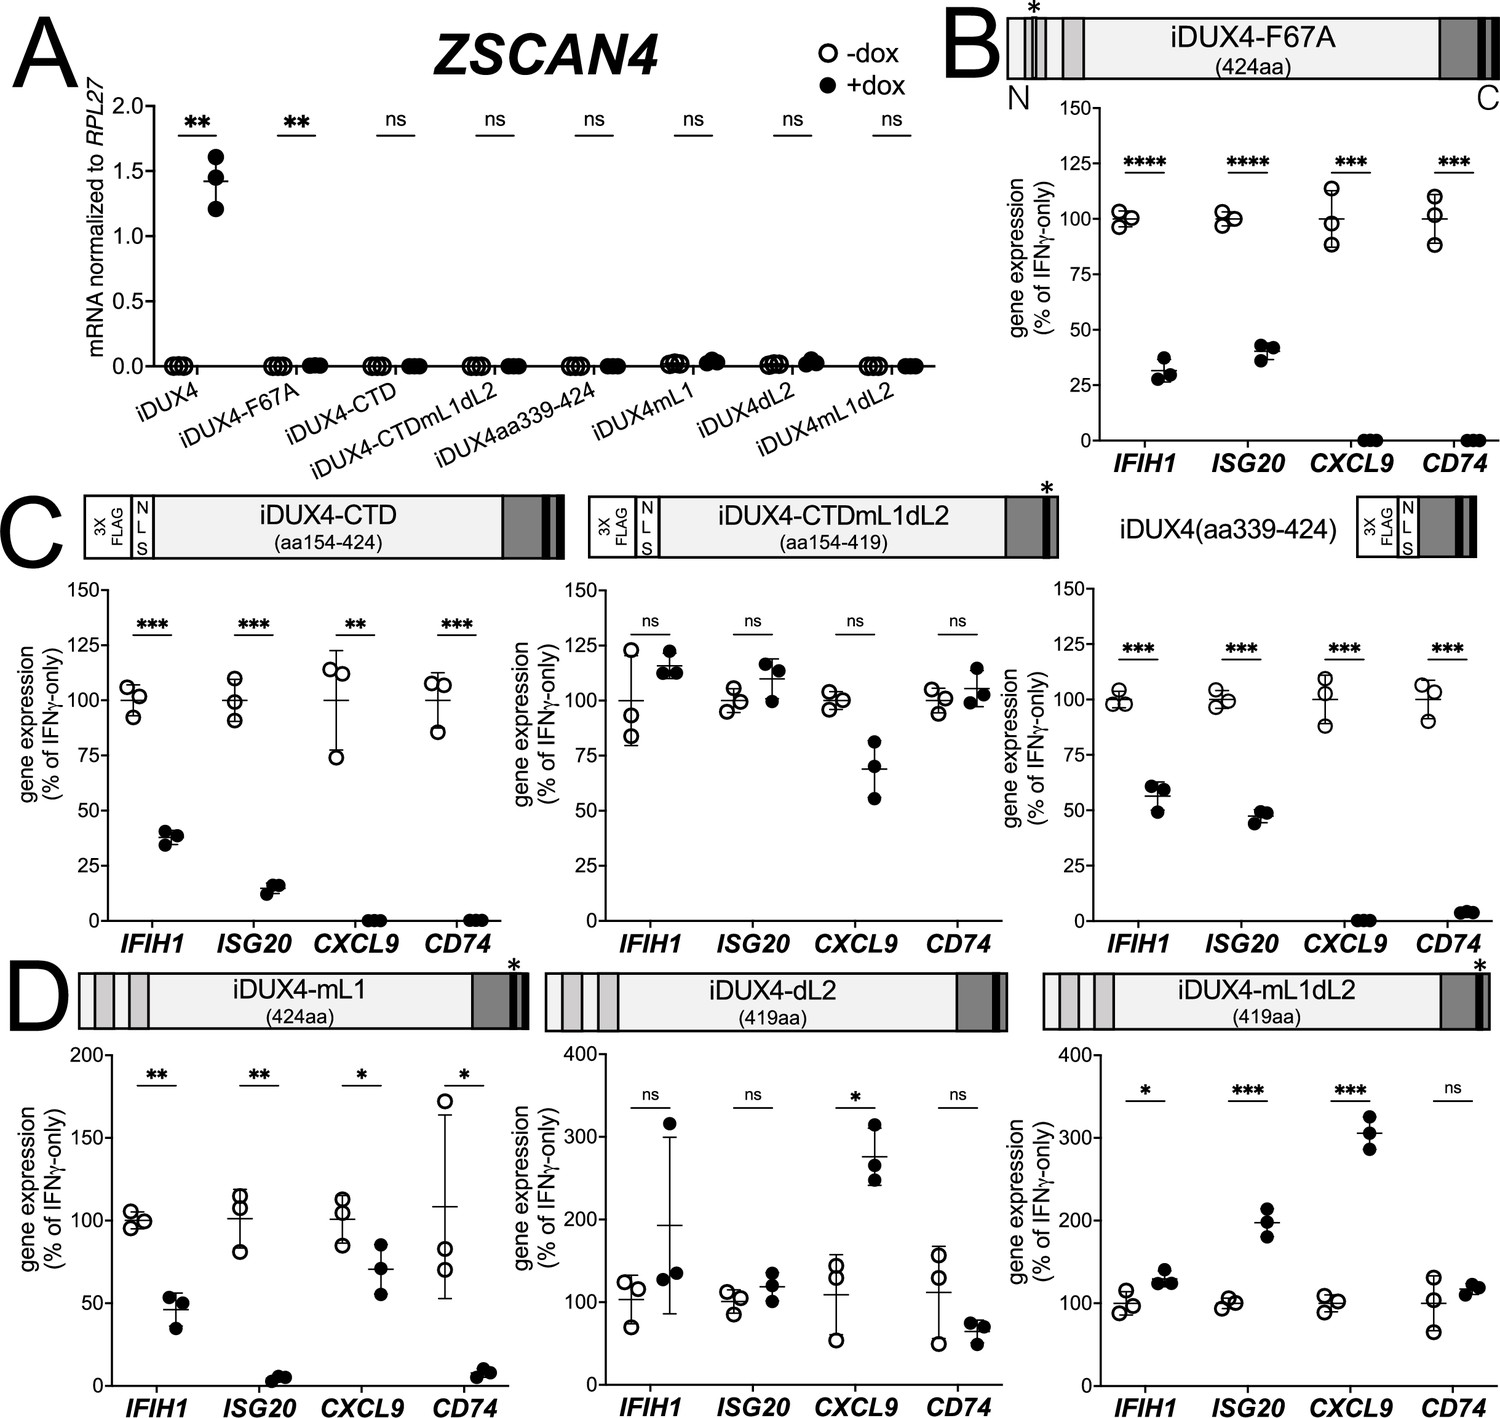
DUX4 transcriptional activity is not necessary for interferon-stimulated gene (ISG) suppression, whereas the C-terminal domain (CTD) is both necessary and sufficient.
(A) MB135 cell lines with the indicated doxycycline-inducible transgene ± doxycycline were evaluated for ZSCAN4 expression by RT-qPCR as a measure of the ability of the construct to activate a DUX4-target gene. Ct values were normalized to the housekeeping gene RPL27. Data represent the mean ± SD of three biological replicates with three technical replicates each. (B–D) MB135 cell lines with the indicated doxycycline-inducible transgene were treated with IFNγ ± doxycycline. Light gray, N-terminal boxes, homeodomains; medium gray, C-terminal box, conserved region of CTD; black, C-terminal boxes, (L)LxxL(L) motifs; * indicates sites of mutation for F67A in HD1 and mutation of first LLDELL to AADEAA. See Figure 1—figure supplement 1 for additional description of 3XFLAG and NLS cassette. RT-qPCR was used to evaluate expression of IFIH1, ISG20, CXCL9, and CD74 and Ct values were normalized to the housekeeping gene RPL27, then normalized to the IFNγ-only treatment to set the induced level to 100%. Data represent the mean ± SD of three biological replicates with three technical replicates each (unpaired t-test; ****p<0.0001, ***p<0.001, **p<0.01, *p<0.05, ns p>0.05). See Figure 1—figure supplement 2 for additional cell lines.
Figure 3
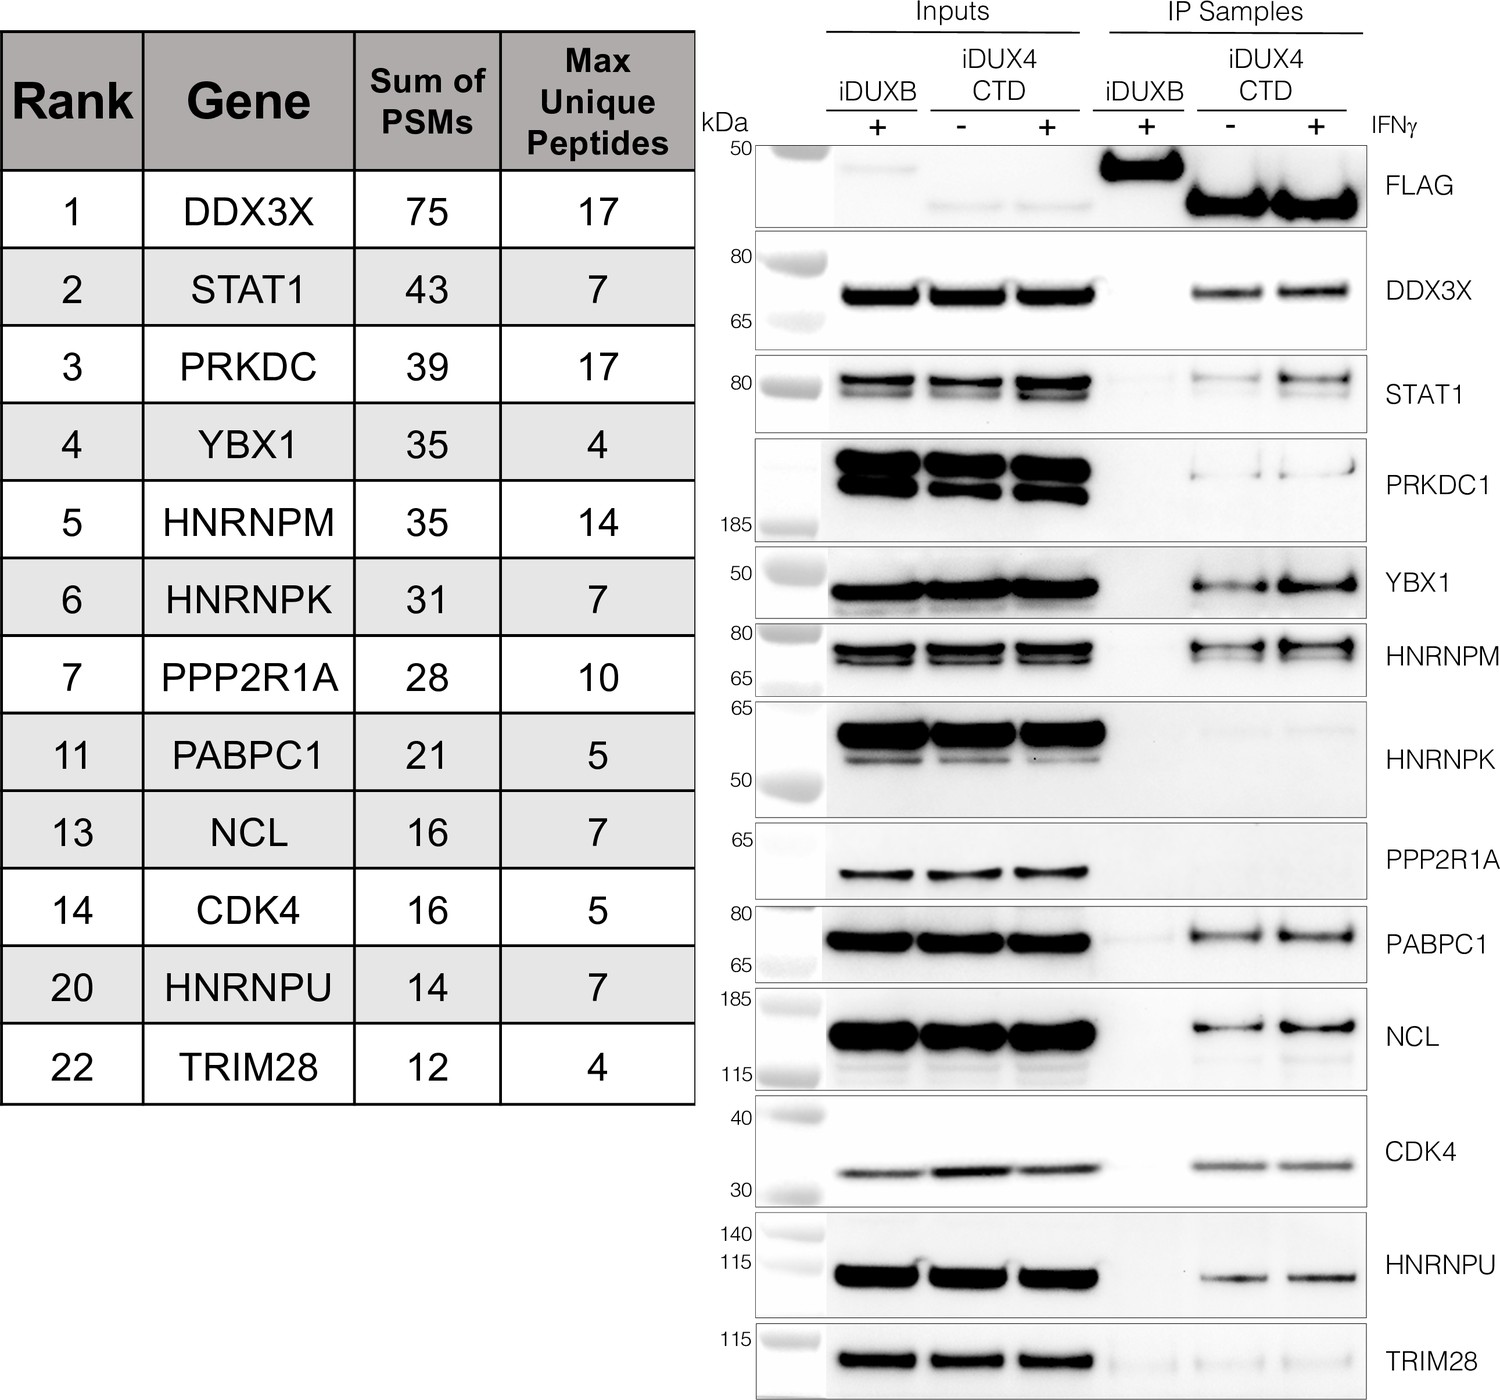
The DUX4 protein interacts with STAT1 and additional immune response regulators.
Left panel, representative candidate interactors identified by mass spectrometry of proteins that co-immunoprecipitated with the DUX4-CTD and their relative ranking in the candidate list (see Supplementary file 2 for full list). Right panel, validation western blot of proteins that co-immunoprecipitate with the DUX4-CTD in cell lysates from MB135 cells expressing doxycycline-inducible 3xFLAG-DUXB or 3xFLAG-DUX4-CTD, ± IFNγ treatment. Data represent biological duplicates. See Figure 3—source data 1 for uncropped/raw images.
-
Figure 3—source data 1
Validation co-IP from inducible MB135 cells lines, anti-FLAG.
Western blot showing anti-FLAG signal. ‘*’ marks correct size band. Blot was physically cut to probe with multiple antibodies, multiple separate blots were imaged in this exposure/file. Bottom blot (boxed in green) is relevant for this figure and was probed with anti-FLAG. Signal from ECL only appears in the chemiluminescence channel. Protein ladder appears in white light channel.
- https://cdn.elifesciences.org/articles/82057/elife-82057-fig3-data1-v3.zip
-
Figure 3—source data 2
Validation co-IP from inducible MB135 cell lines, anti-DDX3X.
Western blot showing anti-DDX3X signal. * marks correct size band. Blot was physically cut to probe with multiple antibodies, multiple separate blots were imaged in this exposure/file. Top right blot (boxed in green) is relevant for this figure and was probed with anti-DDX3X. Signal from ECL only appears in the chemiluminescence channel. Protein ladder appears in white light channel.
- https://cdn.elifesciences.org/articles/82057/elife-82057-fig3-data2-v3.zip
-
Figure 3—source data 3
Validation co-IP from inducible MB135 cell lines, anti-STAT1.
Western blot showing anti-STAT1 signal. * marks correct size band. Blot was physically cut to probe with multiple antibodies, multiple separate blots were imaged in this exposure/file. Middle blot (boxed in green) is relevant for this figure and was probed with anti-STAT1. The multiple bands represent the alpha (upper) and beta (lower) isoforms of STAT1. Signal from ECL only appears in the chemiluminescence channel. Protein ladder appears in white light channel.
- https://cdn.elifesciences.org/articles/82057/elife-82057-fig3-data3-v3.zip
-
Figure 3—source data 4
Validation co-IP from inducible MB135 cell lines, anti-PRKDC.
Western blot showing anti-PRKDC signal. * marks correct size band. Blot was physically cut to probe with multiple antibodies, multiple separate blots were imaged in this exposure/file. Top blot (boxed in green) is relevant for this figure and was probed with anti-PRKDC. Signal from ECL only appears in the chemiluminescence channel. Protein ladder appears in white light channel.
- https://cdn.elifesciences.org/articles/82057/elife-82057-fig3-data4-v3.zip
-
Figure 3—source data 5
Validation co-IP from inducible MB135 cell lines, anti-YBX1.
Western blot showing anti-YBX1 signal. * marks correct size band. Blot was physically cut to probe with multiple antibodies, multiple separate blots were imaged in this exposure/file. Bottom blot (boxed in green) is relevant for this figure and was probed with anti-YBX1. Signal from ECL only appears in the chemiluminescence channel. Protein ladder appears in white light channel.
- https://cdn.elifesciences.org/articles/82057/elife-82057-fig3-data5-v3.zip
-
Figure 3—source data 6
Validation co-IP from inducible MB135 cell lines, anti-hnRNPM.
Western blot showing anti-hnRNPM signal. * marks correct size band. Blot was physically cut to probe with multiple antibodies, multiple separate blots were imaged in this exposure/file. Middle blot (boxed in green) is relevant for this figure and was probed with anti-hnRNPM. Signal from ECL only appears in the chemiluminescence channel. Protein ladder appears in white light channel.
- https://cdn.elifesciences.org/articles/82057/elife-82057-fig3-data6-v3.zip
-
Figure 3—source data 7
Validation co-IP from inducible MB135 cell lines, anti-hnRNPK.
Western blot showing anti-hnRNPK signal. * marks correct size band. Blot was physically cut to probe with multiple antibodies, multiple separate blots were imaged in this exposure/file. Top blot (boxed in green) is relevant for this figure and was probed with anti-hnRNPK. Signal from ECL only appears in the chemiluminescence channel. Protein ladder appears in white light channel.
- https://cdn.elifesciences.org/articles/82057/elife-82057-fig3-data7-v3.zip
-
Figure 3—source data 8
Validation co-IP from inducible MB135 cell lines, anti-PPP2R1A.
Western blot showing anti-PPP2R1A signal. * marks correct size band. Blot was physically cut to probe with multiple antibodies, multiple separate blots were imaged in this exposure/file. Bottom right blot (boxed in green) is relevant for this figure and was probed with PPP2R1A. Signal from ECL only appears in the chemiluminescence channel. Protein ladder appears in white light channel.
- https://cdn.elifesciences.org/articles/82057/elife-82057-fig3-data8-v3.zip
-
Figure 3—source data 9
Validation co-IP from inducible MB135 cell lines, anti-PABPC1.
Western blot showing anti-PABPC1 signal. * marks correct size band. Blot was physically cut to probe with multiple antibodies, multiple separate blots were imaged in this exposure/file. Top blot (boxed in green) is relevant for this figure and was probed with anti-PABPC1. Signal from ECL only appears in the chemiluminescence channel. Protein ladder appears in white light channel.
- https://cdn.elifesciences.org/articles/82057/elife-82057-fig3-data9-v3.zip
-
Figure 3—source data 10
Validation co-IP from inducible MB135 cell lines, anti-NCL.
Western blot showing anti-NCL signal. * marks correct size band. Blot was physically cut to probe with multiple antibodies, multiple separate blots were imaged in this exposure/file. Blot was probed with anti-NCL. Signal from ECL only appears in the chemiluminescence channel. Protein ladder appears in white light channel.
- https://cdn.elifesciences.org/articles/82057/elife-82057-fig3-data10-v3.zip
-
Figure 3—source data 11
Validation co-IP from inducible MB135 cell lines, anti-CDK4.
Western blot showing anti-CDK4 signal. * marks correct size band. Blot was physically cut to probe with multiple antibodies, multiple separate blots were imaged in this exposure/file. Middle right blot (boxed in green) is relevant for this figure and was probed with anti-CDK4. Signal from ECL only appears in the chemiluminescence channel. Protein ladder appears in white light channel.
- https://cdn.elifesciences.org/articles/82057/elife-82057-fig3-data11-v3.zip
-
Figure 3—source data 12
Validation co-IP from inducible MB135 cell lines, anti-hnRNPU.
Western blot showing anti-hnRNPU signal. * marks correct size band. Blot was physically cut to probe with multiple antibodies, multiple separate blots were imaged in this exposure/file. Bottom blot (boxed in green) is relevant for this figure and was probed with anti-hnRNPU. Signal from ECL only appears in the chemiluminescence channel. Protein ladder appears in white light channel.
- https://cdn.elifesciences.org/articles/82057/elife-82057-fig3-data12-v3.zip
-
Figure 3—source data 13
Validation co-IP from inducible MB135 cell lines, anti-TRIM28.
Western blot showing anti-TRIM28 signal. * marks correct size band. Blot was physically cut to probe with multiple antibodies, multiple separate blots were imaged in this exposure/file. Top blot (boxed in green) is relevant for this figure and was probed with anti-TRIM28. Signal from ECL only appears in the chemiluminescence channel. Protein ladder appears in white light channel.
- https://cdn.elifesciences.org/articles/82057/elife-82057-fig3-data13-v3.zip
Figure 4 with 2 supplements
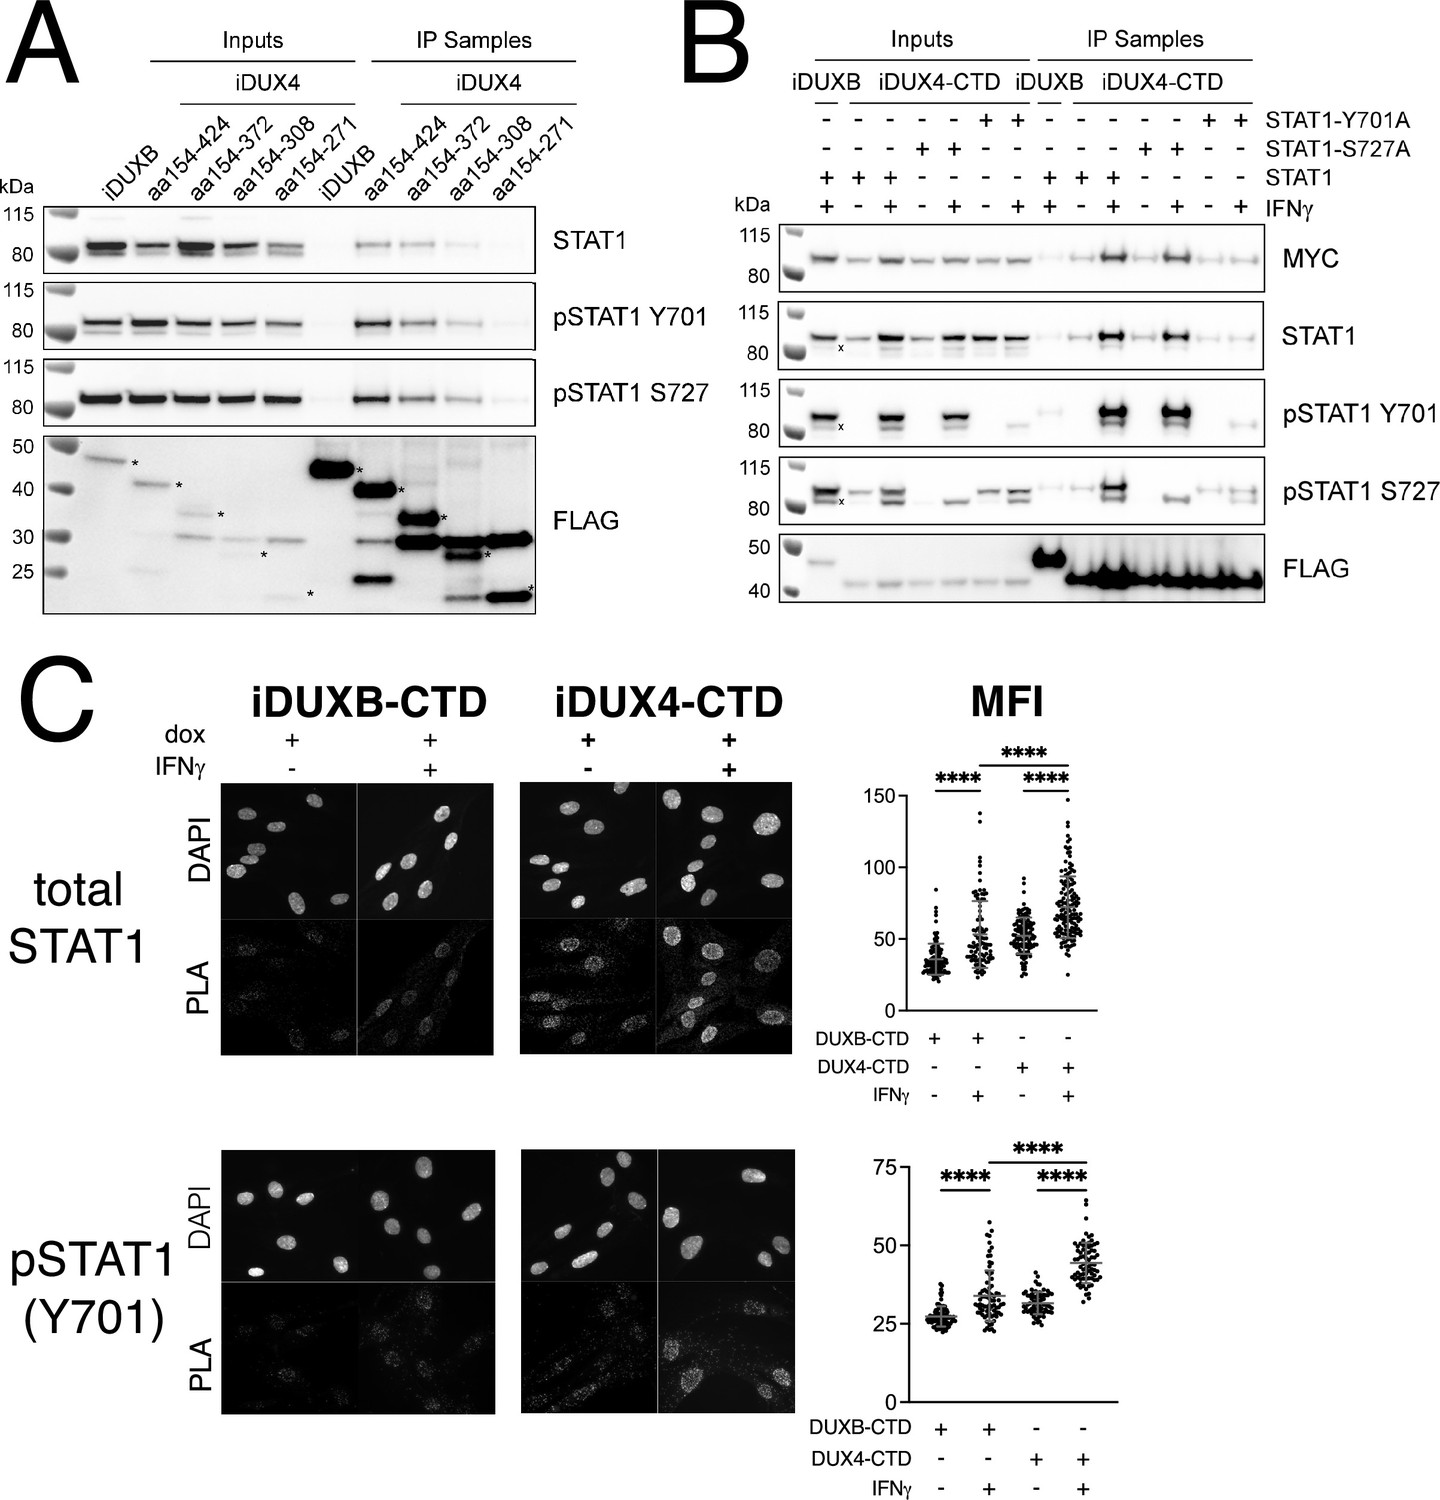
The DUX4-CTD preferentially interacts with pSTAT1-Y701.
(A) Western blot showing input and immunoprecipitated proteins from either 3xFLAG-iDUXB (DUXB) or a truncation series of the 3x-FLAG-iDUX4-CTD cells (iDUX4) precipitated with anti-FLAG and probed with the indicated antibodies. Serial deletions of the iDUX4-CTD were assayed as indicated. All samples were treated with IFNγ.An asterisk indicates the correct band for each FLAG-tagged construct. See Figure 4—source data 1 for uncropped/raw Western blots. (B) Input and anti-FLAG immunoprecipitation from 3xFLAG-iDUXB or 3x-FLAG-iDUX4-CTD cells co-expressing doxycycline-inducible 3xMYC-iSTAT1, -iSTAT1-Y701A, or -iSTAT1-S727A with or without IFNγ treatment and probed with the indicated antibodies. An ‘x’ indicates the endogenous (non-MYC tagged) STAT1 band. See Figure 4—source data 1 for uncropped/raw Western blots. (C) Proximity ligation assay (PLA) showing co-localization of endogenous STAT1 and pSTAT1 701 with the iDUX4-CTD compared to the interaction with the DUXB-CTD, in the nuclear compartment of IFNγ- and doxycycline-treated MB135 cells. Mean fluorescent intensity (MFI) of the nuclei in the PLA channel was measured for 10 images per cell line and treatment and plotted (unpaired t-test; ****p<0.0001).
-
Figure 4—source data 1
Co-IP from inducible MB135 cell lines, anti-STAT1.
Western blot showing anti-STAT1 signal for Figure 4A. * marks correct size band. Blot was physically cut to probe with multiple antibodies, multiple separate blots were imaged in this exposure/file. Top left blot (boxed in green) is relevant for this figure and was probed with anti-STAT1. The multiple bands represent the alpha (upper) and beta (lower) isoforms of STAT1.
- https://cdn.elifesciences.org/articles/82057/elife-82057-fig4-data1-v3.zip
-
Figure 4—source data 2
Co-IP from inducible MB135 cell lines, anti-pSTAT1(Y701).
Western blot showing anti-pSTAT1(Y701) signal for Figure 4A. * marks correct size band. Blot was physically cut to probe with multiple antibodies, multiple unrelated blots were imaged in this exposure/file. Top blot (boxed in green) is relevant for this figure and was probed with anti-pSTAT1(Y701). Protein ladder appears in white light channel. Signal from ECL only appears in the chemiluminescence channel. The multiple bands represent the alpha (upper) and beta (lower) isoforms of STAT1.
- https://cdn.elifesciences.org/articles/82057/elife-82057-fig4-data2-v3.zip
-
Figure 4—source data 3
Co-IP from inducible MB135 cell lines, anti-pSTAT1(S727).
Western blot showing anti-pSTAT1(S727) signal for Figure 4A. * marks correct size band. This blot is probed with anti-pSTAT1(S727). Protein ladder appears in white light channel. Signal from ECL only appears in the chemiluminescence channel.
- https://cdn.elifesciences.org/articles/82057/elife-82057-fig4-data3-v3.zip
-
Figure 4—source data 4
Co-IP from inducible MB135 cell lines, anti-FLAG.
Western blot showing anti-FLAG signal for Figure 4A. * marks correct size band. Blot was physically cut to probe with multiple antibodies, multiple unrelated blots were imaged in this exposure/file. Bottom left blot (boxed in green) is probed with anti-FLAG. Protein ladder appears in white light channel. Signal from ECL only appears in the chemiluminescence channel.
- https://cdn.elifesciences.org/articles/82057/elife-82057-fig4-data4-v3.zip
-
Figure 4—source data 5
Co-IP from dual-inducible MB135 cell lines, anti-MYC.
Western blot showing anti-MYC signal for Figure 4B. * marks correct size band. Blot was physically cut to probe with multiple antibodies, multiple separate blots were imaged in this exposure/file. Top blot (boxed in green) is relevant for this figure and was probed with anti-MYC to detect the INDUCIBLE MYC-tagged STAT1 or STAT1-mutant transgene. Signal from ECL only appears in the chemiluminescence channel. Protein ladder appears in white light channel.
- https://cdn.elifesciences.org/articles/82057/elife-82057-fig4-data5-v3.zip
-
Figure 4—source data 6
Co-IP from dual-inducible MB135 cell lines, anti-STAT1.
Western blot showing anti-STAT1 signal for Figure 4B. * marks correct size band. Blot was physically cut to probe with multiple antibodies, multiple unrelated blots were imaged in this exposure/file. Middle blot (boxed in green) is probed with anti-STAT1 to detect the INDUCIBLE MYC-tagged STAT1 transgene. Protein ladder only appears in the ‘white light’ exposure. Signal from ECL only appears in the chemiluminescence channel.
- https://cdn.elifesciences.org/articles/82057/elife-82057-fig4-data6-v3.zip
-
Figure 4—source data 7
Co-IP from dual-inducible MB135 cell lines, anti-pSTAT1(Y701).
Western blot showing anti-pSTAT1(Y701) signal for Figure 4B. * marks correct size band. Blot is probed with anti-pSTAT1(Y701) to detect the phosphorylated INDUCIBLE MYC-tagged STAT1 or MYC-tagged STAT1-mutant transgene. Protein ladder only appears in the ‘white light’ exposure. Signal from ECL only appears in the chemiluminescence channel.
- https://cdn.elifesciences.org/articles/82057/elife-82057-fig4-data7-v3.zip
-
Figure 4—source data 8
Co-IP from dual-inducible MB135 cell lines, anti-pSTAT1(S727).
Western blot showing anti-pSTAT1(S727) signal for Figure 4B. * marks correct size band for the INDUCIBLE MYC-tagged STAT1 or mutated-STAT1. Lower band represents endogenous STAT1. Blot is probed with anti-pSTAT1(S727). Protein ladder only appears in the ‘white light’ exposure. Signal from ECL only appears in the chemiluminescence channel.
- https://cdn.elifesciences.org/articles/82057/elife-82057-fig4-data8-v3.zip
-
Figure 4—source data 9
Co-IP from dual-inducible MB135 cell lines, anti-FLAG.
Western blot showing anti-FLAG signal for Figure 4B. * marks correct size band. Blot was physically cut to probe with multiple antibodies, multiple unrelated blots were imaged in this exposure/file. Lower blot (boxed in green) is probed with anti-FLAG to detect the INDUCIBLE FLAG-tagged DUXB or DUX4-CTD transgene. Protein ladder only appears in the ‘white light’ exposure. Signal from ECL only appears in the chemiluminescence channel.
- https://cdn.elifesciences.org/articles/82057/elife-82057-fig4-data9-v3.zip
Figure 4—figure supplement 1
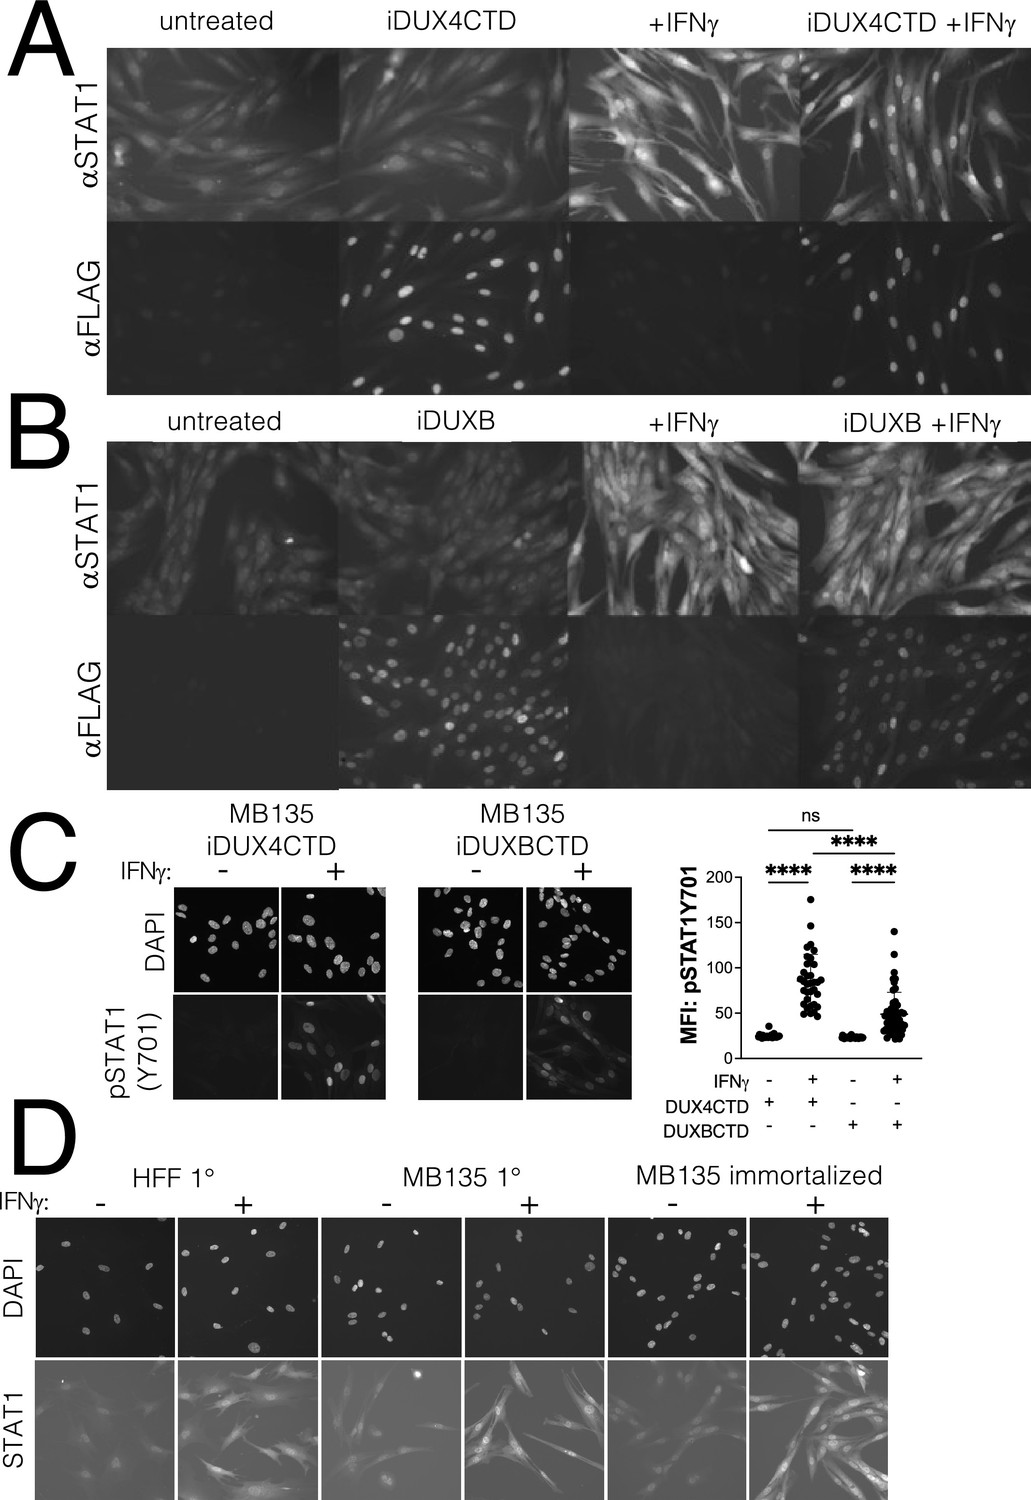
Expression of the DUX4-CTD does not prevent translocation of STAT1 to the nucleus.
Immortalized MB135 myoblasts with doxycycline-inducible iDUX4-CTD (A) and iDUXB (B) transgenes were treated ± doxycycline and ± IFNγ, then fixed and stained for total STAT1 and either transgene. Both cell lines show good induction and nuclear translocation of STAT1 restricted to the +IFNγ condition, and good doxycycline-dependent induction of the transgene. (C) Phosphorylation of STAT1 and nuclear translocation of pSTAT1-Y701 is equally restricted to the +IFNγ condition in MB135iDUX4CTD and MB135iDUXBCTD cell lines. Immunofluorescence staining for pSTAT1-Y701 shows no phosphorylation or nuclear translocation of STAT1 in untreated cells, and strong localization of pSTAT1-Y701 to the nucleus only with IFNγ treatment. Mean fluorescent intensity (MFI) of nuclear pSTAT1-Y701 signal was measured from two fields per treatment per cell line and plotted (right). There was significant nuclear enrichment of pSTAT1-Y701 with IFNγ treatment compared to untreated cells in both immortalized transgenic cells lines (unpaired t-test, **** p<00001, ns = nonsignificant; n = 26 DUX4CTD untreated, n = 36 DUX4CTD + IFNγ, n = 43 DUXBCTD untreated, and n = 53 DUXBCTD + IFNγ). (D) Primary human foreskin fibroblasts (HFF 1°), primary MB135 myoblasts (MB135 1°), and immortalized MB135 myoblasts (MB135 immortalized) were treated ± IFNγ, then fixed and stained for total STAT1. Background staining noise was similar across cell lines in the untreated condition, and all cell lines showed good induction and nuclear localization of STAT1 in the + IFNγ condition.
Figure 4—figure supplement 2
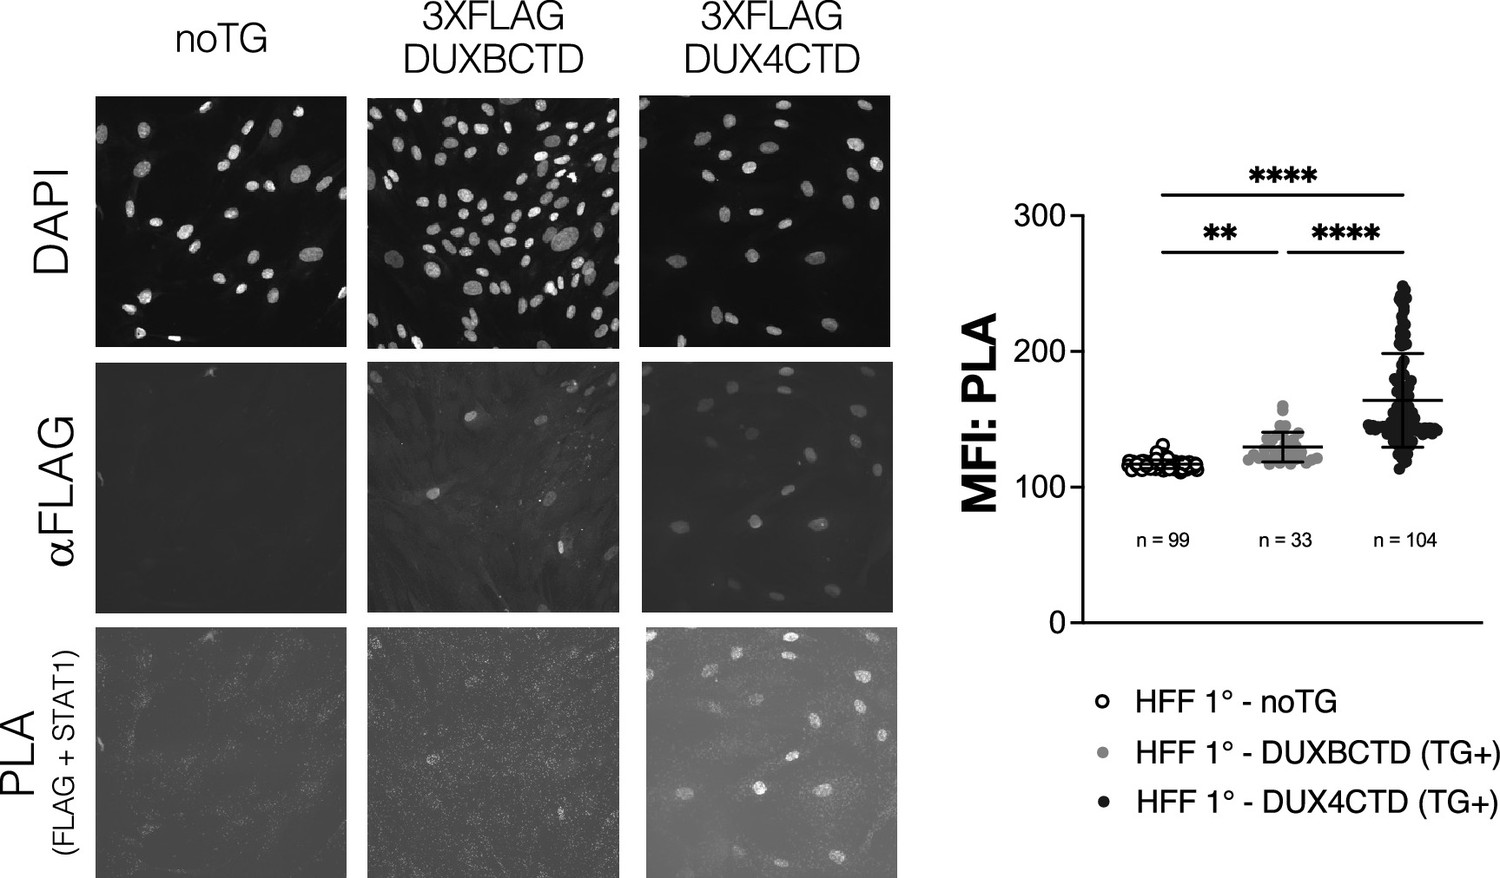
Primary human foreskin fibroblasts (HFFs) expressing transgenic DUX4CTD show increased interaction with STAT1 and reduced MHC I activation with IFNγ treatment.
Primary HFFs (HFF 1°) expressing no transgene (noTG), constitutive 3XFLAG-DUXBCTD, or constitutive 3XFLAG-DUX4CTD were treated with IFNγ, and then fixed and used in a proximity ligation assay (PLA) to determine interaction between the FLAG-tagged transgenes and total STAT1. Post-PLA the cells were re-stained with an aFLAG antibody to determine transgene-positive (TG+) nuclei based on fluorescence. Mean fluorescent intensity (MFI) in the PLA channel of TG+ nuclei from five images per cell line was calculated and plotted (right; ‘n’ = total number of TG+ nuclei analyzed). TG+ DUX4 CTD nuclei had significantly more interaction with total STAT1 compared to TG+ nuclei of the DUXBCTD cell line (one-way ANOVA with multiple comparisons, ****p<0.0001, **p<0.01, ns = nonsignificant). The PLA signal, which relies on presence and proximity of both the aFLAG and aSTAT1 antibodies, was higher in TG+ nuclei of both cell lines as expected.
Figure 5
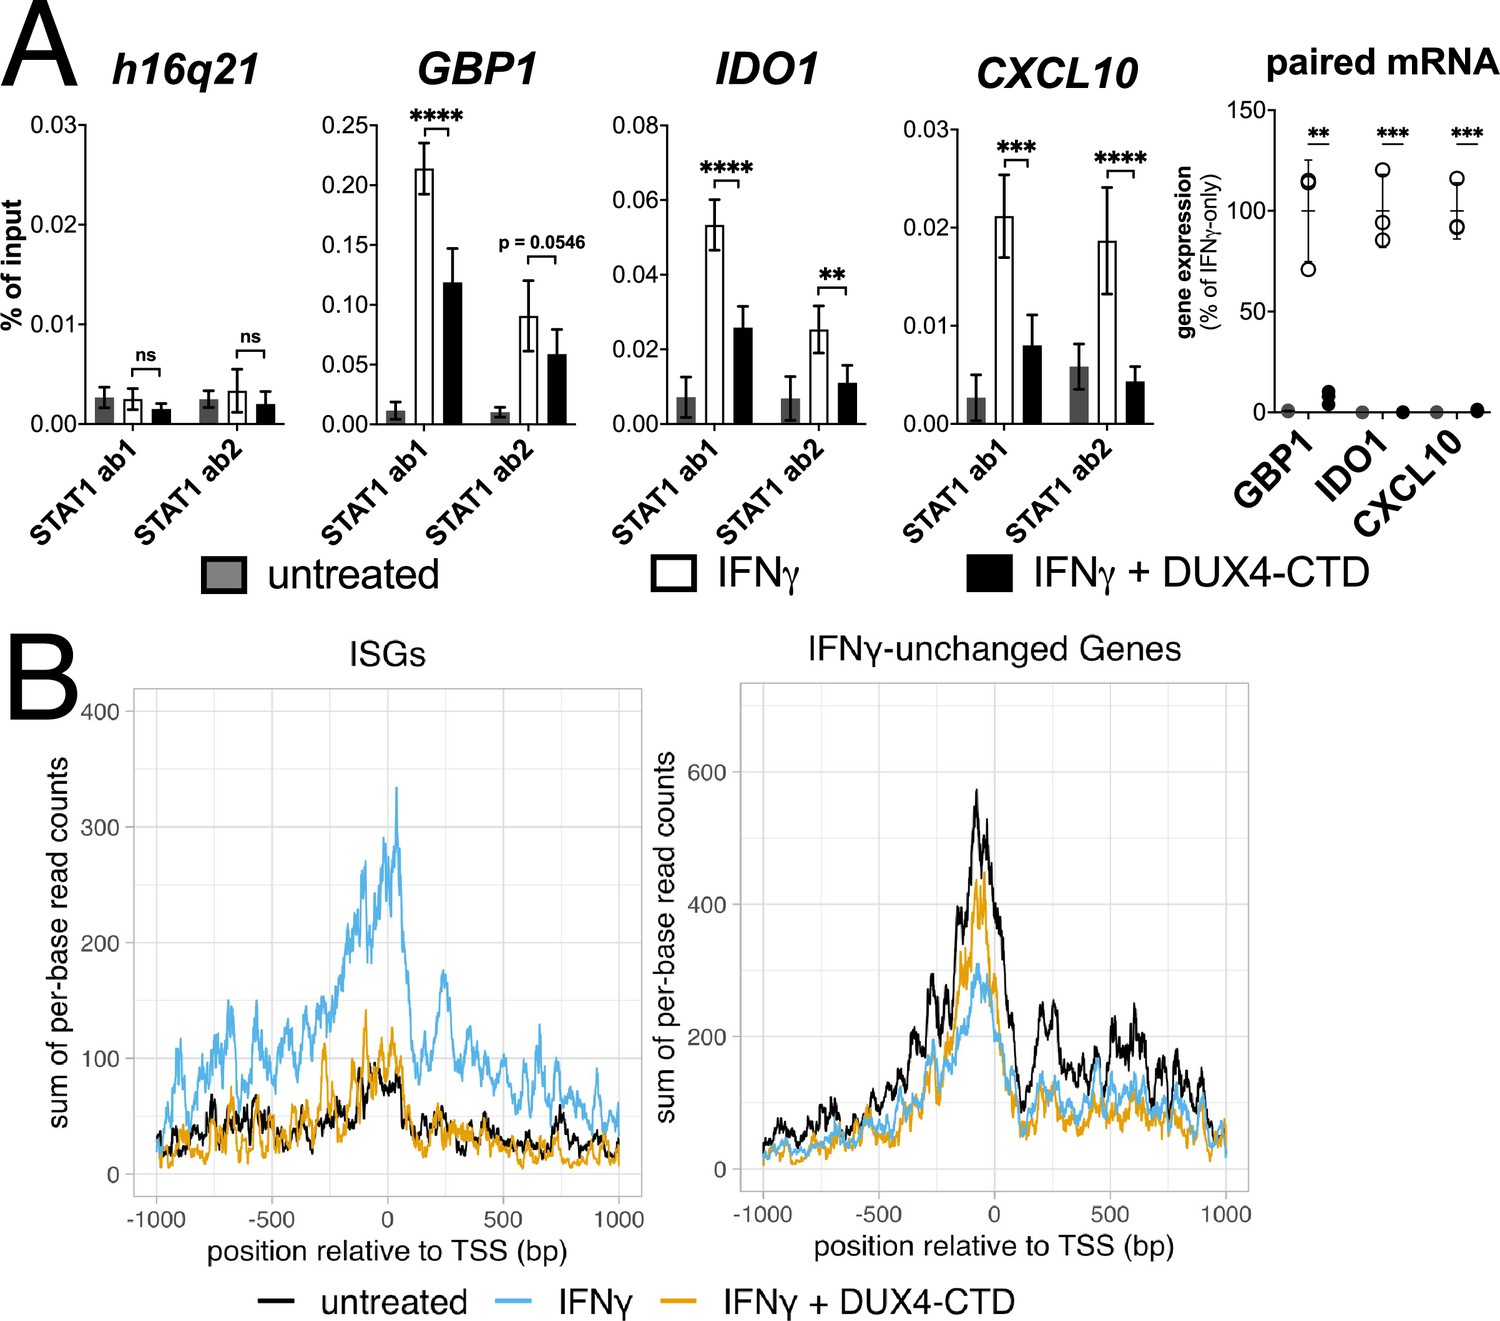
The DUX4-CTD decreases STAT1 occupancy at interferon-stimulated gene (ISG) promoters and blocks Pol-II recruitment.
(A, left four panels) Chromatin immunoprecipitation using anti-STAT1 or IgG from MB135-iDUX4-CTD cells untreated, IFNγ-treated, or IFNγ and doxycycline treated. Ab1: 50:50 mix of STAT1 antibodies Abcam ab239360 and ab234400; Ab2: Abcam ab109320. ChIP-qPCR analysis relative to a standard curve constructed from purified input DNA was used to determine the quantity of DNA per IP sample, which was then graphed as a % of input. Data represent the mean ± SD of two biological replicates with three technical replicates each (unpaired t-test; ****p<0.0001, ***p<0.001, **p<0.01, *p<0.05, ns p>0.05). (A, right panel) RT-qPCR of RNA from cells used for STAT1 ChIP showing induction of interferon-stimulated genes (ISGs) by IFNγ and suppression by DUX4-CTD. (B) CUT&Tag data showing the intensity of Pol-II signal across a 2000 bp window centered on the TSS of ISGs (left) or IFNγ-unchanged genes (right) in untreated, IFNγ-treated, or IFNγ and doxycycline-treated MB135-iDUX4-CTD cells.
Figure 6 with 1 supplement
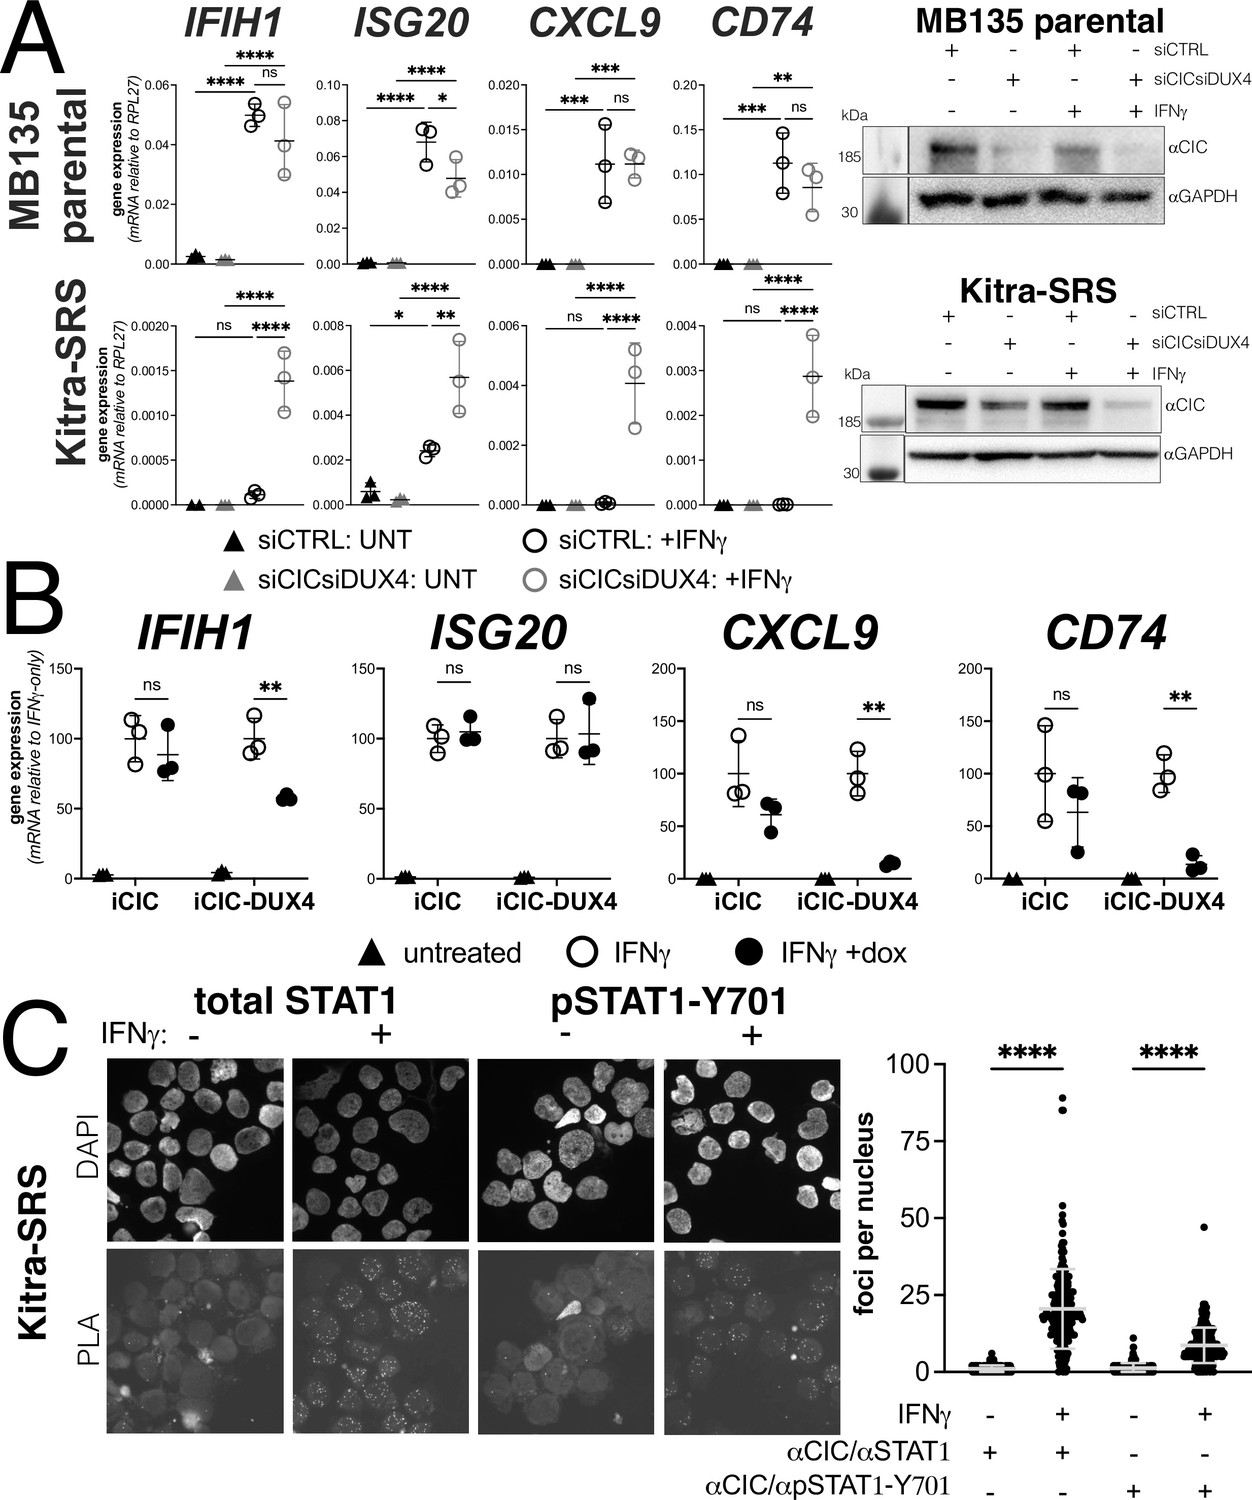
Endogenous DUX4 suppresses interferon-stimulated gene (ISG) induction in a sarcoma cell line expressing a CIC-DUX4 fusion gene.
(A, left panel) RT-qPCR of the indicated genes in MB135 parental or Kitra-SRS that express a CIC DUX4-fusion gene containing the DUX4 CTD. Cells were transfected with control or CIC- and DUX4-targeting siRNAs. Ct values were normalized to the housekeeping gene RPL27. Data represent the mean ± SD of three biological replicates with three technical replicates each (unpaired t-test; ****p<0.0001, ***p<0.001, ** p<0.01,*p<0.05, ns p>0.05). (A, right panel) Western blot showing lysates from MB135 or Kitra-SRS cells treated with control or CIC- and DUX4-targeting siRNAs ± IFNγ and probed with the indicated antibodies. See Figure 6—source data 1 for uncropped/raw western blots. (B) RT-qPCR of the indicated genes in MB135 with an inducible CIC (MB135-iCIC) or an inducible CIC-DUX4 fusion gene (MB135-iCIC-DUX4). Cells were untreated, IFNγ-treated, or IFNγ and doxycycline-treated. Ct values were normalized to the housekeeping gene RPL27, then normalized to the IFNγ-only treatment to set the induced level to 100%. Data represent the mean ± SD of three biological replicates with three technical replicates each (unpaired t-test; **p<0.01, ns p>0.05). (C) Proximity ligation assay (PLA) of KitraSRS cells showing association of the endogenous CIC-DUX4 fusion protein with either total STAT1 or phosphorylated STAT1-Y701 exclusively when cells were treated +IFNγ. Mean fluorescent intensity (MFI) was quantified from 200 nuclei per condition and plotted for both pairs of antibodies (unpaired t-test; ****p<0.0001).
-
Figure 6—source data 1
Parental MB135 anti-CIC.
Western blot showing anti-CIC signal for Figure 6B. * marks correct size band. Blot was probed with anti-CIC. NOTE: gel was loaded and transferred with samples ordered as labeled here. The image has been flipped in the article, and the labels flipped appropriately to mirror the protein layout in the Kitra-SRS experiment. Protein ladder only appears in the ‘white light’ exposure. Signal from ECL only appears in the chemiluminescence channel.
- https://cdn.elifesciences.org/articles/82057/elife-82057-fig6-data1-v3.zip
-
Figure 6—source data 2
Parental MB135 anti-GAPDH.
Western blot showing anti-GAPDH signal for Figure 6B. * marks correct size band. Blot was probed with anti-GAPDH. Note that gel was loaded and transferred with samples ordered as labeled here. The image has been flipped in the article and the labels flipped appropriately to mirror the protein layout in the Kitra-SRS experiment. Protein ladder only appears in the ‘white light’ exposure. Signal from ECL only appears in the chemiluminescence channel.
- https://cdn.elifesciences.org/articles/82057/elife-82057-fig6-data2-v3.zip
-
Figure 6—source data 3
KitraSRS anti-CIC.
Western blot showing anti-CIC signal for Figure 6B. * marks correct size band. Blot was cut into two pieces, this piece was probed with anti-CIC. Protein ladder only appears in the ‘white light’ exposure. Signal from ECL only appears in the chemiluminescence channel.
- https://cdn.elifesciences.org/articles/82057/elife-82057-fig6-data3-v3.zip
-
Figure 6—source data 4
KitraSRS anti-GAPDH.
Western blot showing anti-GAPDH signal for Figure 6B. * marks band of correct size. Blot was cut into two pieces, this piece was probed with anti-GAPDH. Protein ladder only appears in the ‘white light’ exposure. Signal from ECL only appears in the chemiluminescence channel.
- https://cdn.elifesciences.org/articles/82057/elife-82057-fig6-data4-v3.zip
Figure 6—figure supplement 1
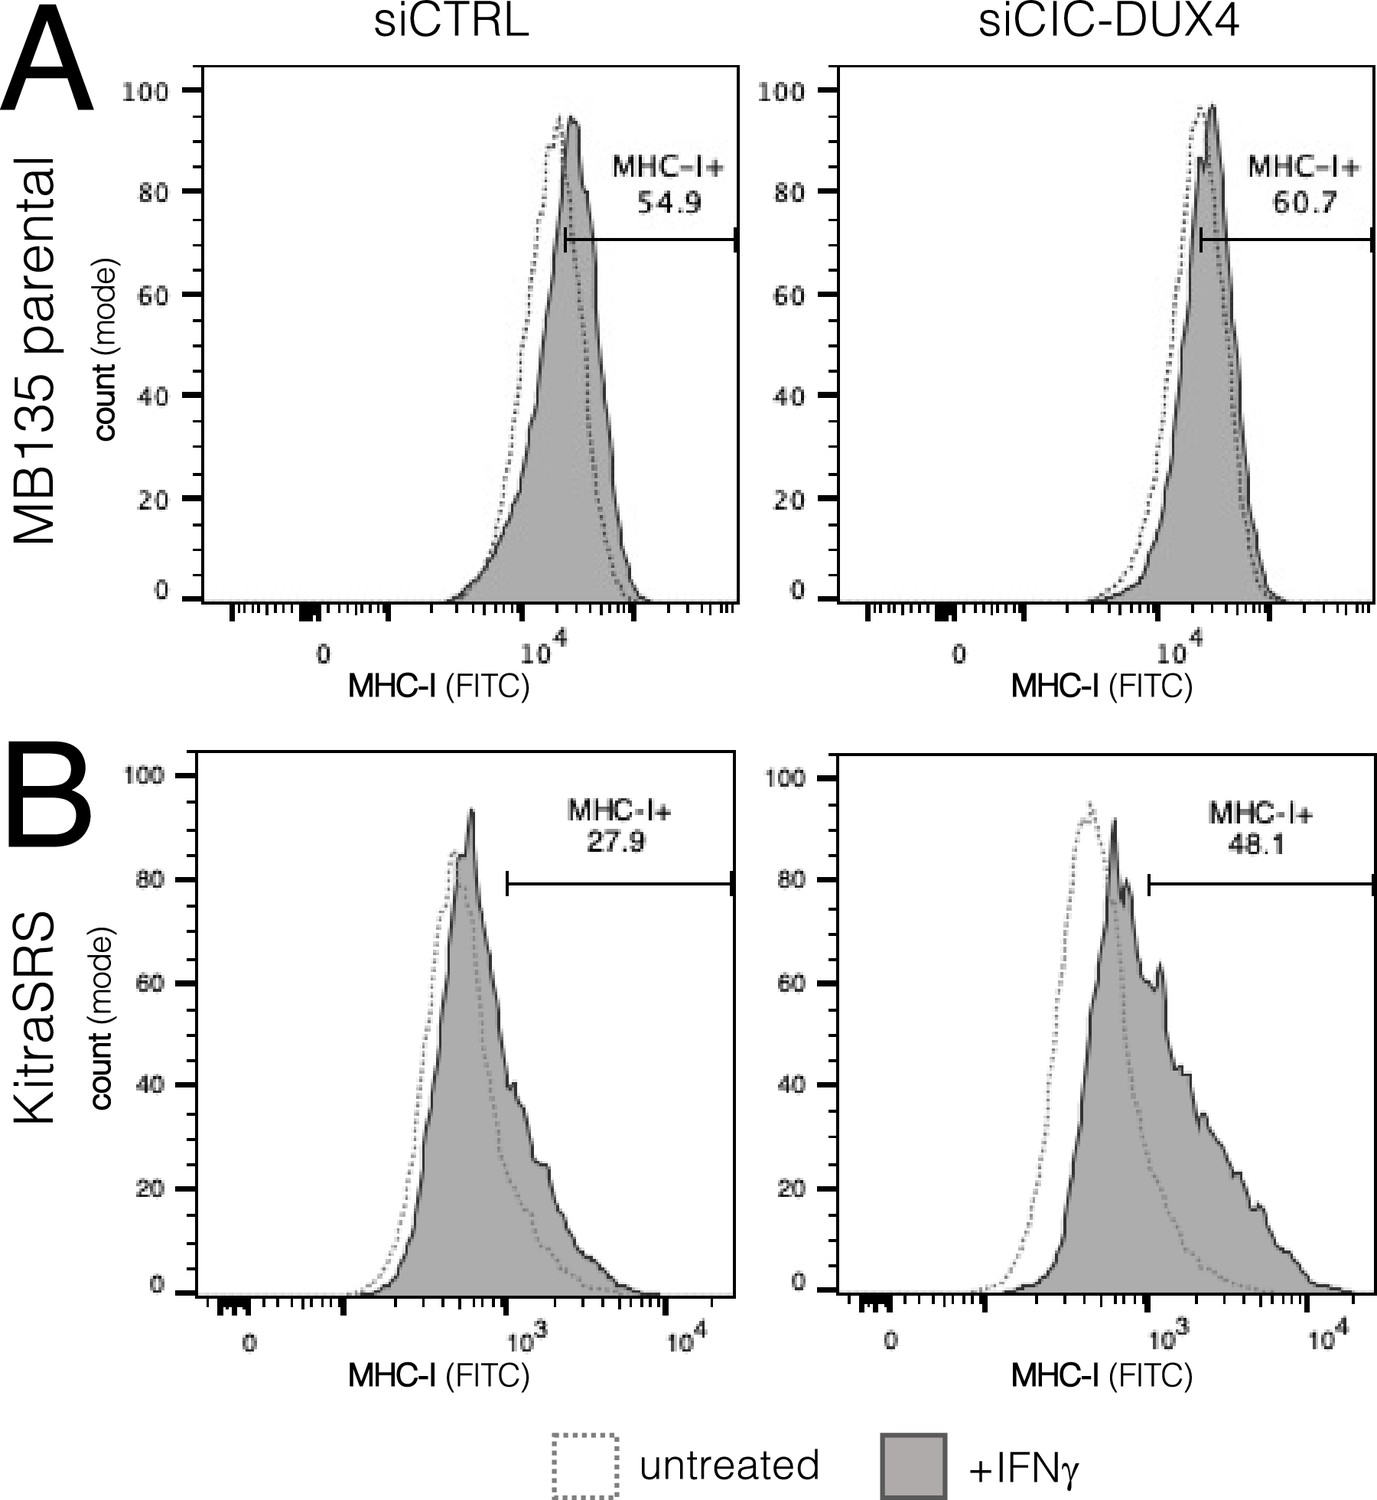
Knockdown of the CIC-DUX4 fusion protein in Kitra-SRS cells rescues upregulation of MHC I in response to IFNγ.
MB135 parental myoblasts (A) and Kitra-SRS sarcoma cells (B) were treated with control siRNAs or a combination of siRNAs targeting CIC and DUX4, then left untreated or treated with IFNγ. While knockdown of the endogenous CIC in MB135 cells had no effect on MHC I upregulation in IFNγ-treated cells, knockdown of the CIC-DUX4 fusion protein in Kitra-SRS cells increased MHC I-positive cells from 27.9% to 48.1%.
Figure 7 with 1 supplement
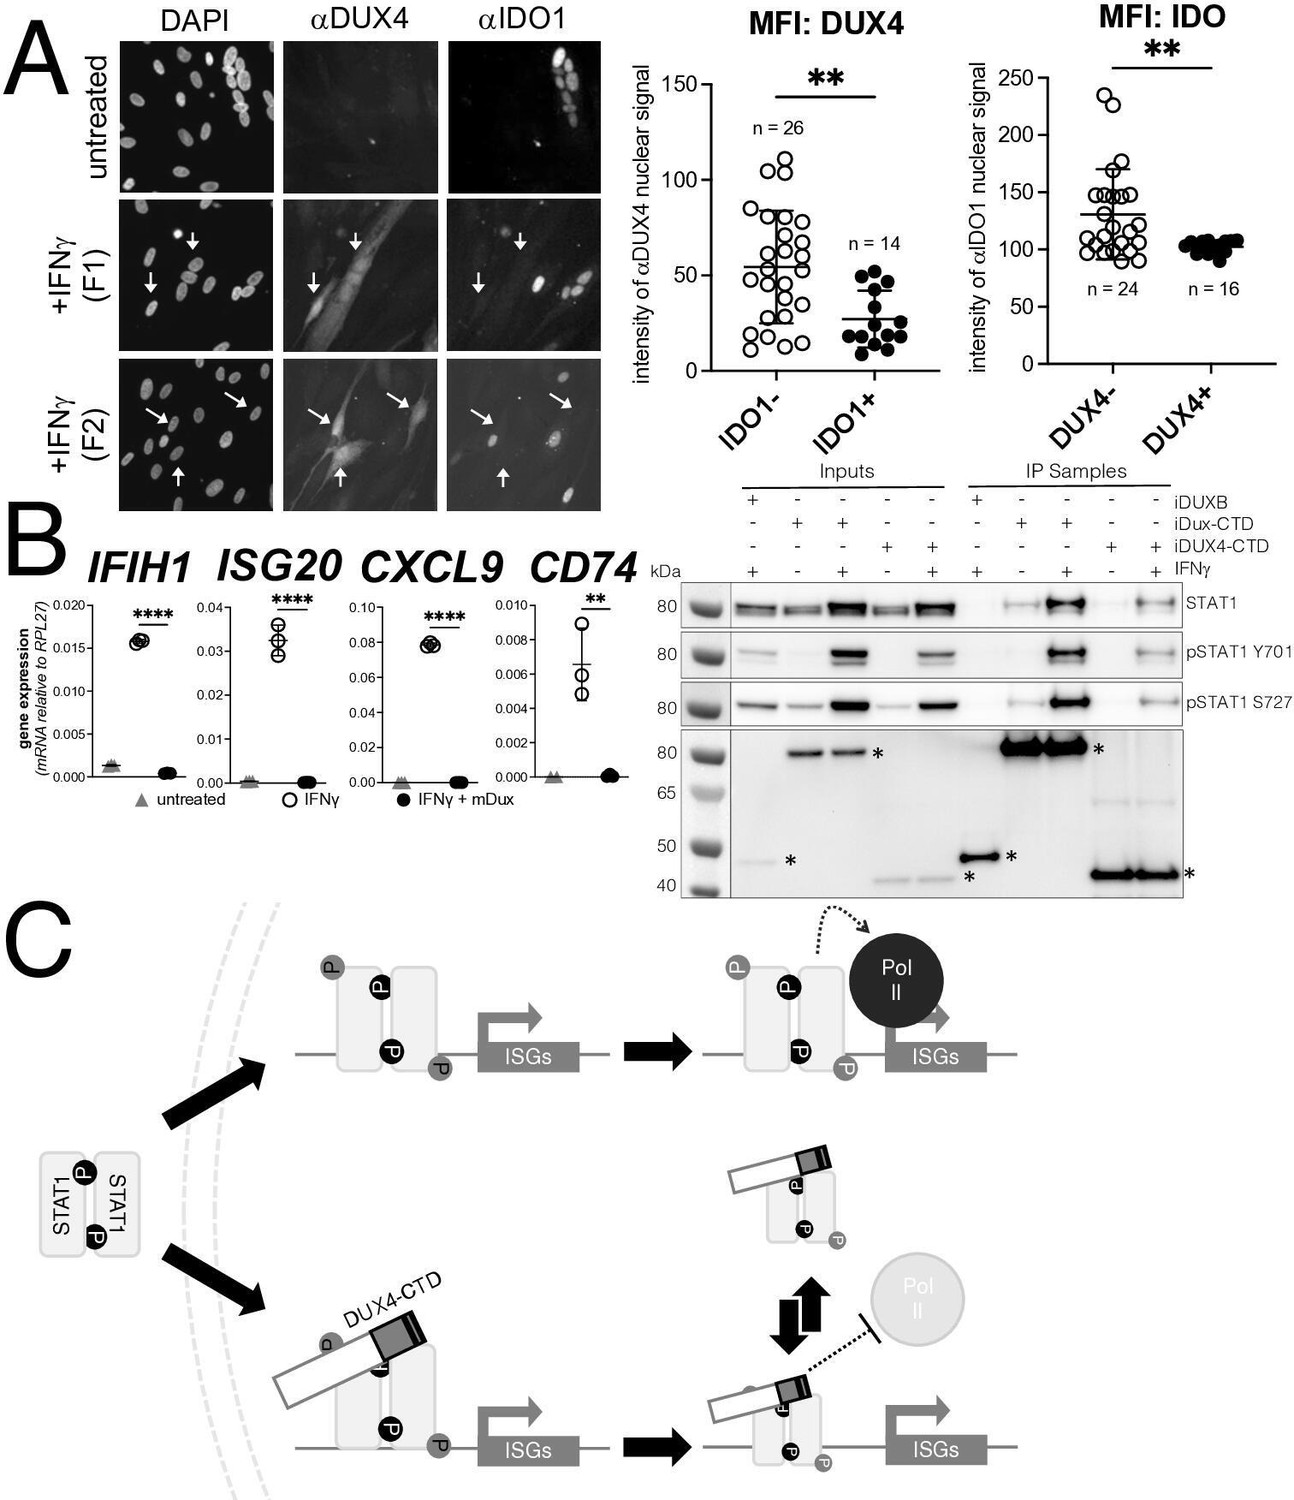
Conservation of interferon-stimulated gene (ISG) repression in facioscapulohumeral dystrophy (FSHD) myoblasts and ISG repression and STAT1 interaction by mouse Dux.
(A) FSHD MB200 myoblasts were differentiated into myotubes, which results in the expression of endogenous DUX4 in a subset of myotubes. Cultures were treated ± IFNγ, and DUX4 and IDO1 were visualized by immunofluorescence. Representative images of untreated and IFNγ-treated (two fields, F1 and F2) cells are shown, with white arrows highlighting DUX4+ myotubes that lack IDO1 signal. Mean fluorescent intensity (MFI) of the αDUX4 and αIDO1 nuclear signal was measured in the IFNγ-treated cells only. Data represent the mean ± SD of nuclear MFI from three images, total nuclei per condition listed as ‘n’ (unpaired t-test; **p<0.01). (B, left panel) RT-PCR of the indicated genes in MB135-iDux cells untreated or treated with IFNγ ± doxycycline. Ct values were normalized to the housekeeping gene RPL27, then normalized to the IFNγ-only treatment to set the induced level to 100%. Data represent the mean ± SD of three biological replicates with three technical replicates each (unpaired t-test; ****p<0.0001, **p<0.01). (B, right panel) Western blot showing input and immunoprecipitated proteins from either 3xFLAG-iDux or 3x-FLAG-iDUXB cells ± IFNγ precipitated with anti-FLAG and probed with the indicated antibodies. See Figure 7—source data 1 for uncropped/raw Western blots. (C) A model supported by the data showing how the DUX4-CTD might prevent STAT1 ISG induction. (Top) In the absence of the DUX4-CTD, pSTAT1 Y701 (black ‘P’) dimerizes, translocates to the nucleus, binds its GAS motif in the ISG promoter, acquires secondary phosphorylation at S727 (gray ‘P’), and recruits a stable transcription complex that includes Pol-II to drive transcription of ISGs. (Bottom) In the presence of the DUX4-CTD, STAT1 is phosphorylated, translocates to the nucleus, and binds its GAS motif as evidenced by the pSTAT1 S727 in complex with the CTD. However, diminished steady-state occupancy of STAT1 at the ISG promoters and absence of Pol-II recruitment indicate that the STAT1-DUX4-CTD complex does not stably bind DNA and fails to recruit Pol-II and the pre-initiation complex. The (L)LXXL(L) motifs (black bars in DUX4-CTD) are necessary to interfere with transcription suppression and likely prevent STAT1 from interacting with a factor in the pre-initiation complex or recruit a co-repressor.
-
Figure 7—source data 1
Mouse Dux co-IP, anti-STAT1.
Western blot showing anti-STAT1 signal for Figure 7B. * marks correct size bands. Blot was probed intact for STAT1. Protein ladder only appears in the ‘white light’ exposure. Signal from ECL only appears in the chemiluminescence channel. The double bands marked by the * represent the alpha (upper) and beta (lower) isoforms of endogenous STAT1.
- https://cdn.elifesciences.org/articles/82057/elife-82057-fig7-data1-v3.zip
-
Figure 7—source data 2
Mouse Dux co-IP, anti-pSTAT1(Y701).
Western blot showing anti-pSTAT1(Y701) signal for Figure 7B. * marks correct size bands. Blot was stripped from previous exposure and re-probed with anti-pSTAT1(Y701). Protein ladder only appears in the ‘white light’ exposure. Signal from ECL only appears in the chemiluminescence channel. The double bands marked by the * represent the alpha (upper) and beta (lower) isoforms of endogenous STAT1.
- https://cdn.elifesciences.org/articles/82057/elife-82057-fig7-data2-v3.zip
-
Figure 7—source data 3
Mouse Dux co-IP, anti-pSTAT1(S727).
Western blot showing anti-pSTAT1(S727) signal for Figure 7B. * marks correct size band. Blot was stripped from previous exposure and re-probed with anti-pSTAT1(S727). Protein ladder only appears in the ‘white light’ exposure. Signal from ECL only appears in the chemiluminescence channel. Only STAT1-alpha can be phosphorylated at S727, hence the lack of double band.
- https://cdn.elifesciences.org/articles/82057/elife-82057-fig7-data3-v3.zip
-
Figure 7—source data 4
Mouse Dux co-IP, anti-FLAG.
Western blot showing anti-FLAG signal for Figure 7B. * marks correct size band. Blot was physically cut to probe with multiple antibodies, multiple unrelated blots were imaged in this exposure/file. Lower blot (boxed in green) is probed with anti-FLAG to detect inducible FLAG-tagged transgenes. Note that the image has been flipped in the article and labeled appropriately. Protein ladder only appears in the ‘white light’ exposure. Signal from ECL only appears in the chemiluminescence channel.
- https://cdn.elifesciences.org/articles/82057/elife-82057-fig7-data4-v3.zip
Figure 7—figure supplement 1
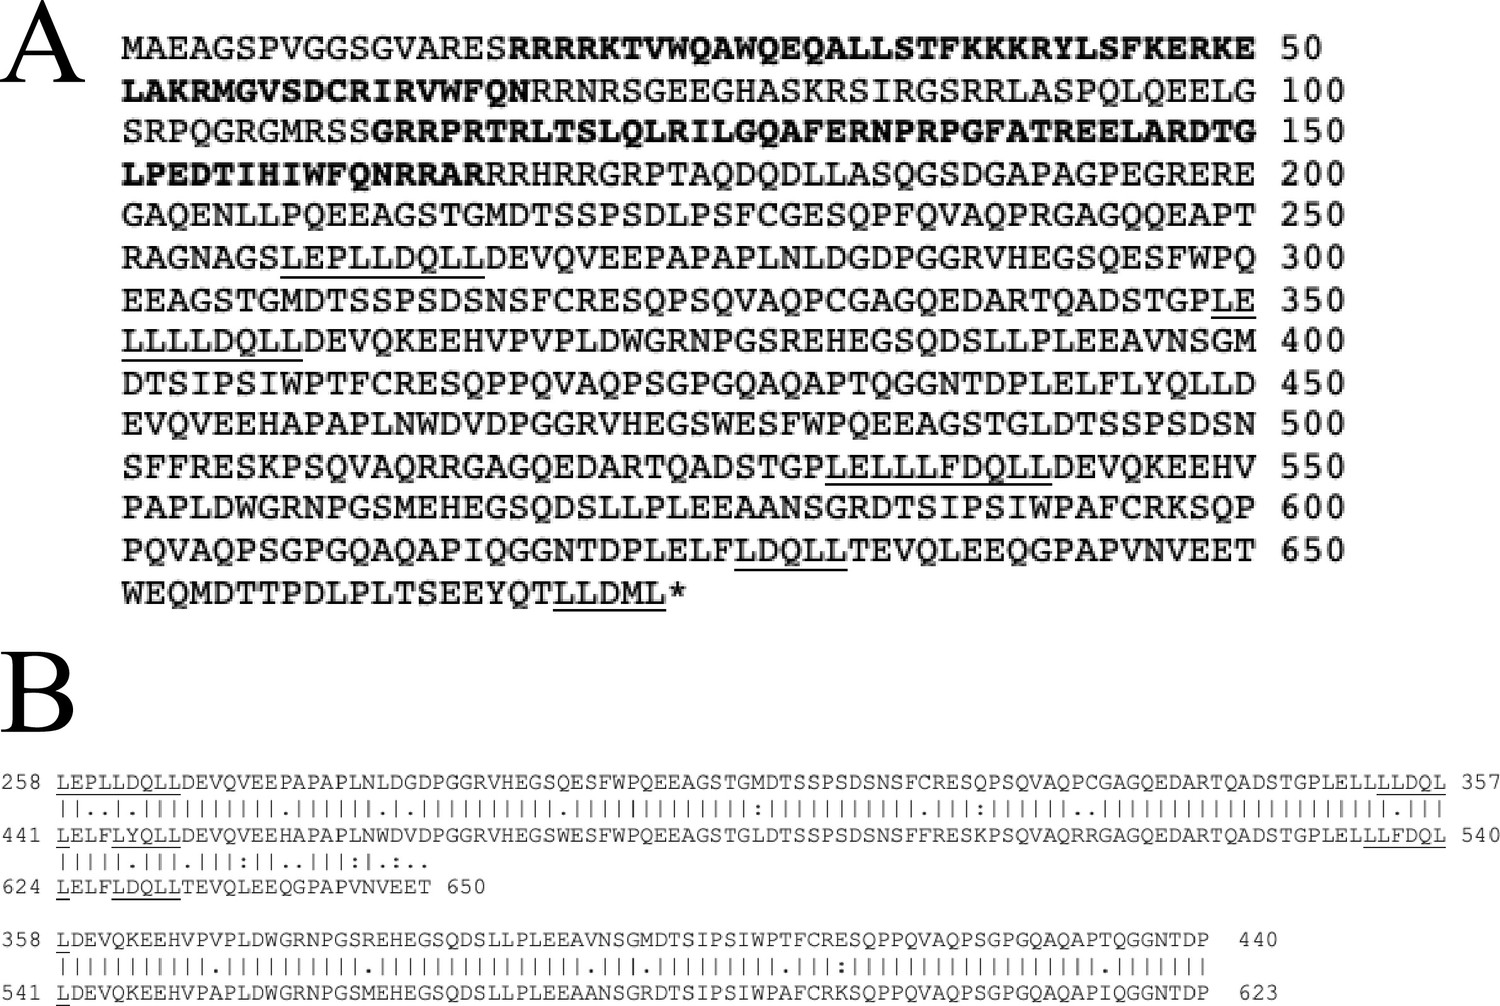
Mouse Dux contains a triplication of the (L)LxxL(L)-containing region.
(A) Mouse Dux protein sequence with homeodomains in bold and (L)LxxL(L) motifs underlined. (B) Alignment of a partial triplication of the mouse Dux protein with aa258-440 aligning with aa441-623 and aa624-650 aligning with aa258-284.
Tables
Appendix 1—key resources table
| Reagent type (species) or resource | Designation | Source or reference | Identifiers | Additional information |
|---|---|---|---|---|
| Antibody | Anti-STAT1 (phospho 701) [M135] (mouse monoclonal) | Abcam | Cat# ab29045; RRID:AB_778096 | See 'Materials and methods' for dilution by application |
| Antibody | Anti-STAT1 [1/Stat1] (mouse monoclonal) | Abcam | Cat# ab281999 | See 'Materials and methods' for dilution by application |
| Antibody | Anti-hnRNP M1-M4 [EPR13509(B)] (rabbit monoclonal) | Abcam | Cat# ab177957; RRID:AB_2820246 | See 'Materials and methods' for dilution by application |
| Antibody | Anti-human DNA PKcs [Y393] (rabbit monoclonal) | Abcam | Cat# ab32566; RRID:AB_731981 | See 'Materials and methods' for dilution by application |
| Antibody | Anti-PABPC1 (rabbit polyclonal) | Abcam | Cat# ab21060; RRID:AB_777008 | See 'Materials and methods' for dilution by application |
| Antibody | Anti-STAT1 (phospho S727) [EPR3146] (rabbit monoclonal) | Abcam | Cat# ab109461; RRID:AB_10863745 | See 'Materials and methods' for dilution by application |
| Antibody | Anti-STAT1 [EPR21057-141] (rabbit monoclonal) | Abcam | Cat# ab234400 | See 'Materials and methods' for dilution by application |
| Antibody | Anti-STAT1 [EPR23049-111] (rabbit monoclonal) | Abcam | Cat# ab239360 | See 'Materials and methods' for dilution by application |
| Antibody | Anti-STAT1 [EPR4407] (rabbit monoclonal) | Abcam | Cat# ab109320; RRID:AB_10863383 | See 'Materials and methods' for dilution by application |
| Antibody | Anti-YBX1 [EP2708Y] (rabbit monoclonal) | Abcam | Cat# ab76149; RRID:AB_2219276 | See 'Materials and methods' for dilution by application |
| Antibody | Anti-mouse IgG for IP HRP (rat monoclonal) | Abcam | Cat# AB131368; RRID:AB_2895114 | See 'Materials and methods' for dilution by application |
| Antibody | Isotype control (rabbit polyclonal) | BioLegend | Cat# CTL-4112 | See 'Materials and methods' for dilution by application |
| Antibody | Anti-DDX3X [D19B4] (mouse monoclonal) | Cell Signaling Technology | Cat# 8192; RRID:AB_10860416 | See 'Materials and methods' for dilution by application |
| Antibody | Anti-hnRNP K [R332] (rabbit monoclonal) | Cell Signaling Technology | Cat# 4675; RRID:AB_10622190 | See 'Materials and methods' for dilution by application |
| Antibody | Anti-IDO1 [D5J4E] (rabbit monoclonal) | Cell Signaling Technology | Cat# 86630; RRID:AB_2636818 | See 'Materials and methods' for dilution by application |
| Antibody | Anti-MYC [71D10] (rabbit monoclonal) | Cell Signaling Technology | Cat# 2278; RRID:AB_490778 | See 'Materials and methods' for dilution by application |
| Antibody | Anti-Nucleolin [D4C70] (rabbit monoclonal) | Cell Signaling Technology | Cat# 14574; RRID:AB_2798519 | See 'Materials and methods' for dilution by application |
| Antibody | Anti-phospho Rbp1 CTD (Ser5) [D9N5I] (rabbit monoclonal) | Cell Signaling Technology | Cat# 13523; RRID:AB_2798246 | See 'Materials and methods' for dilution by application |
| Antibody | Anti-PP2A A subunit [81G5] (rabbit monoclonal) | Cell Signaling Technology | Cat# 2041; RRID:AB_2168121 | See 'Materials and methods' for dilution by application |
| Antibody | Anti-pSTAT1 Y701 [58D6] (rabbit monoclonal) | Cell Signaling Technology | Cat #9167 | See 'Materials and methods' for dilution by application |
| Antibody | Anti-TIF1 (TRIM28) [C42G12] (rabbit monoclonal) | Cell Signaling Technology | Cat# 4124; RRID:AB_2209886 | See 'Materials and methods' for dilution by application |
| Antibody | Anti-rabbit secondary antibody (goat mixed monoclonal) | EpiCypher | Cat# 13-0047 | Used in CUT&Tag |
| Antibody | Anti-DUX4 [P2G4] (mouse monoclonal) | Geng et al., 2011 | N/A | See 'Materials and methods' for dilution by application |
| Antibody | Anti-DUX4 [E14-3] (rabbit monoclonal) | Geng et al., 2011 | N/A | See 'Materials and methods' for dilution by application |
| Antibody | Anti-DUX4 [E5-5] (rabbit monoclonal) | Geng et al., 2011 | N/A | See 'Materials and methods' for dilution by application |
| Antibody | Anti-mouse IgG HRP (goat superclonal) | Invitrogen | Cat# A28177 | See 'Materials and methods' for dilution by application |
| Antibody | Anti-CIC (rabbit polyclonal) | Invitrogen | Cat# PA5-83721 | See 'Materials and methods' for dilution by application |
| Antibody | FITC-conjugated anti-rabbit (donkey monoclonal) | Jackson ImmunoResearch | Cat# 711-095-152; RRID:AB_2315776 | See 'Materials and methods' for dilution by application |
| Antibody | TRITC-conjugated anti-mouse (donkey monoclonal) | Jackson ImmunoResearch | Cat# 715-025-020; RRID:AB_2340764 | See 'Materials and methods' for dilution by application |
| Antibody | Anti-CDK4 (rabbit polyclonal) | ProteinTech | Cat# 11026-1-AP; RRID:AB_2078702 | See 'Materials and methods' for dilution by application |
| Antibody | Anti-HAT1 (rabbit polyclonal) | ProteinTech | Cat# 11432-1-AP; RRID:AB_2116435 | See 'Materials and methods' for dilution by application |
| Antibody | Anti-HNRNPU (rabbit polyclonal) | ProteinTech | Cat# 14599-1-AP; RRID:AB_2248577 | See 'Materials and methods' for dilution by application |
| Antibody | Anti-FLAG [M2] (mouse monoclonal) | Sigma-Aldrich | Cat# F1804; RRID:AB_262044 | See 'Materials and methods' for dilution by application |
| Antibody | Anti-FLAG [M2] (mouse monoclonal) | Sigma-Aldrich | Cat# F3165; RRID:AB_259529 | See 'Materials and methods' for dilution by application |
| Antibody | Anti-rabbit IgG HRP (goat superclonal) | Thermo Fisher | Cat# A27036; RRID:AB2536099 | See 'Materials and methods' for dilution by application |
| Cell line (Homo sapiens) | MB200 (male, FSHD2), immortalized | Fields Center for FSHD and Neuromuscular Research | https://www.urmc.rochester.edu/neurology/fields-center.aspx | |
| Cell line (H. sapiens) | MB135 (female), immortalized | Geng et al., 2012 | N/A | |
| Cell line (H. sapiens) | MB135-iDUX4 (SSc7, female) | Jagannathan et al., 2016 | N/A | |
| Cell line (H. sapiens) | HFF-DUX4CTD | This study | N/A | Primary HFF cells transduced with the constitutive pRRLSIN-3XFLAG-NLS-DUX4CTD lentiviral expression construct |
| Cell line (H. sapiens) | HFF-DUXB-CTD | This study | N/A | Primary HFF cells transduced with the constitutive pRRLSIN-3XFLAG-NLS-DUXBCTD lentiviral expression construct |
| Cell line (H. sapiens) | MB135-i3XFLAG-CIC (female) | This study | N/A | Immortalized MB135 myoblasts transduced with the specified inducible lentiviral expression construct |
| Cell line (H. sapiens) | MB135-i3XFLAG-CIC-DUX4 (female) | This study | N/A | Immortalized MB135 myoblasts transduced with the specified inducible lentiviral expression construct |
| Cell line (H. sapiens) | MB135-iDux-CA (female) | This study | N/A | Immortalized MB135 myoblasts transduced with the specified inducible lentiviral expression construct |
| Cell line (H. sapiens) | MB135-iDux-CTD (female) | This study | N/A | Immortalized MB135 myoblasts transduced with the specified inducible lentiviral expression construct |
| Cell line (H. sapiens) | MB135-iDUX4 (ASc4, female) | This study | N/A | Immortalized MB135 myoblasts transduced with the specified inducible lentiviral expression construct |
| Cell line (H. sapiens) | MB135-iDUX4 (NSc2, female) | This study | N/A | Immortalized MB135 myoblasts transduced with the specified inducible lentiviral expression construct |
| Cell line (H. sapiens) | MB135-iDUX4-CTD (AES150-1, female) | This study | N/A | Immortalized MB135 myoblasts transduced with the specified inducible lentiviral expression construct |
| Cell line (H. sapiens) | MB135-iDUX4-CTD (AES150-5, female) | This study | N/A | Immortalized MB135 myoblasts transduced with the specified inducible lentiviral expression construct |
| Cell line (H. sapiens) | MB135-iDUX4-CTDmL1dL2 (AES150-1, female) | This study | N/A | Immortalized MB135 myoblasts transduced with the specified inducible lentiviral expression construct |
| Cell line (H. sapiens) | MB135-iDUX4-CTDmL1dL2 (AES150-3, female) | This study | N/A | Immortalized MB135 myoblasts transduced with the specified inducible lentiviral expression construct |
| Cell line (H. sapiens) | MB135-iDUX4-F67A (ASc10, female) | This study | N/A | Immortalized MB135 myoblasts transduced with the specified inducible lentiviral expression construct |
| Cell line (H. sapiens) | MB135-iDUX4-F67A (ASc6, female) | This study | N/A | Immortalized MB135 myoblasts transduced with the specified inducible lentiviral expression construct |
| Cell line (H. sapiens) | MB135-iDUX4aa154-271 (female) | This study | N/A | Immortalized MB135 myoblasts transduced with the specified inducible lentiviral expression construct |
| Cell line (H. sapiens) | MB135-iDUX4aa154-308 (female) | This study | N/A | Immortalized MB135 myoblasts transduced with the specified inducible lentiviral expression construct |
| Cell line (H. sapiens) | MB135-iDUX4aa154-372 (female) | This study | N/A | Immortalized MB135 myoblasts transduced with the specified inducible lentiviral expression construct |
| Cell line (H. sapiens) | MB135-iDUX4aa339-424 (NSc10, female) | This study | N/A | Immortalized MB135 myoblasts transduced with the specified inducible lentiviral expression construct |
| Cell line (H. sapiens) | MB135-iDUX4aa339-424 (NSc5, female) | This study | N/A | Immortalized MB135 myoblasts transduced with the specified inducible lentiviral expression construct |
| Cell line (H. sapiens) | MB135-iDUX4aa339-424 (NSc8, female) | This study | N/A | Immortalized MB135 myoblasts transduced with the specified inducible lentiviral expression construct |
| Cell line (H. sapiens) | MB135-iDUX4dL2 (NSc1, female) | This study | N/A | Immortalized MB135 myoblasts transduced with the specified inducible lentiviral expression construct |
| Cell line (H. sapiens) | MB135-iDUX4mL1 (NSc3, female) | This study | N/A | Immortalized MB135 myoblasts transduced with the specified inducible lentiviral expression construct |
| Cell line (H. sapiens) | MB135-iDUX4mL1dL2 (NSc2, female) | This study | N/A | Immortalized MB135 myoblasts transduced with the specified inducible lentiviral expression construct |
| Cell line (H. sapiens) | MB135-iDUX4mL1dL2 (NSc3, female) | This study | N/A | Immortalized MB135 myoblasts transduced with the specified inducible lentiviral expression construct |
| Cell line (H. sapiens) | MB135-iDUX4mL1dL2 (NSc8, female) | This study | N/A | Immortalized MB135 myoblasts transduced with the specified inducible lentiviral expression construct |
| Cell line (H. sapiens) | MB135-iDUXB (female) | This study | N/A | Immortalized MB135 myoblasts transduced with the specified inducible lentiviral expression construct |
| Cell line (H. sapiens) | MB135 (female), primary | Dr. Rabi Tawil, Fields Center for FSHD Research, University of Rochester Medical Center | N/A | Primary myoblast cells derived from patient muscle biopsy sample |
| Cell line (H. sapiens) | Primary human foreskin fibroblasts (‘HFF,’ male) | Dr. Dusty Miller, Fred Hutchinson Cancer Center | N/A | Primary human foreskin fibroblast cells derived from patient foreskin tissue |
| Chemical compound, drug | RIG-I ligand | Gift of Dr. Dan Stetson Lab, UW | N/A | |
| Chemical compound, drug | 2'3'-cGAMP | Invivogen | Cat# tlrl-nacga23 | |
| Chemical compound, drug | Recombinant human IFN-beta protein | R&D Systems | Cat# 8499-IF-010-CF | |
| Chemical compound, drug | Recombinant human IFN-gamma | R&D Systems | Cat# 285IF100CF | |
| Chemical compound, drug | Polyinosinic-polycytidylic acid sodium salt [poly(I:C)] | Sigma | Cat# P1530 | |
| Commercial assay or kit | iTaq SYBR Green Supermix | Bio-Rad | Cat# 1725124 | |
| Commercial assay or kit | CUTANA Non-Hot Start 2X PCR Master Mix for CUT&Tag | EpiCypher | Cat# 15-1018 | Used in CUT&Tag |
| Commercial assay or kit | CUTANA pAG-Tn5 for CUT&Tag | EpiCypher | Cat# 15-1017 | Used in CUT&Tag |
| Commercial assay or kit | Illumina TruSeq RNA Sample Prep v2 Kit | Illumina | Cat# RS-122-2001 | |
| Commercial assay or kit | Dnase Amp grade | Invitrogen | Cat# 18068015 | |
| Commercial assay or kit | Oligo(dT) 12–18 primer | Invitrogen | Cat# 18418012 | |
| Commercial assay or kit | RNaseOUT Recombinant Ribonuclease Inhibitor | Invitrogen | Cat# 10777019 | |
| Commercial assay or kit | Superscript IV | Invitrogen | Cat# 18091050 | |
| Commercial assay or kit | Lipofectamine RNAiMAX | Life Technologies | Cat# 13778150 | |
| Commercial assay or kit | NucleoSpin RNA kit | Macherey-Nagel | Cat# 740955 | |
| Commercial assay or kit | Lipofectamine 2000 | Thermo Fisher | Cat# 11668019 | |
| Commercial assay or kit | Superscript IV First-Strand Synthesis System | Thermo Fisher | Cat# 18091050 | |
| Other | Agencourt AMPure XP beads | Beckman Coulter | Cat# A63880 | Used in CUT&Tag |
| Other | Hyclone FBS | Fisher | Cat# SH3007103 | Used to supplement F-10 for cell culture of myoblast lines |
| Other | Gibco Penicillin-Streptomycin (10,000 U/ml) | Fisher Scientific | Cat# 15-140-122 | Anti-fungal to supplement cell culture media |
| Other | Dynabeads Protein G beads | Invitrogen | Cat# 10003D | Used in fractionated anti-FLAG immunoprecipitation |
| Other | ProLong Glass antifade Mountant with Nucblue | Invitrogen | Cat# P36983 | Used to mount slides for proximity ligation assays |
| Other | Millicell EZ Slide 8-well glass slides | MilliporeSigma | Cat# PEZGS0816 | Used to culture cells for proximity ligation assays |
| Other | Protein-A agarose beads | MilliporeSigma | Cat# 16-156 | Used in ChIP-qPCR |
| Other | Pierce phosphatase inhibitors | Pierce | Cat# PIA32957 | Used in ChIP-qPCR, CUT&Tag |
| Other | Pierce protease inhibitors (EDTA-free) | Pierce | Cat# PIA32955 | Used in ChIP-qPCR, CUT&Tag |
| Other | Recombinant human basic fibroblast growth factor | Promega | Cat# G5071 | Used to supplement F-10 for cell culture of myoblast lines |
| Other | Dexamethasone | Sigma-Aldrich | Cat# D4902 | Used to supplement F-10 for cell culture of myoblast lines |
| Other | Doxycycline hyclate | Sigma-Aldrich | Cat# D9891 | Used to induce doxycycline-inducible transgenes |
| Other | Duolink In Situ Detection Reagents Green kit | Sigma-Aldrich | Cat# DUO92014 | Used in PLA |
| Other | Duolink In Situ PLA Probe Anti-Mouse MINUS | Sigma-Aldrich | Cat# DUO92004 | Used in PLA |
| Other | Duolink In Situ PLA Probe Anti-Rabbit PLUS | Sigma-Aldrich | Cat# DUO92002 | Used in PLA |
| Other | Insulin | Sigma-Aldrich | Cat# I1882 | Used in differentiating MB200 myoblasts into myotubes |
| Other | Polybrene | Sigma-Aldrich | Cat# 107689 | Used in transducing cell lines with lentivirus |
| Other | Puromycin dihydrochloride | Sigma-Aldrich | Cat# P833 | Used as a selective agent for puromycin-resistant cell lines |
| Other | Transferrin | Sigma-Aldrich | Cat# T-0665 | Used in differentiating MB200 myoblasts into myotubes |
| Other | OptiMEM Reduced Serum Medium | Thermo Fisher | Cat# 31985070 | Used for lipofection |
| Recombinant DNA reagent | pMD2.G | Didier Trono Lab | Addgene#12259; RRID:Addgene_12259 | VSV-G envelope expressing plasmid |
| Recombinant DNA reagent | psPAX2 | Didier Trono Lab | Addgene#12260; RRID:Addgene_12260 | Lentiviral packaging plasmid |
| Recombinant DNA reagent | pRRLSIN.cPPT.PGK-GFP.WPRE | Didier Trono Lab | Addgene#12252 | Constitutive lentiviral expression vector (empty backbone) |
| Recombinant DNA reagent | pCW57.1 | David Root Lab | Addgene#41393 | Doxycycline-inducible lentiviral expression vector (empty backbone) |
| Recombinant DNA reagent | pCW57.1-3xFLAG-CIC | This study | N/A | Lentiviral expression plasmid for doxycycline-inducible transgene expression |
| Recombinant DNA reagent | pCW57.1-3xFLAG-CIC/DUX4 | This study | N/A | Lentiviral expression plasmid for doxycycline-inducible transgene expression |
| Recombinant DNA reagent | pCW57.1-3XFLAG-NLS-NLS-Dux | This study | N/A | Lentiviral expression plasmid for doxycycline-inducible transgene expression |
| Recombinant DNA reagent | pCW57.1-3XFLAG-NLS-NLS-DUX4 | This study | N/A | Lentiviral expression plasmid for doxycycline-inducible transgene expression |
| Recombinant DNA reagent | pCW57.1-3XFLAG-NLS-NLS-DUX4-dL2 | This study | N/A | Lentiviral expression plasmid for doxycycline-inducible transgene expression |
| Recombinant DNA reagent | pCW57.1-3XFLAG-NLS-NLS-DUX4-F67A | This study | N/A | Lentiviral expression plasmid for doxycycline-inducible transgene expression |
| Recombinant DNA reagent | pCW57.1-3XFLAG-NLS-NLS-DUX4-mL1 | This study | N/A | Lentiviral expression plasmid for doxycycline-inducible transgene expression |
| Recombinant DNA reagent | pCW57.1-3XFLAG-NLS-NLS-DUX4-mL1dL2 | This study | N/A | Lentiviral expression plasmid for doxycycline-inducible transgene expression |
| Recombinant DNA reagent | pCW57.1-3XFLAG-NLS-NLS-DUX4(aa339-424) | This study | N/A | Lentiviral expression plasmid for doxycycline-inducible transgene expression |
| Recombinant DNA reagent | pCW57.1-3XFLAG-NLS-NLS-DUX4aa154-271 | This study | N/A | Lentiviral expression plasmid for doxycycline-inducible transgene expression |
| Recombinant DNA reagent | pCW57.1-3XFLAG-NLS-NLS-DUX4aa154-308 | This study | N/A | Lentiviral expression plasmid for doxycycline-inducible transgene expression |
| Recombinant DNA reagent | pCW57.1-3XFLAG-NLS-NLS-DUX4aa154-372 | This study | N/A | Lentiviral expression plasmid for doxycycline-inducible transgene expression |
| Recombinant DNA reagent | pCW57.1-3XFLAG-NLS-NLS-DUX4CTD | This study | N/A | Lentiviral expression plasmid for doxycycline-inducible transgene expression |
| Recombinant DNA reagent | pCW57.1-3XFLAG-NLS-NLS-DUX4CTDmL1dL2 | This study | N/A | Lentiviral expression plasmid for doxycycline-inducible transgene expression |
| Recombinant DNA reagent | pCW57.1-3XFLAG-NLS-NLS-DUXB | This study | N/A | Lentiviral expression plasmid for doxycycline-inducible transgene expression |
| Recombinant DNA reagent | pCW57.1-3XFLAG-NLS-NLS-DUXBCTD | This study | N/A | Lentiviral expression plasmid for doxycycline-inducible transgene expression |
| Recombinant DNA reagent | pCW57.1-3xMYC-STAT1 | This study | N/A | Lentiviral expression plasmid for doxycycline-inducible transgene expression |
| Recombinant DNA reagent | pCW57.1-3xMYC-STAT1-S727A | This study | N/A | Lentiviral expression plasmid for doxycycline-inducible transgene expression |
| Recombinant DNA reagent | pCW57.1-3xMYC-STAT1-Y701A | This study | N/A | Lentiviral expression plasmid for doxycycline-inducible transgene expression |
| Recombinant DNA reagent | pRRLSIN-3XFLAG-NLS-NLS-DUX4CTD | This study | N/A | Lentiviral expression plasmid for constitutive transgene expression |
| Recombinant DNA reagent | pRRLSIN-3XFLAG-NLS-NLS-DUXBCTD | This study | N/A | Lentiviral expression plasmid for constitutive transgene expression |
| Sequence-based reagent | IFIH1_F | Geng et al., 2012. Dev Cell. doi: 10.1016/j.devcel.2011.11.013. | RT-qPCR primers | CTAGCCTGTTCTGGGGAAGA |
| Sequence-based reagent | IFIH1_R | Geng et al., 2012. Dev Cell. doi: 10.1016/j.devcel.2011.11.013. | RT-qPCR primers | AGTCGGCACACTTCTTTTGC |
| Sequence-based reagent | ISG20_F | Geng et al., 2012. Dev Cell. doi: 10.1016/j.devcel.2011.11.013. | RT-qPCR primers | GAGCGCCTCCTACACAAGAG |
| Sequence-based reagent | ISG20_R | Geng et al., 2012. Dev Cell. doi: 10.1016/j.devcel.2011.11.013. | RT-qPCR primers | CGGATTCTCTGGGAGATTTG |
| Sequence-based reagent | h16q21_F | Maston et al., 2012 | ChIP-qPCR primers (gene desert region) | AAACAAGCATCAGGGTGGAC |
| Sequence-based reagent | h16q21_R | Maston et al., 2012 | ChIP-qPCR primers (gene desert region) | GATCCCACAAAGGAAAGGAAC |
| Sequence-based reagent | GBP1_F | Origene Cat# HP205803 | RT-qPCR primers | TAGCAGACTTCTGTTCCTACATCT |
| Sequence-based reagent | GBP1_R | Origene Cat# HP205803 | RT-qPCR primers | CCACTGCTGATGGCATTGACGT |
| Sequence-based reagent | CXCL10_F | Primer Bank ID 323422857c1, https://pga.mgh.harvard.edu/primerbank, Wang et al., 2012. Nucleic Acids Res. doi: 10.1093/nar/gkr1013. | RT-qPCR primers | GTGGCATTCAAGGAGTACCTC |
| Sequence-based reagent | CXCL10_R | Primer Bank ID 323422857c1, https://pga.mgh.harvard.edu/primerbank, Wang et al., 2012. Nucleic Acids Res. doi: 10.1093/nar/gkr1013. | RT-qPCR primers | TGATGGCCTTCGATTCTGGATT |
| Sequence-based reagent | IDO1_F | PrimerBank ID 323668304c1, https://pga.mgh.harvard.edu/cgi-bin/primerbank/new_search2.cgi, Wang et al., 2012. Nucleic Acids Res. doi: 10.1093/nar/gkr1013. | RT-qPCR primers | GCCAGCTTCGAGAAAGAGTTG |
| Sequence-based reagent | IDO1_R | PrimerBank ID 323668304c1, https://pga.mgh.harvard.edu/cgi-bin/primerbank/new_search2.cgi, Wang et al., 2012. Nucleic Acids Res. doi: 10.1093/nar/gkr1013. | RT-qPCR primers | ATCCCAGAACTAGACGTGCAA |
| Sequence-based reagent | CXCL10_F | Rosowski et al., 2014 | ChIP-qPCR primers | AAAGGAACAGTCTGCCCTGA |
| Sequence-based reagent | CXCL10_R | Rosowski et al., 2014 | ChIP-qPCR primers | GCCCTGCTCTCCCATACTTT |
| Sequence-based reagent | GBP1_F | Rosowski et al., 2014 | ChIP-qPCR primers | TGGACAAATTCGTAGAAAGACTCA |
| Sequence-based reagent | GBP1_R | Rosowski et al., 2014 | ChIP-qPCR primers | GCACAAAAACTGTCCCCAAC |
| Sequence-based reagent | IDO1_F | Rosowski et al., 2014 | ChIP-qPCR primers | CACAGTCATTGTATTCTCTTTGCTG |
| Sequence-based reagent | IDO1_R | Rosowski et al., 2014 | ChIP-qPCR primers | GCATATGGCTTTCGTTACAGTC |
| Sequence-based reagent | CD74_F | UCSC Genome Browser, Zeisel et al., 2013. Bioinformatics. doi: 10.1093/bioinformatics/btt145. | RT-qPCR primers | CGCGACCTTATCTCCAACAA |
| Sequence-based reagent | CD74_R | UCSC Genome Browser, Zeisel et al., 2013. Bioinformatics. doi: 10.1093/bioinformatics/btt145. | RT-qPCR primers | CAGGATGGAAAAGCCTGTGT |
| Sequence-based reagent | CXCL9_F | UCSC Genome Browser, Zeisel et al., 2013. Bioinformatics. doi: 10.1093/bioinformatics/btt145. | RT-qPCR primers | TCTTTTCCTCTTGGGCATCA |
| Sequence-based reagent | CXCL9_R | UCSC Genome Browser, Zeisel et al., 2013. Bioinformatics. doi: 10.1093/bioinformatics/btt145. | RT-qPCR primers | TAGTCCCTTGGTTGGTGCTG |
| Transfected construct (human) | Control (non-sil.) siRNA | QIAGEN | Cat# 1022076 | Non-targeting control siRNA |
| Transfected construct (human) | FlexiTube siRNA Hs_CIC_6 | QIAGEN | Cat# SI04275656 | siRNA targeting CIC |
| Transfected construct (human) | FlexiTube siRNA Hs_CIC_8 | QIAGEN | Cat# SI04368469 | siRNA targeting CIC |
| Transfected construct (human) | GeneSolution siRNA Hs_DUX4_11 | QIAGEN | Cat# SI04239753 | siRNA targeting DUX4. |
Additional files
-
Supplementary file 1
Processed RNAseq data for MB135iDUX4, MB135iDUX4-F67A, and MB135iDUX4-CTD.
Processed RNAseq data for MB135iDUX4, MB135iDUX4-F67A, and MB135iDUX4-CTD myoblasts untreated, treated with IFNγ, or treated with IFNγ following doxycycline-induction of the integrated transgene. Please see ‘Materials and methods’ for RNAseq analysis description. Raw data have been uploaded to GEO with the identifier GSE186244.
- https://cdn.elifesciences.org/articles/82057/elife-82057-supp1-v3.xlsx
-
Supplementary file 2
Processed proteomics data for MB135iDUX4-CTD and MB135iDUX4-CTDmL1dL2.
Processed proteomics data for MB135iDUX4-CTD (‘longCTD’) and MB135iDUX4-CTdmL1dL2 (‘mL1dL2’) treated and processed as described in ‘Materials and methods’ under ‘Liquid chromatography mass spectroscopy (LC-MS).’ Raw data have been deposited to the ProteomeXchange Consortium via the PRIDE partner repository with the dataset identifier PXD029215.
- https://cdn.elifesciences.org/articles/82057/elife-82057-supp2-v3.xlsx
-
MDAR checklist
- https://cdn.elifesciences.org/articles/82057/elife-82057-mdarchecklist1-v3.pdf
Download links
A two-part list of links to download the article, or parts of the article, in various formats.
Downloads (link to download the article as PDF)
Open citations (links to open the citations from this article in various online reference manager services)
Cite this article (links to download the citations from this article in formats compatible with various reference manager tools)
Human DUX4 and mouse Dux interact with STAT1 and broadly inhibit interferon-stimulated gene induction
eLife 12:e82057.
https://doi.org/10.7554/eLife.82057


