Csf1 from marrow adipogenic precursors is required for osteoclast formation and hematopoiesis in bone
- Department of Orthopaedic Surgery, Perelman School of Medicine, University of Pennsylvania, United States
- Department of Orthopaedics, Union Hospital, Tongji Medical College, Huazhong University of Science and Technology, China
- Department of Bone and Joint Surgery, Institute of Orthopedic Diseases, The First Affiliated Hospital, Jinan University, China
- Division of Hematology, Children’s Hospital of Philadelphia, United States
- Department of Pediatrics, Perelman School of Medicine, University of Pennsylvania, United States
- Department of Oral and Maxillofacial Surgery/Pharmacology, School of Dental Medicine, University of Pennsylvania, United States
- Graduate Group in Cell and Molecular Biology, Perelman School of Medicine, University of Pennsylvania, United States
- Medical Scientist Training Program, Perelman School of Medicine, University of Pennsylvania, United States
- Center for Childhood Cancer Research, The Children's Hospital of Philadelphia, United States
- Department of Pathology and Laboratory Medicine, Perelman School of Medicine, University of Pennsylvania, United States
- Department of Biochemistry and Structural Biology, University of Texas Health Science Center at San Antonio, United States
- Department of Basic and Translational Sciences, School of Dental Medicine, University of Pennsylvania, United States
Figures
Figure 1
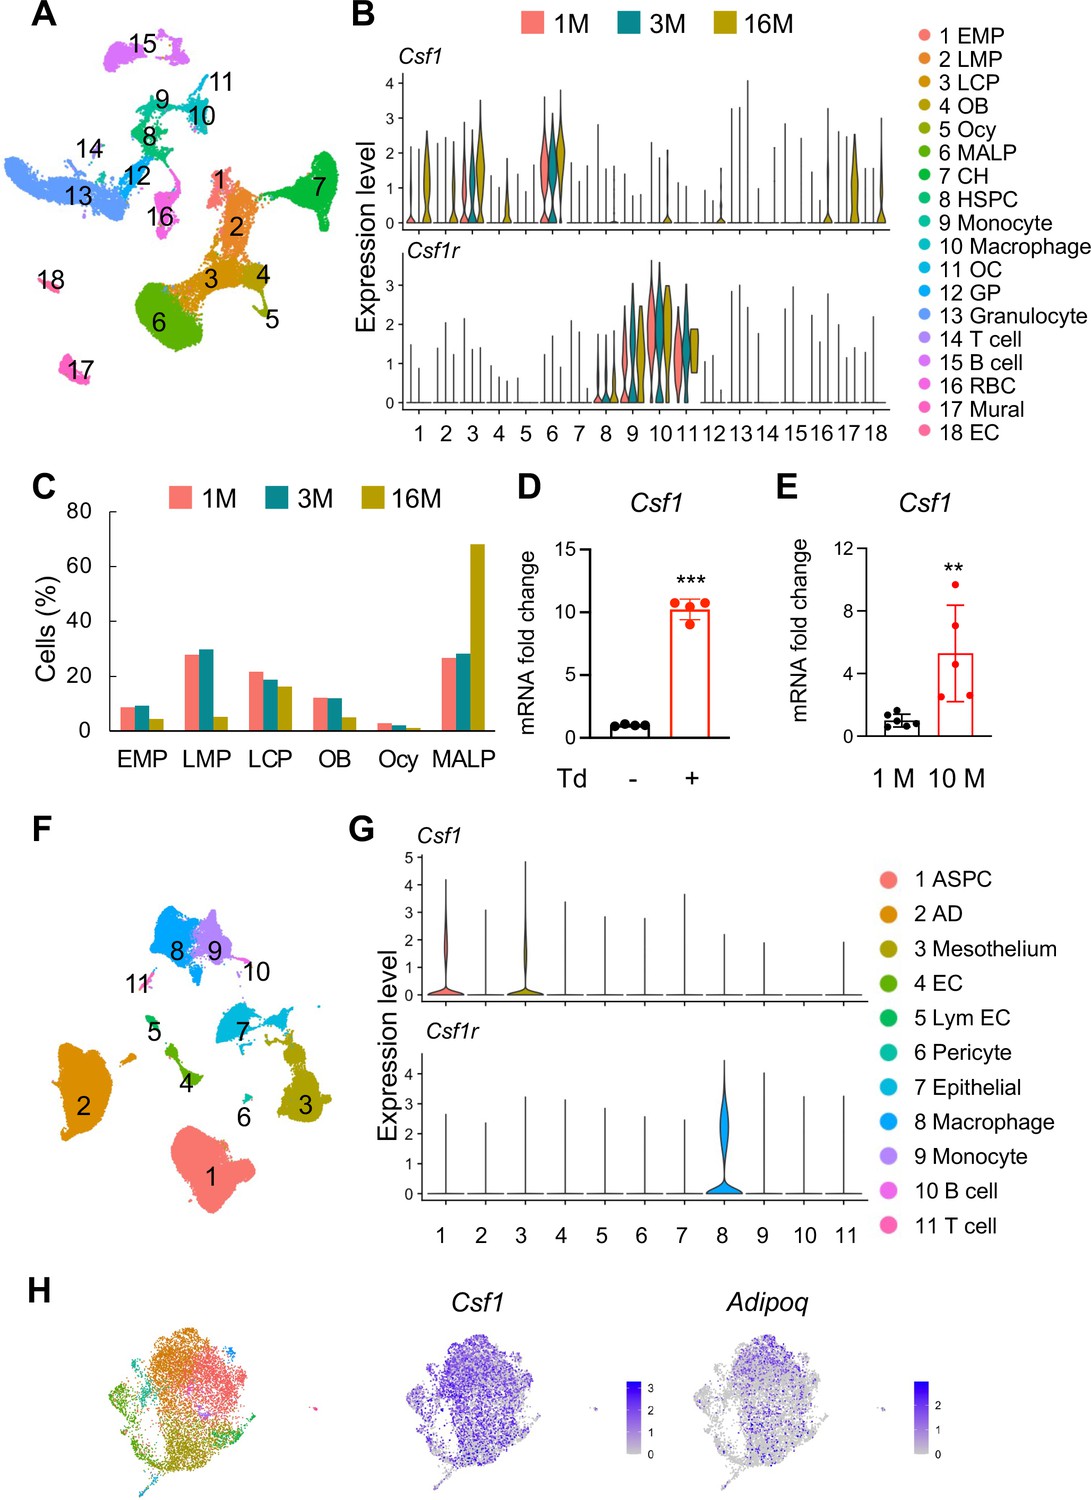
Csf1 expression in bone is mainly contributed by MALPs in an age-dependent manner.
(A) The integrated scRNA-seq dataset of sorted bone marrow Td+ cells from 1, 3, and 16-month-old Col2a1Cre:Rosa26LSL-tdTomato (Col2:Td) mice mice (n=11 mice). The UMAP plot is presented to show cell clustering. (B) Violin plots of Csf1 and its receptor Csf1r in bone marrow cells at different ages. EMP: early mesenchymal progenitor; LMP: late mesenchymal progenitor; LCP: lineage committed progenitor; OB: osteoblast; Ocy: osteocyte; CH: chondrocyte; EC: endothelial cell; HSPC: hematopoietic stem and progenitor cell; OC: osteoclast; GP: granulocyte progenitor; RBC: red blood cell; EC: endothelial cell. (C) The percentages of bone marrow mesenchymal subpopulations are quantified based on UMAP distribution. (D) qRT-PCR analysis of Csf1 expression in sorted Td+ and Td- bone marrow cells from Adipoq:Td mice mice at 3 months of age. ***, p<0.001 Td+ vs Td- cells. (E) qRT-PCR analysis of Csf1 expression in bone marrow from young (1 month of age) and aged (10 months of age) control mice. **, p<0.01 10 M vs 1 M. (F) SnRNA-seq analysis of inguinal and perigonadal adipose tissues from 16-week-old mice. The UMAP plot is presented to show cell clustering. (G) Violin plots of Csf1 and its receptor Csf1r in individual cell subpopulation from peripheral adipose tissue. ASPC: adipose stem and progenitor cell; AD: adipocyte; EC: endothelial cell; Lym EC: lymphatic endothelial cell. (H) ScRNA-seq analysis of mesenchymal cells from human control bone marrow. These bone marrow samples were obtained by either sternal aspiration from donors undergoing cardiothoracic surgery or by manual bone marrow collection from femur heads collected after hip replacement surgery. The UMAP plots are presented to show cell clustering on the left and Csf1 and Adipoq expression on the right.
-
Figure 1—source data 1
Full dataset for Figure 1D.
- https://cdn.elifesciences.org/articles/82112/elife-82112-fig1-data1-v2.xlsx
-
Figure 1—source data 2
Full dataset for Figure 1E.
- https://cdn.elifesciences.org/articles/82112/elife-82112-fig1-data2-v2.xlsx
Figure 2 with 3 supplements
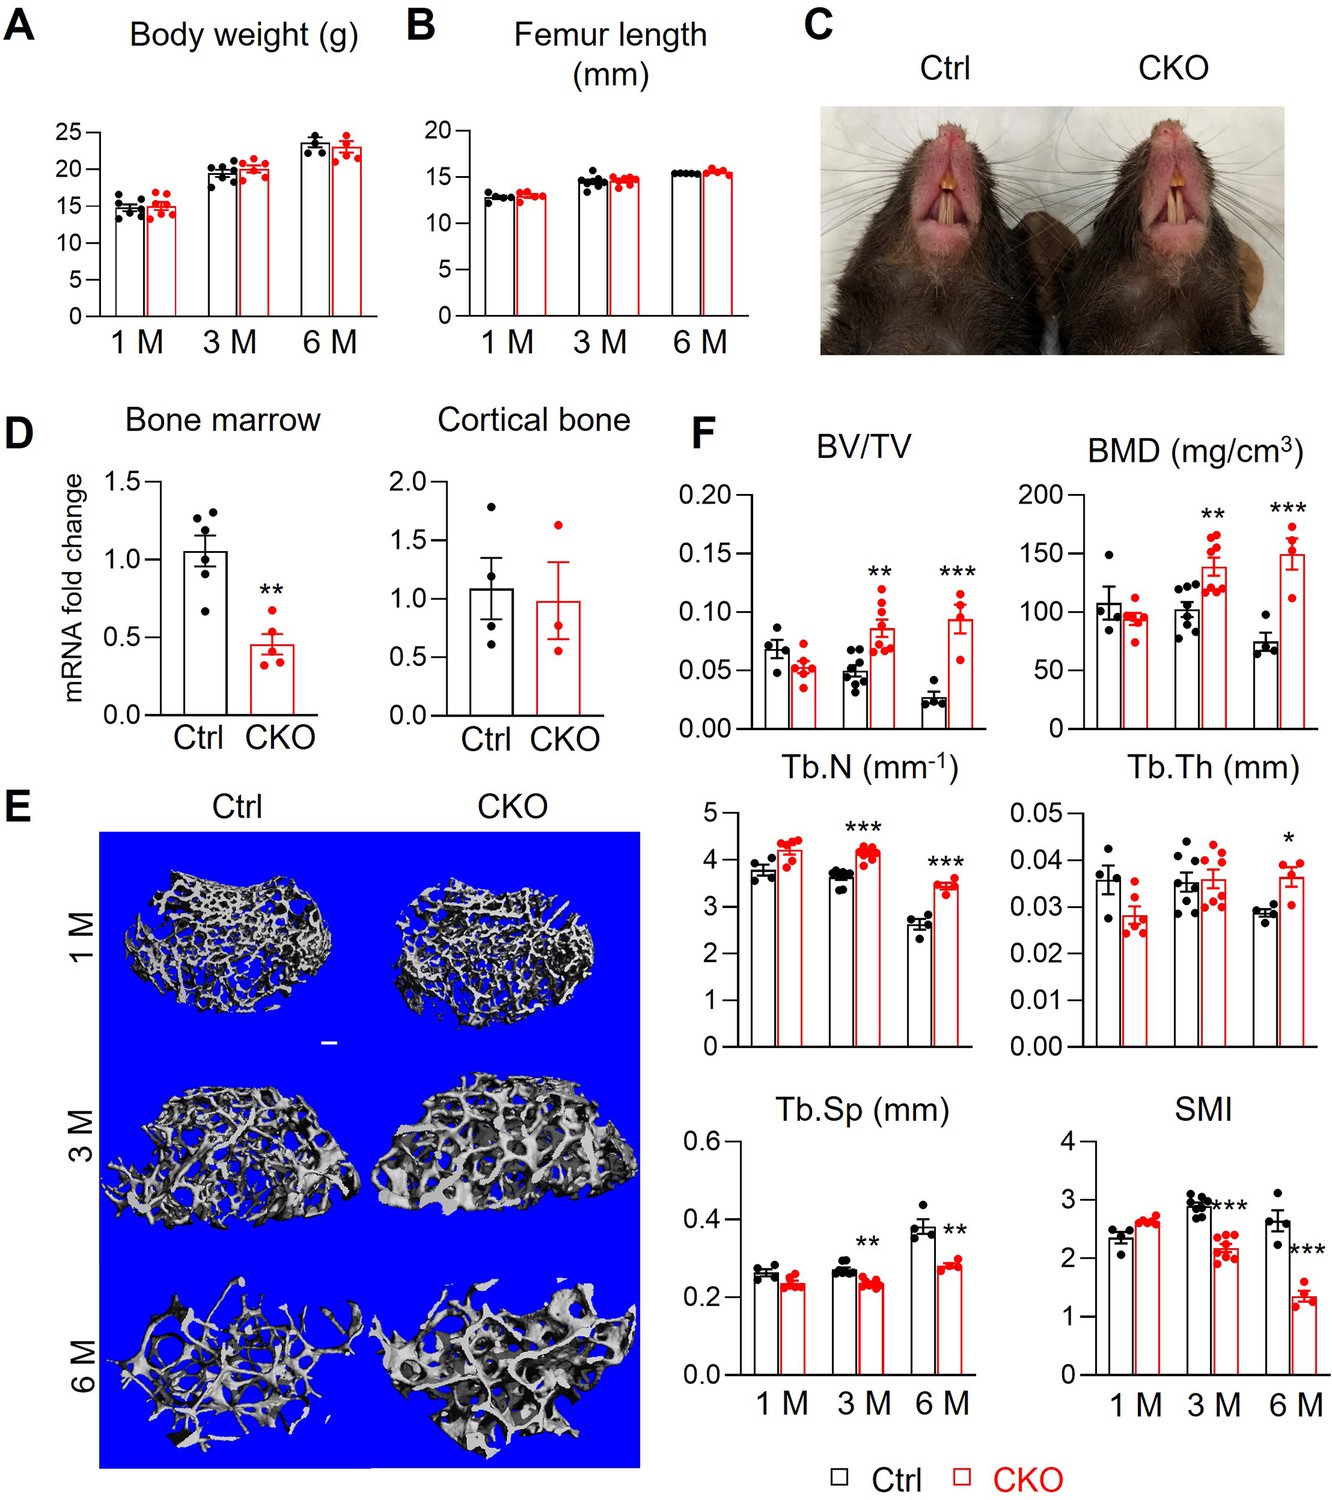
Csf1 CKOAdipoq mice have high trabecular bone mass in long bone.
(A, B) Csf1 CKOAdipoq mice have normal body weight (A) and femoral length (B) at 1, 3, and 6 months of age. n=5–7 mice/group. (C) Tooth eruption is also normal in CKO mice at 1 month of age. (D) qRT-PCR analysis of Csf1 mRNA in bone marrow and cortical bone of control (Ctrl) and Csf1 CKOAdipoq mice at 3 months of age. n=3–6 mice/group. (E) 3D microCT reconstruction of femoral secondary spongiosa region from 1-, 3-, and 6-month-old mice reveals a drastic increase of trabecular bone in female Csf1 CKOAdipoq mice compared to control mice. Scale bar = 100 µm. (F) MicroCT measurement of trabecular bone structural parameters. BV/TV: bone volume fraction; BMD: bone mineral density; Tb.N: trabecular number; Tb.Th: trabecular thickness; Tb.Sp: trabecular separation; SMI: structural model index. n=4–8 mice/group. *, p<0.05; **, p,0.01; ***, p<0.001 CKO vs control.
-
Figure 2—source data 1
Full dataset for Figure 2A.
- https://cdn.elifesciences.org/articles/82112/elife-82112-fig2-data1-v2.xlsx
-
Figure 2—source data 2
Full dataset for Figure 2B.
- https://cdn.elifesciences.org/articles/82112/elife-82112-fig2-data2-v2.xlsx
-
Figure 2—source data 3
Full dataset for Figure 2D.
- https://cdn.elifesciences.org/articles/82112/elife-82112-fig2-data3-v2.xlsx
-
Figure 2—source data 4
Full dataset for Figure 2F.
- https://cdn.elifesciences.org/articles/82112/elife-82112-fig2-data4-v2.xlsx
Figure 2—figure supplement 1
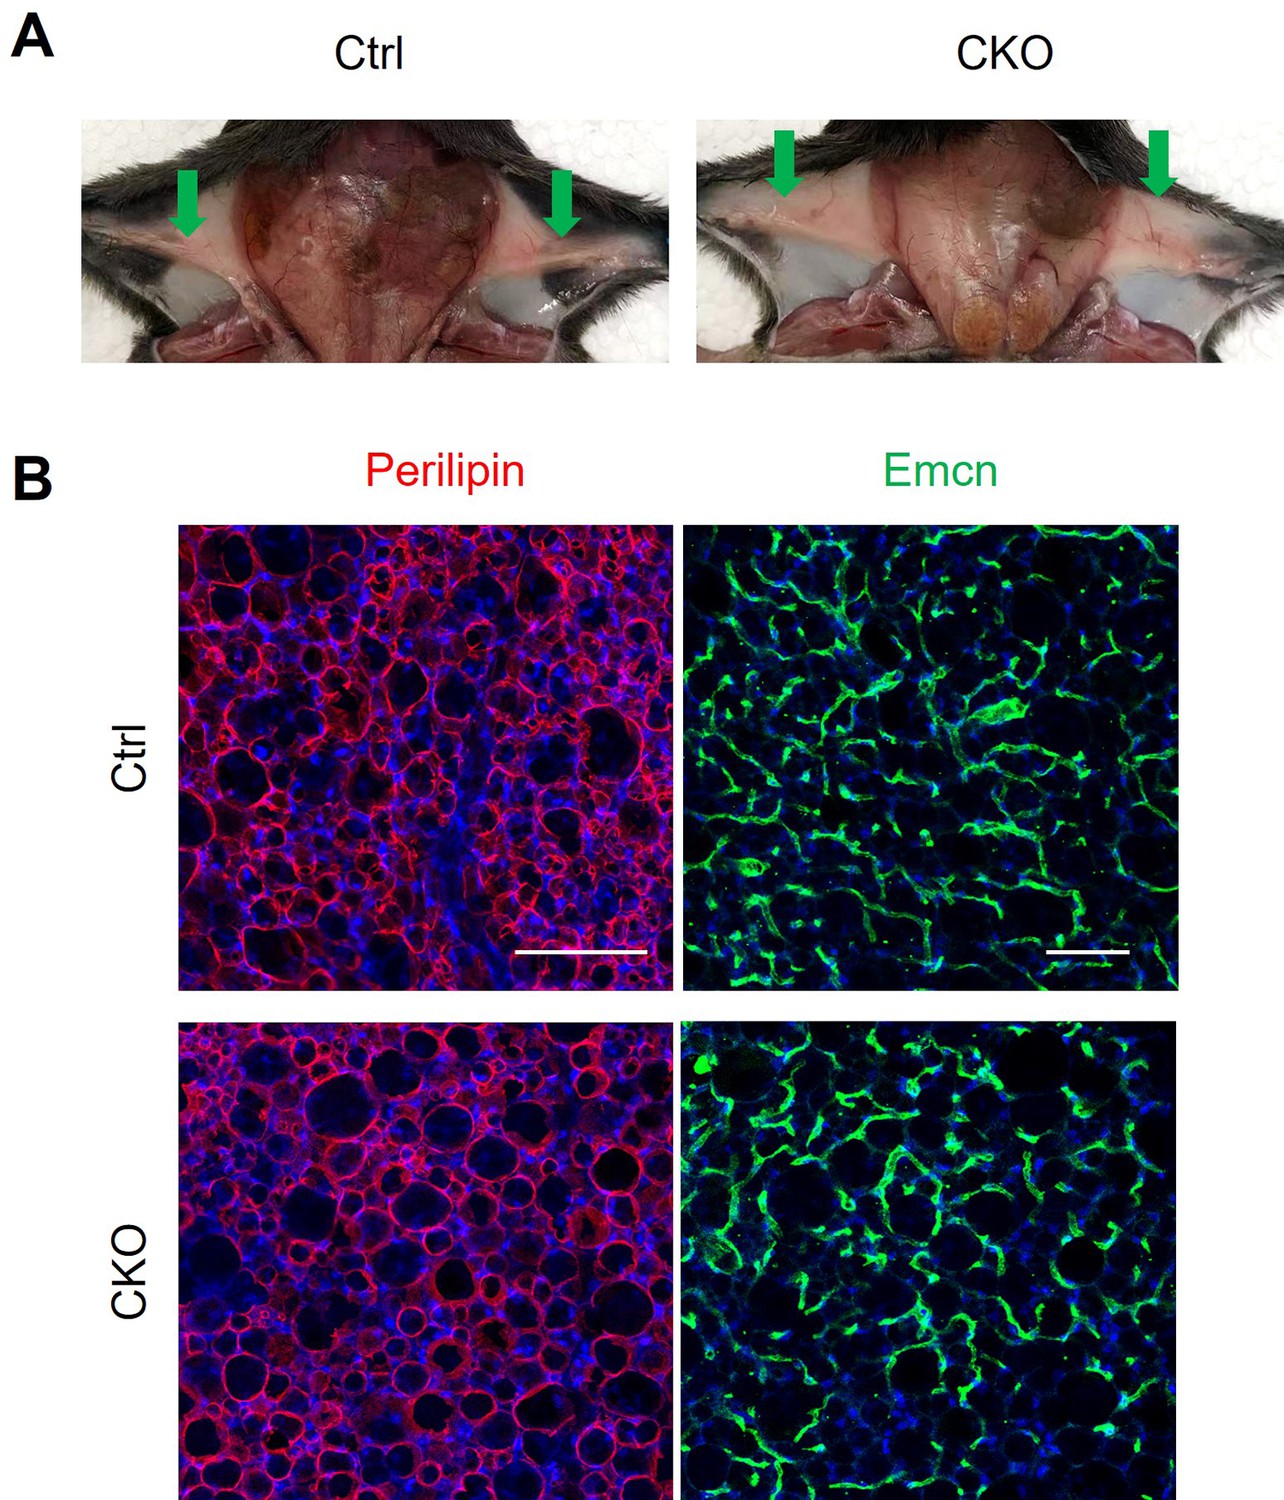
Csf1 CKOAdipoq mice have normal subcutaneous fat pad.
(A) Representative photographs showing subcutaneous fat pad tissues (pointed by arrows) in control and Csf1 CKOAdipoq mice. (B) Representative adipocyte (Perilipin) and vessel (Emcn) staining images in subcutaneous fat. Scale bar = 100 µm (Perilipin) or 200 µm (Emcn).
Figure 2—figure supplement 2
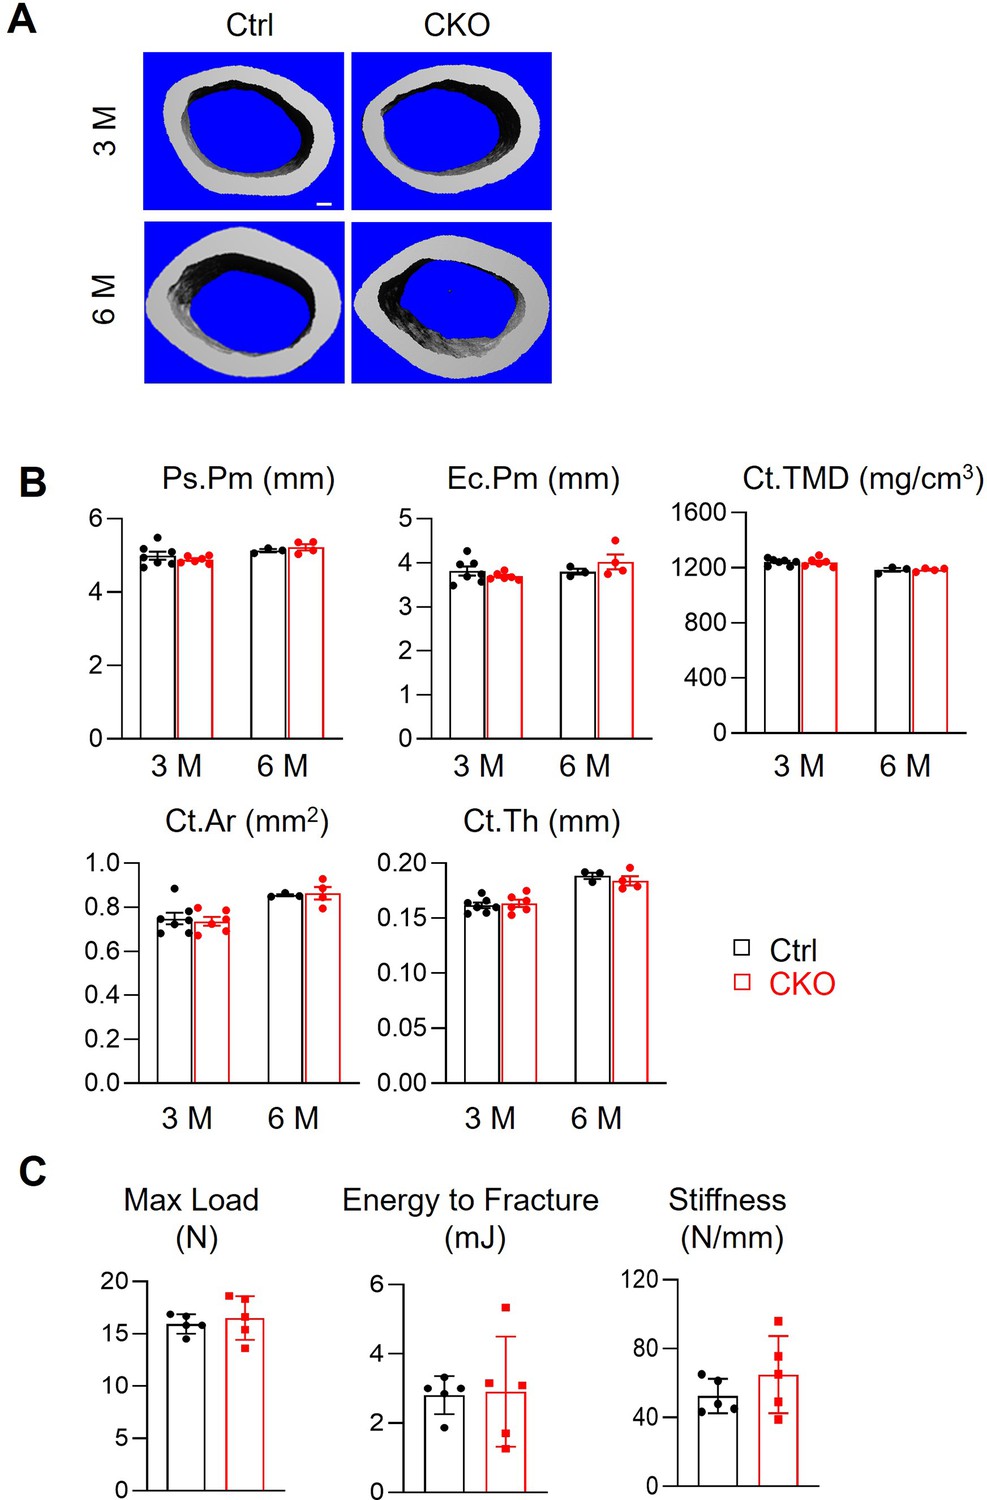
Csf1 CKOAdipoq mice have normal cortical bone structure and mechanical properties.
(A) 3D microCT reconstruction of femoral midshaft region from 3- and 6-month-old female control and Csf1 CKOAdipoq mice. Scale bar = 100 µm. (B) MicroCT measurement of cortical bone structural parameters of 6-month-old mice. Ps.Pm: periosteal perimeter; Ec.Pm: endosteal perimeter; Ct.TMD: cortical tissue mineral density. Ct.Ar: cortical area; Ct.Th: cortical thickness. n=3–7 mice/group. (C) Three-point bending test was performed on mouse femurs. n=5 mice/group.
-
Figure 2—figure supplement 2—source data 1
Full dataset for Figure 2—figure supplement 2B.
- https://cdn.elifesciences.org/articles/82112/elife-82112-fig2-figsupp2-data1-v2.xlsx
-
Figure 2—figure supplement 2—source data 2
Full dataset for Figure 2—figure supplement 2C.
- https://cdn.elifesciences.org/articles/82112/elife-82112-fig2-figsupp2-data2-v2.xlsx
Figure 2—figure supplement 3
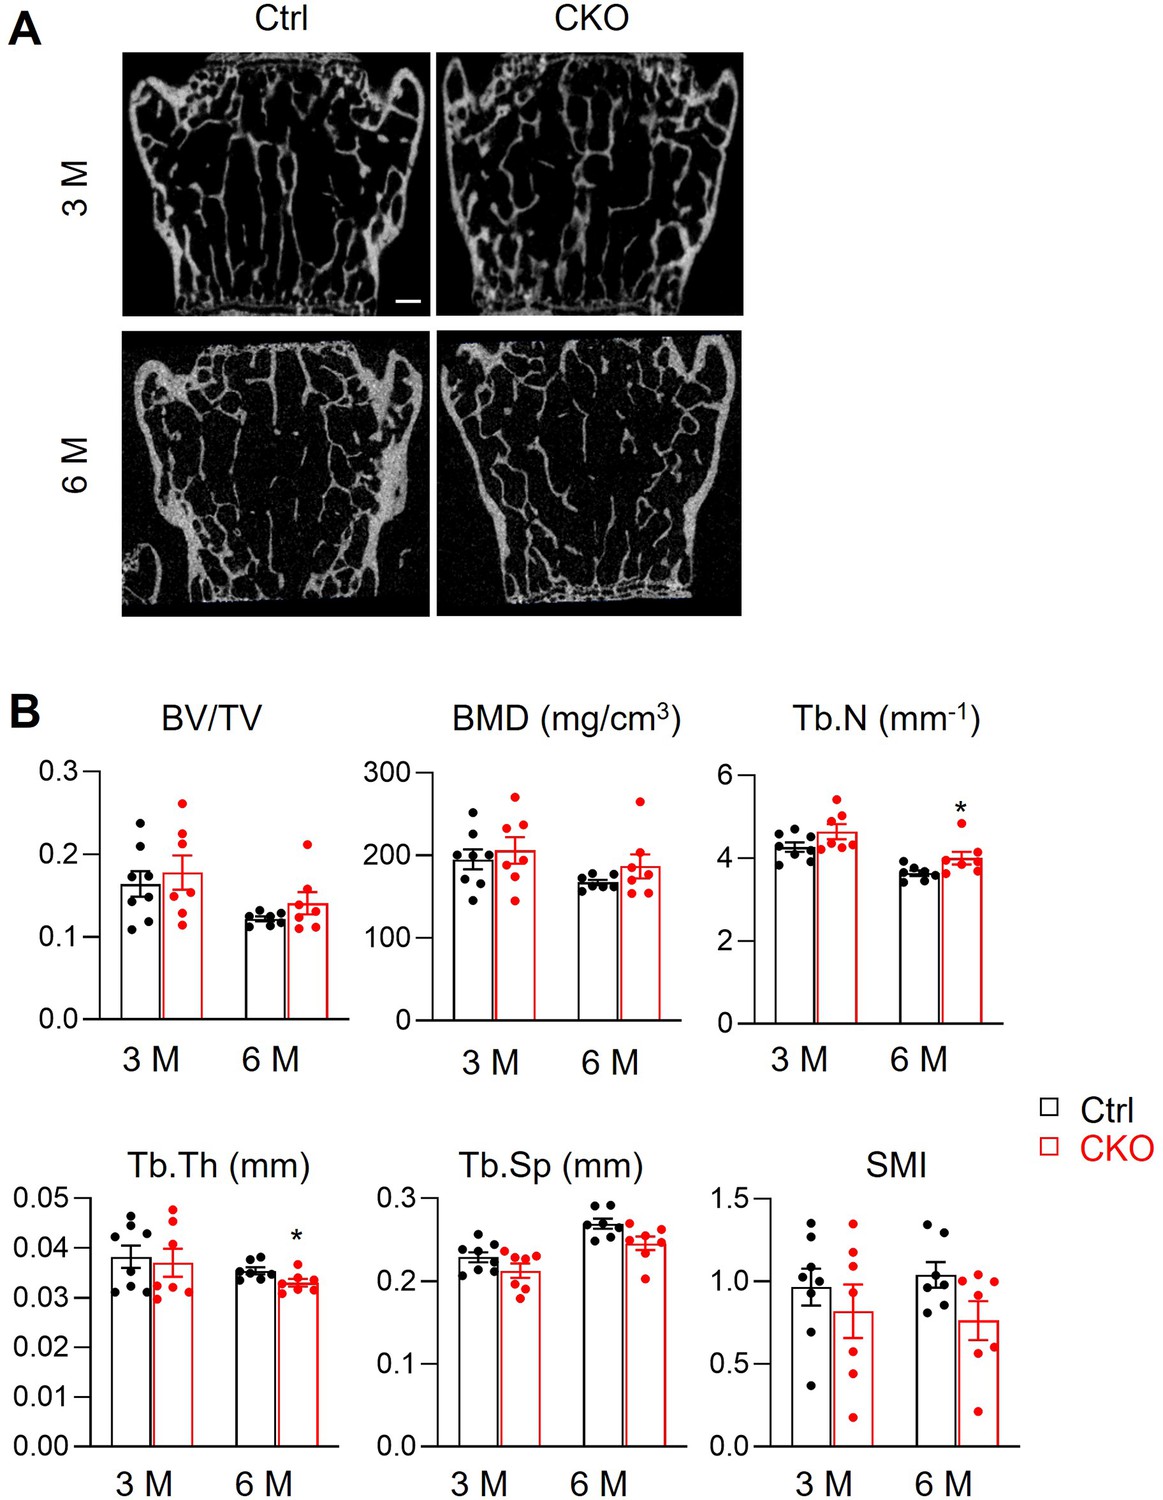
Csf1 deficiency in MALPs does not affects vertebral bone.
(A) 2D microCT reconstruction of vertebrae from control and Csf1 CKOAdipoq mice at 3 and 6 months of age. Scale bar = 250 µm. (B) MicroCT measurement of trabecular bone structural parameters in vertebrae. BV/TV: bone volume fraction; BMD: bone mineral density; Tb.N: trabecular number; Tb.Th: trabecular thickness; Tb.Sp: trabecular separation; SMI: structural model index. n=6–7 mice/group. *, p<0.05 CKO vs control.
-
Figure 2—figure supplement 3—source data 1
Full dataset for Figure 2—figure supplement 3B.
- https://cdn.elifesciences.org/articles/82112/elife-82112-fig2-figsupp3-data1-v2.xlsx
Figure 3
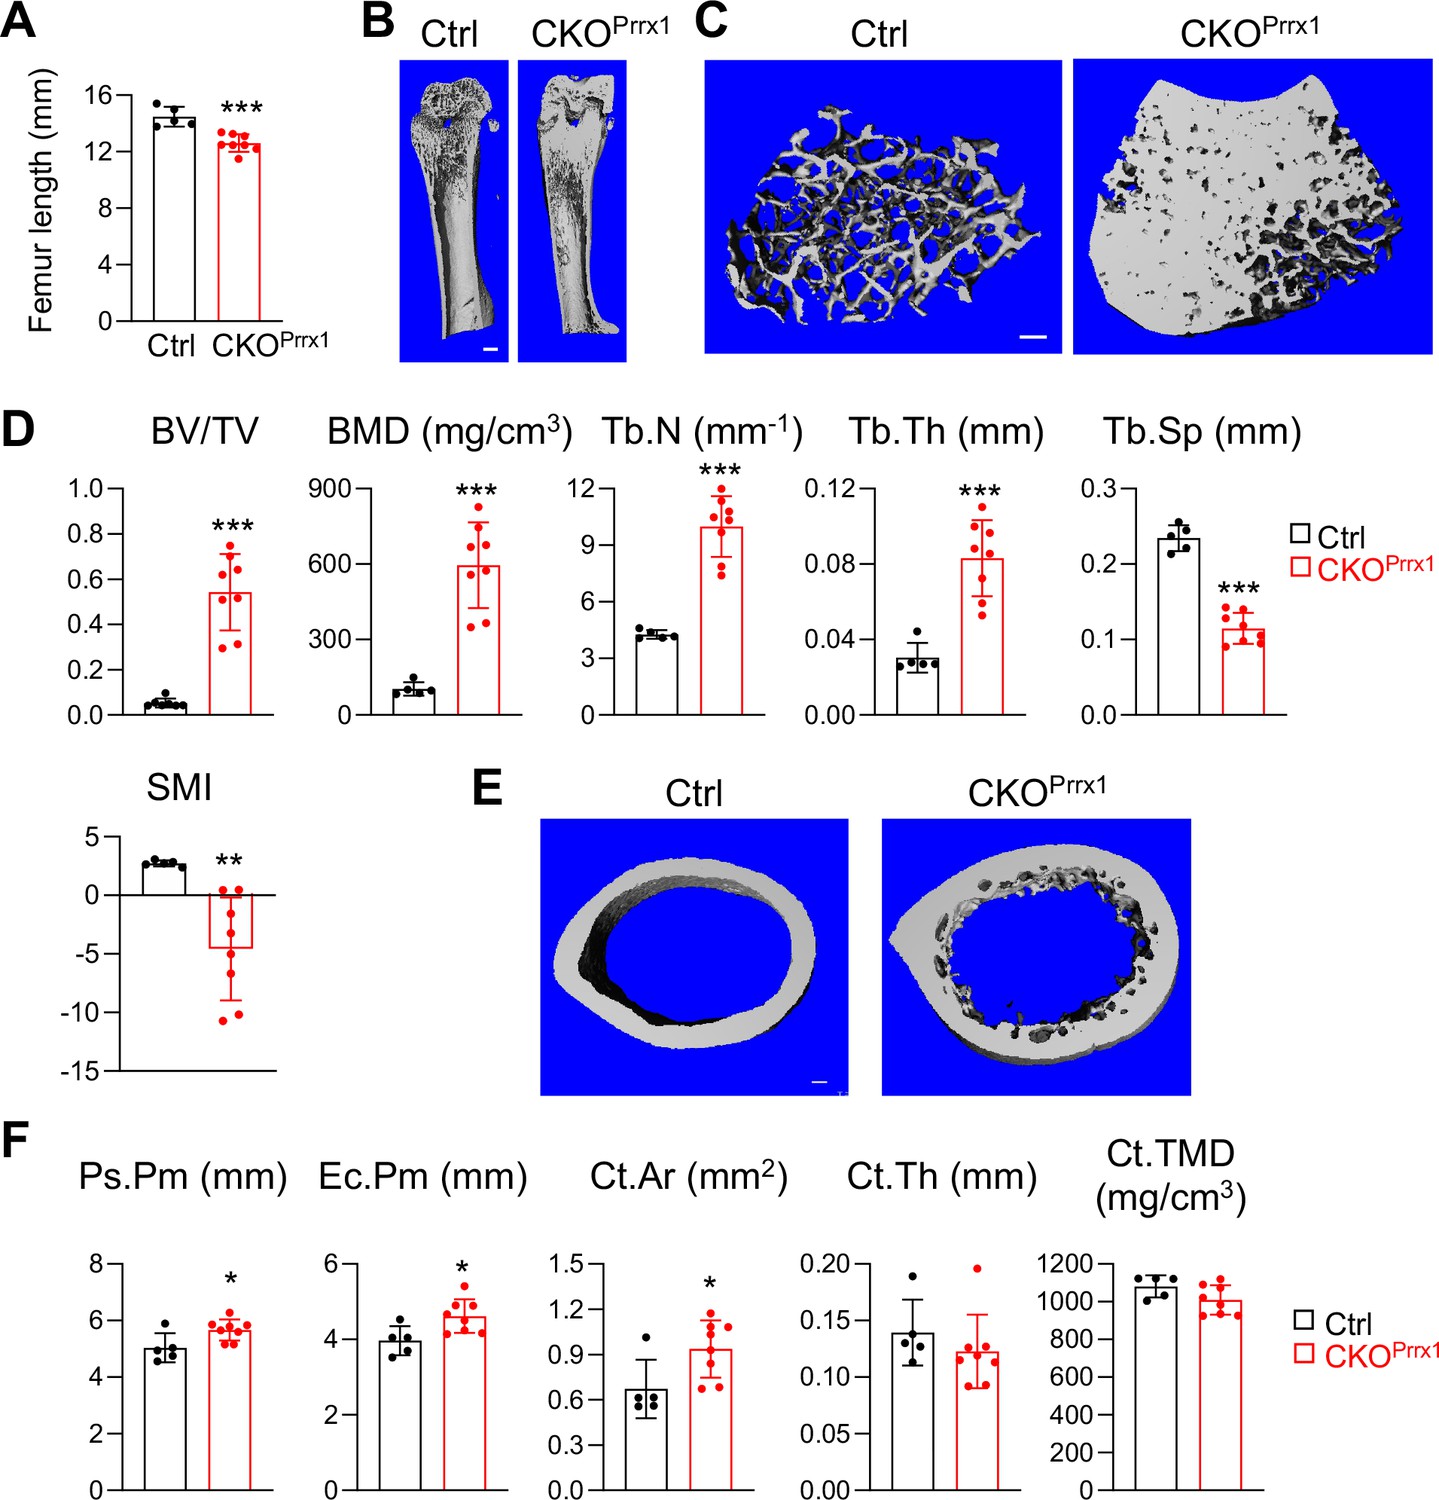
Csf1 depletion in all mesenchymal cells using Prrx1Cre affects bone growth and causes severe osteopetrosis.
(A) Femur length measurement in Csf1 CKOPrrx1 mice at 2–3 months of age (n=5–8 mice/group). (B) 3D microCT reconstruction of whole femurs from control and Csf1 CKOPrrx1 mice. Scale bar = 1 mm. (C) 3D microCT reconstruction of femoral secondary spongiosa region from control and Csf1 CKOPrrx1 mice. Scale bar = 100 µm. (D) MicroCT measurement of trabecular bone structural parameters. BV/TV: bone volume fraction; BMD: bone mineral density; Tb.N: trabecular number; Tb.Th: trabecular thickness; Tb.Sp: trabecular separation; SMI: structural model index. n=5–8 mice/group. (E) 3D microCT reconstruction of femoral cortical bone. Scale bar = 100 µm. (F) MicroCT measurement of cortical bone structural parameters. Ps.Pm: periosteal perimeter; Ec.Pm: endosteal perimeter; Ct.TMD: cortical tissue mineral density. Ct.Ar: cortical area; Ct.Th: cortical thickness. n=5–8 mice/group. *, p<0.05; ***, p<0.001 CKOPrrx1 vs control.
-
Figure 3—source data 1
Full dataset for Figure 3A.
- https://cdn.elifesciences.org/articles/82112/elife-82112-fig3-data1-v2.xlsx
-
Figure 3—source data 2
Full dataset for Figure 3D.
- https://cdn.elifesciences.org/articles/82112/elife-82112-fig3-data2-v2.xlsx
-
Figure 3—source data 3
Full dataset for Figure 3F.
- https://cdn.elifesciences.org/articles/82112/elife-82112-fig3-data3-v2.xlsx
Figure 4
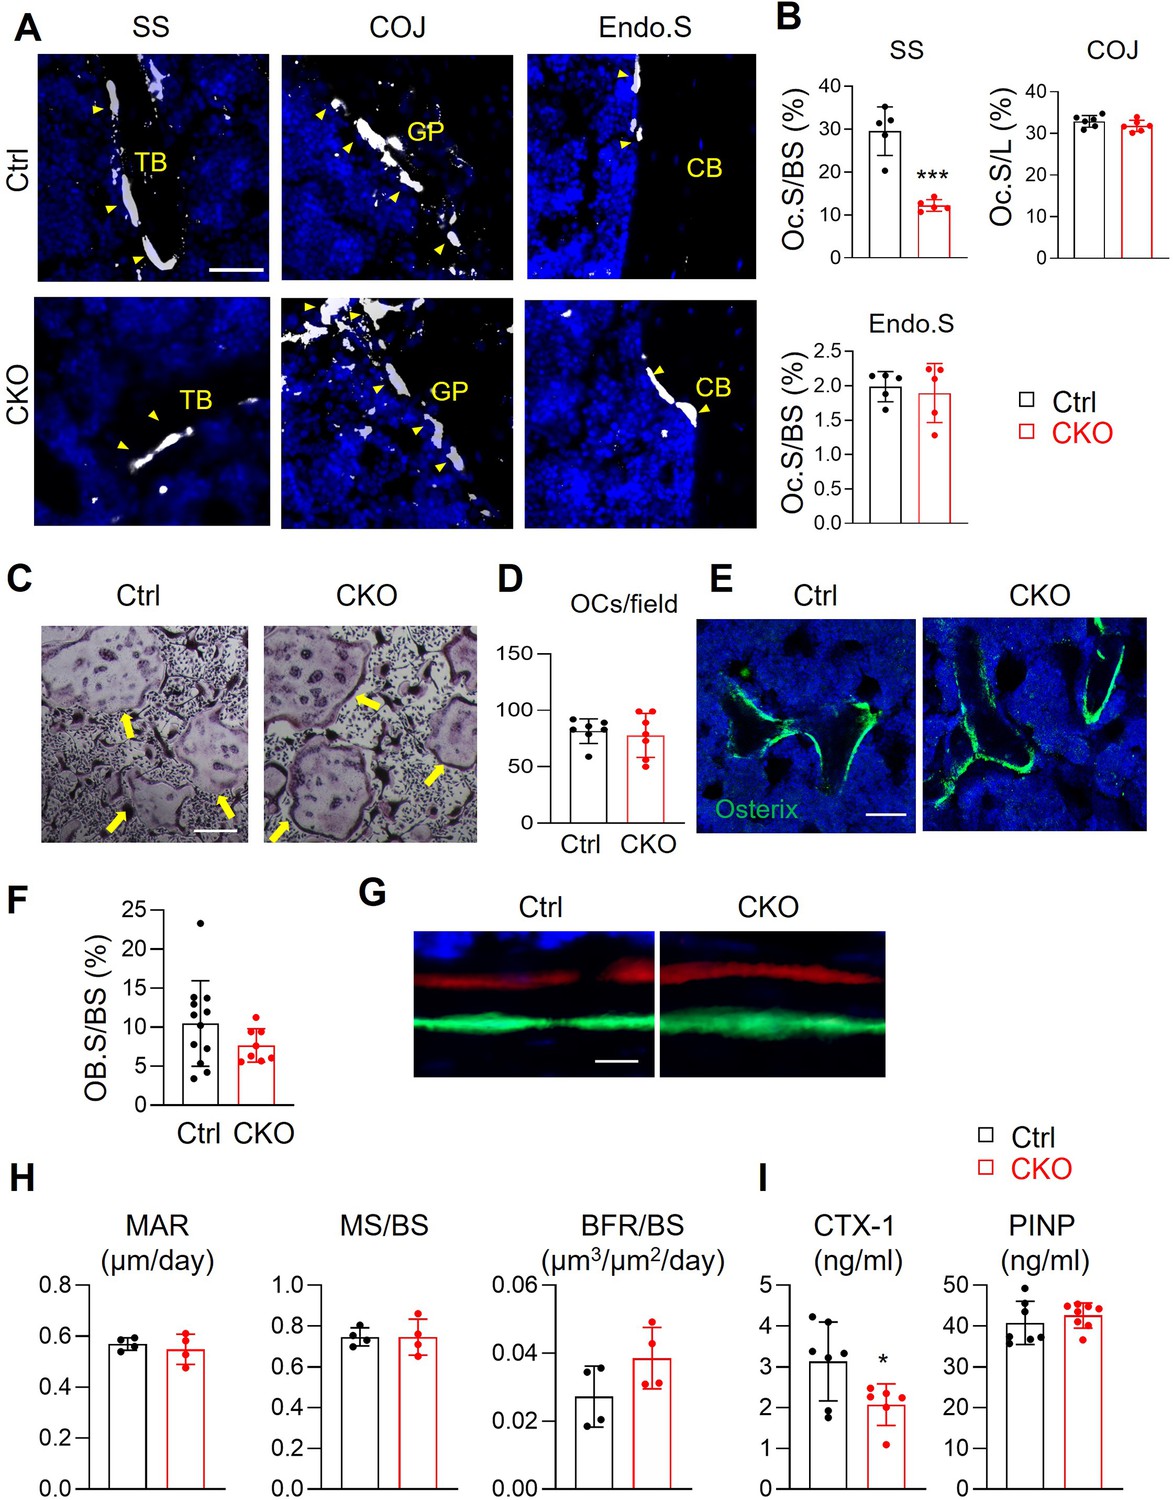
Csf1 deletion in MALPs suppresses bone resorption but not bone formation.
(A) Representative fluorescent TRAP staining images of femoral long bones from control and Csf1 CKOAdipoq mice at 3 months of age show TRAP+ osteoclasts at different skeletal sites: secondary spongiosa (SS), chondro-osseous junction (COJ), and endosteal surface (Endo.S). TB: trabecular bone; CB: cortical bone. Scale bar = 50 μm. (B) Quantification of osteoclast surface (Oc.S) at three skeletal sites. BS: bone surface. L: COJ length. n=5 mice/group. ***, p<0.001 CKO vs control. (C) Representative TRAP staining images of osteoclast culture derived from control and Csf1 CKOAdipoq BMMs at 7 days after addition of RANKL and Csf1. Arrows point to mature osteoclasts. Scale bar = 200 μm. (D) Quantification of TRAP+ multinucleated cells (>3 nuclei/cell) per field. n=7 mice/group. (E) Representative Osterix staining of trabecular bone from control and Csf1 CKOAdipoq femurs. Scale bar = 50 μm. (F) Quantification of osteoblast surface (OB.S). BS, bone surface. n=8–12 mice/group. (G) Representative double labeling of trabecular bone from control and Csf1 CKOAdipoq femurs. (H) Bone formation activity is quantified. MAR: mineral apposition rate; MS: mineralizing surface; BFR: bone formation rate. n=4 mice/group. (I) Serum ELISA analysis of bone resorption marker (CTX-1) and formation marker (PINP) in control and CKO mice. n=6–8 mice/group. *, p<0.05 CKO vs control.
-
Figure 4—source data 1
Full dataset for Figure 4B.
- https://cdn.elifesciences.org/articles/82112/elife-82112-fig4-data1-v2.xlsx
-
Figure 4—source data 2
Full dataset for Figure 4D.
- https://cdn.elifesciences.org/articles/82112/elife-82112-fig4-data2-v2.xlsx
-
Figure 4—source data 3
Full dataset for Figure 4F.
- https://cdn.elifesciences.org/articles/82112/elife-82112-fig4-data3-v2.xlsx
-
Figure 4—source data 4
Full dataset for Figure 4H.
- https://cdn.elifesciences.org/articles/82112/elife-82112-fig4-data4-v2.xlsx
-
Figure 4—source data 5
Full dataset for Figure 4I.
- https://cdn.elifesciences.org/articles/82112/elife-82112-fig4-data5-v2.xlsx
Figure 5

Csf1 CKOAdipoq mice are protected from LPS-induced calvarial bone lesions.
(A) Representative 3D microCT reconstruction of mouse calvaria after 1 week of vehicle (veh, PBS) or LPS injection. Scale bar = 2 mm. (B) The percentage of bone destruction area (Des.Ar) in calvaria was quantified. n=7–16 mice/group. (C) Representative images of H&E and TRAP-stained coronal sections. In the H&E-stained images, * indicates suture position and blue arrows point to calvarial bone marrow region. Green arrows are inflammatory cells in the eroded calvariae after LPS injection in control mice. In the TRAP-stained images, red arrows point to TRAP+ osteoclasts. Scale bar = 200 µm. (D) Quantification of osteoclast number (Oc.N) in calvaria. n=3–9 mice/group. ***, p<0.001 LPS vs Veh; ###, p<0.001 CKO vs control.
-
Figure 5—source data 1
Full dataset for Figure 5B.
- https://cdn.elifesciences.org/articles/82112/elife-82112-fig5-data1-v2.xlsx
-
Figure 5—source data 2
Full dataset for Figure 5D.
- https://cdn.elifesciences.org/articles/82112/elife-82112-fig5-data2-v2.xlsx
Figure 6 with 1 supplement

Bone marrow cellularity, hematopoietic progenitors, and macrophages are reduced in Csf1 CKOAdipoq mice.
(A) Bone marrow cellularity was quantified in control and Csf1 CKOAdipoq mice at 1, 3, and 6 months of age. *, p<0.05; **, p<0.01 CKO vs control. (B) Fluorescent staining of F4/80 was performed on the long bones of Adipoq:Td mice. White arrows point to Adipoq+ cells (MALPs) directly contact with F4/80+ macrophages in the bone marrow. Scale bar = 20 µm. (C) Representative fluorescent images of F4/80 staining in control and Csf1 CKOAdipoq bone marrow. Scale bar = 20 µm. (D) Flow analysis of Cd11b+F4/80+bone marrow macrophages at 1, 3, and 6 months of age. *, p<0.05 CKO vs control. (E) Cell counts of hematopoietic stem and progenitor cells. LK = Lineage-cKit+, LSK = Lineage-Sca1+cKit+, MPP = Lineage-Sca1+cKit+CD48+CD150-, SLAM LSK = Lineage-Sca1+cKit+CD48-CD150+. n=4–5 mice/group. *, P<0.05 CKO vs control. (F) Flow analysis of bone marrow hematopoietic subpopulations. Neutrophil = CD45+CD11b+Ly6G+; estrophil = CD45+CD11b+Ly6 G-CD170+; monocyte = CD45+CD11b+Ly6G-CD170-Ly6C+; B cell = CD45+Ter119 CD3-CD45R/B220+; T cell = CD45+Ter119 CD3+; erythroid progenitors = CD45+Ter119+. n=5–6 mice/group. *, p<0.05 CKO vs control. (G) Representative fluorescent images of bone marrow vasculature stained by Endomucin (Emcn). Scale bar = 100 µm. (H) Quantification of bone marrow vessel diameter, density, and area. n=8–15 mice/group.
-
Figure 6—source data 1
Full dataset for Figure 6A.
- https://cdn.elifesciences.org/articles/82112/elife-82112-fig6-data1-v2.xlsx
-
Figure 6—source data 2
Full dataset for Figure 6D.
- https://cdn.elifesciences.org/articles/82112/elife-82112-fig6-data2-v2.xlsx
-
Figure 6—source data 3
Full dataset for Figure 6E.
- https://cdn.elifesciences.org/articles/82112/elife-82112-fig6-data3-v2.xlsx
-
Figure 6—source data 4
Full dataset for Figure 6F.
- https://cdn.elifesciences.org/articles/82112/elife-82112-fig6-data4-v2.xlsx
-
Figure 6—source data 5
Full dataset for Figure 6H.
- https://cdn.elifesciences.org/articles/82112/elife-82112-fig6-data5-v2.xlsx
Figure 6—figure supplement 1
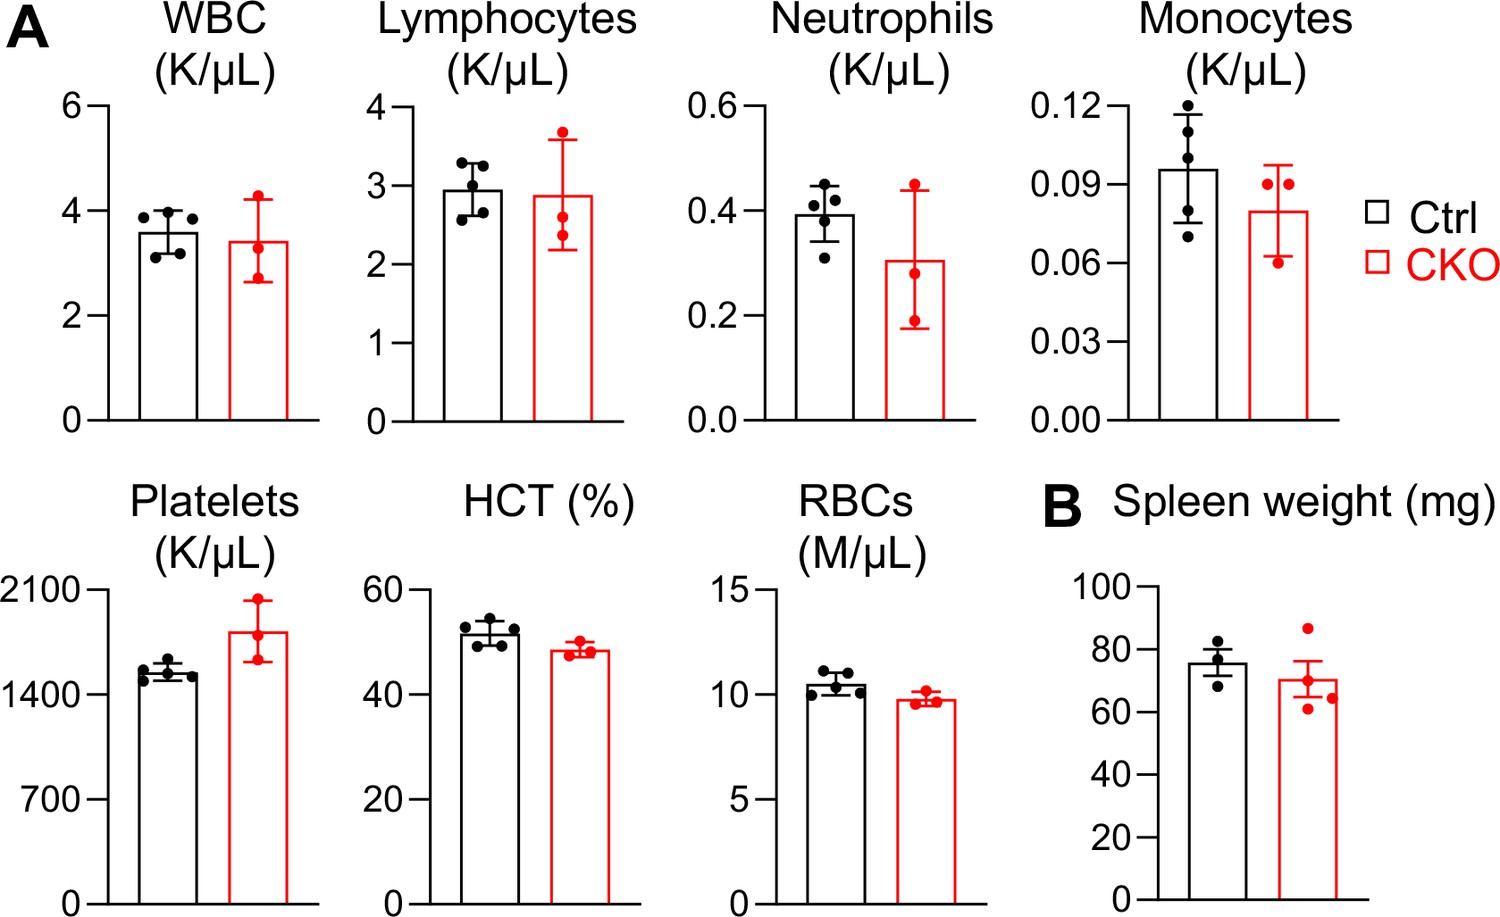
Peripheral blood and spleen appear normal in 3-month-old Csf1 CKOAdipoq mice.
(A) Flow analysis of peripheral blood components, including white blood cells (WBCs), lymphocytes, neutrophils, monocytes, platelets, hematocrit (HCT), and red blood cells (RBCs). n=3–5 mice/group. (B) Spleen weight was measured at 3 months of age. n=3–4 mice/group.
-
Figure 6—figure supplement 1—source data 1
Full dataset for Figure 6—figure supplement 1A.
- https://cdn.elifesciences.org/articles/82112/elife-82112-fig6-figsupp1-data1-v2.xlsx
-
Figure 6—figure supplement 1—source data 2
Full dataset for Figure 6—figure supplement 1B.
- https://cdn.elifesciences.org/articles/82112/elife-82112-fig6-figsupp1-data2-v2.xlsx
Author response image 1
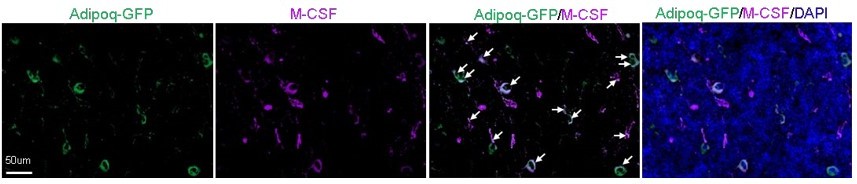
Adipoq+ cells in mouse bone marrow express Csf1 at the protein level.
Fluorescent staining of Csf1 was performed on the long bones of Adipoq-Cre mTmG mice. Arrows point to GFP+Csf1+ cells. It was observed that the majority of bone marrow AdipoQ-expressing progenitor cells express Csf1 (1865 cells out of 2001 cells counted, n=3 mice, 93.2%). Adopted from ref (4).
Author response image 2
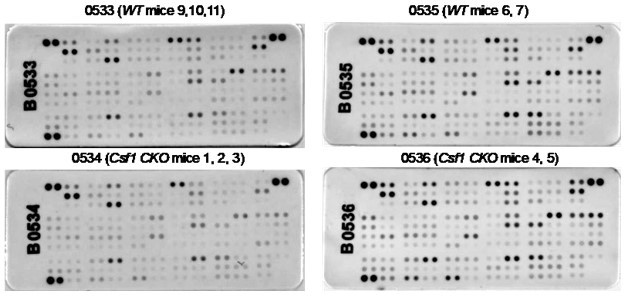
Csf1 depletion in MALPs does not alter bone marrow cytokine expression.
Bone marrow from 3-5-month-old WT and Csf1 CKOAdipoq mice (n=5/group) were centrifuged out from long bones, lysed by RIPA buffer, and subjected to cytokine array analysis using Mouse XL Cytokine Array Kit (Cat# ARY028, R&D Systems). Bone marrow from 2-3 mice was pooled for one membrane as indicated.
Author response image 3
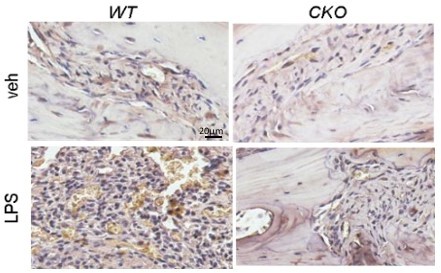
4/80 staining (brown) of mouse calvarial bone marrow at day 7 post a vehicle or an LPS injection.
Author response image 4
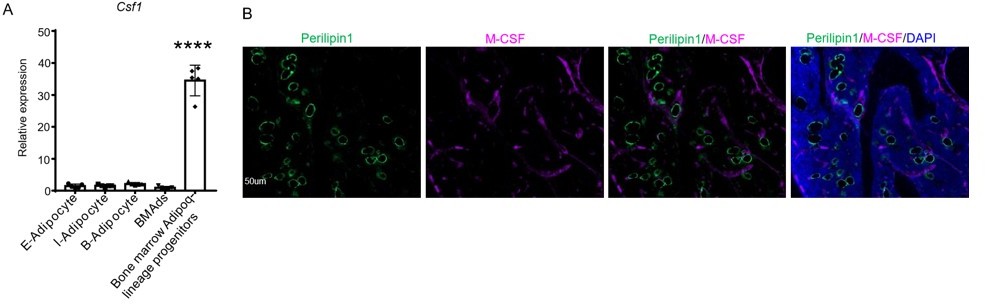
Csf1 is expressed in MALPs but not LiLAs in bone marrow.
(A) qRT-PCR analysis of Csf1 expression in bone marrow adipocytes BMAds, which are LiLAs in our terminology, and bone marrow Adipoq-lineage progenitors, which are MALPs in our terminology, sorted from the bone marrow of Adipoq-Cre mTmG mice. (B) Fluorescent staining of Perillipin and Csf1 was performed on mouse long bones. Csf1 expression was not detected in mature bone marrow adipocytes (Perilipin1+) (0 cells out of 115 cells counted, n=3 mice, 0%). Adopted from ref (4).
Additional files
Download links
A two-part list of links to download the article, or parts of the article, in various formats.
Downloads (link to download the article as PDF)
Open citations (links to open the citations from this article in various online reference manager services)
Cite this article (links to download the citations from this article in formats compatible with various reference manager tools)
Csf1 from marrow adipogenic precursors is required for osteoclast formation and hematopoiesis in bone
eLife 12:e82112.
https://doi.org/10.7554/eLife.82112


