Bone marrow Adipoq-lineage progenitors are a major cellular source of M-CSF that dominates bone marrow macrophage development, osteoclastogenesis, and bone mass
- Arthritis and Tissue Degeneration Program and David Z. Rosensweig Genomics Research Center, Hospital for Special Surgery, United States
- Department of Medicine, Weill Cornell Medical College, United States
- The first Affiliated Hospital of Xiamen University-ICMRS Collaborating Center for Skeletal Stem Cells, State Key Laboratory of Cellular Stress Biology, Faculty of Medicine and Life Sciences, Fujian Provincial Key Laboratory of Organ and Tissue Regeneration, School of Medicine, Xiamen University, China
- Pathology and Laboratory Medicine, Weill Cornell Medical College, United States
- Department of Biochemistry & Structural Biology, University of Texas Health Science Center at San Antonio, United States
- Research Institute, Hospital for Special Surgery, United States
- Graduate Program in Cell and Development Biology, Weill Cornell Graduate School of Medical Sciences, United States
Figures
Figure 1
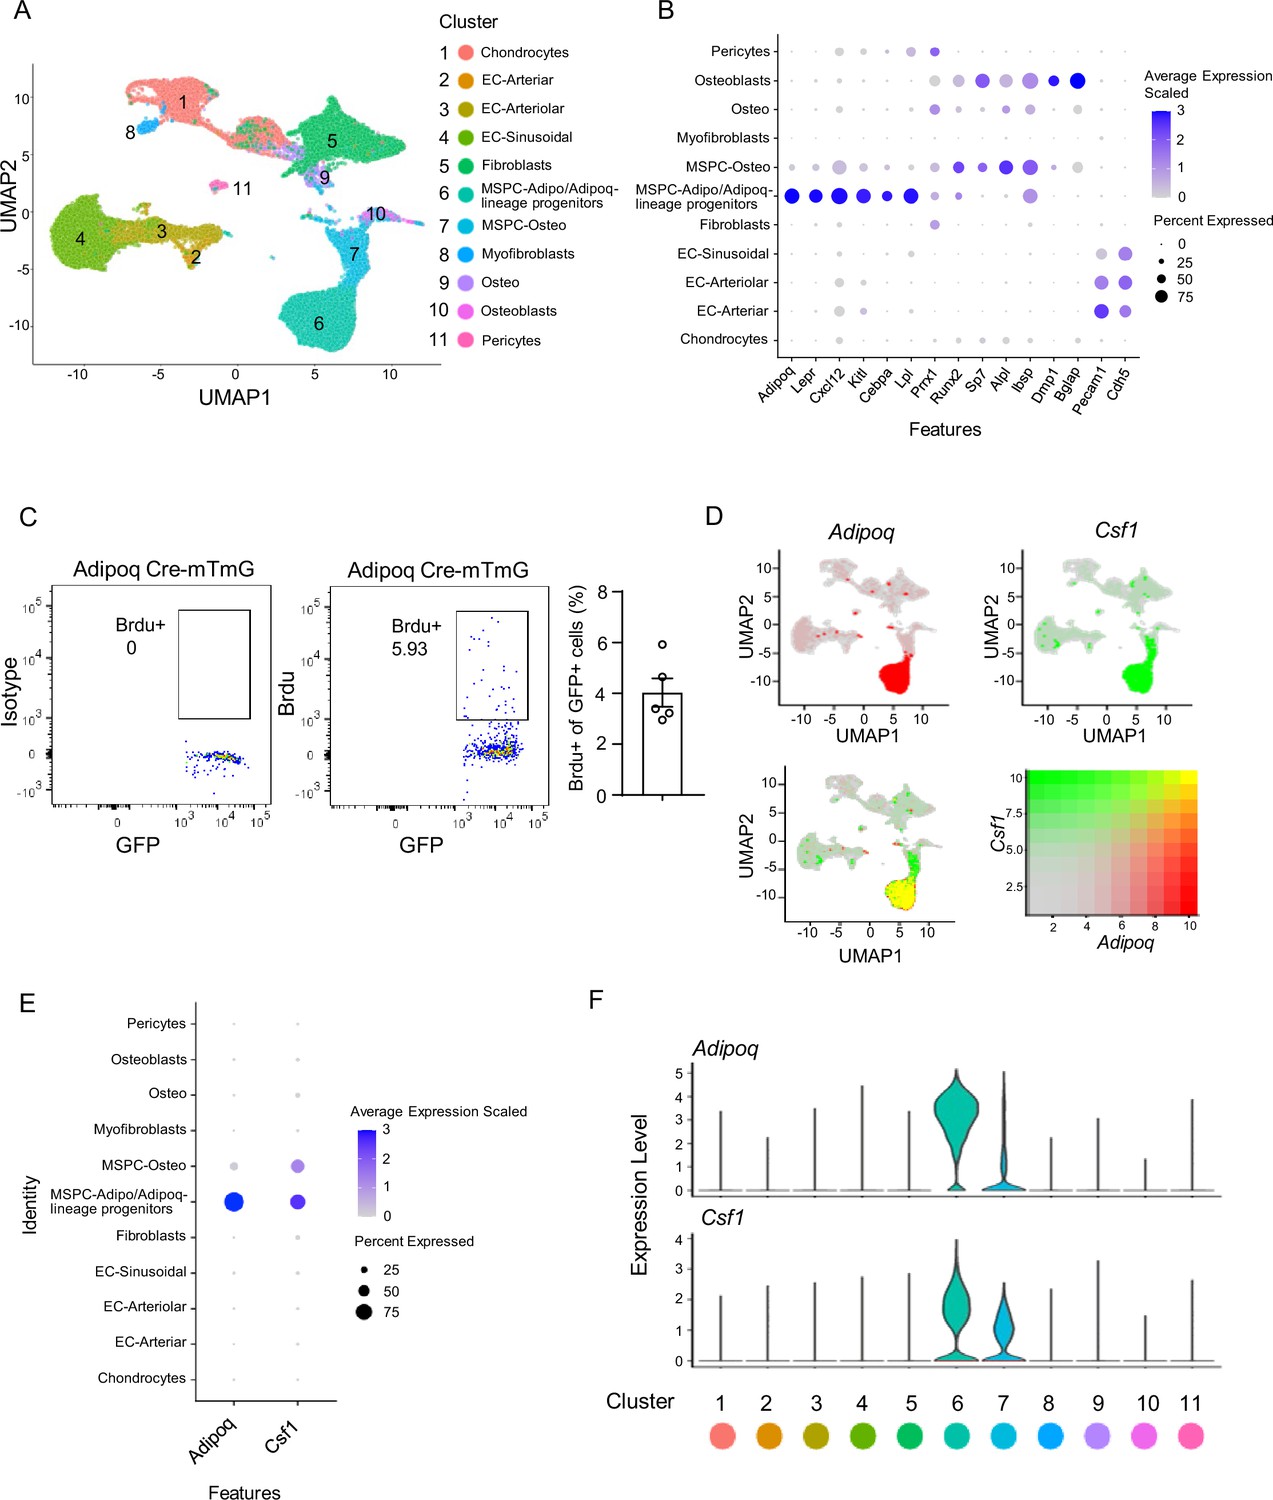
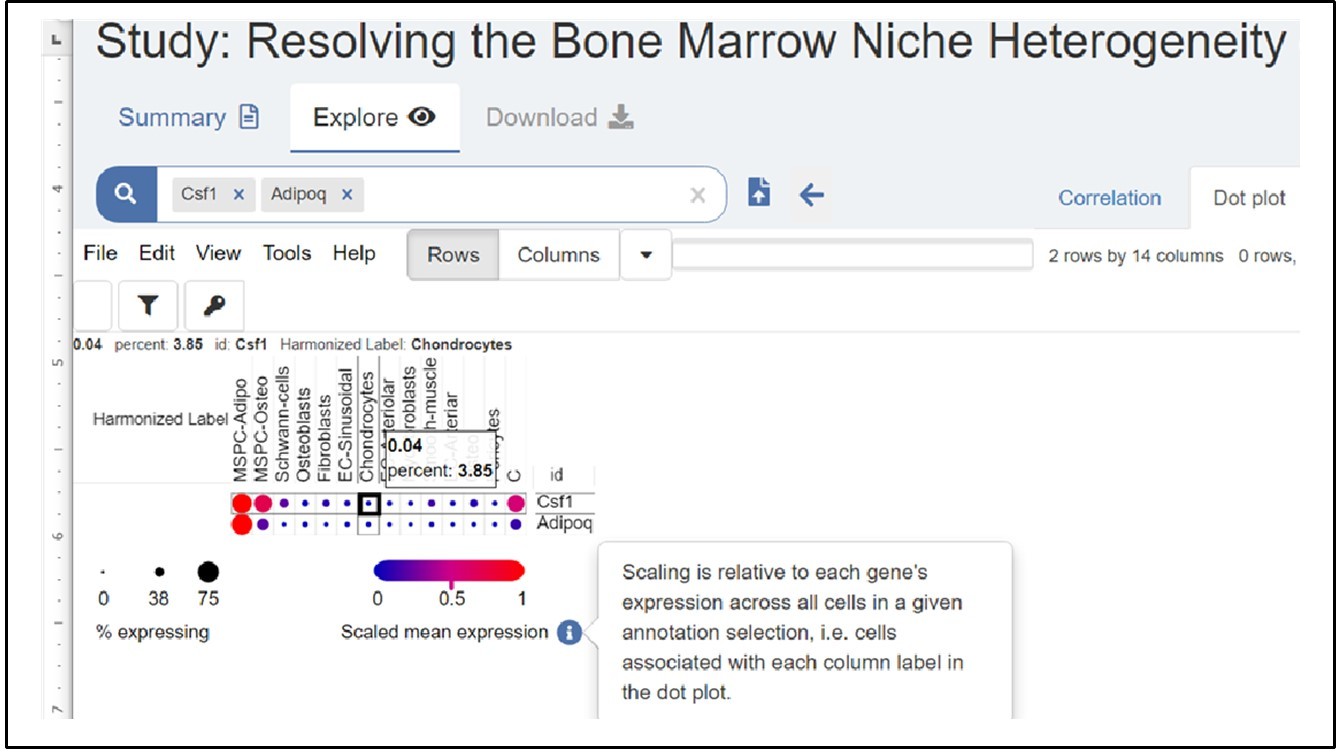
Integrated analysis of the bone marrow niche datasets of scRNAseq shows that Adipoq-lineage progenitors (Adipoq+ MSPCs) express high level of Csf1.
(A) UMAP plot of the integrated analysis of the bone marrow niche datasets of scRNAseq based on Dolgalev and Tikhonova, 2021. EC, endothelial cell; MSPC: mesenchymal progenitor cell. (B) Dot plot of several typical marker gene expression for bone marrow stromal cells, adipocyte lineage, osteoblast lineage and endothelial cells across the listed scRNAseq clusters. Cell clusters are listed on the y-axis. Features are listed along the x-axis. Dot size reflects the percentage of cells in a cluster expressing each gene. Dot color reflects scaled average gene expression level as indicated by the legend. (C) Flowcytometry images and quantification of the bone marrow Adipoq-lineage progenitors (Adipoq+) incorporating BrdU in 10-week-old female Adipoq Cre-mTmG mice. n=5. (D) UMAP plots of the expression of Adipoq (upper left panel), Csf1 (upper right panel) and the co-expression of these two genes (lower left panel) in bone marrow cells. The lower right panel shows a relative expression scale for each gene. (E) Dot plot of Adipoq and Csf1 expression across the listed scRNA-seq clusters. Cell clusters are listed on y-axis. Features are listed along the x-axis. Dot size reflects the percentage of cells in a cluster expressing each gene. Dot color reflects the scaled average gene expression level as indicated by the legend. (F) Violin plots of the expression of Adipoq and Csf1.
-
Figure 1—source data 1
Integrated analysis of the bone marrow niche.
- https://cdn.elifesciences.org/articles/82118/elife-82118-fig1-data1-v2.zip
Figure 2 with 1 supplement
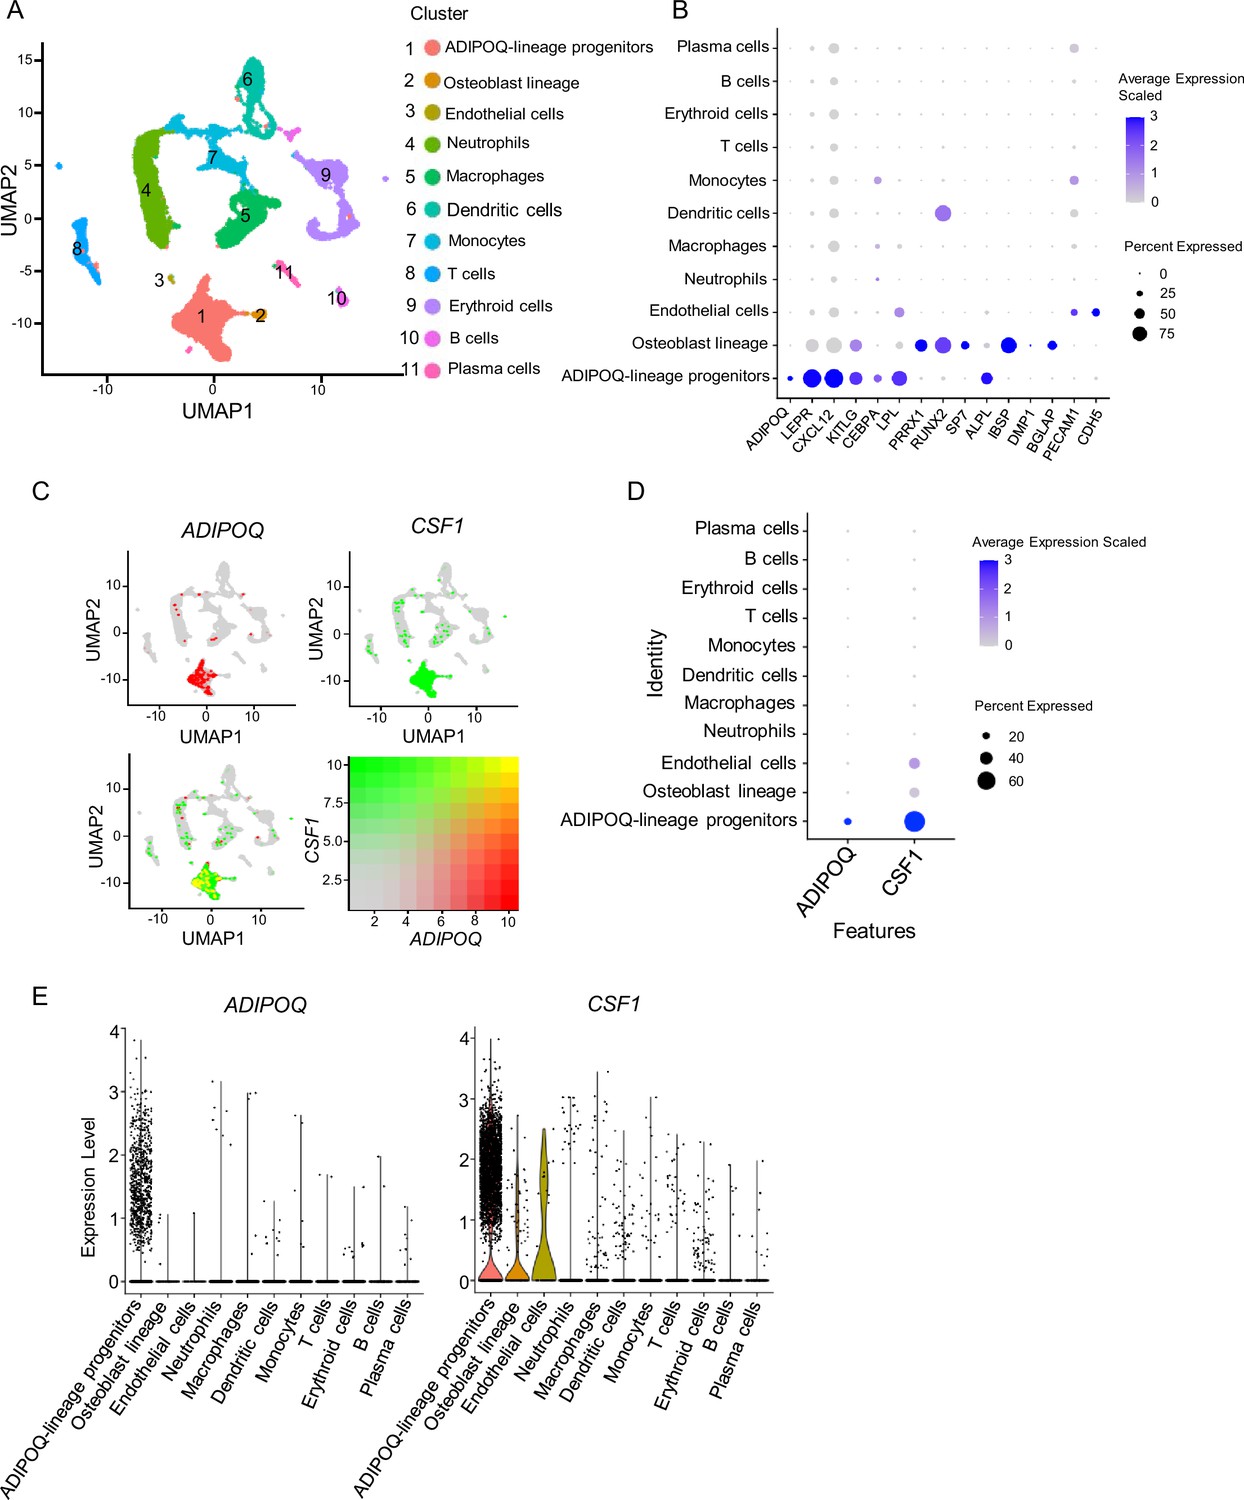
scRNAseq analysis of human bone marrow unveils the existence of ADIPOQ-lineage progenitors highly expressing CSF1.
(A) UMAP plot analysis of the human bone marrow datasets of scRNAseq based on Wang et al., 2021. (B) Dot plot of several typical marker gene expression for bone marrow stromal cells, adipocyte lineage, osteoblast lineage and endothelial cells across the listed scRNA-seq clusters. Cell clusters are listed on the y-axis. Features are listed along the x-axis. Dot size reflects the percentage of cells in a cluster expressing each gene. Dot color reflects scaled average gene expression level as indicated by the legend. (C) UMAP plots of the expression of ADIPOQ (upper left panel), CSF1 (upper right panel) and the co-expression of these two genes (lower left panel) in bone marrow cells. The lower right panel shows a relative expression scale for each gene. (D) Dot plot of ADIPOQ and CSF1 expression across the listed scRNAseq clusters. Cell clusters are listed on y-axis. Features are listed along the x-axis. Dot size reflects the percentage of cells in a cluster expressing each gene. Dot color reflects the scaled average gene expression level as indicated by the legend. (E) Violin plots of the expression of ADIPOQ and CSF1.
-
Figure 2—source data 1
scRNAseq analysis of human bone marrow.
- https://cdn.elifesciences.org/articles/82118/elife-82118-fig2-data1-v2.zip
-
Figure 2—source data 2
Markers for cell type annotation (Baryawno et al., 2019; Baccin et al., 2020; Dolgalev and Tikhonova, 2021; Wang et al., 2021; Komori et al., 1997; Nakashima et al., 2002; Diegel et al., 2020; Wang et al., 2018; Meijer et al., 2012; Bajpai et al., 2018; Fuentes-Duculan et al., 2010; Ippolito et al., 2014; Esashi et al., 2008; Honda et al., 2005; Kapellos et al., 2019; Bian et al., 2020; Mathewson et al., 2021; Shi et al., 2019; Ledergor et al., 2018) in Figure 2.
- https://cdn.elifesciences.org/articles/82118/elife-82118-fig2-data2-v2.zip
Figure 2—figure supplement 1
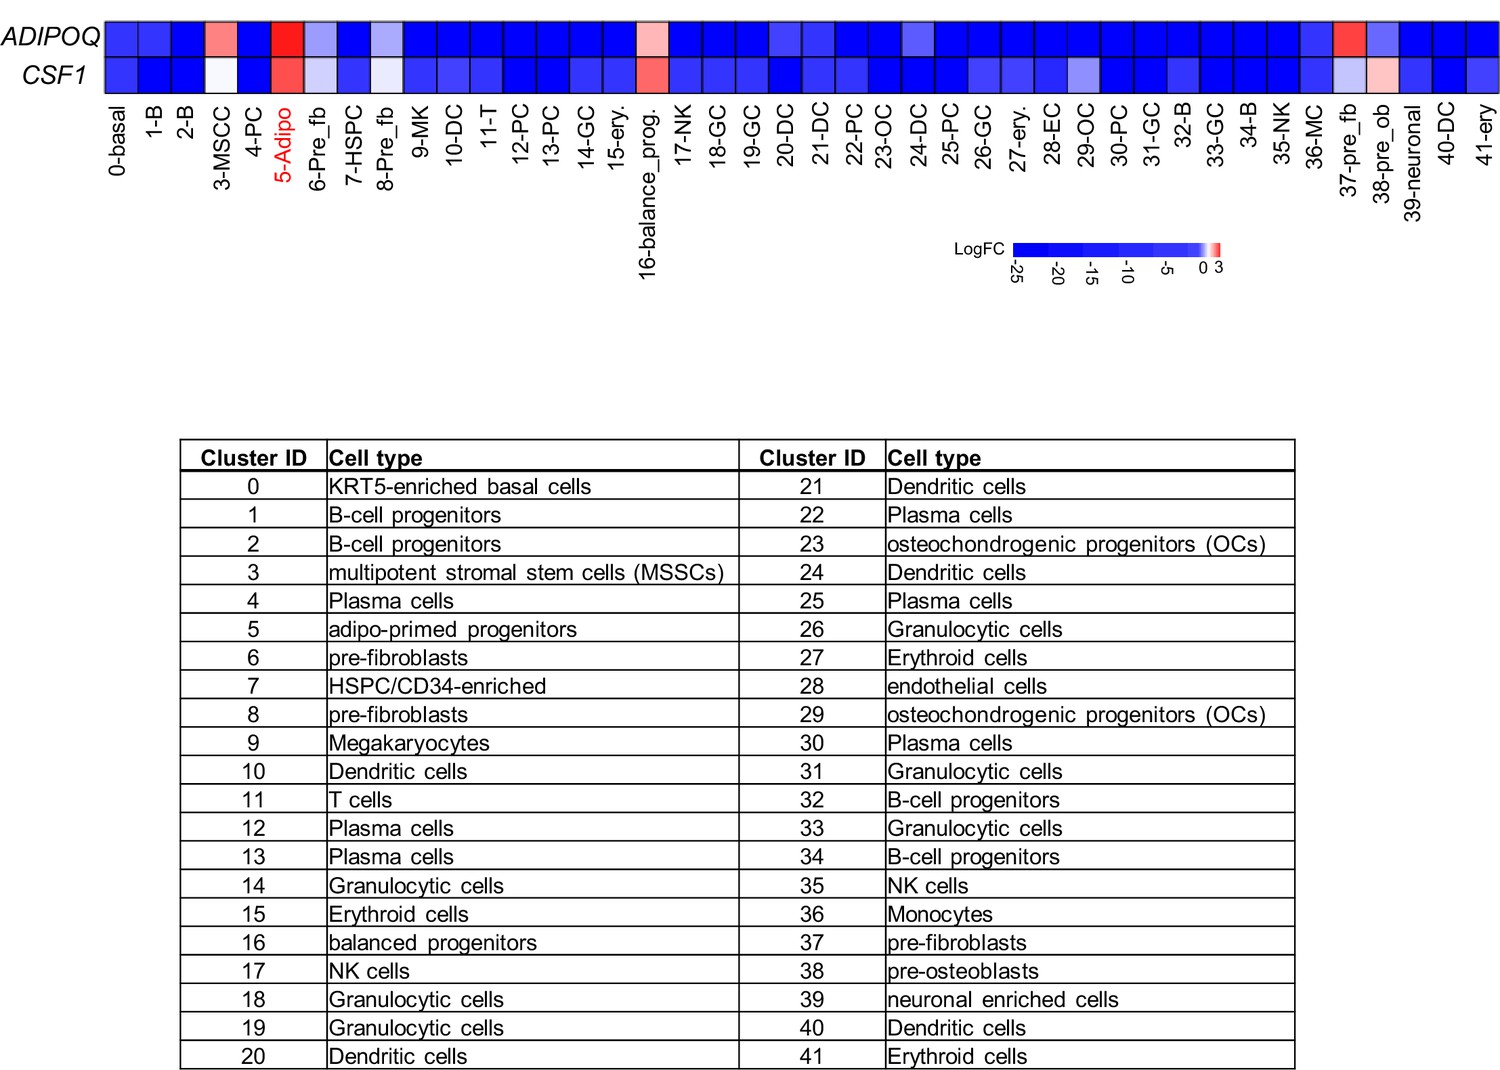
Heatmap of ADIPOQ and CSF1 gene expression by LogFC (fold changes) values across the cell clusters based on human bone marrow scRNAseq dataset (Li et al., 2022).
Figure 3 with 1 supplement
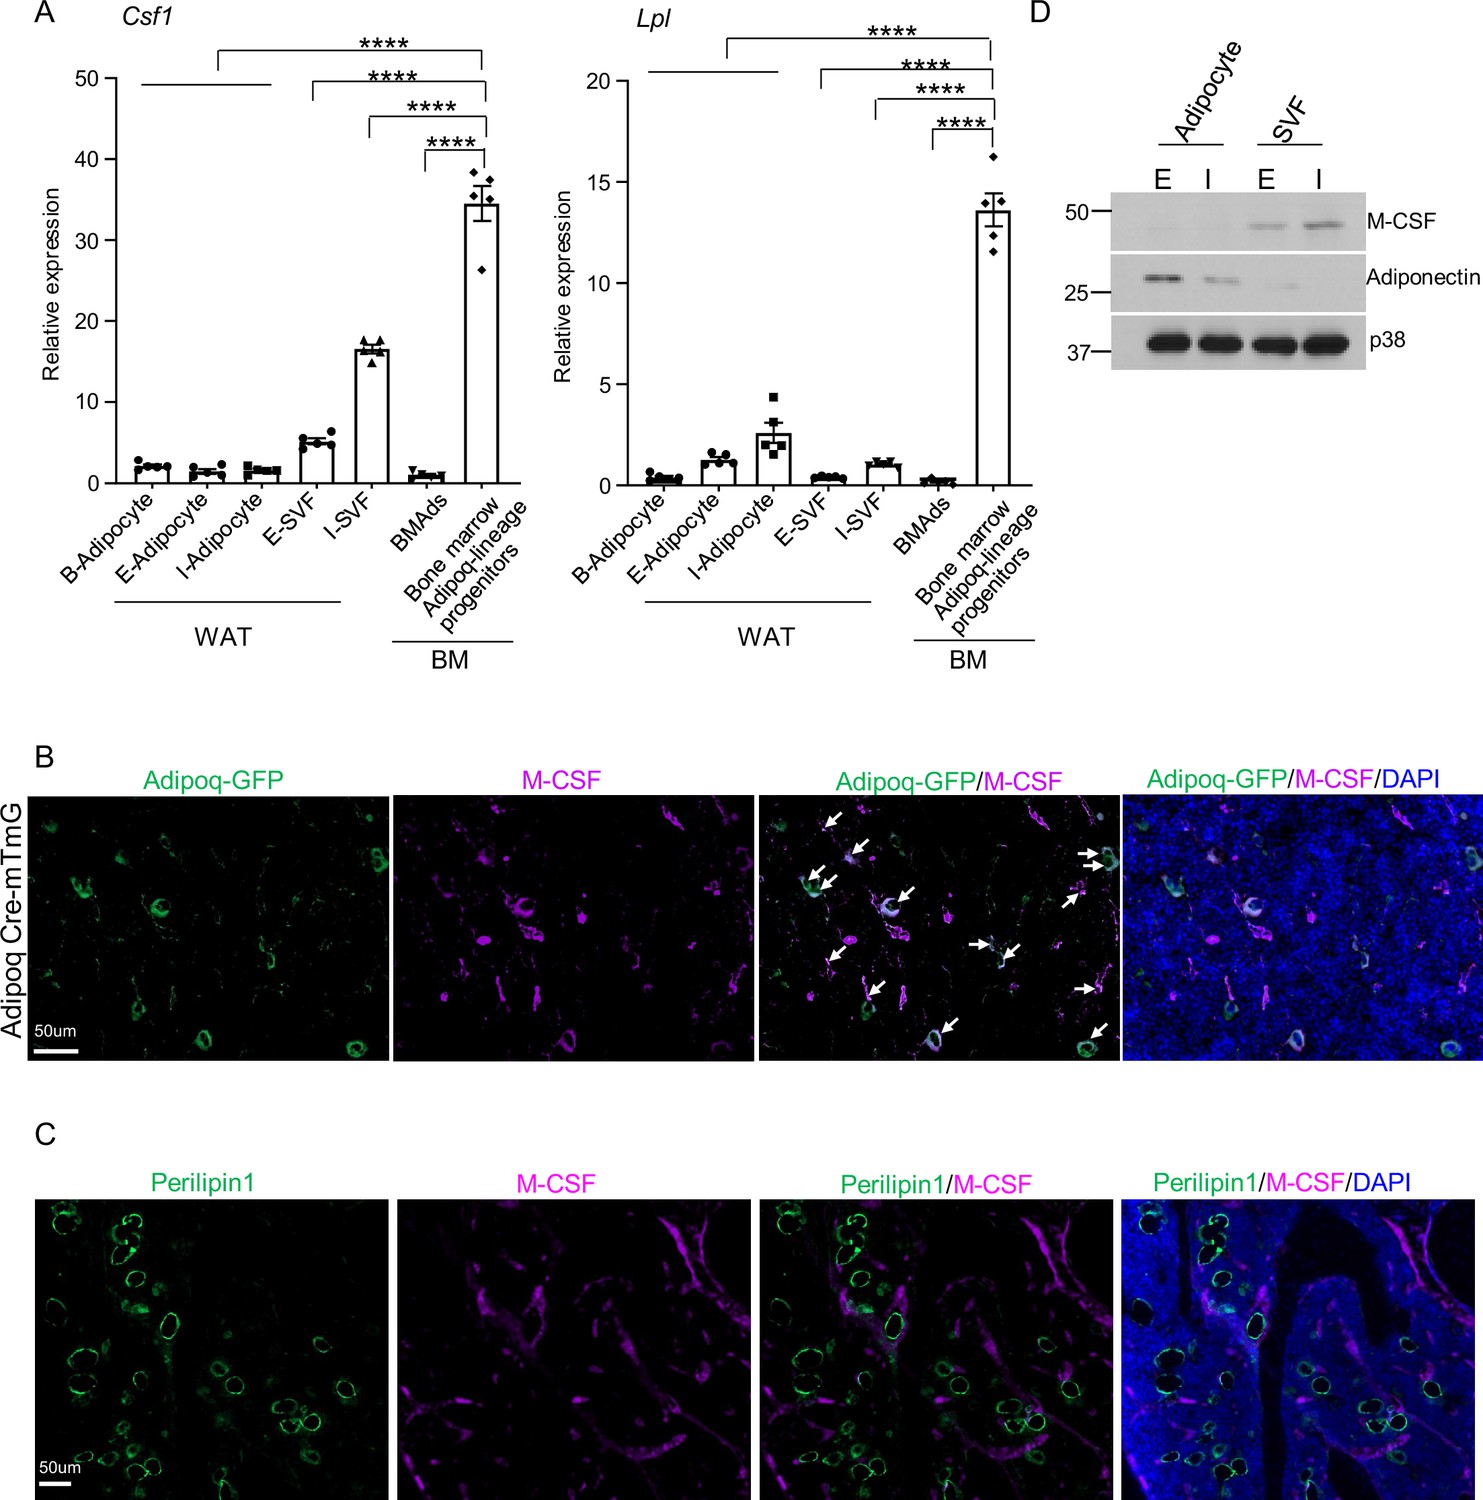
M-CSF is mainly produced by the bone marrow Adipoq-lineage progenitors, but not by mature adipocytes in peripheral adipose or in bone marrow.
(A) qPCR analysis of Csf1 and Lpl expression in bone marrow Adipoq-linage progenitors that were sorted from the bone marrow of Adipoq Cre-mTmG reporter mice, mature bone marrow adipocytes (BMAd), mature peripheral white and brown adipocytes and white stromal vascular fraction (SVF). E-adipocyte: mature adipocytes isolated from the epididymal white adipose tissue. I-adipocyte: mature adipocytes isolated from inguinal white adipose tissue. B-adipocyte: Brown adipocytes. n=5 for E-, I- and B-adipocytes from 12-week-old male mice. Five replicates, each with a pooled sample from 12-week-old male mice for BMAd (6–7 mice) and bone marrow Adipoq-lineage progenitors (3–4 mice). Error bars: Data are mean ± SD. ****p<0.0001 by one-way ANOVA analysis followed by post hoc Bonferroni’s correction for multiple comparisons. (B) Immunofluorescence staining of M-CSF (purple) on femur bone slices from 12-week-old male Adipoq Cre-mTmG reporter mice. DAPI: blue. Arrows: co-localization of M-CSF and Adipoq-GFP in GFP +Adipoq-lineage progenitors. n=3 mice. (C) Immunofluorescence staining of M-CSF (purple) and Perilipin1 (green, mature adipocyte marker) on femur bone slices from 12-week-old male mice. n=3. (D) Immunoblot analysis of M-CSF and Adiponectin expression in mature adipocytes and stromal vascular fraction (SVF) in peripheral adipose. (E) epididymal white adipose tissue. (I) the inguinal white adipose tissue. p38 was used as a loading control.
-
Figure 3—source data 1
M-CSF is mainly produced by the bone marrow Adipoq-lineage progenitors, but not by mature adipocytes in peripheral adipose or in bone marrow.
- https://cdn.elifesciences.org/articles/82118/elife-82118-fig3-data1-v2.zip
Figure 3—figure supplement 1
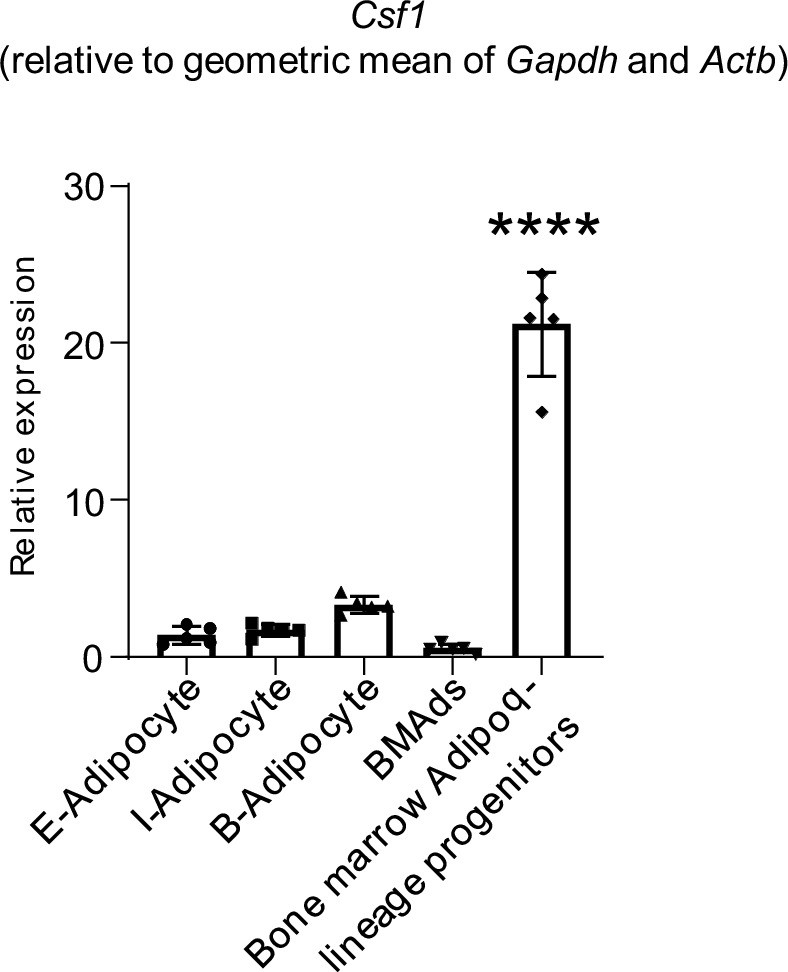
qPCR analysis of Csf1 expression relative to the geometric mean (Vandesompele et al., 2002) of Gapdh and Actb in bone marrow Adipoq-linage progenitors that were sorted from the bone marrow of Adipoq Cre-mTmG reporter mice, mature bone marrow adipocytes (BMAd), mature peripheral white and brown adipocytes.
E-adipocyte: mature adipocytes isolated from the epididymal white adipose tissue. I-adipocyte: mature adipocytes isolated from inguinal white adipose tissue. B-adipocyte: Brown adipocytes. n=5 for E-, I- and B-adipocytes from 12-week-old male mice. Five replicates, each with a pooled sample from 12-week-old male mice for BMAd (6–7 mice) and bone marrow Adipoq-lineage progenitors (3–4 mice). Error bars: Data are mean ± SD. ****p<0.0001.
-
Figure 3—figure supplement 1—source data 1
qPCR analysis of Csf1 expression relative to the geometric mean (Vandesompele et al., 2002) of Gapdh and Actb in bone marrow Adipoq-linage progenitors that were sorted from the bone marrow of Adipoq Cre-mTmG reporter mice, mature bone marrow adipocytes (BMAd), mature peripheral white and brown adipocytes.
- https://cdn.elifesciences.org/articles/82118/elife-82118-fig3-figsupp1-data1-v2.zip
Figure 4 with 6 supplements
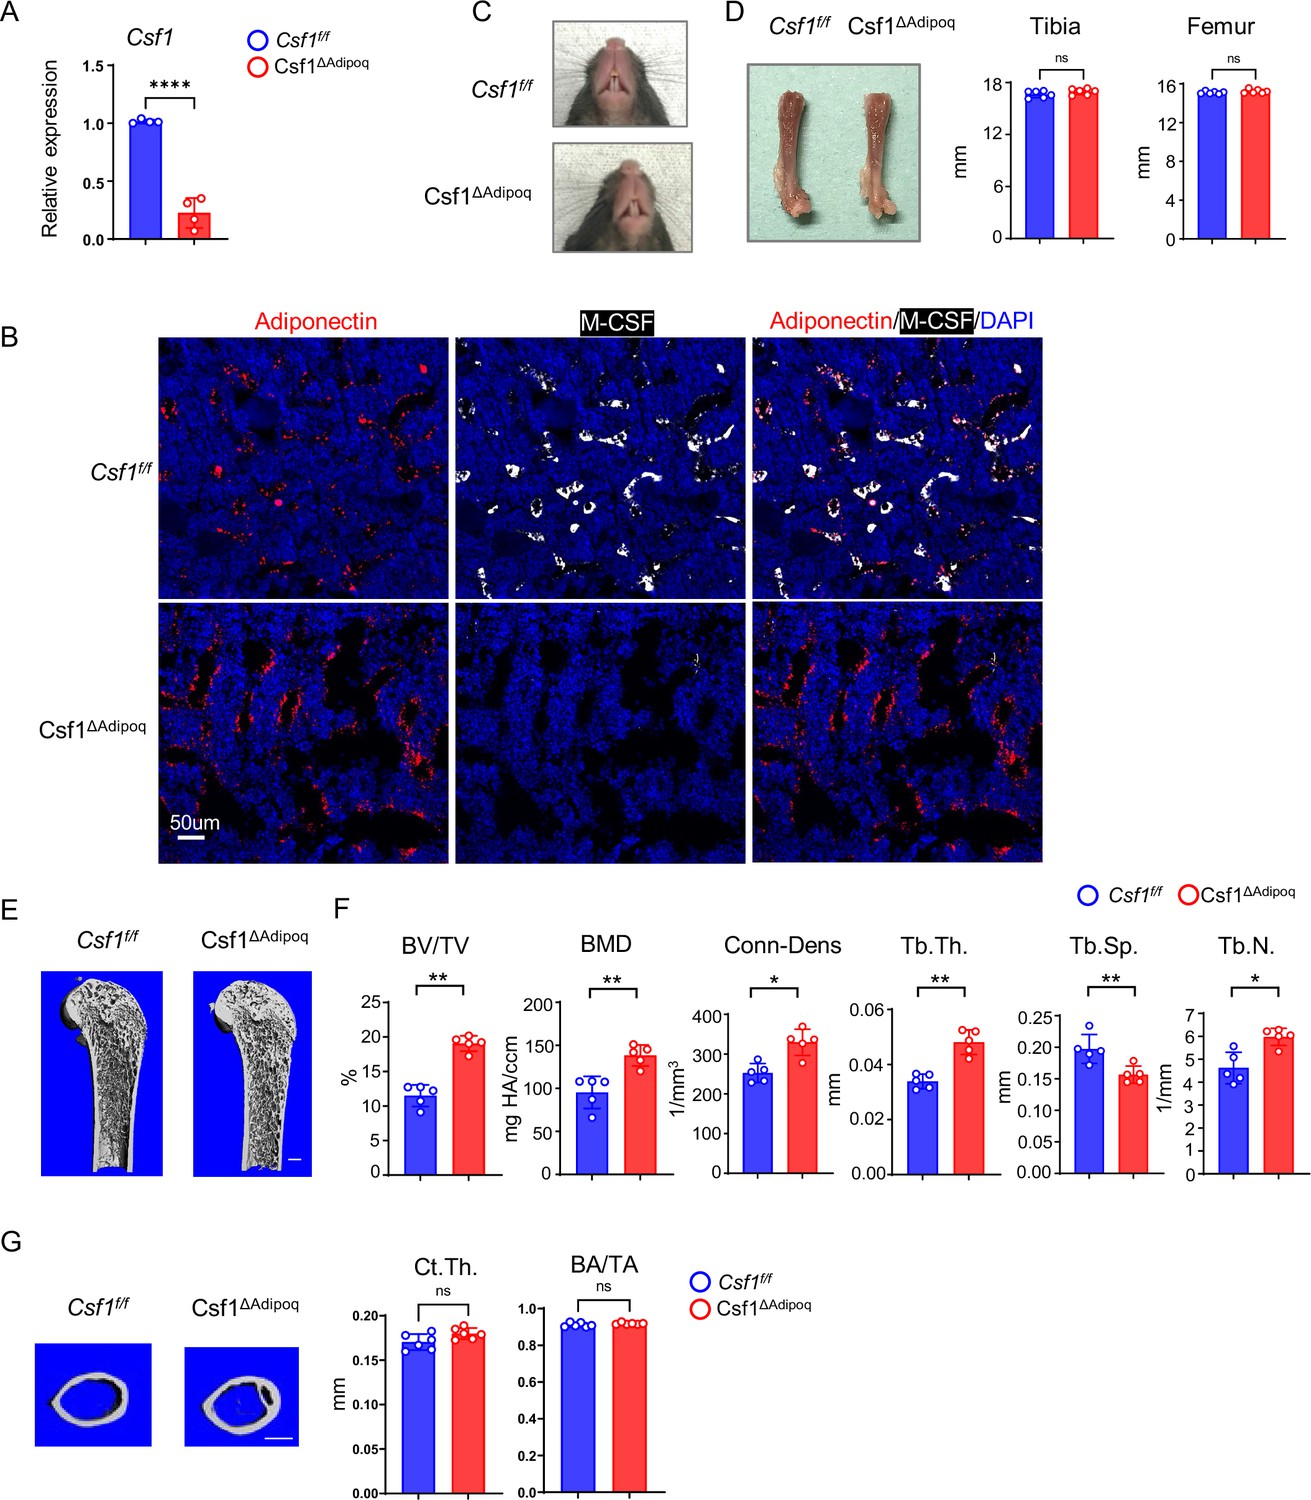
Csf1 deficiency in Csf1ΔAdipoq mice increases bone mass.
(A) Csf1 expression in BMSCs derived from Csf f/f and Csf1ΔAdipoq (n = 4/group). (B) Representative images of immunostaining of Adiponectin (red) and M-CSF (white) on femur bone slices from 12-week-old male Csf f/f and Csf1ΔAdipoq mice. DAPI: blue. n=3/group. (C) Gross appearance of the incisors from Csf f/f and Csf1ΔAdipoq mice. (D) Gross appearance of the femur (left panel), and the lengths of femur and tibia from Csf f/f and Csf1ΔAdipoq mice (right panels) (n = 6/group). (E) μCT images and (F) bone morphometric analysis of trabecular bone of the distal femurs isolated from 12-week-old male Csf f/f and Csf1ΔAdipoq mice (n = 5/group). (G) μCT images and bone morphometric analysis of cortical bone of the mid-shaft femurs isolated from 12-week-old male Csf f/f and Csf1ΔAdipoq mice (n = 5/group). BM, bone marrow; BMSC, bone marrow stromal cell; BV/TV, bone volume per tissue volume; BMD, bone mineral density; Conn-Dens, connectivity density; Tb.Th, trabecular thickness; Tb.Sp, trabecular separation; Tb.N, trabecular number. Ct.Th, cortical bone thickness; BA/TA: Bone area/Tissue area. A, D, F, G *p<0.05; **p<0.01; ***p<0.001; ****p<0.0001; ns: not statistically significant by two tailed unpaired Student’s t test. Error bars: Data are mean ± SD. Scale bars: B, 50 µm; E, 500 µm; G, 500 μm.
-
Figure 4—source data 1
Csf1 deficiency in Csf1ΔAdipoq mice increases bone mass.
- https://cdn.elifesciences.org/articles/82118/elife-82118-fig4-data1-v2.zip
Figure 4—figure supplement 1
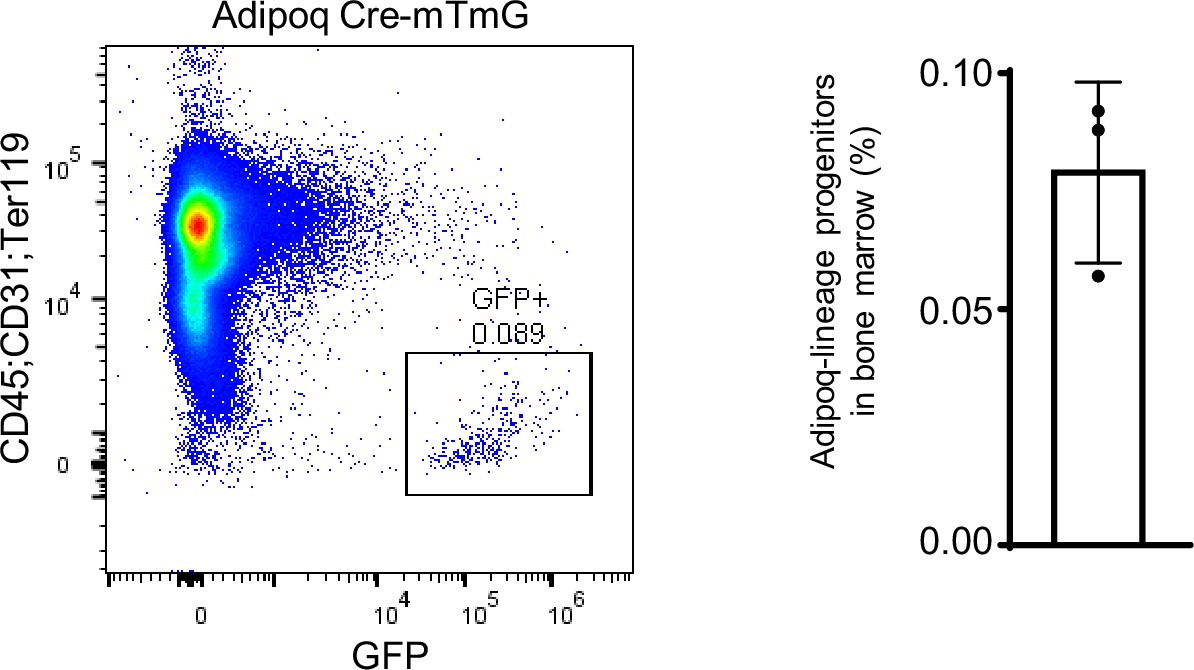
The flowcytometry images (left) and the percentage (right) of Adipoq-lineage progenitors (GFP+) in bone marrow (without red blood cells) from 12-week-old male mice.
n=3. Data are mean ± SD.
-
Figure 4—figure supplement 1—source data 1
The percentage of Adipoq-lineage progenitors (GFP+) in bone marrow (without red blood cells).
- https://cdn.elifesciences.org/articles/82118/elife-82118-fig4-figsupp1-data1-v2.xlsx
Figure 4—figure supplement 2
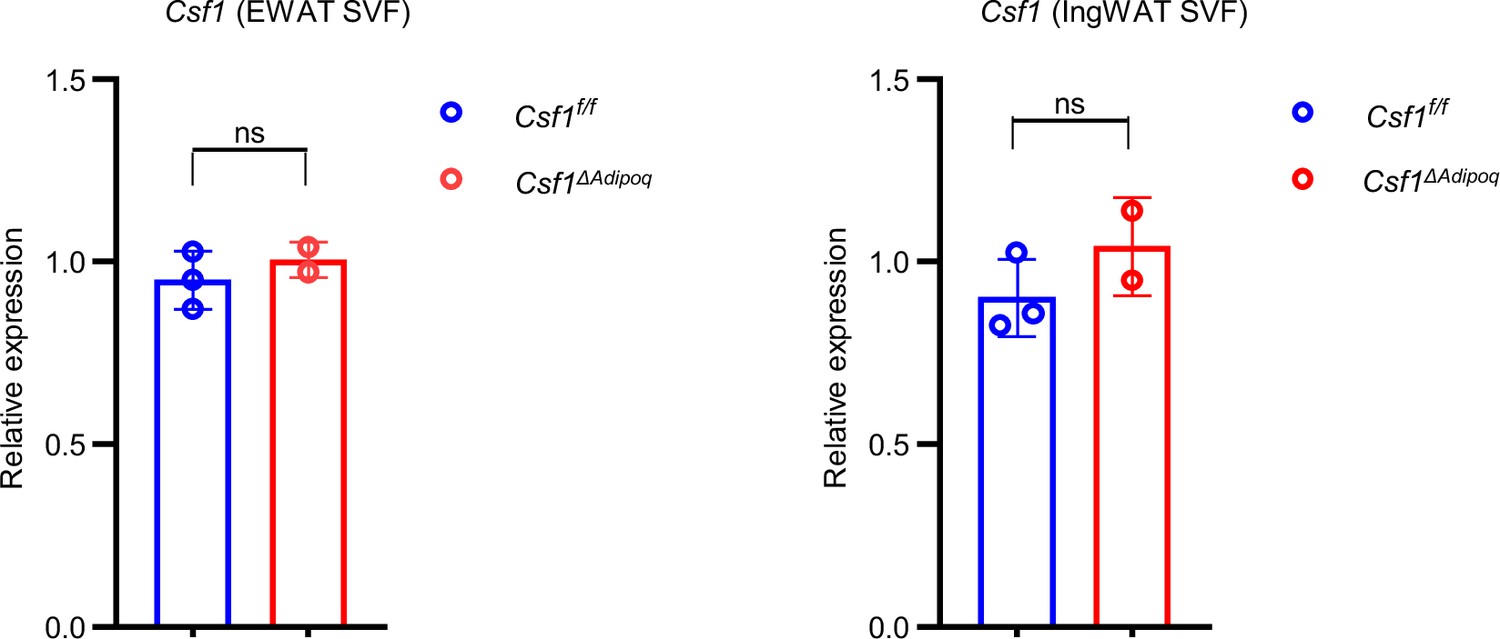
qPCR analysis of Csf1 expression in SVF from 12-week-old male Csf f/f and Csf1ΔAdipoq mice (n = 3 for Csf f/f and n=2 for Csf1ΔAdipoq mice).
-
Figure 4—figure supplement 2—source data 1
qPCR analysis of Csf1 expression in SVF.
- https://cdn.elifesciences.org/articles/82118/elife-82118-fig4-figsupp2-data1-v2.xlsx
Figure 4—figure supplement 3
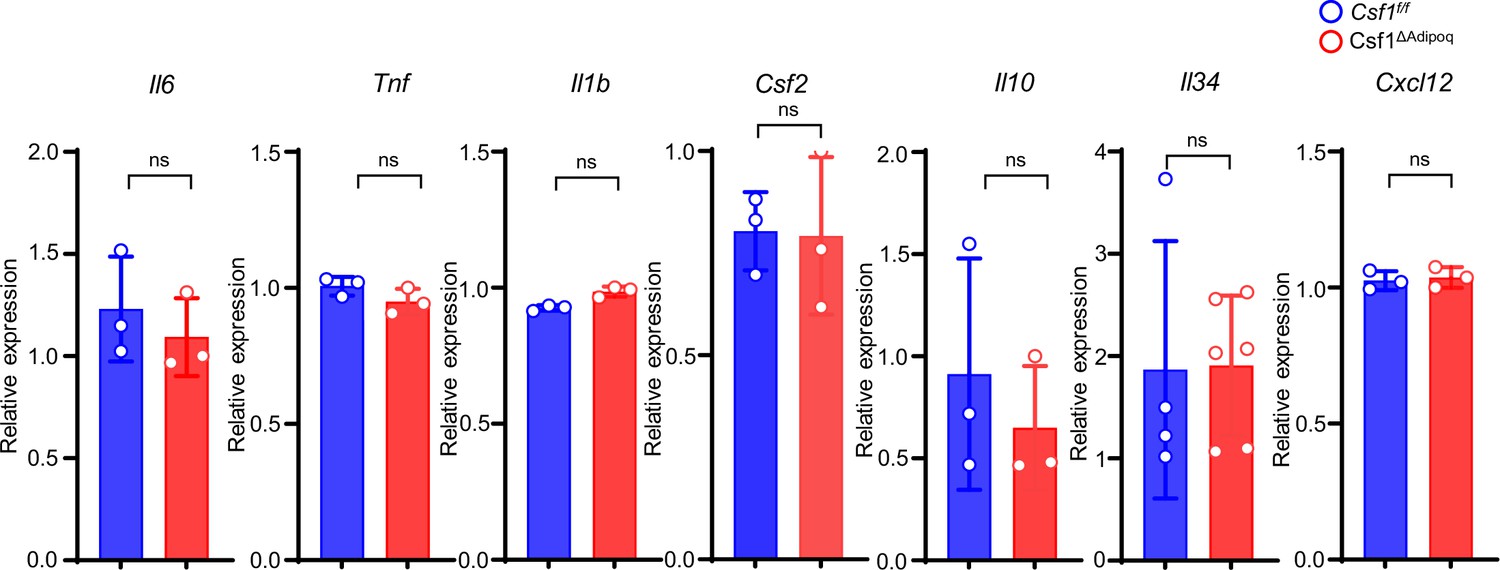
qPCR analysis of cytokines expressed in bone barrow from 12-week-old male Csf f/f and Csf1ΔAdipoq mice (n = 3/group; For Il34, Csf f/f n=4, Csf1ΔAdipoq n=6).
-
Figure 4—figure supplement 3—source data 1
qPCR analysis of cytokines expressed in bone barrow.
- https://cdn.elifesciences.org/articles/82118/elife-82118-fig4-figsupp3-data1-v2.xlsx
Figure 4—figure supplement 4
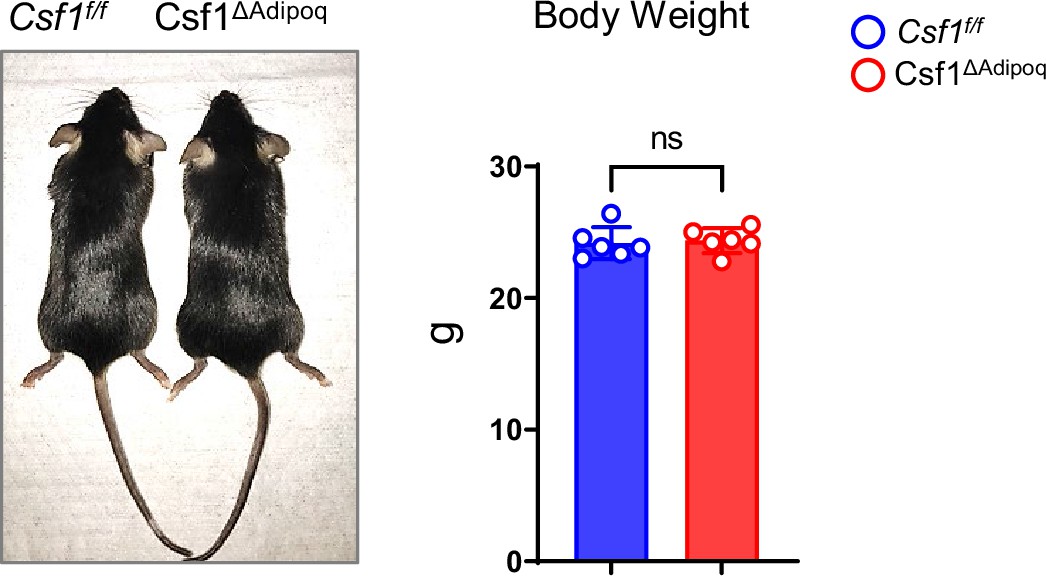
Gross appearance and body weight of 12-week-old male Csf f/f and Csf1ΔAdipoq mice (n = 6/group).
ns: not statistically significant by two tailed unpaired Student’s t test. Data are mean ± SD.
-
Figure 4—figure supplement 4—source data 1
Body weight of 12-week-old male Csf f/f and Csf1ΔAdipoq mice.
- https://cdn.elifesciences.org/articles/82118/elife-82118-fig4-figsupp4-data1-v2.xlsx
Figure 4—figure supplement 5
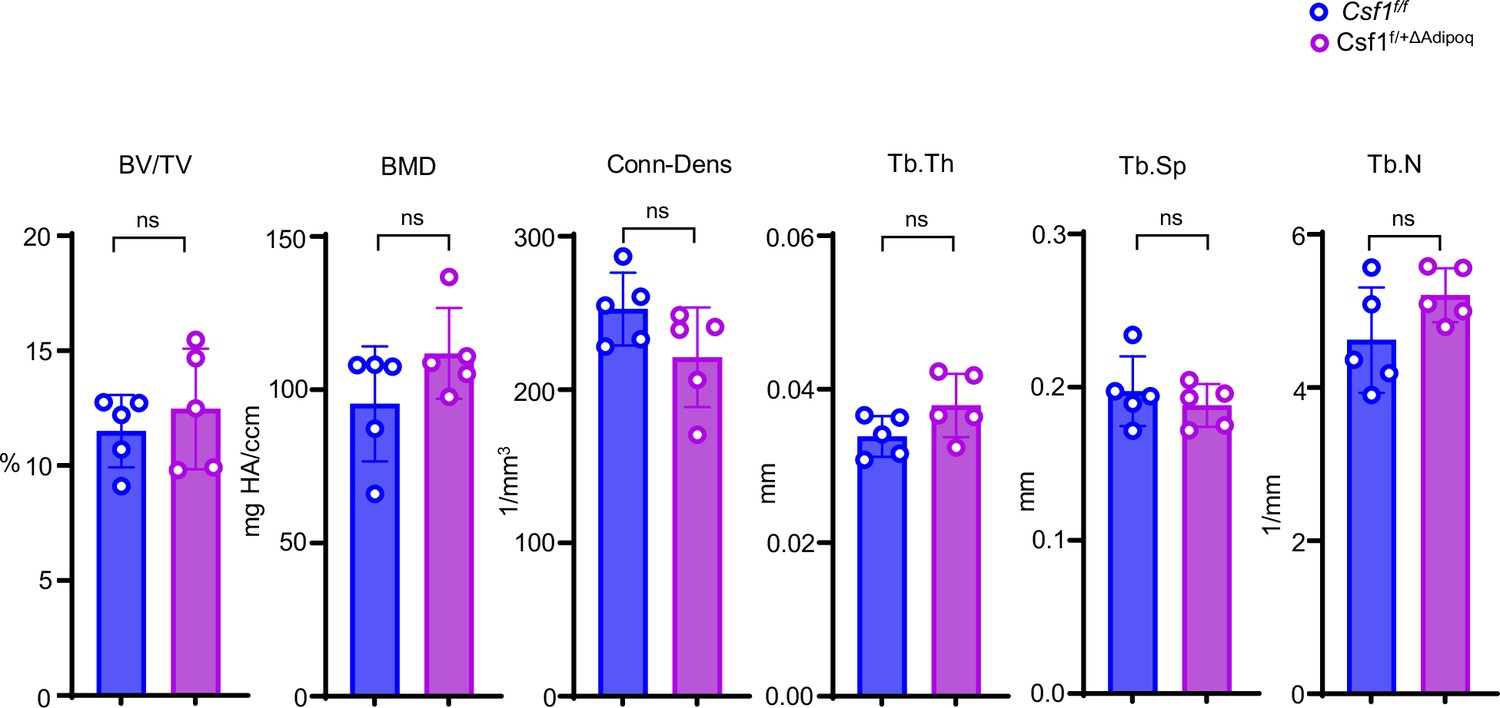
Bone morphometric analysis of trabecular bone of the distal femurs isolated from 12-week-old male Csf f/f and Csf1f/+ΔAdipoq mice (n = 5/group).
BV/TV, bone volume per tissue volume; BMD, bone mineral density; Tb.N, trabecular number; Tb.Th, trabecular thickness; Tb.Sp, trabecular separation; Conn-Dens., connectivity density. Data are mean ± SD. n.s., not statistically significant by two tailed unpaired Student’s t test analysis.
-
Figure 4—figure supplement 5—source data 1
Bone morphometric analysis of trabecular bone of distal femurs.
- https://cdn.elifesciences.org/articles/82118/elife-82118-fig4-figsupp5-data1-v2.xlsx
Figure 4—figure supplement 6
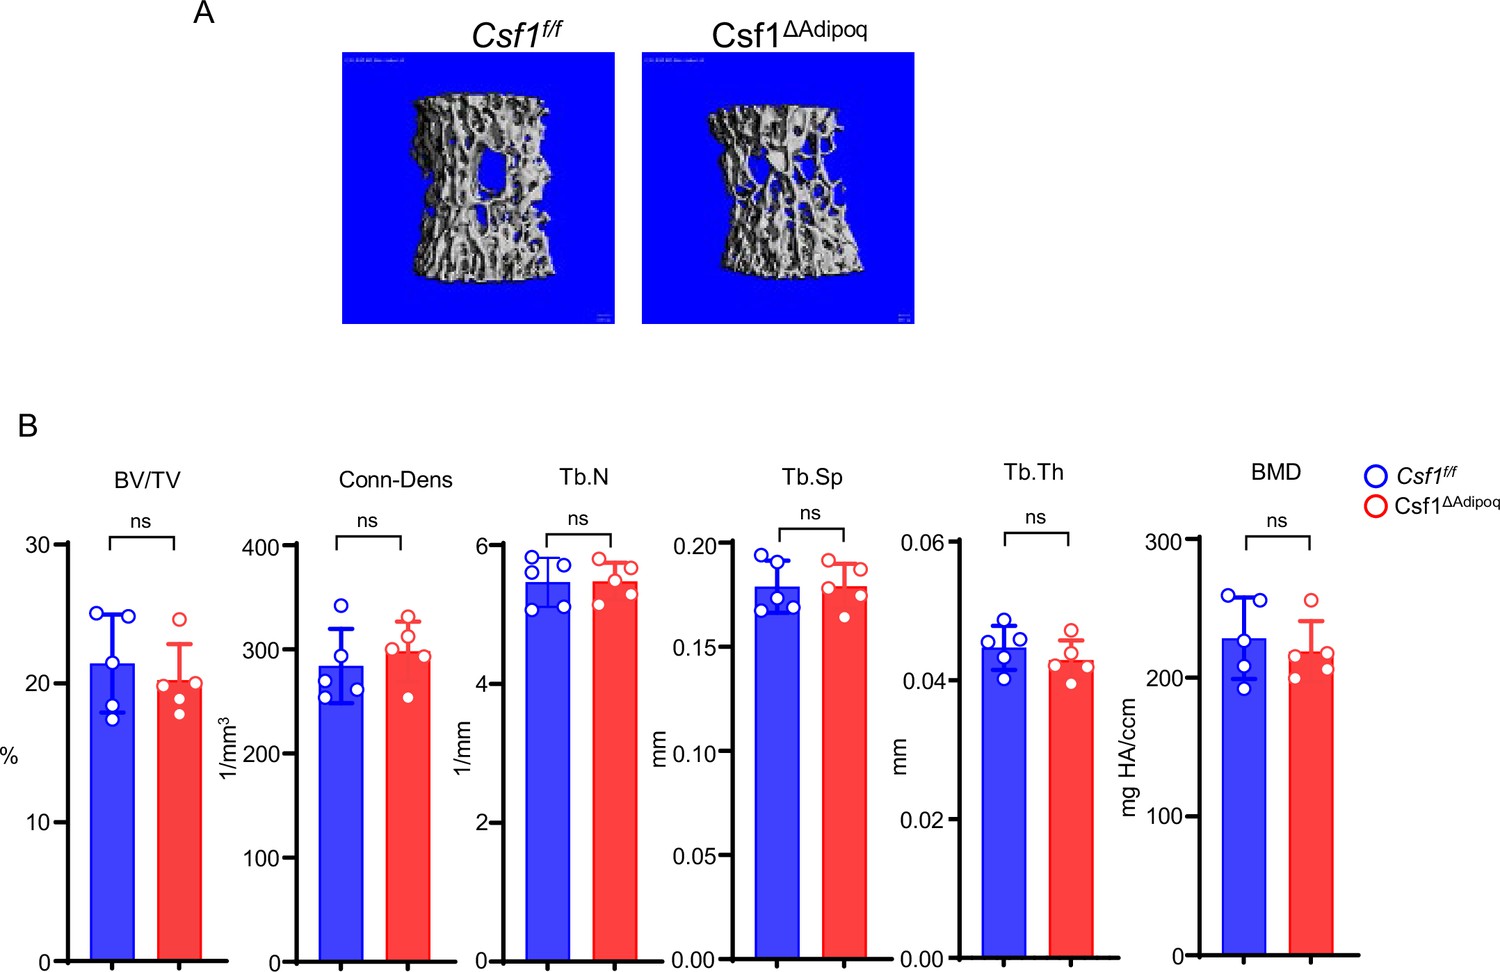
μCT images (A) and bone morphometric analysis (B) of lumbar vertebrae (L5) isolated from 12-week-old male Csf f/f and Csf1ΔAdipoq mice (n = 5/group).
BV/TV, bone volume per tissue volume; BMD, bone mineral density; Tb.N, trabecular number; Tb.Th, trabecular thickness; Tb.Sp, trabecular separation; Conn-Dens., connectivity density. Data are mean ± SD. n.s., not statistically significant by two tailed unpaired Student’s t test analysis.
-
Figure 4—figure supplement 6—source data 1
Bone morphometric analysis of lumbar vertebrae (L5).
- https://cdn.elifesciences.org/articles/82118/elife-82118-fig4-figsupp6-data1-v2.xlsx
Figure 5 with 2 supplements

Csf1 deficiency in Csf1ΔAdipoq mice suppresses the populations of bone marrow macrophages and osteoclasts.
(A) TRAP staining and histomorphometric analysis of histological sections obtained from the metaphysis region of distal femurs of 12-week-old male Csf f/f and Csf1ΔAdipoq mice (n = 5/group). (B) ELISA analysis of serum TRAP levels in 12-week-old male Csf f/f and Csf1ΔAdipoq mice (n = 6/group). (C) Flowcytometry image (left) and quantification (right) of monocytes and macrophages in bone marrow. n=6/group. (D, E) Osteoclast differentiation directly from the cultures of bone marrows harvested from Csf f/f and Csf1ΔAdipoq mice stimulated with RANKL (40 ng/ml) but without recombinant M-CSF for ten days (D) or with both RANKL and recombinant M-CSF (20 ng/ml) for five days (E). TRAP staining (left panel) was performed and the area of TRAP-positive MNCs (≥3 nuclei/cell) per well was calculated (right panel). TRAP-positive cells appear red in the photographs. (n = 3/group). Oc.S/BS, osteoclast surface per bone surface; N.Oc/B.Pm, number of osteoclasts per bone perimeter. (A, B), C, D, E **p<0.01; ***p<0.001; ****p<0.0001; ns: not statistically significant by two tailed unpaired Student’s t test. Error bars: Data are mean ± SD. Scale bars: A, 100 µm; D, E, 200 µm.
-
Figure 5—source data 1
Csf1 deficiency in Csf1ΔAdipoq mice suppresses the populations of bone marrow macrophages and osteoclasts.
- https://cdn.elifesciences.org/articles/82118/elife-82118-fig5-data1-v2.zip
Figure 5—figure supplement 1
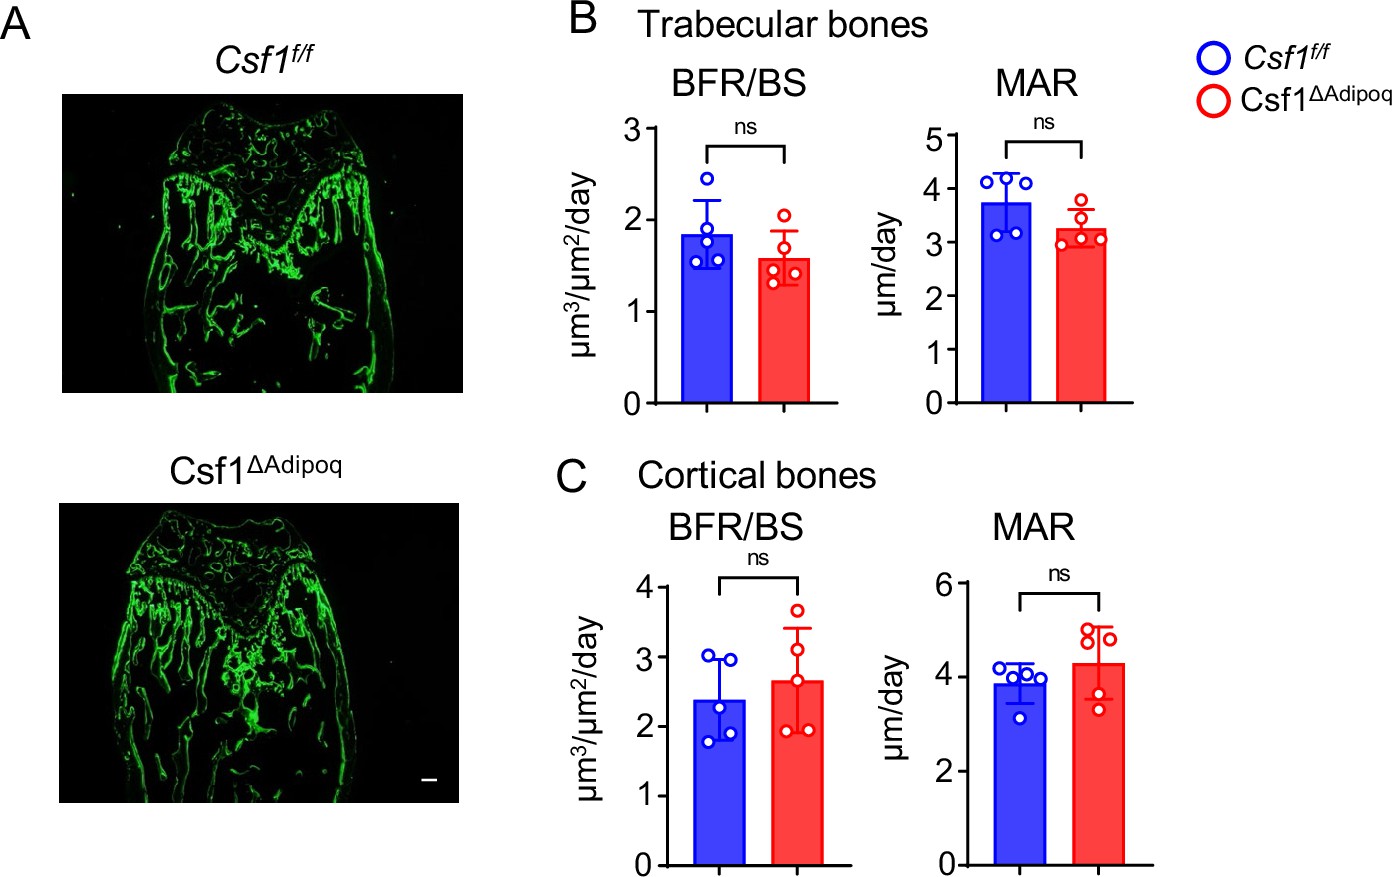
Osteoblastic function in Csf1ΔAdipoq mice is normal.
(A) Images of calcein double labelling of the femur of 12-week-old male Csf f/f and Csf1ΔAdipoq mice. Dynamic histomorphometric analysis of trabecular bones (B) and cortical bones (C) of femurs isolated from 12-week-old male Csf f/f and Csf1ΔAdipoq mice (n = 5/group). BFR/BS, bone formation rate per bone surface; MAR, mineral apposition rate. Data are mean ± SD. ns: not statistically significant by two-tailed unpaired Student’s t test. Scale bars: A, 100 µm.
-
Figure 5—figure supplement 1—source data 1
Dynamic histomorphometric analysis of trabecular bones (B) and cortical bones (C) of femurs.
- https://cdn.elifesciences.org/articles/82118/elife-82118-fig5-figsupp1-data1-v2.xlsx
Figure 5—figure supplement 2
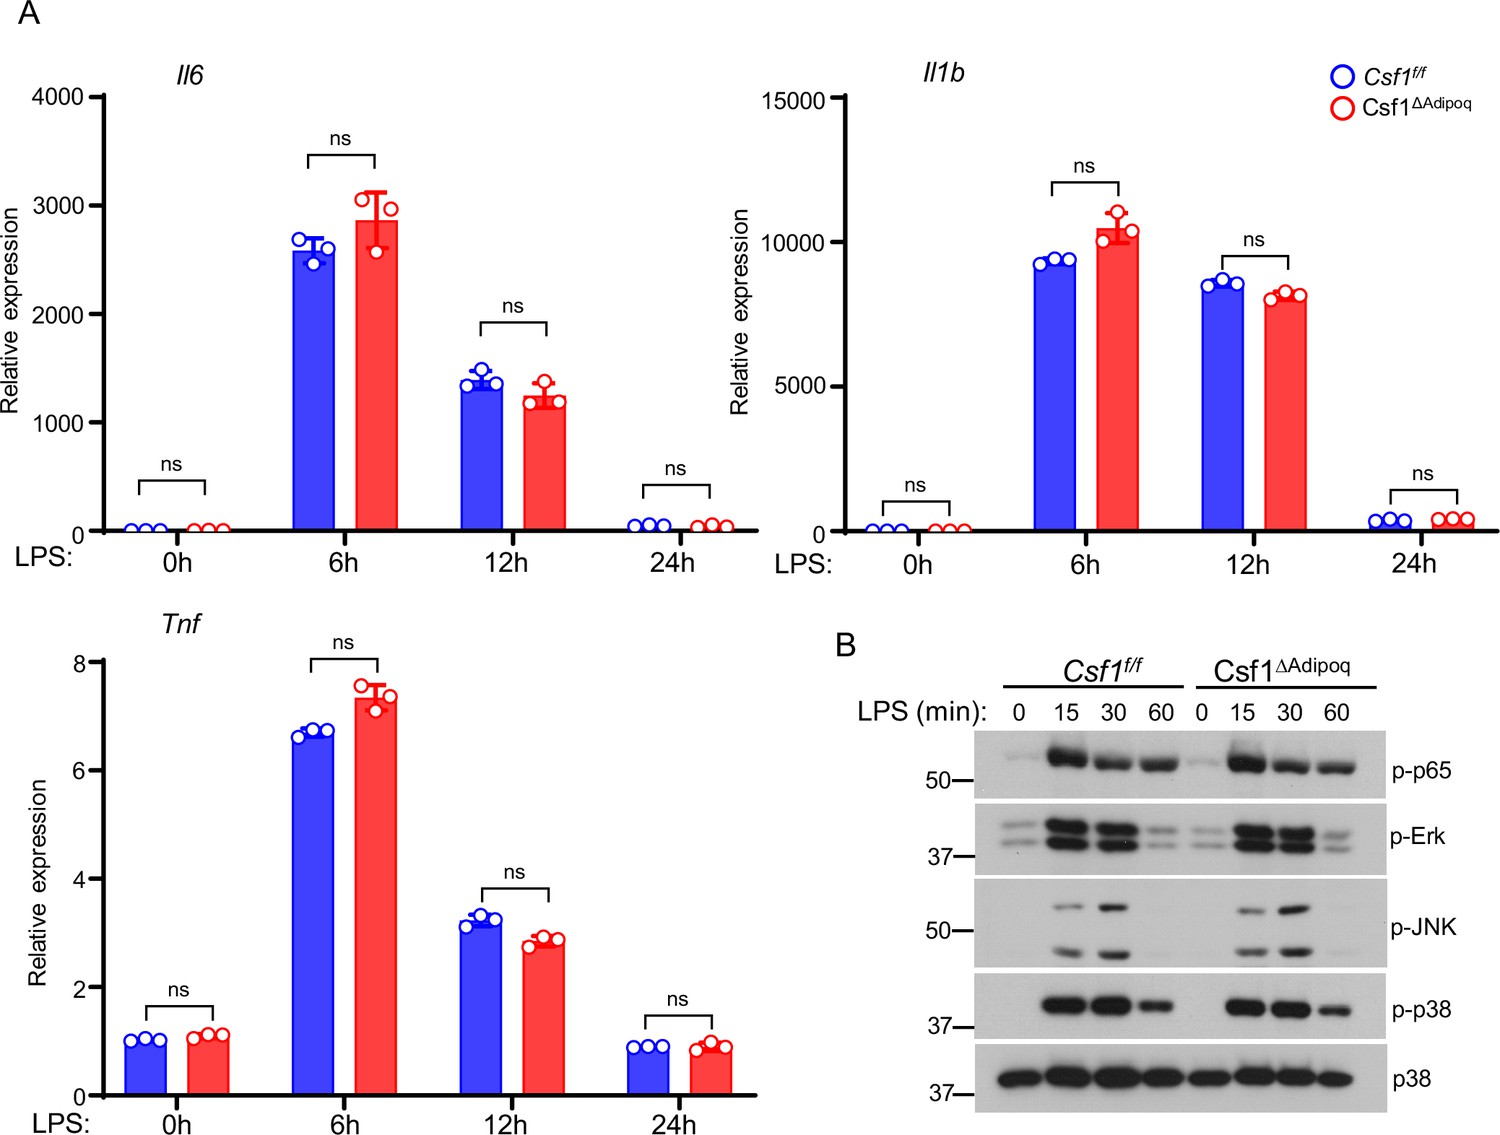
Inflammatory response to LPS is not altered in Csf1ΔAdipoq BMMs.
(A) qPCR analysis of inflammatory gene expression and (B) Immunoblot analysis of the activation of signaling pathways in response to LPS stimulation (10 ng/ml) in BMMs derived from the Csf f/f and Csf1ΔAdipoq mice. Data are mean ± SD. ns: not statistically significant by two-way ANOVA.
-
Figure 5—figure supplement 2—source data 1
(A) qPCR analysis of inflammatory gene expression and (B) Immunoblot analysis of the activation of signaling pathways in response to LPS stimulation (10 ng/ml) in BMMs.
- https://cdn.elifesciences.org/articles/82118/elife-82118-fig5-figsupp2-data1-v2.xlsx
Figure 6
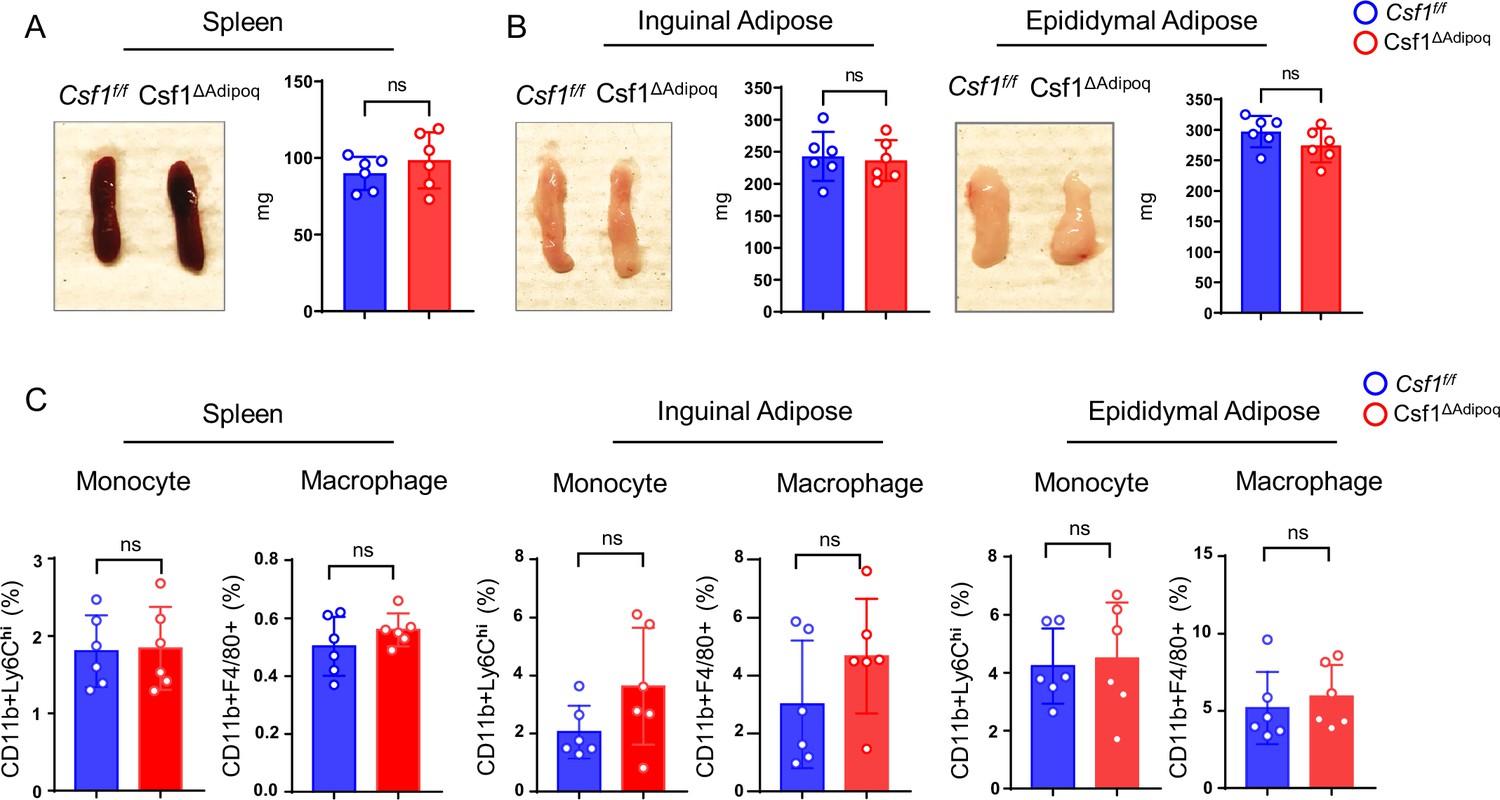
Csf1 deficiency in Csf1ΔAdipoq mice does not affect monocyte and macrophage populations in spleen and peripheral adiposes.
(A) Gross appearance (left panel) and weight (right panel) of the spleen from Csf f/f and Csf1ΔAdipoq mice (n = 6/group). (B) Gross appearance and weight of the inguinal (left panels) and the epididymal (right panels) adipose from Csf f/f and Csf1ΔAdipoq mice (n = 6/group). (C) Flowcytometry quantification of monocytes and macrophages (gated on CD45 +Ly6G- cells) in the indicated tissues. n=6/group. (A, B, C) ns: not statistically significant by two tailed unpaired Student’s t test. Error bars: Data are mean ± SD.
-
Figure 6—source data 1
Csf1 deficiency in Csf1ΔAdipoq mice does not affect monocyte and macrophage populations in spleen and peripheral adiposes.
- https://cdn.elifesciences.org/articles/82118/elife-82118-fig6-data1-v2.zip
Figure 7 with 1 supplement
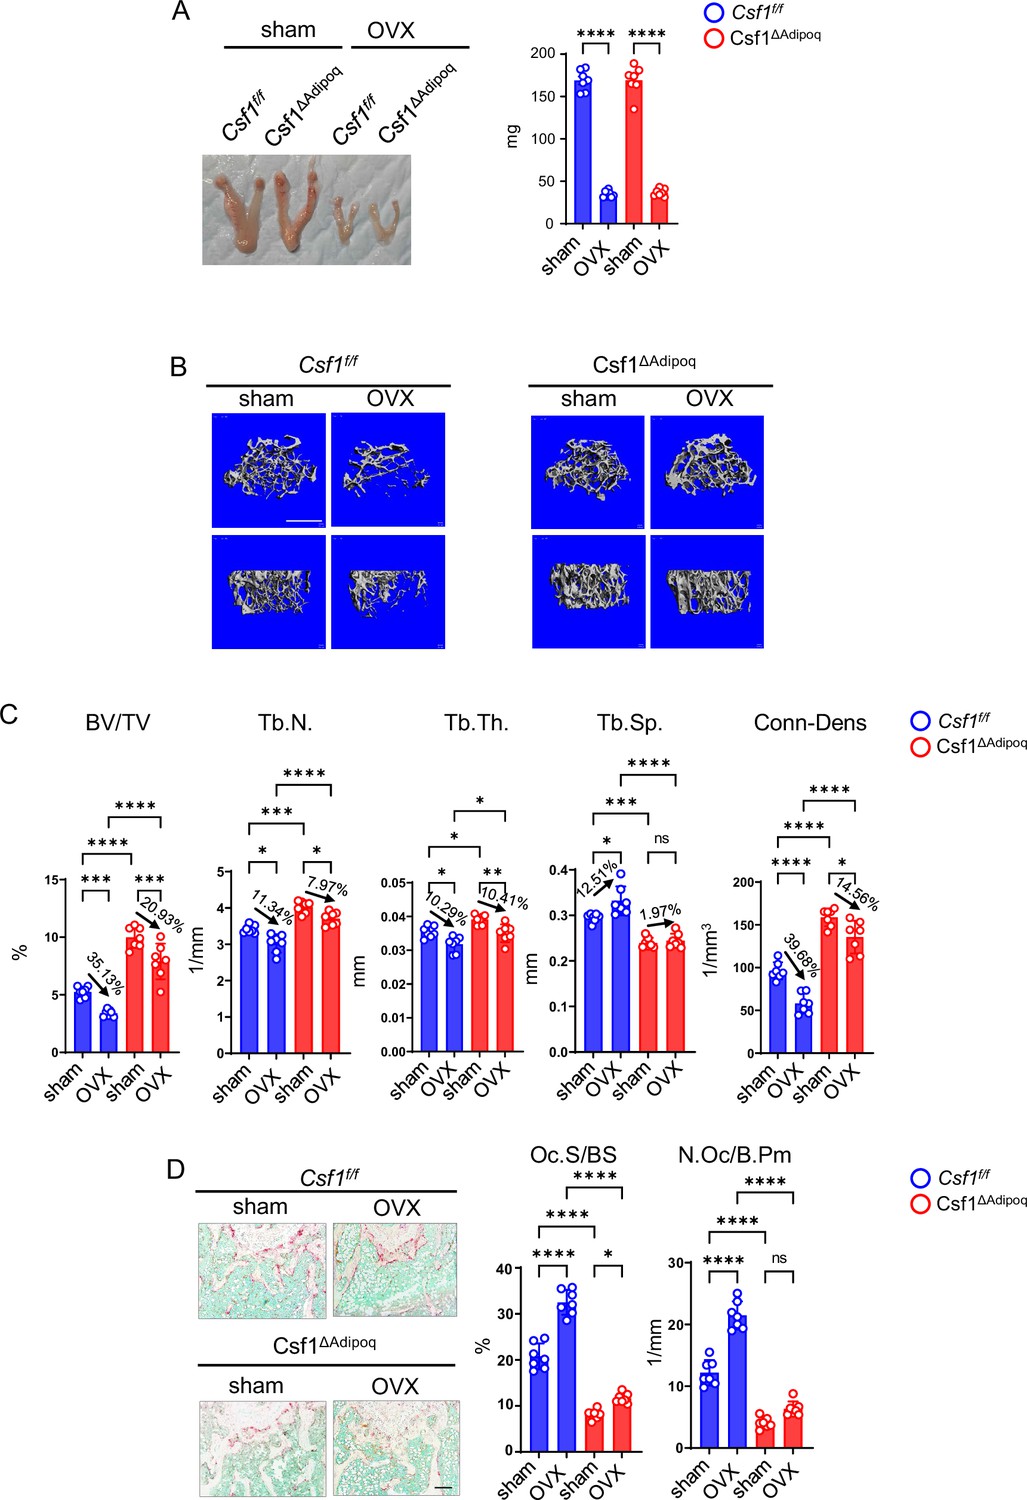
Csf1 deficiency in Csf1ΔAdipoq mice protects bone in OVX model.
12-week-old female Csf f/f and Csf1ΔAdipoq mice were subjected to OVX or sham surgery and analyzed 6 weeks after surgery. (A) Gross appearance (left panel) and weight (right panel) of uterus, (B) μCT images, and (C) bone morphometric analysis of trabecular bone of the distal femurs isolated from the Csf f/f and Csf1ΔAdipoq mice with sham or OVX surgery (n = 7/group). (D) TRAP staining (left panels) and histomorphometric analysis (right panels) of histological sections obtained from the metaphysis region of distal femurs isolated from the indicated mice (n = 7/group). BV/TV, bone volume per tissue volume; Tb.N, trabecular number; Tb.Th, trabecular thickness; Tb.Sp, trabecular separation; Conn-Dens., connectivity density; Ct.Th, cortical thickness; Oc.S/BS, osteoclast surface per bone surface; N.Oc/B.Pm, number of osteoclasts per bone perimeter. Data are mean ± SD. *p<0.05; **p<0.01; ***p<0.001; ****p<0.0001; n.s., not statistically significant by two-way ANOVA analysis followed by post hoc Bonferroni’s correction for multiple comparisons. Scale bars: B, 500 µm; D, 100 µm.
-
Figure 7—source data 1
Csf1 deficiency in Csf1ΔAdipoq mice protects bone in OVX model.
- https://cdn.elifesciences.org/articles/82118/elife-82118-fig7-data1-v2.zip
Figure 7—figure supplement 1
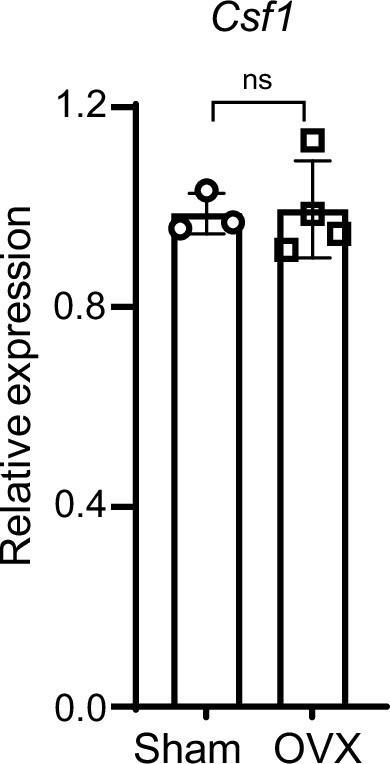
qPCR analysis of Csf1 expression in the bone marrow from the Sham and OVX mice.
Sham n=3, OVX n=4. Data are mean ± SD. ns: not statistically significant by two-tailed unpaired Student’s t test.
-
Figure 7—figure supplement 1—source data 1
qPCR analysis of Csf1 expression in the bone marrow from the Sham and OVX mice.
- https://cdn.elifesciences.org/articles/82118/elife-82118-fig7-figsupp1-data1-v2.zip
Author response image 1

Author response image 2
Tables
Key resources table
| Reagent type (species) or resource | Designation | Source or reference | Identifiers | Additional information |
|---|---|---|---|---|
| Genetic reagent (M. musculus) | Csf1flox/flox | PMID:21958845 | RRID:MGI:5305712 | |
| Genetic reagent (M. musculus) | Rosa26mT/mG | PMID:17868096 | RRID:IMSR_JAX:007676 | |
| Genetic reagent (M. musculus) | Adipoq-Cre | PMID:21356515 | RRID:IMSR_JAX:028020 | |
| Antibody | Anti-mouse CD45-PerCP/Cyanine5.5 (Rat monoclonal) | BioLegend | Cat# 103132 RRID: AB_893340 | FACS (1:200) |
| Antibody | Anti-mouse Ly-6G- Brilliant Violet 711 (Rat monoclonal) | BioLegend | Cat# 127643 RRID:AB_2565971 | FACS (1:200) |
| Antibody | Anti-mouse/human CD11b- Alexa Fluor 700 (Rat monoclonal) | BioLegend | Cat# 101222 RRID:AB_493705 | FACS (1:200) |
| Antibody | Anti-mouse F4/80- APC/Cyanine7 (Rat monoclonal) | BioLegend | Cat# 123118 RRID:AB_893477 | FACS (1:200) |
| Antibody | Anti-mouse Ly-6C- Brilliant Violet 510 (Rat monoclonal) | BioLegend | Cat# 128033 RRID:AB_2562351 | FACS (1:200) |
| Antibody | Anti-mouse CD45- APC (Rat monoclonal) | BioLegend | Cat# 103112 RRID:AB_312977 | FACS (1:200) |
| Antibody | Anti-mouse CD31-APC (Rat monoclonal) | BioLegend | Cat# 102510 RRID:AB_312917 | FACS (1:200) |
| Antibody | Anti-mouse TER-119 /Erythroid Cells- APC (Rat monoclonal) | BioLegend | Cat# 116212 RRID:AB_313713 | FACS (1:200) |
| Antibody | Anti-BrdU-APC (Mouse monoclonal) | BioLegend | Cat# 364114 RRID:AB_2814315 | FACS (5 ug per test) |
| Antibody | Mouse IgG1, κ Isotype-APC (Mouse monoclonal) | BioLegend | Cat# 400119 RRID:AB_2888687 | FACS (5 ug per test) |
| Antibody | Anti-Adiponectin (Rabbit polyclonal) | Thermo Fisher Scientific | Cat# PA1-054 RRID:AB_325789 | IF(1:200) WB(1:1000) |
| Antibody | Anti-Mouse IgG- Alexa Fluor 647 (Goat polyclonal) | Thermo Fisher Scientific | Cat# A-21235 RRID:AB_2535804 | IF(1:2000) |
| Antibody | Anti-Rabbit IgG- Alexa Fluor 594 (Goat polyclonal) | Thermo Fisher Scientific | Cat# A-11012 RRID:AB_2534079 | IF(1:2000) |
| Antibody | Anti-M-CSF (Mouse monoclonal) | Santa Cruz Biotechnology | Cat# sc-365779 RRID:AB_10846852 | IF(1:200) WB(1:1000) |
| Antibody | Anti-Perilipin (Rabbit monoclonal) | Cell Signaling Technology | Cat# 9349 RRID:AB_10829911 | IF(1:100) |
| Antibody | Anti-P38alpha (Rabbit polyclonal) | Santa Cruz Biotechnology | Cat# sc-535 RRID:AB_632138 | WB(1:1000) |
| Antibody | Anti-Phospho-NF-κB p65 (Ser536) (Rabbit monoclonal) | Cell Signaling Technology | Cat# 3033 RRID:AB_331284 | WB(1:1000) |
| Antibody | Anti-p44/42 MAP kinase (Rabbit polyclonal) | Cell Signaling Technology | Cat# 9101 RRID:AB_331646 | WB(1:1000) |
| Antibody | Anti-Phospho-SAPK/JNK (Thr183/Tyr185) (Rabbit polyclonal) | Cell Signaling Technology | Cat# 9251 RRID:AB_331659 | WB(1:1000) |
| Commercial assay or kit | eBioscience BrdU Staining Buffer | Thermo Fisher Scientific | Cat#: 00-5525-00 | |
| Peptide, recombinant protein | Recombinant Human sRANK Ligand | PeproTech | Cat# 310–01 | 40 ng/mL |
| Peptide, recombinant protein | Murine M-CSF | PeproTech | 315–02 | 20 ng/ml |
| Chemical compound, drug | 5-Bromo-2′-deoxyuridine (Brdu) | Sigma Aldrich | Cat#: B5002 | 200 mg/Kg |
| Commercial assay or kit | LIVE/DEAD Fixable Blue Dead Cell Stain Kit, for UV excitation | Thermo Fisher Scientific | L23105 | 1:1000 |
| Commercial assay or kit | Mouse Tartrate Resistant Acid Phosphatase (TRAP) ELISA Kit | MyBioSource.com. | MBS1601167 | |
| Software, algorithm | Seurat | PMID:29608179 | RRID:SCR_016341 | https://satijalab.org/seurat/get_started.html |
| Software, algorithm | Graphpad Prism 8 | GraphPad Software | RRID:SCR_002798 | |
| Software, algorithm | Flowjo V10.7.1 | Flowjo | RRID:SCR_008520 | https://www.flowjo.com/solutions/flowjo |
| Software, algorithm | ZEN (blue edition) version 3.4 | ZEN (blue edition) | RRID:SCR_013672 | https://www.zeiss.com/microscopy/en/products/software/zeiss-zen.html |
| Other | DAPI stain | BD Biosciences | Cat# 564907, RRID:AB_2869624 | FACS (1 ug/ml) |
Additional files
Download links
A two-part list of links to download the article, or parts of the article, in various formats.
Downloads (link to download the article as PDF)
Open citations (links to open the citations from this article in various online reference manager services)
Cite this article (links to download the citations from this article in formats compatible with various reference manager tools)
Bone marrow Adipoq-lineage progenitors are a major cellular source of M-CSF that dominates bone marrow macrophage development, osteoclastogenesis, and bone mass
eLife 12:e82118.
https://doi.org/10.7554/eLife.82118


