Kinesin-1, -2, and -3 motors use family-specific mechanochemical strategies to effectively compete with dynein during bidirectional transport
- Department of Biomedical Engineering, Pennsylvania State University, United States
- Department of Biological Chemistry and the Life Sciences Institute, University of Michigan-Ann Arbor, United States
Figures
Figure 1 with 4 supplements

Experimental setup and visualization of dynein-dynactin-BicD2 (DDB)-Kin complexes.
(A) Schematic of kinesin constructs containing SNAP tags functionalized with an Alexa Fluor 647 dye and a single-stranded DNA oligo. (B) DDB and kinesin motors connected via complementary DNA oligos on the GFP binding protein (GBP) and SNAP tag. (C) Sample kymograph showing the DDB/GFP channel (gray), the kinesin/Alexa Fluor 647 channel (cyan), and the overlay. Scale bars are 2 μm (horizontal) and 10 s (vertical). Microtubule (not shown) is oriented with plus-end to the right. Colocalized events are indicated by an arrow. (D) Sample x-t plots for DDB-Kin1, DDB-Kin2, and DDB-Kin3 complexes.
-
Figure 1—source data 1
Position vs. time data for the plots in Figure 1D.
- https://cdn.elifesciences.org/articles/82228/elife-82228-fig1-data1-v2.xlsx
Figure 1—figure supplement 1
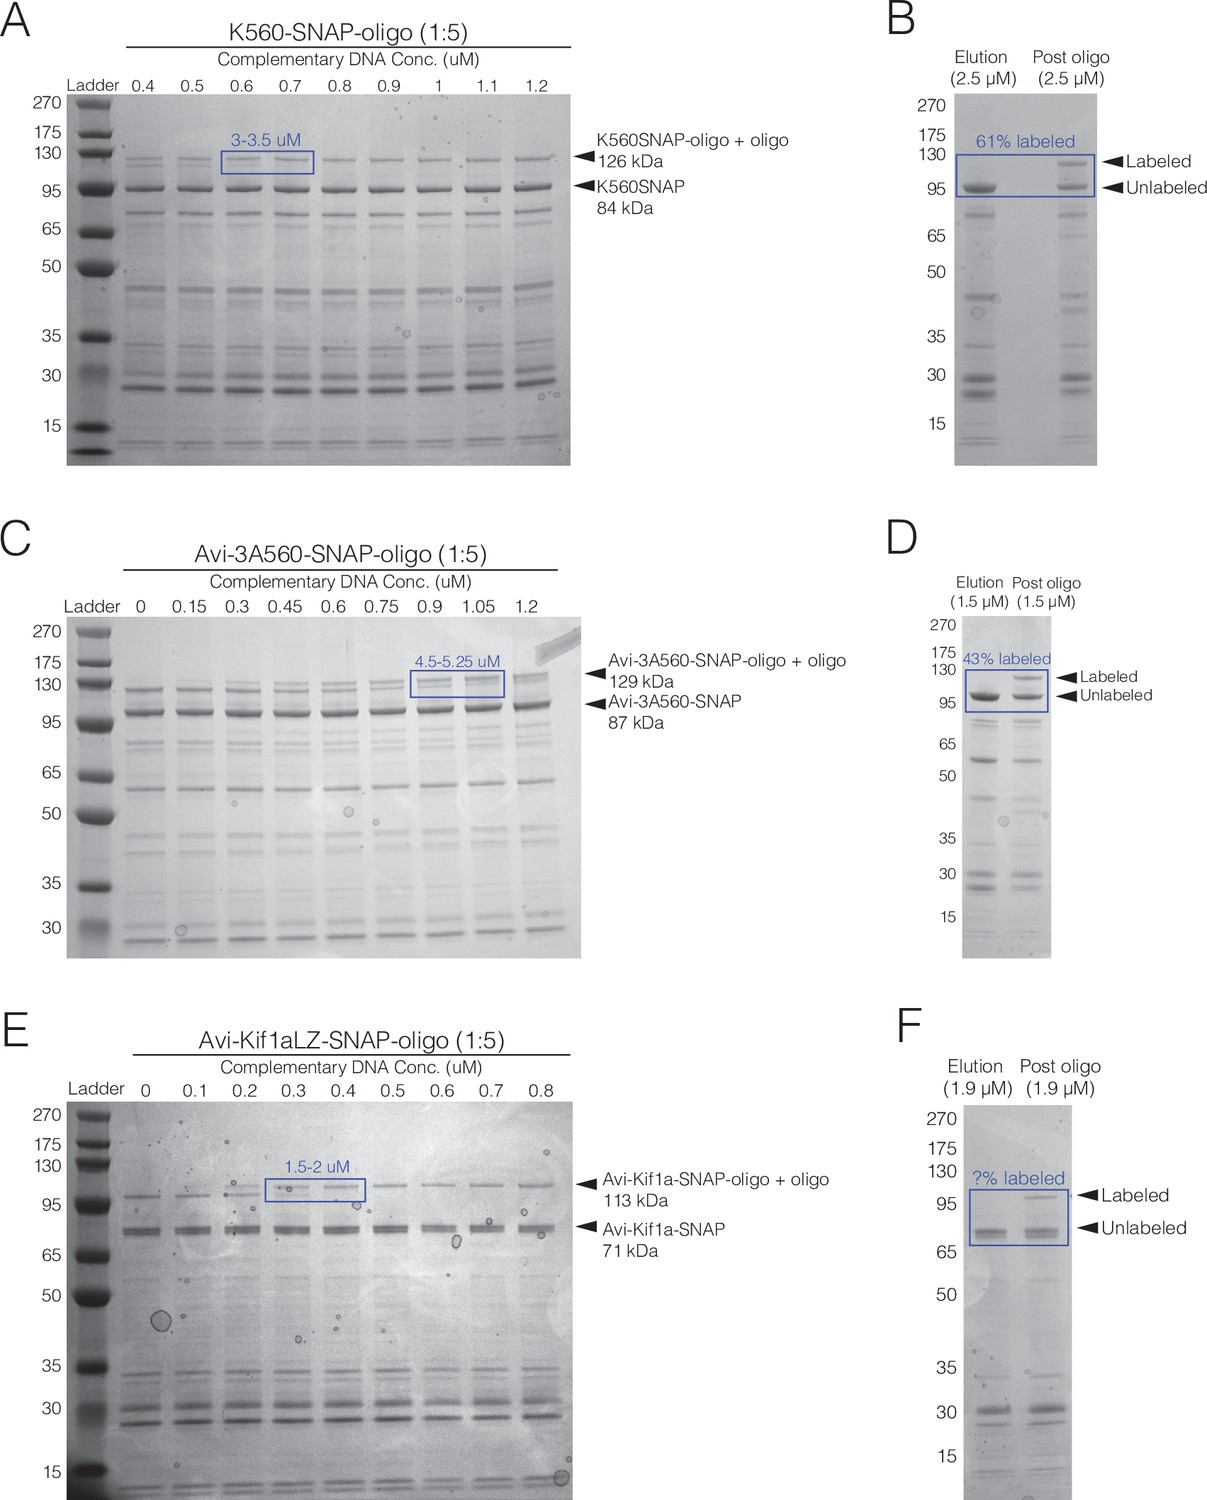
Purification gels and shift assays.
(A) Shift assay for K560SNAP, showing the oligo-labeled monomer concentration is 3.25 μM. (B) SDS-PAGE for the purification of K560SNAP showing 63% oligo-labeled monomer. (C) Shift assay for 3A560SNAP, showing oligo-labeled monomer concentration is 4.88 μM. (D) SDS-PAGE for the purification of 3A560SNAP showing 43% oligo-labeled monomer. (E) Shift assay for Kif1aLZSNAP, showing effective labeled concentration is 1.75 μM. (F) SDS-PAGE for the purification of Kif1aLZSNAP. The oligo-labeled monomer concentration could not be clearly determined (see Methods).
-
Figure 1—figure supplement 1—source data 1
Purification and shift-assay SDS-PAGE gel images.
- https://cdn.elifesciences.org/articles/82228/elife-82228-fig1-figsupp1-data1-v2.zip
Figure 1—figure supplement 2
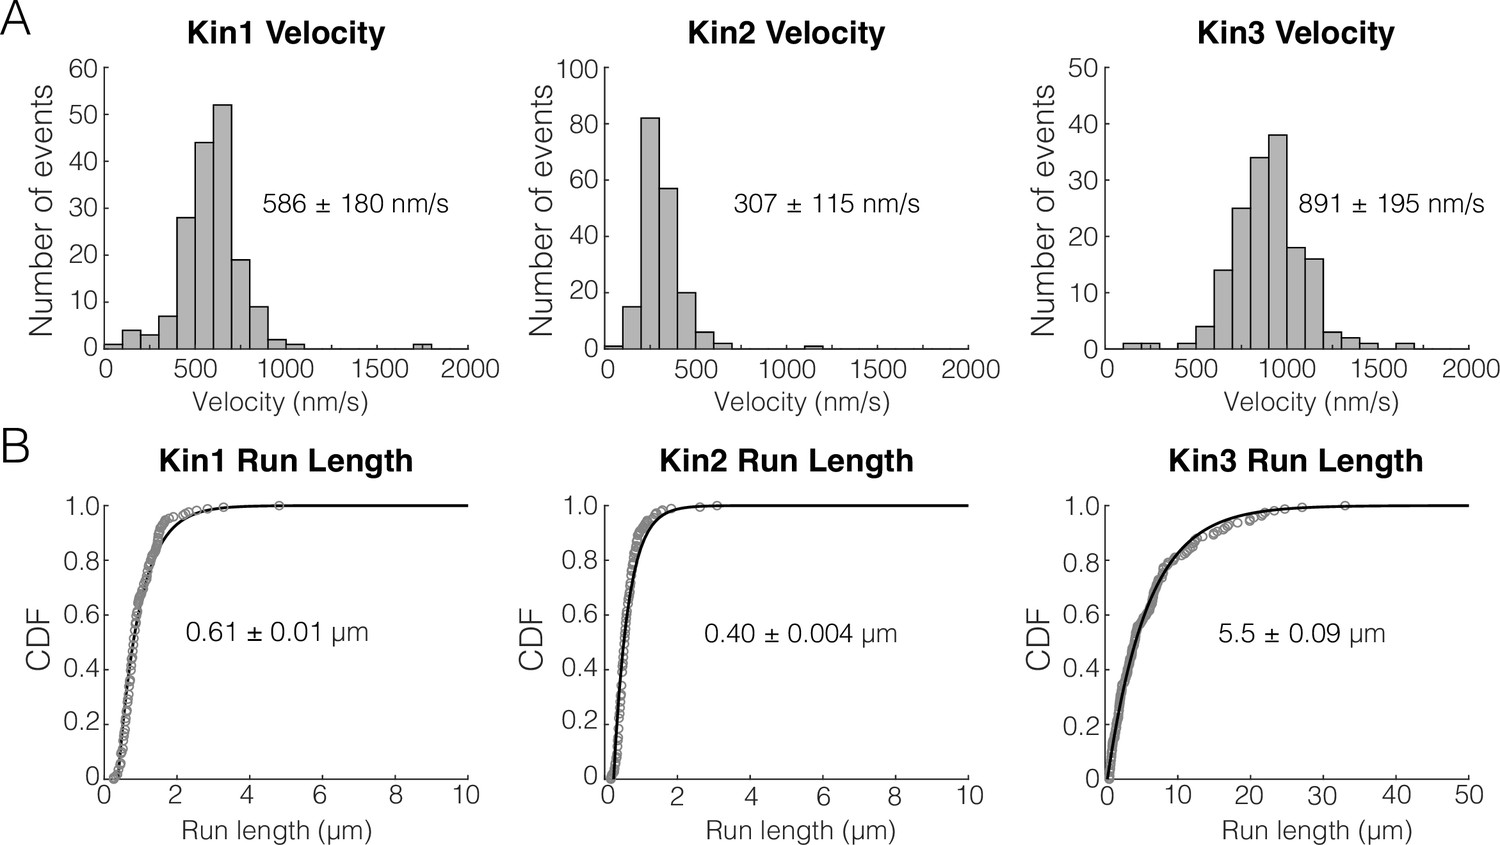
Unloaded run length and velocity for Kin1/2/3.
(A) Velocity distributions for kin1, kin2, and kin3. Values represent mean and standard deviation. (B) Cumulative distributions of the run length for Kin1, Kin2, and Kin3. Values represent mean of a single exponential fit and the 95% confidence interval of the bootstrap distribution.
-
Figure 1—figure supplement 2—source data 1
Velocity and run length data for Kin1, Kin2, and Kin3.
- https://cdn.elifesciences.org/articles/82228/elife-82228-fig1-figsupp2-data1-v2.xlsx
Figure 1—figure supplement 3
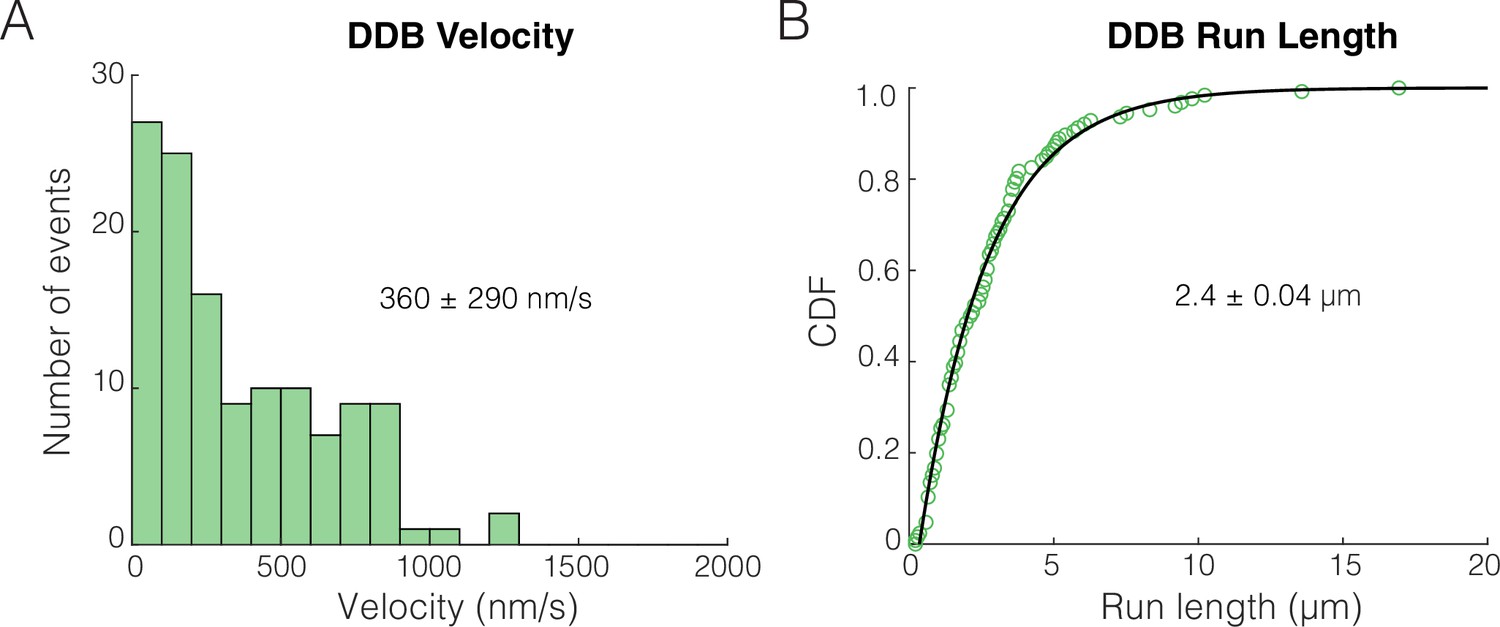
Unloaded run length and velocity for dynein-dynactin-BicD2 (DDB).
(A) Velocity distributions for DDB alone. Values represent mean and standard deviation. (B) Cumulative distributions of the run length for DDB alone. Values represent mean of a single exponential fit and the 95% confidence interval of the bootstrap distribution.
-
Figure 1—figure supplement 3—source data 1
Velocity and run length data for DDB.
- https://cdn.elifesciences.org/articles/82228/elife-82228-fig1-figsupp3-data1-v2.xlsx
Figure 1—figure supplement 4
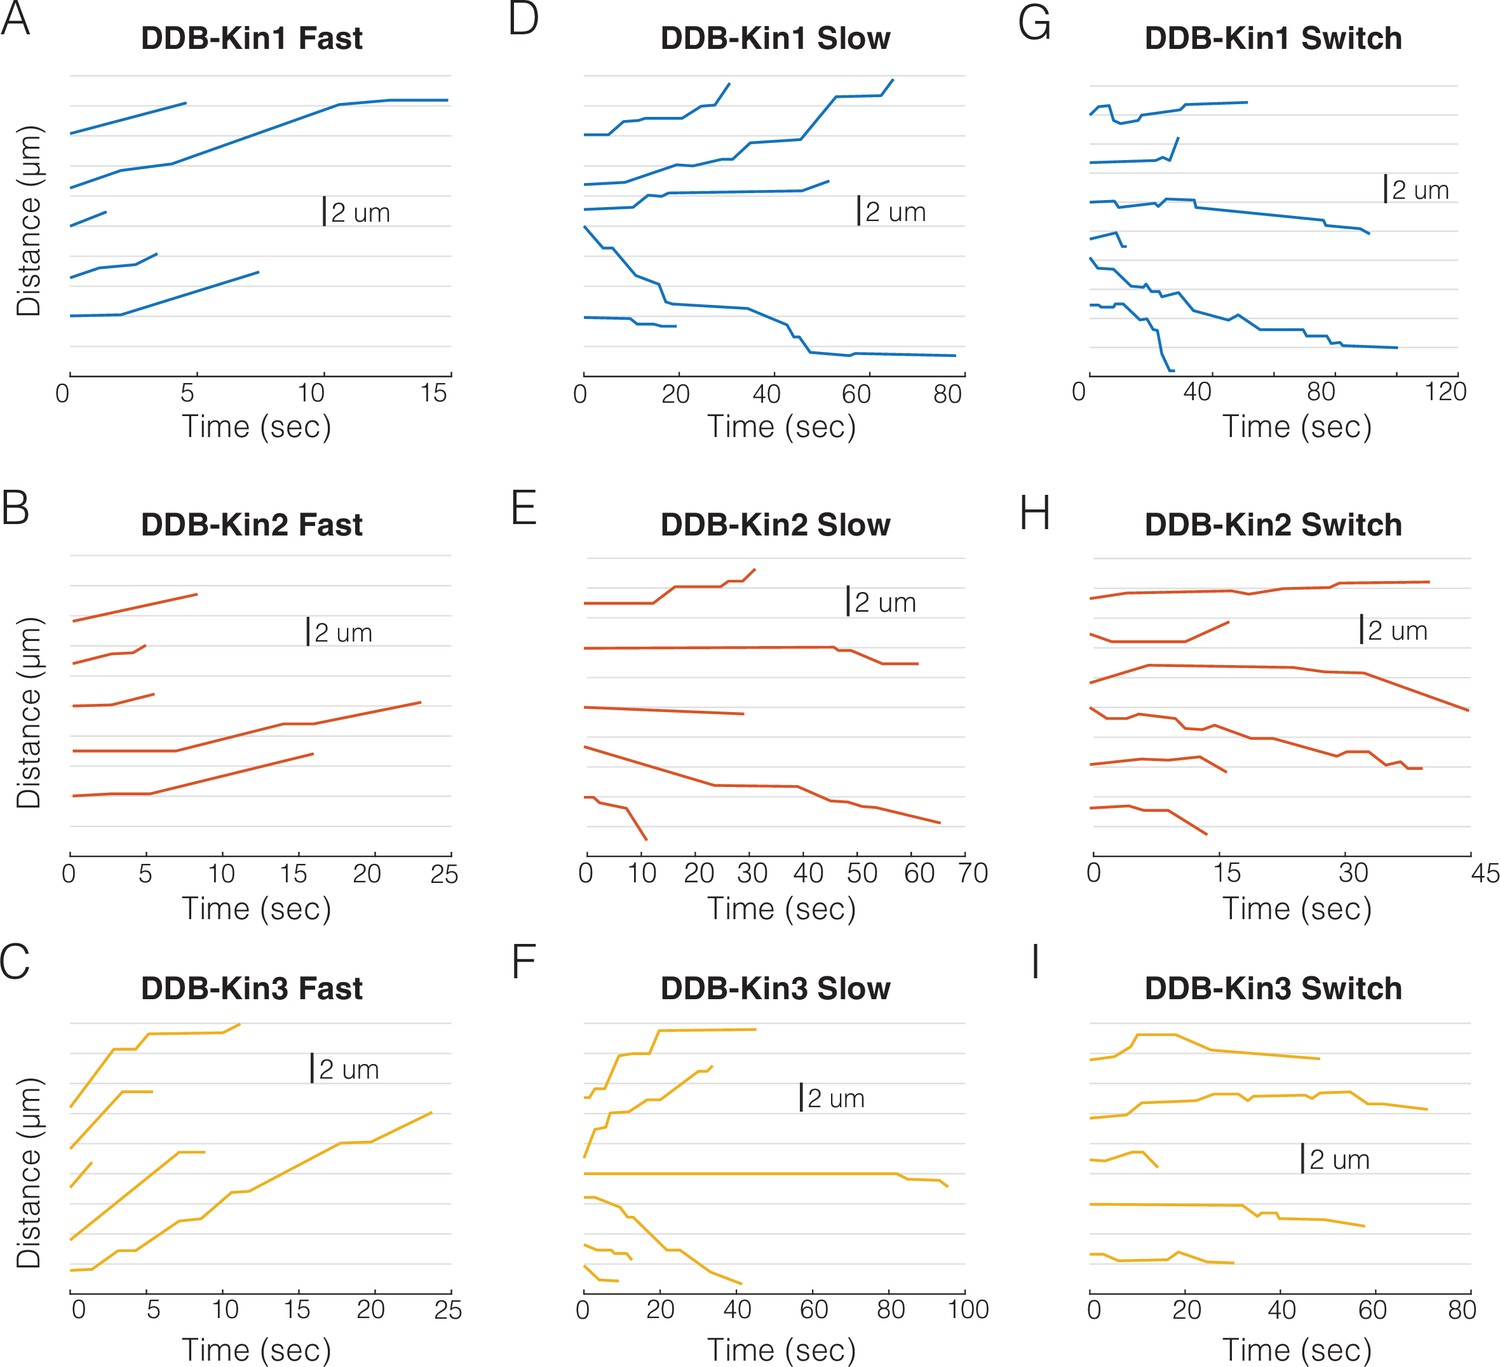
Sample traces for dynein-dynactin-BicD2 (DDB)-kin1/2/3 pairs.
(A) Sample fast (v>vel threshold) traces for DDB-Kin1 pairs. (B) Sample fast (v>vel threshold) traces for DDB-Kin2 pairs. (C) Sample fast (v>vel threshold) traces for DDB-Kin3 pairs. (D) Sample slow (v<vel threshold) traces for DDB-Kin1 pairs. (E) Sample slow (v<vel threshold) traces for DDB-Kin2 pairs. (F) Sample slow (v<vel threshold) traces for DDB-Kin3 pairs. (G) Examples of traces with directional switching for DDB-Kin1. (H) Examples of traces with directional switching for DDB-Kin2. (I) Examples of traces with directional switching for DDB-Kin3. Note: time scales are not the same for all plots.
-
Figure 1—figure supplement 4—source data 1
Position vs time data for the sample plots.
- https://cdn.elifesciences.org/articles/82228/elife-82228-fig1-figsupp4-data1-v2.xlsx
Figure 2
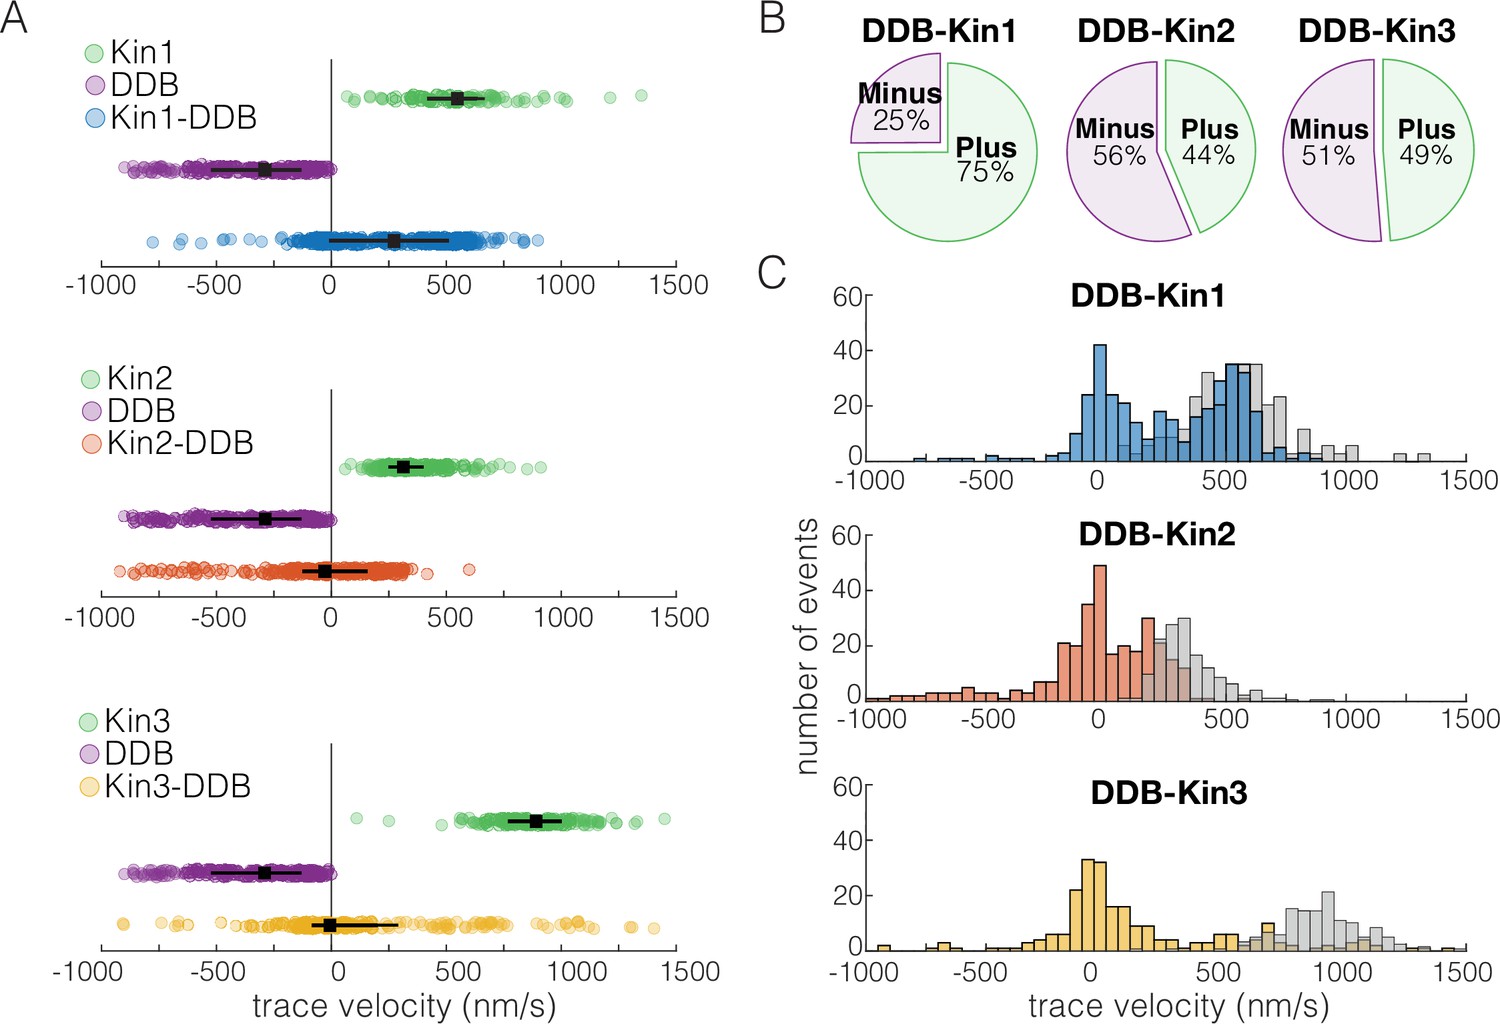
Dynein-dynactin-BicD2 (DDB)-Kin1 pairs move faster, and more frequently, to the plus-end than DDB-Kin2/3 pairs.
(A) Scatter plots showing whole trace velocities of the kinesin alone (gray/top), DDB alone (green/middle), and the DDB-Kin1/2/3 pair (blue/orange/yellow/bottom). Error bars represent median values and quartiles. (B) Fraction of motor pairs having net plus-end displacement (dark blue/orange/yellow) or net minus-end displacement (light blue/orange/yellow). (C) Histogram of the motor pair velocities. Unloaded kinesin velocity distributions are shown in gray (second histogram on the right). Dashed line indicates fast-slow trace velocity threshold.
-
Figure 2—source data 1
Velocity data for DDB-Kin1, DDB-Kin2, and DDB-Kin3.
- https://cdn.elifesciences.org/articles/82228/elife-82228-fig2-data1-v2.xlsx
Figure 3
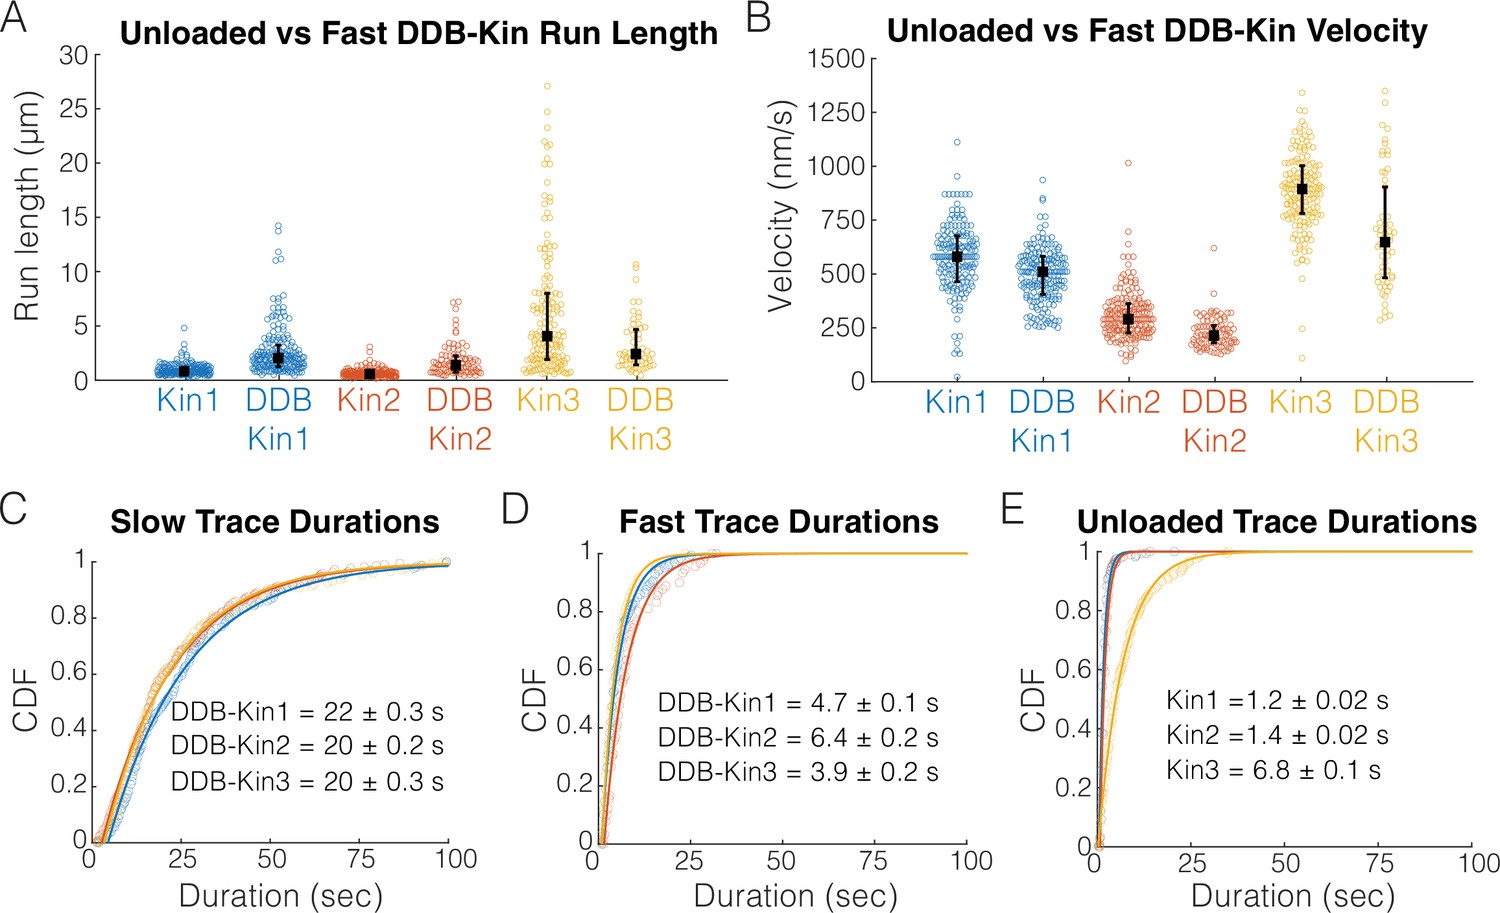
Fast, plus-end events represent a diffusive or weakly bound dynein-dynactin-BicD2 (DDB).
(A) Run length distributions of the fast traces and unloaded kinesin. Error bars represent median values and quartiles. (B) Velocity distributions of the fast DDB-Kin traces and unloaded kinesin. Error bars represent median values and quartiles. (C) Cumulative distribution functions (CDF) of the durations of the slow traces (traces < velocity threshold). Data were fit to a single exponential and values are mean duration ± 95% CI of bootstrap distributions. (D) CDF of the durations of the fast traces (traces > velocity threshold). Data were fit to a single exponential and values are mean duration ± 95% CI of bootstrap distributions. (E) CDF of the durations of the unloaded kinesin traces. Data were fit to a single exponential and values are mean duration ± 95% CI of bootstrap distributions.
-
Figure 3—source data 1
Run length, velocity, and trace duration data for Kin1, Kin2, Kin3, and the DDB-Kin pairs.
- https://cdn.elifesciences.org/articles/82228/elife-82228-fig3-data1-v2.xlsx
Figure 4 with 2 supplements
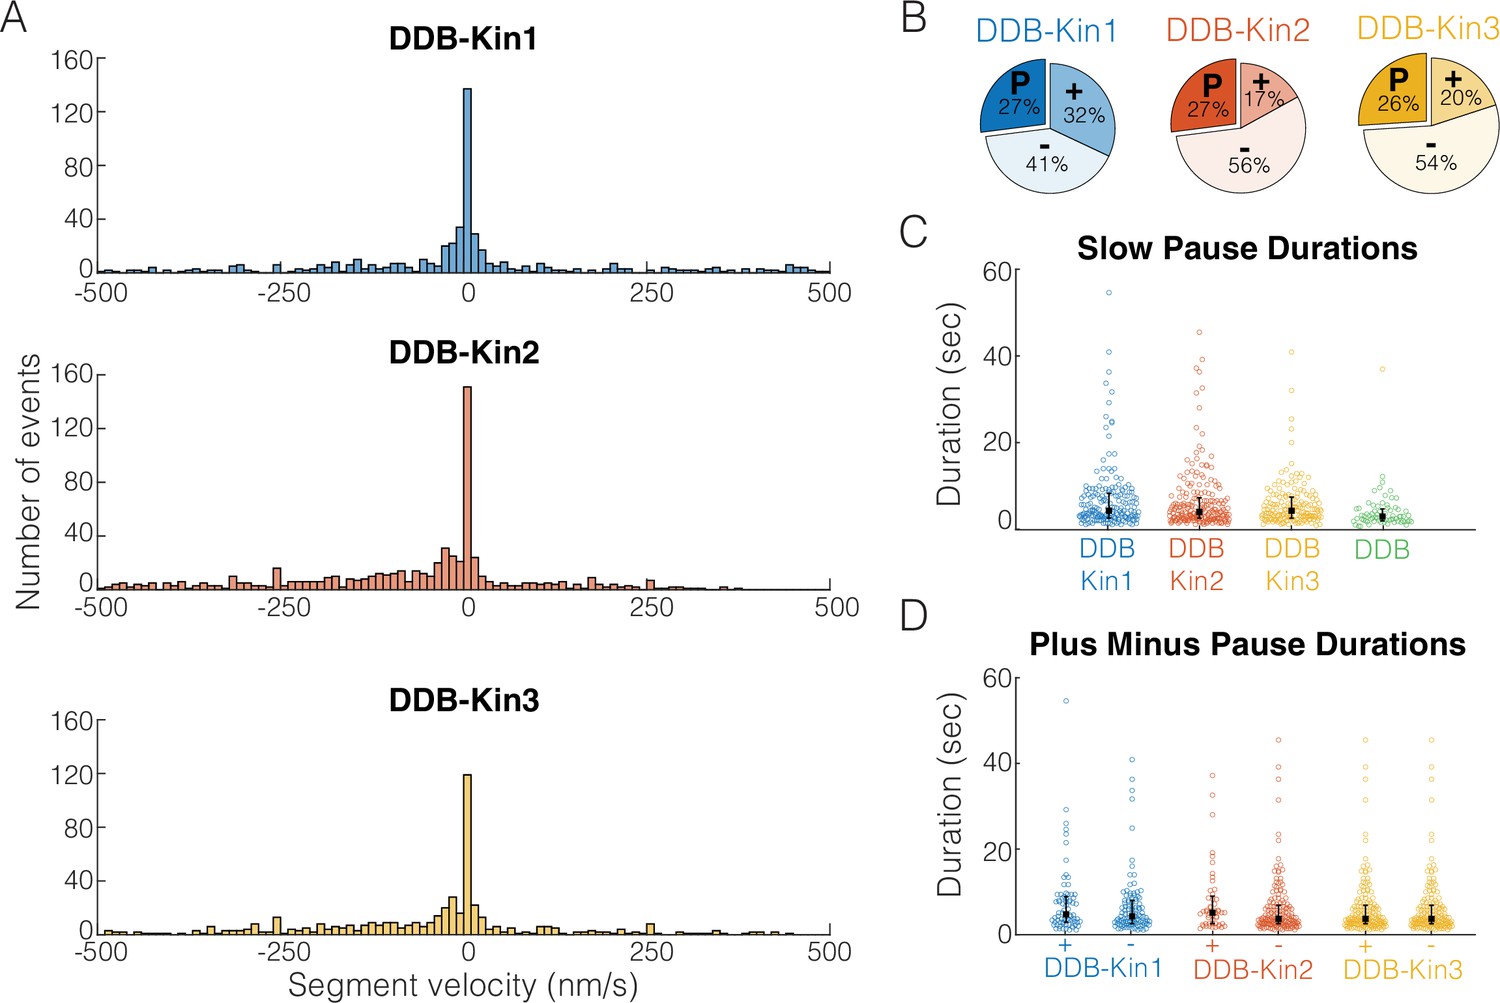
Pauses are due to a DDB ‘stuck’ state.
(A) Distributions of segment velocities for the slow traces. Less than 10% of the data is excluded to zoom in on the peak at zero. (B) Fraction of segments that are paused (defined as moving <1 pixel/73 nm), minus-end-directed and plus-end-directed for the slow population (<velocity threshold defined in Figure 2C). (C) Distributions of pause durations for DDB-Kin1/2/3 pairs compared with unloaded DDB. Error bars represent median values and quartiles. (D) Comparison of pause durations for the minus-end and plus-end-directed events for each motor pair. Error bars represent median values and quartiles.
-
Figure 4—source data 1
Segment velocity and duration data for Kin1, Kin2, Kin3, and the DDB-Kin pairs.
- https://cdn.elifesciences.org/articles/82228/elife-82228-fig4-data1-v2.xlsx
Figure 4—figure supplement 1
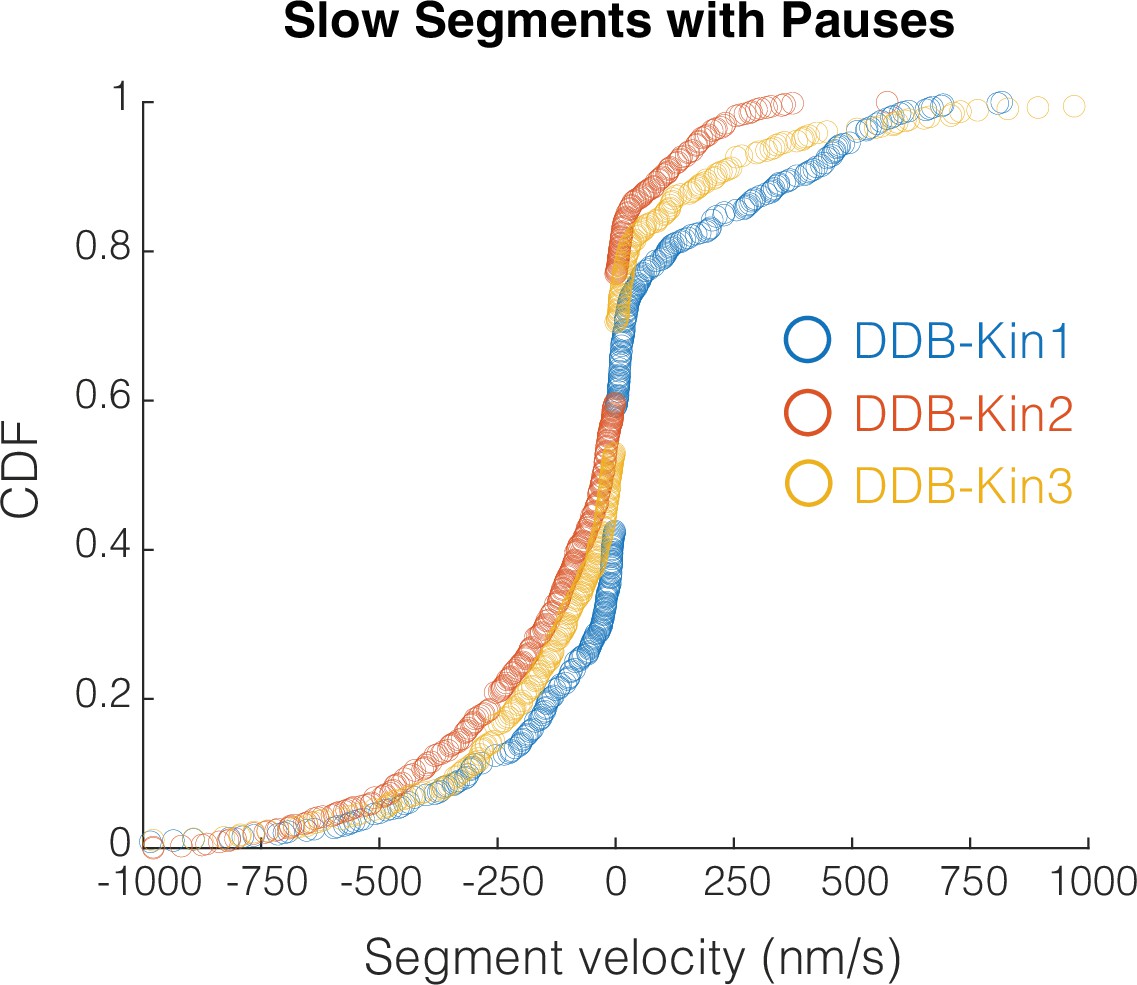
Slow segment velocity distributions.
Cumulative distributions of the slow segment (v<threshold) velocities for all three motor pairs.
-
Figure 4—figure supplement 1—source data 1
Cumulative distribution of the segment velocity data for the DDB-Kin pairs.
- https://cdn.elifesciences.org/articles/82228/elife-82228-fig4-figsupp1-data1-v2.xlsx
Figure 4—figure supplement 2
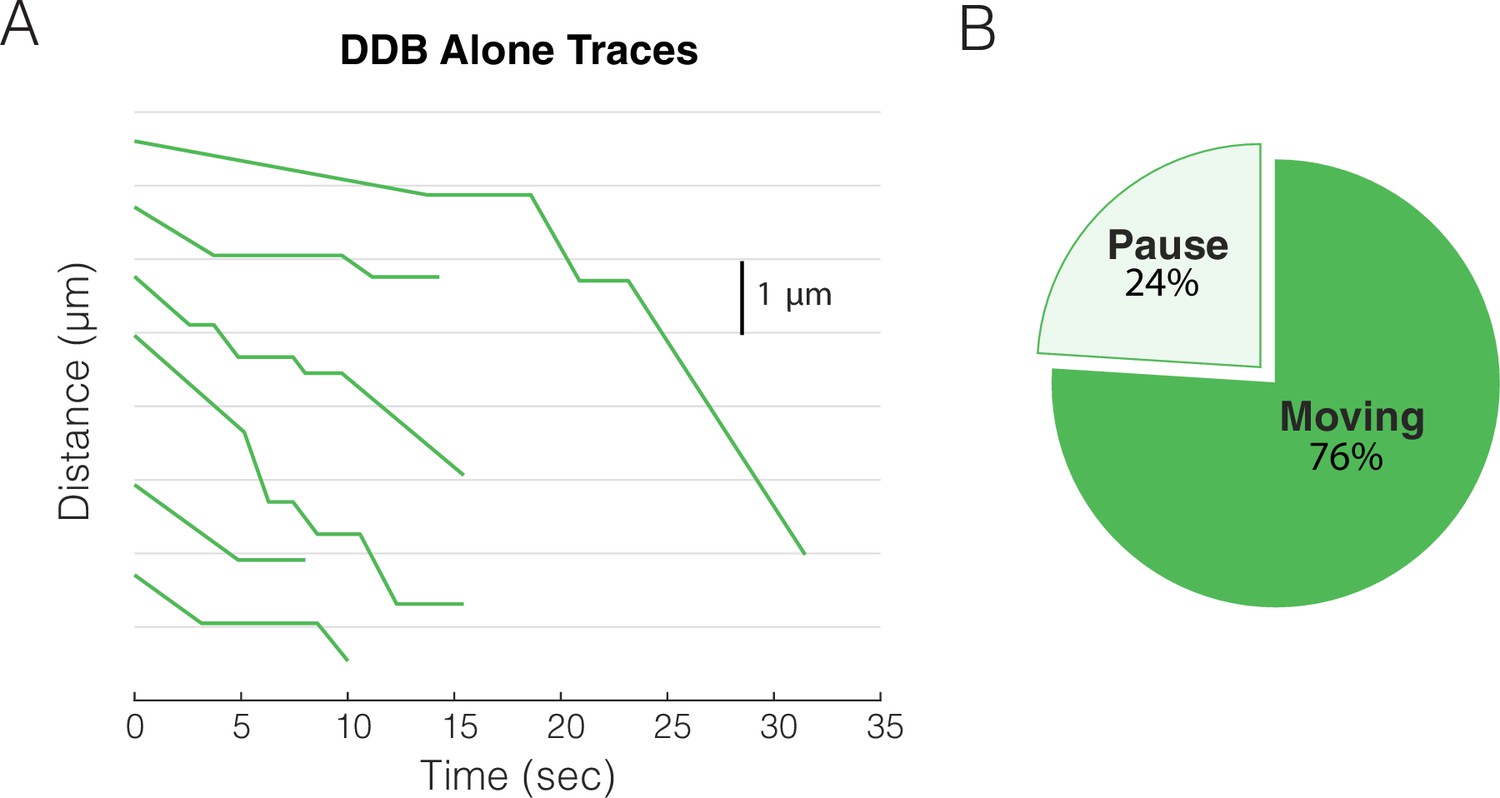
Sample traces for dynein-dynactin-BicD2 (DDB) alone.
(A) Sample x-t plots for DDB alone. (B) Fraction of paused and moving segments for DDB alone.
-
Figure 4—figure supplement 2—source data 1
Position vs. time data for DDB alone.
- https://cdn.elifesciences.org/articles/82228/elife-82228-fig4-figsupp2-data1-v2.xlsx
Figure 5

Dynein-dynactin-BicD2 (DDB)-Kin1/2/3 all compete effectively against DDB.
(A) Distribution of instantaneous velocities calculated over 1 s time windows for the moving segments (excluding pauses). Dashed line represents v=0 nm/s. Less than 13% of data are not shown to zoom in on the peak near zero. (B) Box plot distributions of the instantaneous velocity distributions shown in (A). Vertical bars represent median values (–6, –41, and –26 nm/s), solid boxes represent quartiles, and error bars denote limit of outliers. (C) Cumulative distributions of instantaneous velocities, showing the fraction of time spent moving toward the minus-end (<0 nm/s; denoted by dashed lines) versus the plus-end (>0 nm/s). DDB-Kin1 (blue/bottom), DDB-Kin2 (orange/top), and DDB-Kin3 (yellow/middle).
-
Figure 5—source data 1
Instantaneous velocity distributions for the DDB-Kin pairs.
- https://cdn.elifesciences.org/articles/82228/elife-82228-fig5-data1-v2.xlsx
Figure 6 with 1 supplement
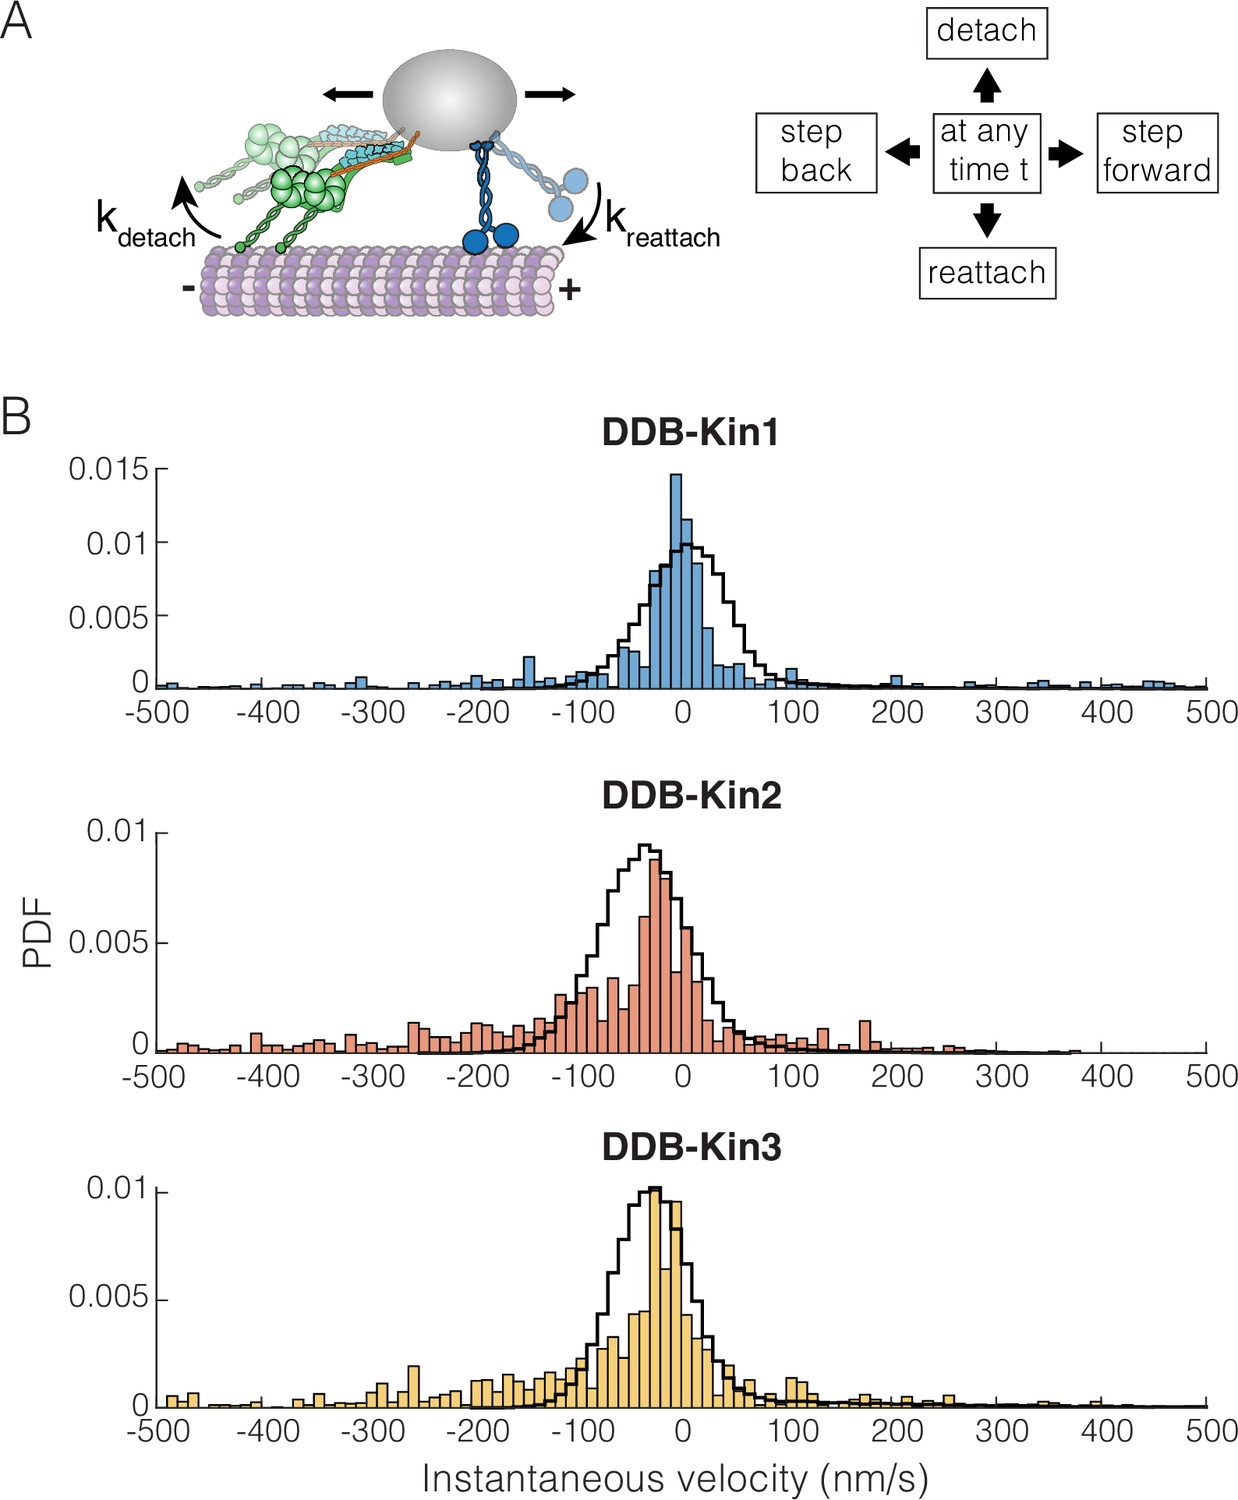
Dynein-dynactin-BicD2 (DDB)-Kinesin stepping simulations can recapitulate experimental velocities.
(A) Schematic of the stochastic stepping model used in simulations. (B) Probability density functions (PDF) of the instantaneous velocity distributions of the experimental (blue, orange, and yellow bars) and the simulated traces (black lines) for the DDB-Kin1, DDB-Kin2, and DDB-Kin3 pairs. Window size is 1 s.
-
Figure 6—source code 1
DDB-Kin bidirectional transport simulation.
- https://cdn.elifesciences.org/articles/82228/elife-82228-fig6-code1-v2.zip
-
Figure 6—source data 1
Simulated instantaneous velocity data.
- https://cdn.elifesciences.org/articles/82228/elife-82228-fig6-data1-v2.xlsx
Figure 6—figure supplement 1
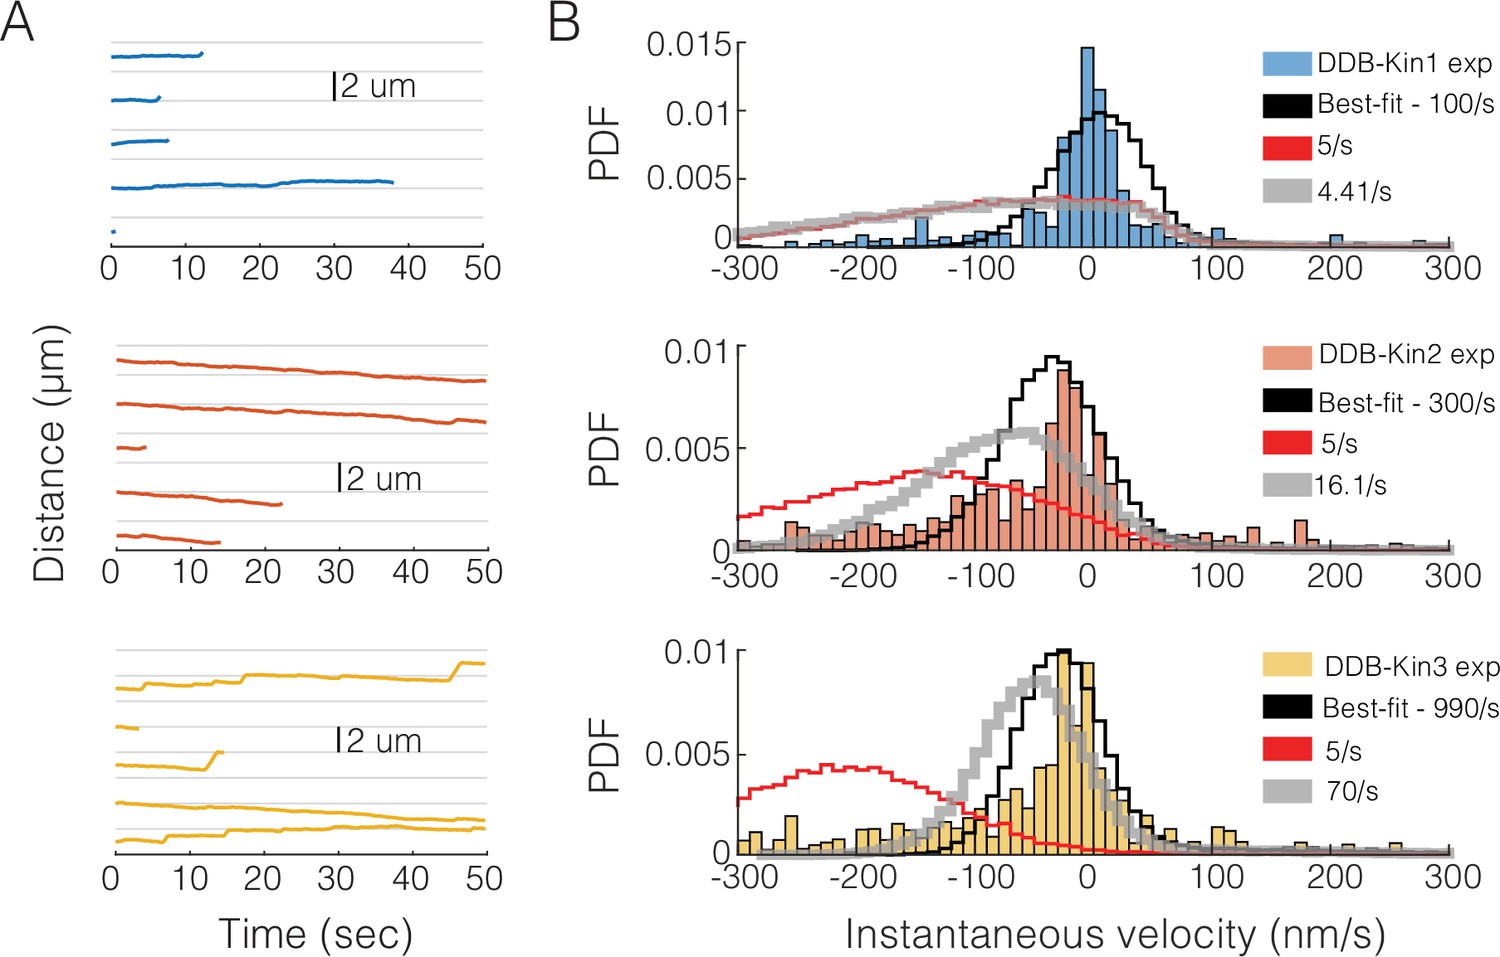
Simulation results for slower reattachment rates.
(A) Raw simulation traces using the best-fit model for dynein-dynactin-BicD2 (DDB)-Kin1 (top/blue), DDB-Kin2 (middle/orange), and DDB-Kin3 (bottom/yellow). (B) Simulation velocity distributions for DDB-Kin1 (top), DDB-Kin2 (middle), and DDB-Kin3 (bottom) for slower reattachment rates compared with the experimental data (blue/orange/yellow). Best fit model (black) uses parameters listed in Table 1. Five s–1 model (red) uses identical reattachment rate of 5 s–1 for each motor. Variable attachment rate model (gray) uses kinesin reattachment rates that are scaled by their bimolecular on-rates for microtubule binding determined by stopped flow (Feng et al., 2018; Zaniewski et al., 2020).
-
Figure 6—figure supplement 1—source data 1
Simulated position vs. time and instantaneous velocity data.
- https://cdn.elifesciences.org/articles/82228/elife-82228-fig6-figsupp1-data1-v2.xlsx
Tables
Table 1
Model parameters.
| Kin1 | Kin2 | Kin3 | DDB | |
|---|---|---|---|---|
| V0 (nm/s) | 586 | 307 | 910 | 360 |
| kforward (s–1) | 76 | 41 | 117 | 60 |
| (s–1) | 0.96 | 0.76 | 0.16 | 0.1 |
| Fs (pN) | 6 | 6 | 6 | 3.6 |
| Fdetach (pN) | 6.8 | 3 | 1.3 | (Ideal bond) |
| kreattach (s–1) | 100 | 300 | 990 | 5 |
| kbackstep (s–1) | 3 | 3 | 3 | 5 |
| κmotor (pN/nm) | 0.2 | 0.2 | 0.2 | 0.2 |
Additional files
Download links
A two-part list of links to download the article, or parts of the article, in various formats.
Downloads (link to download the article as PDF)
Open citations (links to open the citations from this article in various online reference manager services)
Cite this article (links to download the citations from this article in formats compatible with various reference manager tools)
Kinesin-1, -2, and -3 motors use family-specific mechanochemical strategies to effectively compete with dynein during bidirectional transport
eLife 11:e82228.
https://doi.org/10.7554/eLife.82228


