Efficient generation of marmoset primordial germ cell-like cells using induced pluripotent stem cells
- Department of Biomedical Sciences, University of Pennsylvania, School of Veterinary Medicine, United States
- Institute for Regenerative Medicine, University of Pennsylvania, United States
- Bell Research Center for Reproductive Health and Cancer, Japan
- Department of Neuroscience, Developmental and Regenerative Biology, The University of Texas at San Antonio, United States
- Texas Biomedical Research Institute, United States
- Southwest National Primate Research Center, United States
- Genomics Core, The University of Texas at San Antonio, United States
- Department of Pathology and Laboratory Medicine, University of Pennsylvania, United States
Figures
Figure 1 with 1 supplement
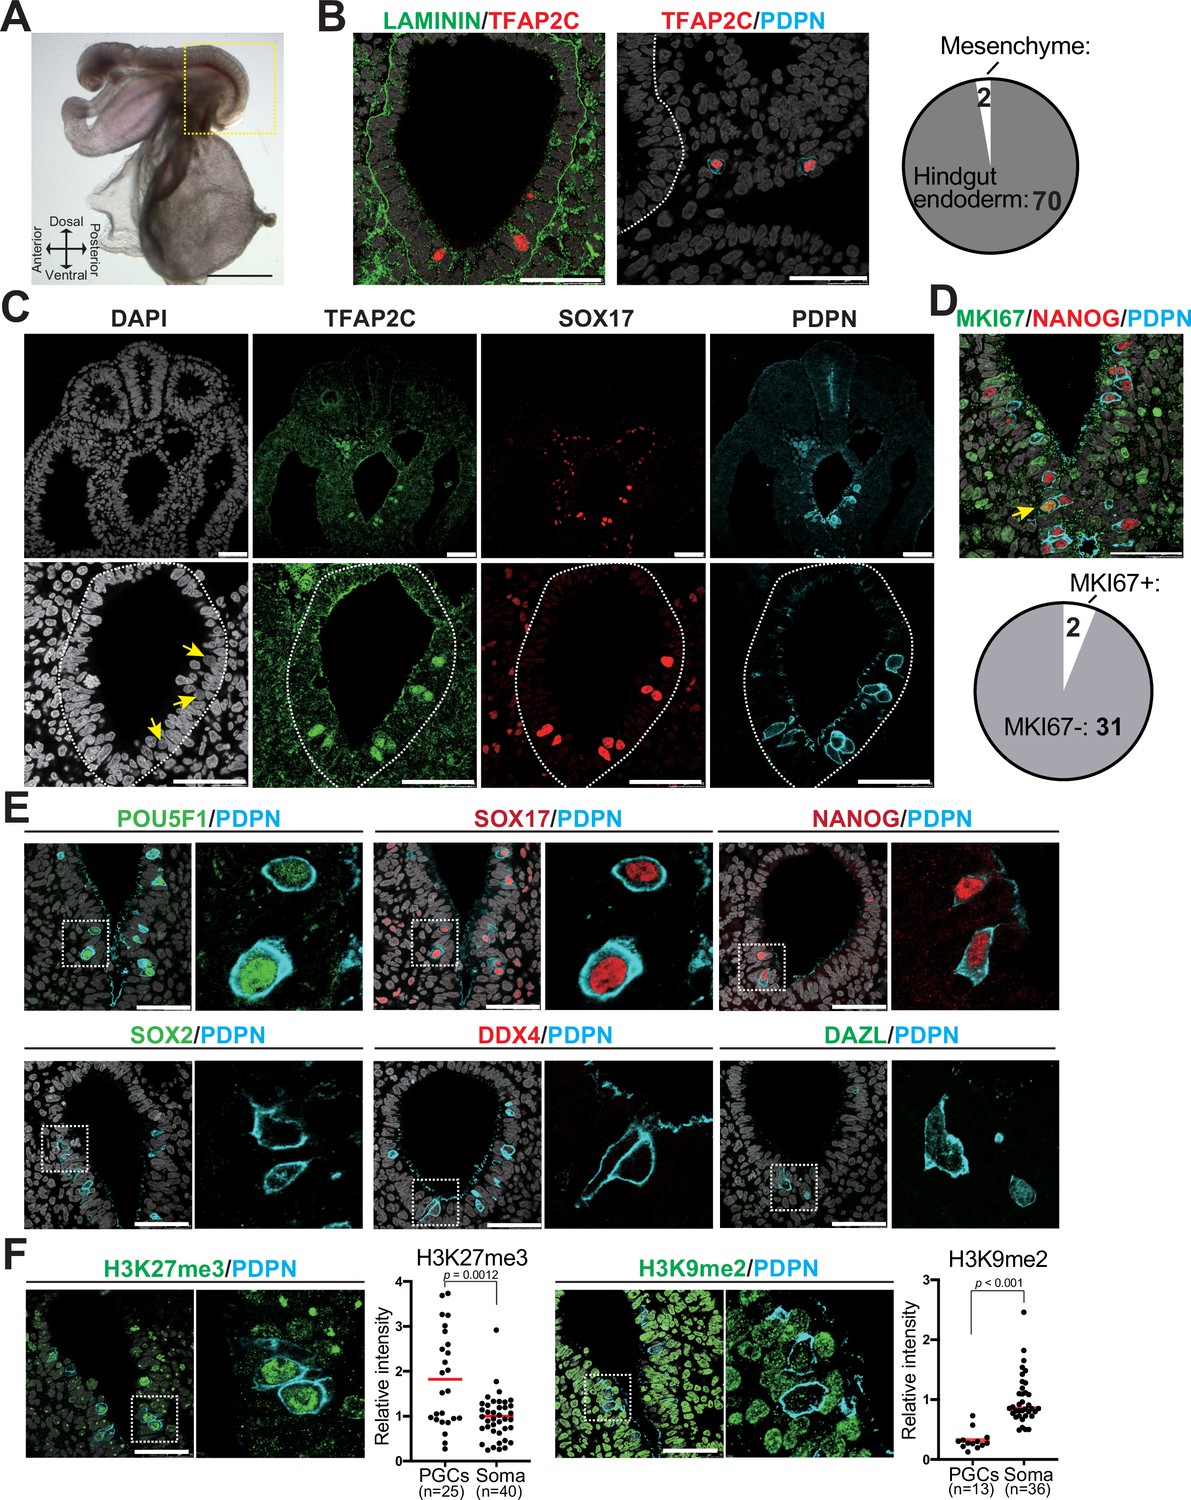
Immunophenotypic characterization of pre-migratory Callithrix jacchus primordial germ cells (cjPGCs) at embryonic day (E)50.
(A) Bright field images of a cj embryo at E50 (Carnegie stage [CS]11). Scale bar, 1 mm. (B) (Left) Immunofluorescence (IF) images of the hindgut in the cj embryo as in (A) (transverse section), stained as indicated. Laminin outlines the basement membranes of the hindgut endoderm. The white dashed line highlights the hindgut endoderm. Scale bars, 50 μm. (Right) Pie chart showing the number and location of cjPGCs present in representative cross sections. (C) IF of the same cj embryo for TFAP2C (green), SOX17 (red), PDPN (cyan), and DAPI (white). Magnified images of hindgut endoderm are shown at the bottom. Arrows denote nuclei of cjPGCs with lower DAPI intensity than that of surrounding endodermal cells. Scale bar, 50 μm. (D) (Top) IF of the cj embryo stained for MKI67 (green), NANOG (red), and PDPN (cyan), merged with DAPI (white). An arrowhead indicates MKI67+ cjPGC. (Bottom) Pie chart showing the number of MKI67+ cells in PGCs. Scale bars, 50 μm. (E) IF of the cj embryo for pre-migratory PGC markers (POU5F1 [green], SOX17 [red], and NANOG [red]) or gonadal stage PGC markers (DDX4 [red] and DAZL [green]), co-stained for PDPN (cyan). Merged images with DAPI (white) are shown on the right of each panel. Scale bars, 50 μm. (F) IF of the cj embryo for PDPN (cyan), co-stained for H3K27me3 or H3K9me2 (green). Scale bars, 50 μm. Relative fluorescence intensities of H3K27me3 and H3K9me2 in PDPN+ cjPGCs in comparison to those of surrounding somatic cells are shown on the left of each IF panel. Bar, mean. Statistical significance is determined by two-tailed Welch’s t test.
-
Figure 1—source data 1
Negative control images for immunofluorescence studies.
- https://cdn.elifesciences.org/articles/82263/elife-82263-fig1-data1-v2.pdf
Figure 1—figure supplement 1
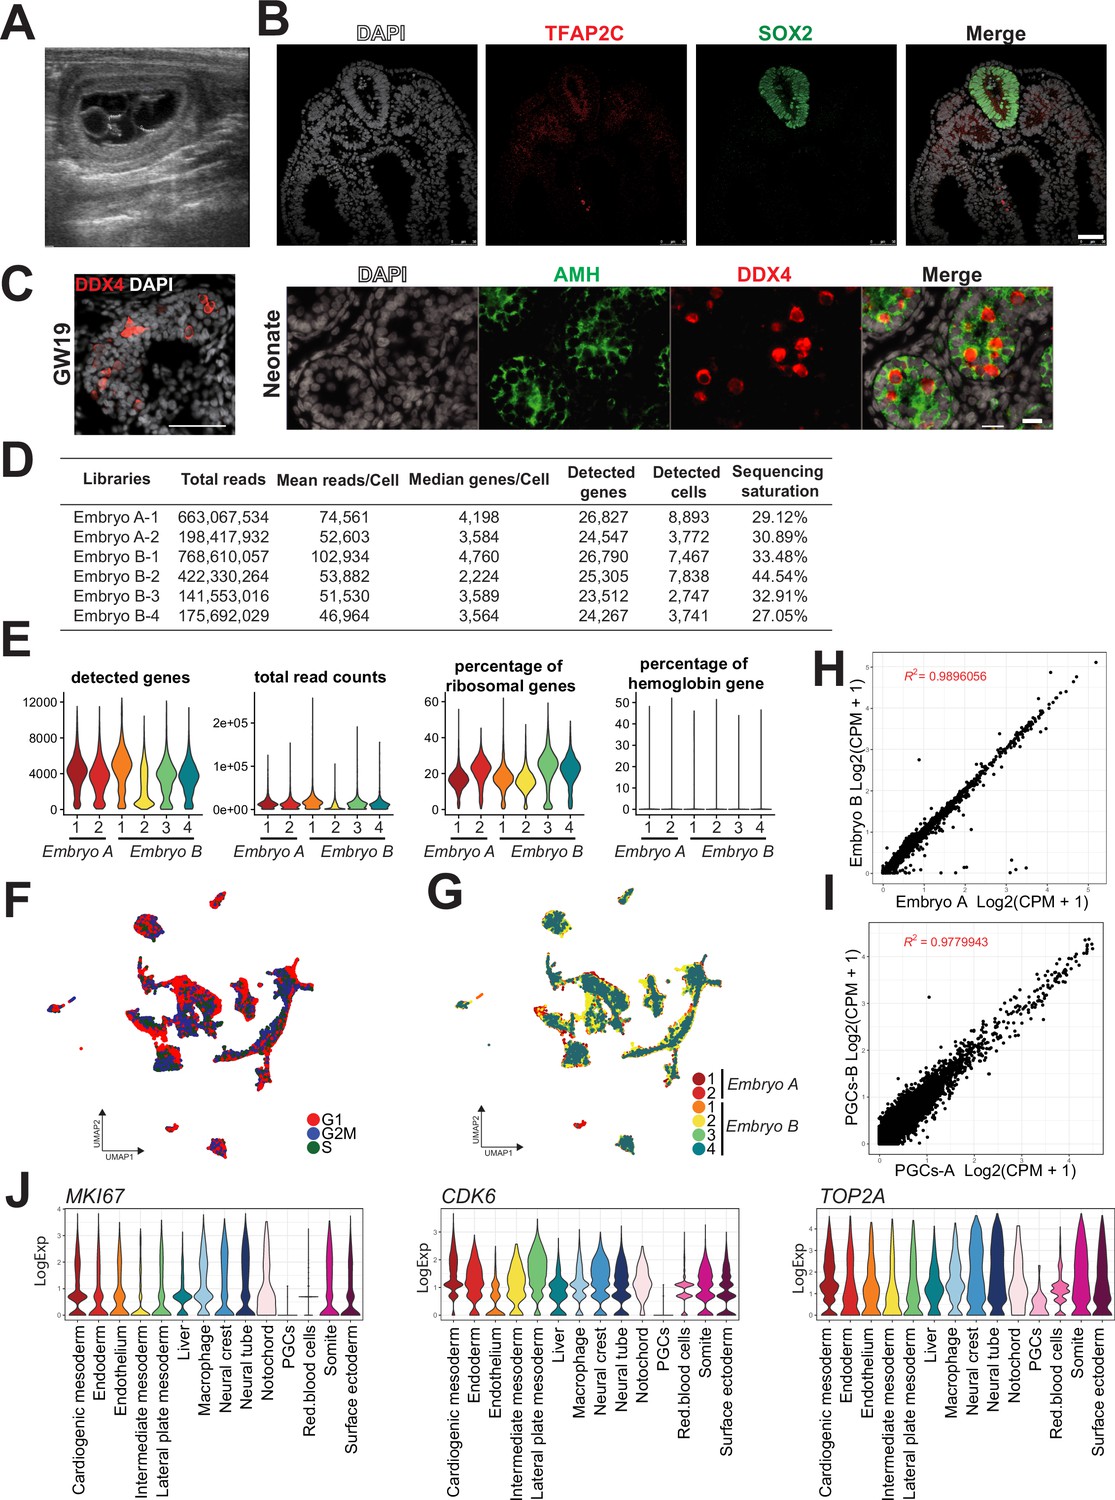
Immunophenotypic and transcriptomic characterization of marmoset embryos.
(A) Transabdominal ultrasound images of Callithrix jacchus (cj) embryos at embryonic day (E)50. (B) Immunofluorescence (IF) images of a cj embryo section (E50, CS11) stained for TFAP2C (red) and SOX2 (green), merged with DAPI (white). The neural tube is immunoreactive for SOX2. Scale bar, 50 μm. (C) (Left) IF images of a testis section derived from a cj fetus at gestational week 19 (GW19), showing DDX4 (red) merged with DAPI (white). (Right) IF of a neonatal testis section, showing DDX4 (red), AMH (green) merged with DAPI (white). Scale bar, 50 μm. (D) Basic description of sequencing results from six libraries derived from two embryos at E50 (two libraries from embryo A, four libraries from embryo B) in this study. (E) Quality control of the single-cell transcriptome data used for Seurat analysis. (F) Cell cycle scoring, showing an overall even distribution of different cell cycle phases across cell types. (G) Sample source information projected on the same uniform manifold approximation and projection (UMAP) embedding. (H, I) Scatter plot comparison of average gene expression values for all cells in Embryo_A and Embryo_B (H) or between populations of Callithrix jacchus primordial germ cells (cjPGCs) derived from each of the two embryos (I). (J) Violin plot showing expression of key proliferation markers in the indicated cell types.
-
Figure 1—figure supplement 1—source data 1
Differetially expressed genes (DEGs) among cell clusters in Figure 2B.
- https://cdn.elifesciences.org/articles/82263/elife-82263-fig1-figsupp1-data1-v2.xlsx
Figure 2
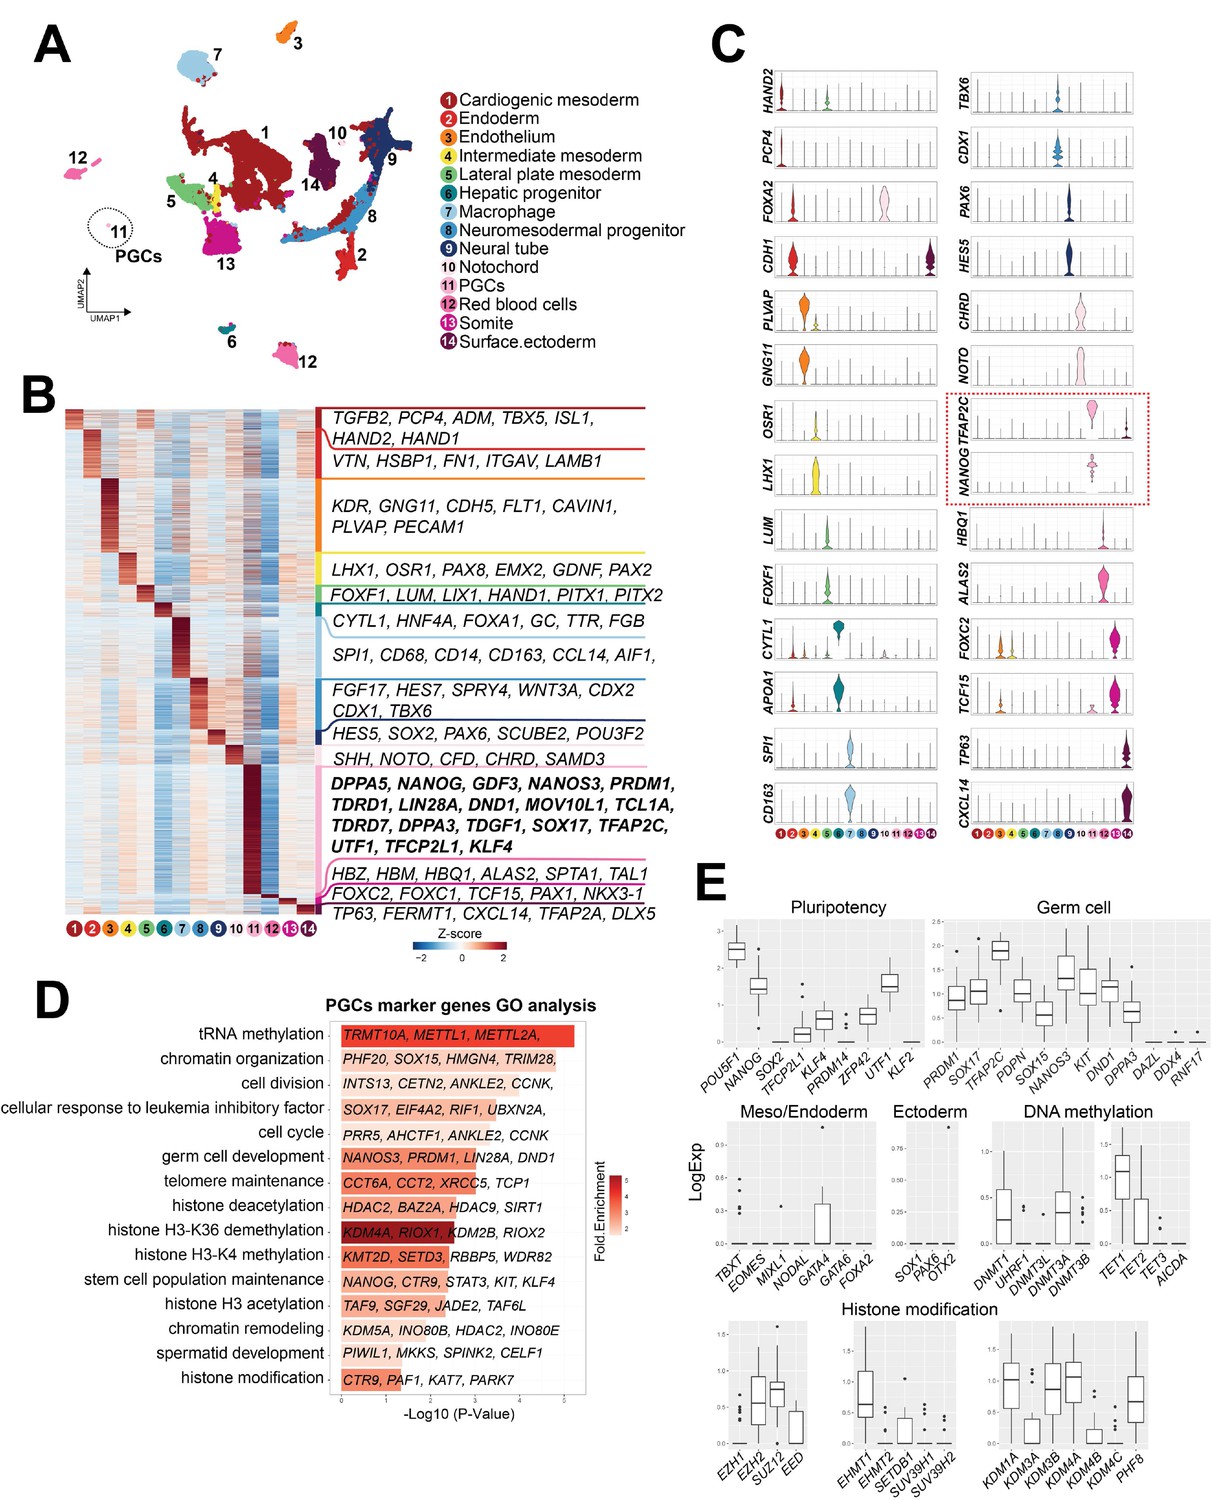
Single-cell transcriptome analyses of Callithrix jacchus primordial germ cells (cjPGCs) at embryonic day (E)50 (Carnegie stage [CS]11).
(A) Uniform manifold approximation and projection (UMAP), showing different cell types in cj embryos at E50. Cell clusters are annotated on the basis of marker genes. A cluster representing cjPGCs is encircled. (B) Heatmap showing differentially expressed genes identified among cell types. DEGs are defined as log2-fold change >0.25, p-value <0.01, and adjusted p-value <0.01. Representative top ranked genes are shown. (C) Key marker genes used for cell type annotation, shown as violin plots with log normalized expression. Violin plots for PGC marker genes are outlined by red dotted lines. (D) Gene ontology enrichment analysis of genes with significantly higher expression in cjPGCs. Bar color denotes enrichment fold changes over background. (E) Boxplot showing expression of key pluripotency-associated genes; germ cell, mesoderm/endoderm, and ectoderm marker genes; and DNA methylation and histone modification-associated genes. Center line, median; box limits, upper and lower quartiles; whiskers, 1.5× interquartile range.
-
Figure 2—source data 1
Differentially expressed genes (DEGs) among cell clusters in Figure 2B.
- https://cdn.elifesciences.org/articles/82263/elife-82263-fig2-data1-v2.xlsx
Figure 3 with 3 supplements
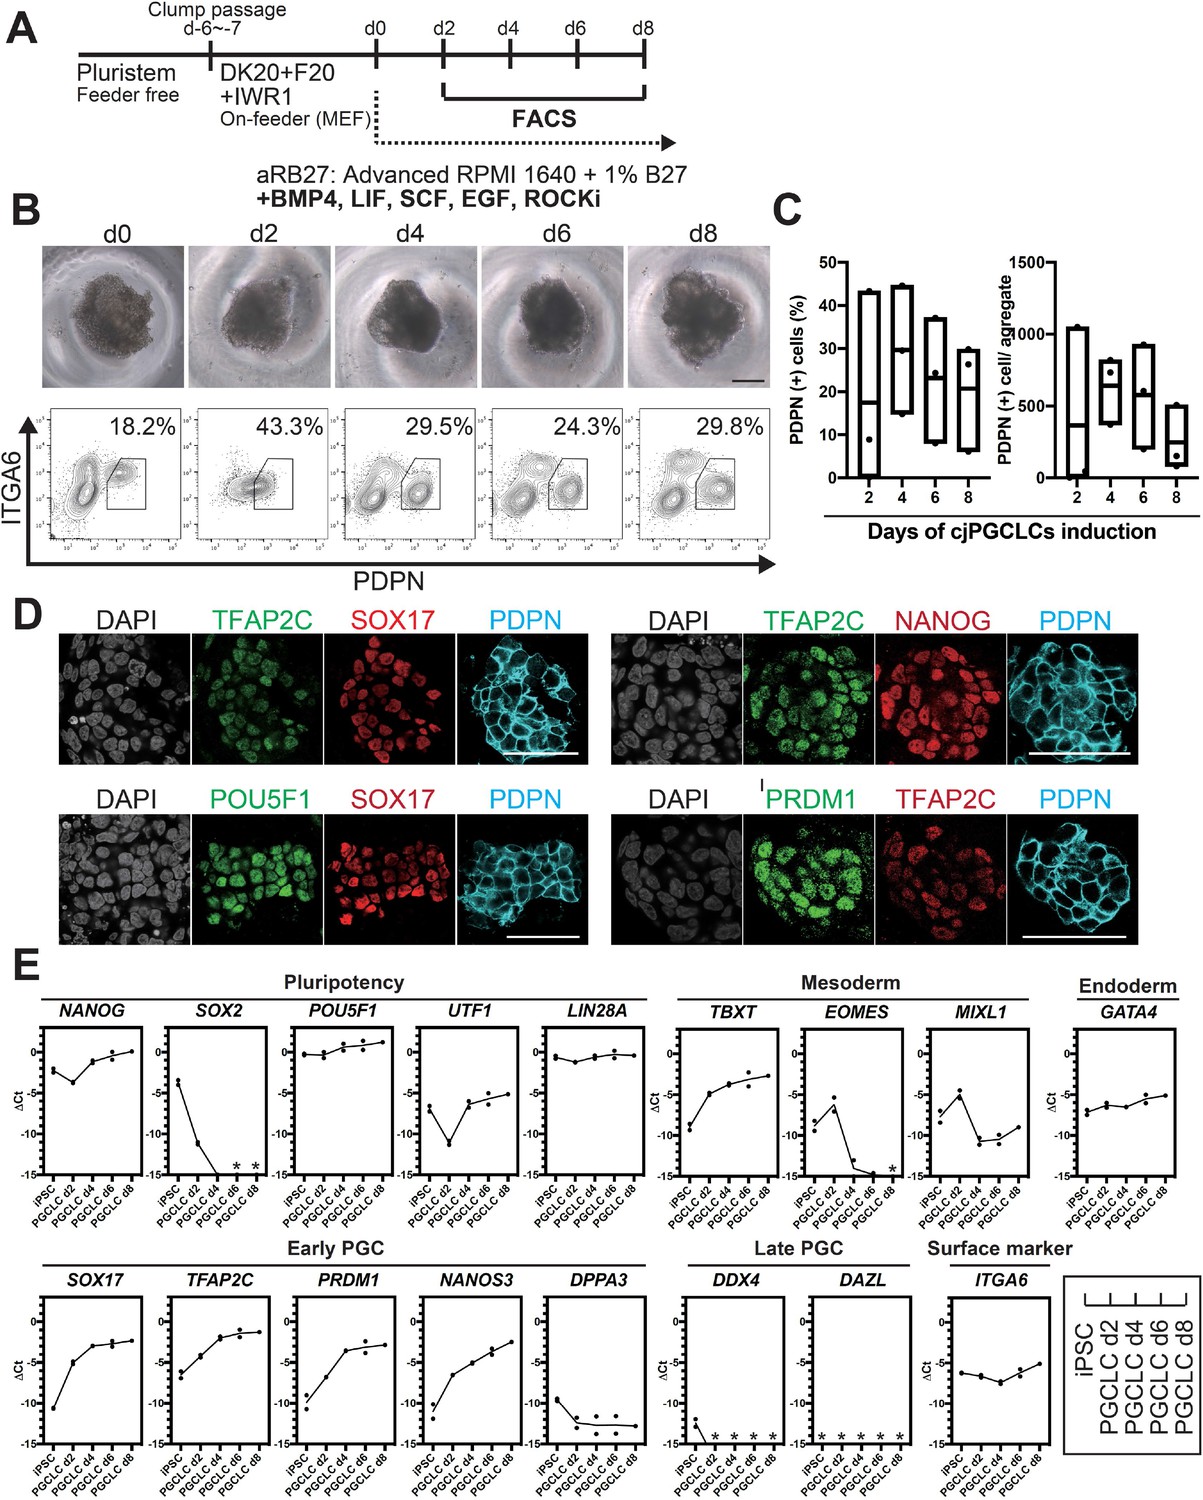
Generation of Callithrix jacchus primordial germ cell-like cells (cjPGCLCs) from cj induced pluripotent stem cells (cjiPSCs).
(A) Scheme for cjPGCLC induction. (B) BF images (top) and fluorescence-activated cell sorting (FACS) plots (bottom) for the floating aggregates of cjiPSCs induced to differentiate into cjPGCLCs. The percentages of PDPN+ITGA6weak+ cells are shown. Scale bars, 200 μm. (C) Boxplot representations of the induction kinetics of PDPN+ITGA6weak+ cells (left, percentages; right, number of cells/aggregate) during PGCLC induction in aRB27. Center line, median; box limits, upper and lower quartiles; whiskers, 1.5× interquartile range. (D) Immunofluorescence (IF) images of floating aggregates after 6 days of PGCLC induction, stained as indicated. Scale bars, 50 μm. (E) Gene expression of cjiPSCs and cjPGCLCs at days 2, 4, 6, and 8, as measured by quantitative PCR (qPCR). For each gene examined, the ΔCt values were derived using the average Ct values of the two housekeeping genes GAPDH and PPIA (set as 0) calculated and plotted for two independent experiments. *Not detected.
Figure 3—figure supplement 1
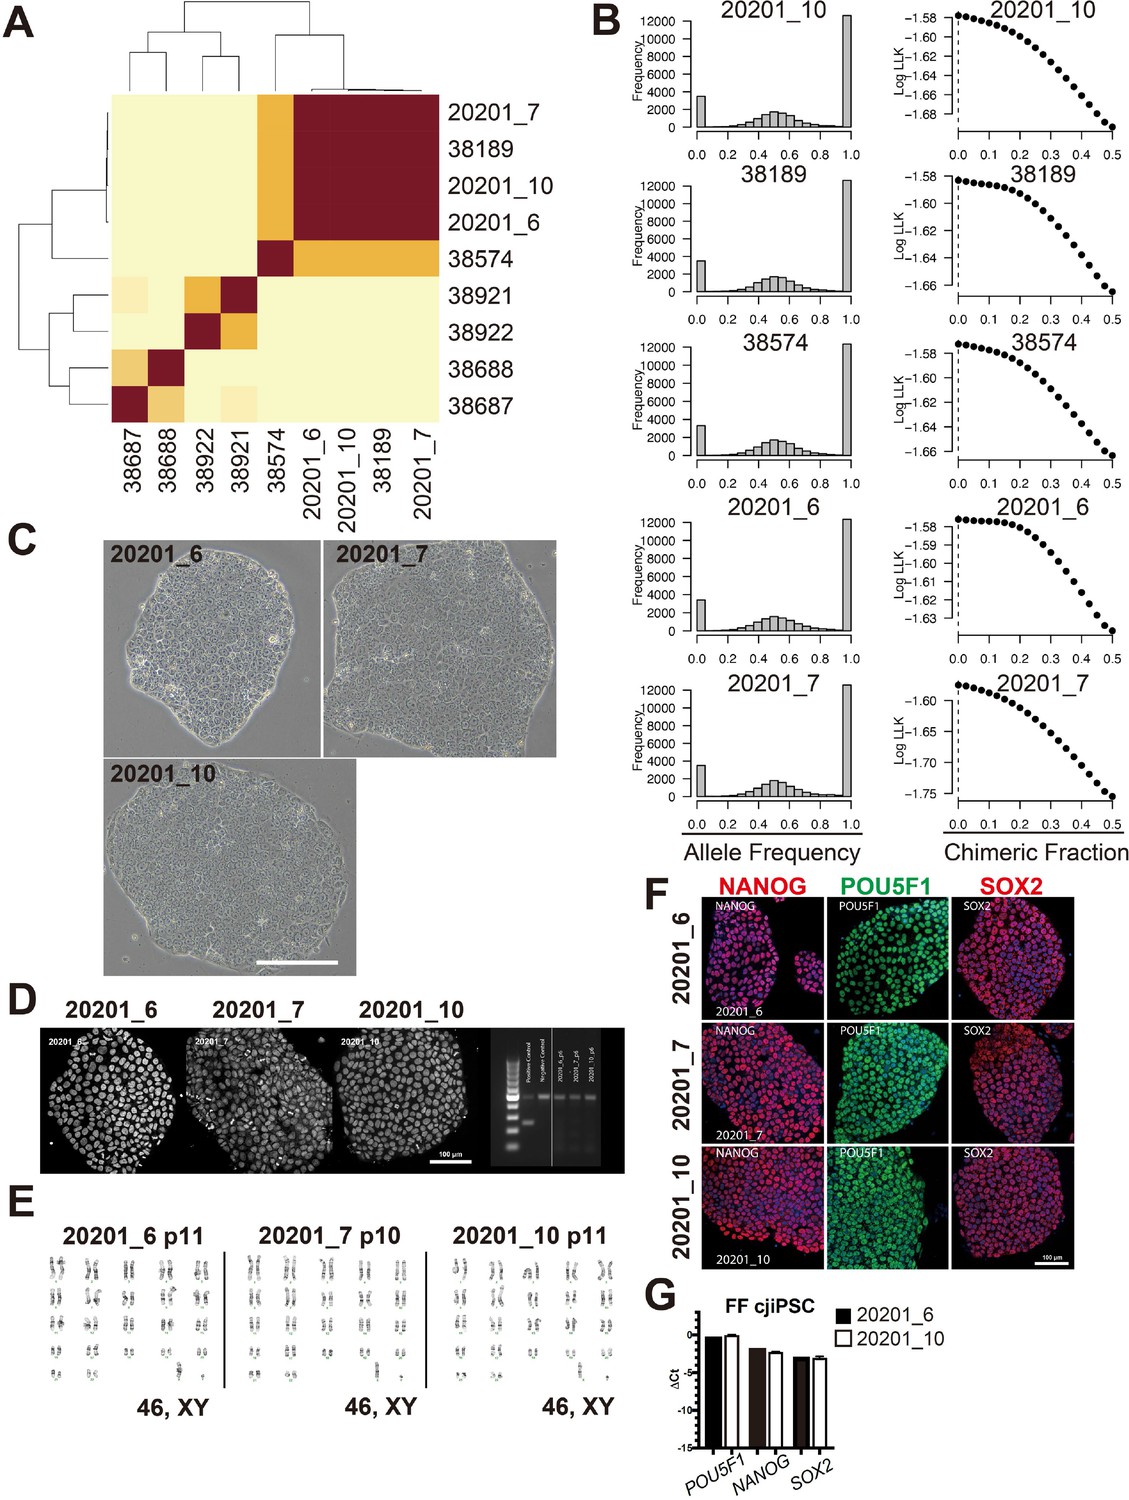
Derivation and feeder free culture of Callithrix jacchus induced pluripotent stem cells (cjiPSCs).
(A) Unsupervised hierarchical clustering (UHC) of exome-sequenced genomic DNA derived from cjiPSCs (20201_6, 20201_7, 20201_10), hair follicles from the donor (38189), his sibling (38574), and unrelated twin pairs (38921/38922 and 38668/38667). Each stem cell lineage closely matched the parental sequence, and a mean of 98.6% of sites were identical in state between the parental and stem cell lineages. In contrast DNA from a sibling of the parental sample shared a mean of 68.0% of sites identical in state to the parental and stem cell lineage samples. (B) Allele frequency distribution (left) and chimeric fractions (right) for exome-sequenced DNA as in (A). No evidence of chimerism was found in any sample examined, and estimates of the chimeric fraction peaked at 0. Direct examination of allele frequencies supported this estimation: all samples showed a peak within-sample allele frequency at approximately 50% (or 0.5). (C) BF images of FF cjiPSCs. Scale bars, 200 μm. (D) (Left) Confocal images of cjiPSC colonies stained with DAPI. Scale bar, 100 μm. (Right) Diagnostic PCR for cjiPSCs, detecting mycoplasma genomic DNA. Positive and negative controls were loaded on the left. Representative cjiPSC karyotyping analysis result, showing a normal karyotype (44, XY). (E) Representative results of G-band karyotype analysis of cjiPSCs (20201_6, 20201_7, and 20201_10). All three clones displayed a normal karyotype (46, XY). (F) Immunofluorescence (IF) images of 20201_6 (top), 20201_7 (middle), and 20201_10 (bottom) for NANOG (red), POU5F1 (green), or SOX2 (red), merged with DAPI (blue). Bar, 100 μm. (G) Pluripotency-associated gene expression of cjiPSCs, as measured by quantitative PCR (qPCR). For each gene examined, the ΔCt from the average Ct values of the two independent housekeeping genes GAPDH and PPIA (set as 0) were calculated and plotted for two independent experiments. Mean ± SD of three technical replicates are shown.
Figure 3—figure supplement 2
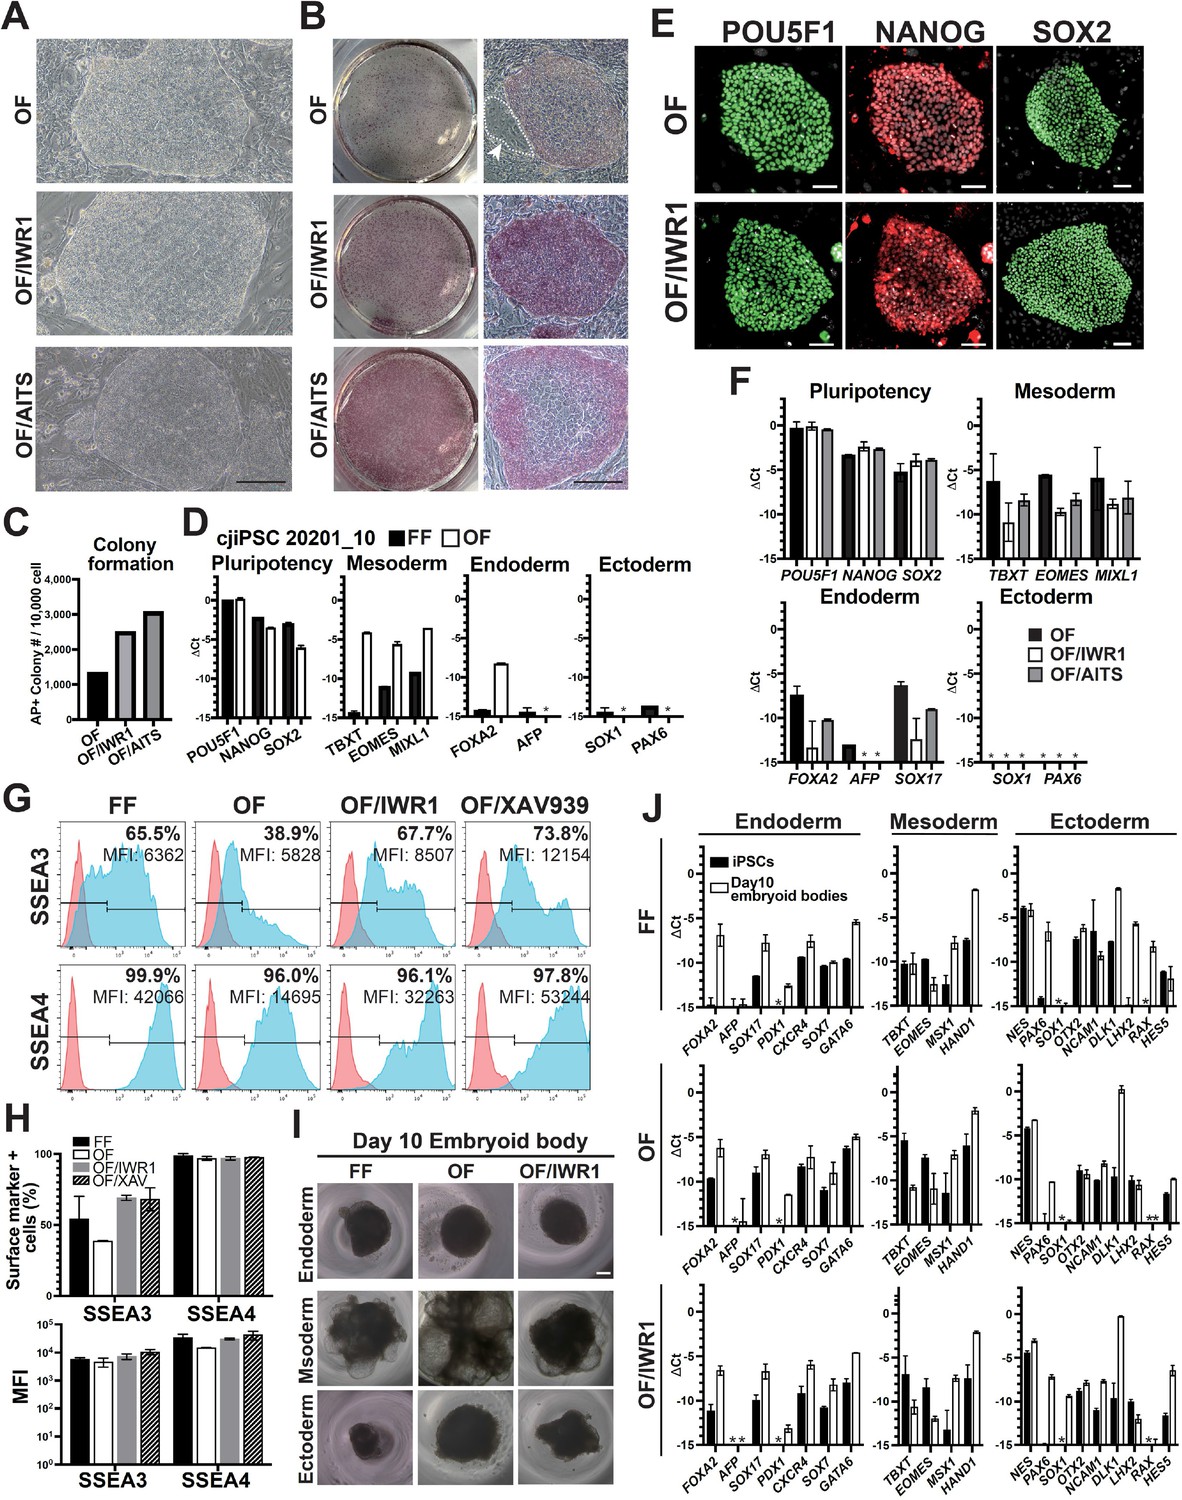
Culture of Callithrix jacchus induced pluripotent stem cells (cjiPSCs) on a feeder layer with an inhibitor of WNT signaling.
(A) BF images of iPSCs cultured under OF, OF/IWR1, or OF/AITS conditions. Scale bars, 200 μm. (B) AP staining images of the indicated cjiPSCs. Scale bars, 200 μm. Arrows indicate areas of differentiation. (C) Colony formation efficiency of cyPSCs cultured under OF, OF/IWR1, or OF/AITS conditions. AP+ colonies were counted after 7 days of culture. (D) Gene expression of 20201_10 cjiPSCs cultured under FF or OF conditions, as measured by quantitative PCR (qPCR). Data represent mean ± SD of two biological replicates. *, not detected. (E) Representative immunofluorescence (IF) images of cjiPSCs cultured under OF or OF/IWR1 conditions stained for POU5F1 (green), NANOG (red), and SOX2 (green), merged with DAPI (white). Scale bars, 100 μm. (F) Expression of pluripotency-associated, mesoderm, endoderm, or ectoderm markers in 20201_10 cjiPSCs cultured under OF, OF/IWR1, or OF/AITS conditions. Data represent mean ± SD of two biological replicates. (G, H) Flow cytometric analyses of SSEA3 or SSEA4 expression on cjiPSCs cultured under indicated conditions. The percentages of positive cells and mean fluorescence intensity (MFI) are shown. Data represent mean ± SD of two biological replicates (H). Red, unstained control; blue, stained samples. (I) Bright field images of d10 embryoid bodies cultured under respective conditions. Scale bar, 200 μm. (J) qPCR of cjiPSCs (FF, OF, OF/IWR1) and embryoid bodies cultured under respective conditions for expression of key markers of endoderm, mesoderm, and ectoderm. Data represent mean of two ± SD of two biological replicates.
Figure 3—figure supplement 3

Induction of Callithrix jacchus primordial germ cell-like cells (cjPGCLCs) from OF, OF/IWR1, or FF cj induced pluripotent stem cells (cjiPSCs).
(A) Schematic of cjPGCLC induction. (B) BF images (inlet) and immunofluorescence (IF) images of d4 aggregates derived from OF or FF cjiPSCs stained for TFAP2C (red) and SOX17 (green), merged with DAPI (white). Scale bar, 100 μm. (C) BF images (top) and fluorescence-activated cell sorting (FACS) analysis (bottom) of the floating aggregates during cjPGCLC induction from OF cjiPSCs. The percentages of PDPN+ITGA6+ cells are shown. Scale bars, 100 μm. (D) Boxplot representations of the induction kinetics of PDPN+ITGA6+ cells (left, percentages; right, number of PDPN+ITGA6+ cells/aggregate) during PGCLC induction with aRB27 medium. Center line, median; box limits, upper and lower quartiles; whiskers, 1.5× interquartile range. (E) IF images of d4 cjPGCLCs, stained as indicated. Scale bars, 50 μm. (F) Gene expression of cjiPSCs and d4 cjPGCLCs, as measured by quantitative PCR (qPCR). Data represent Mean + SD of two biological replicates. *, not detected. (G) FACS analysis of d2 and d4 floating aggregates during cjPGCLC induction from 202001_6 OF/IWR1 cjiPSCs. The percentages of PDPN+ITGA6+ cells are shown. (H) FACS analysis of d4 and d6 floating aggregates during cjPGCLC induction from OF/IWR1 20201_10 cjiPSCs maintained by single-cell passaging. The percentages of PDPN+ITGA6+ cells are shown.
Figure 4
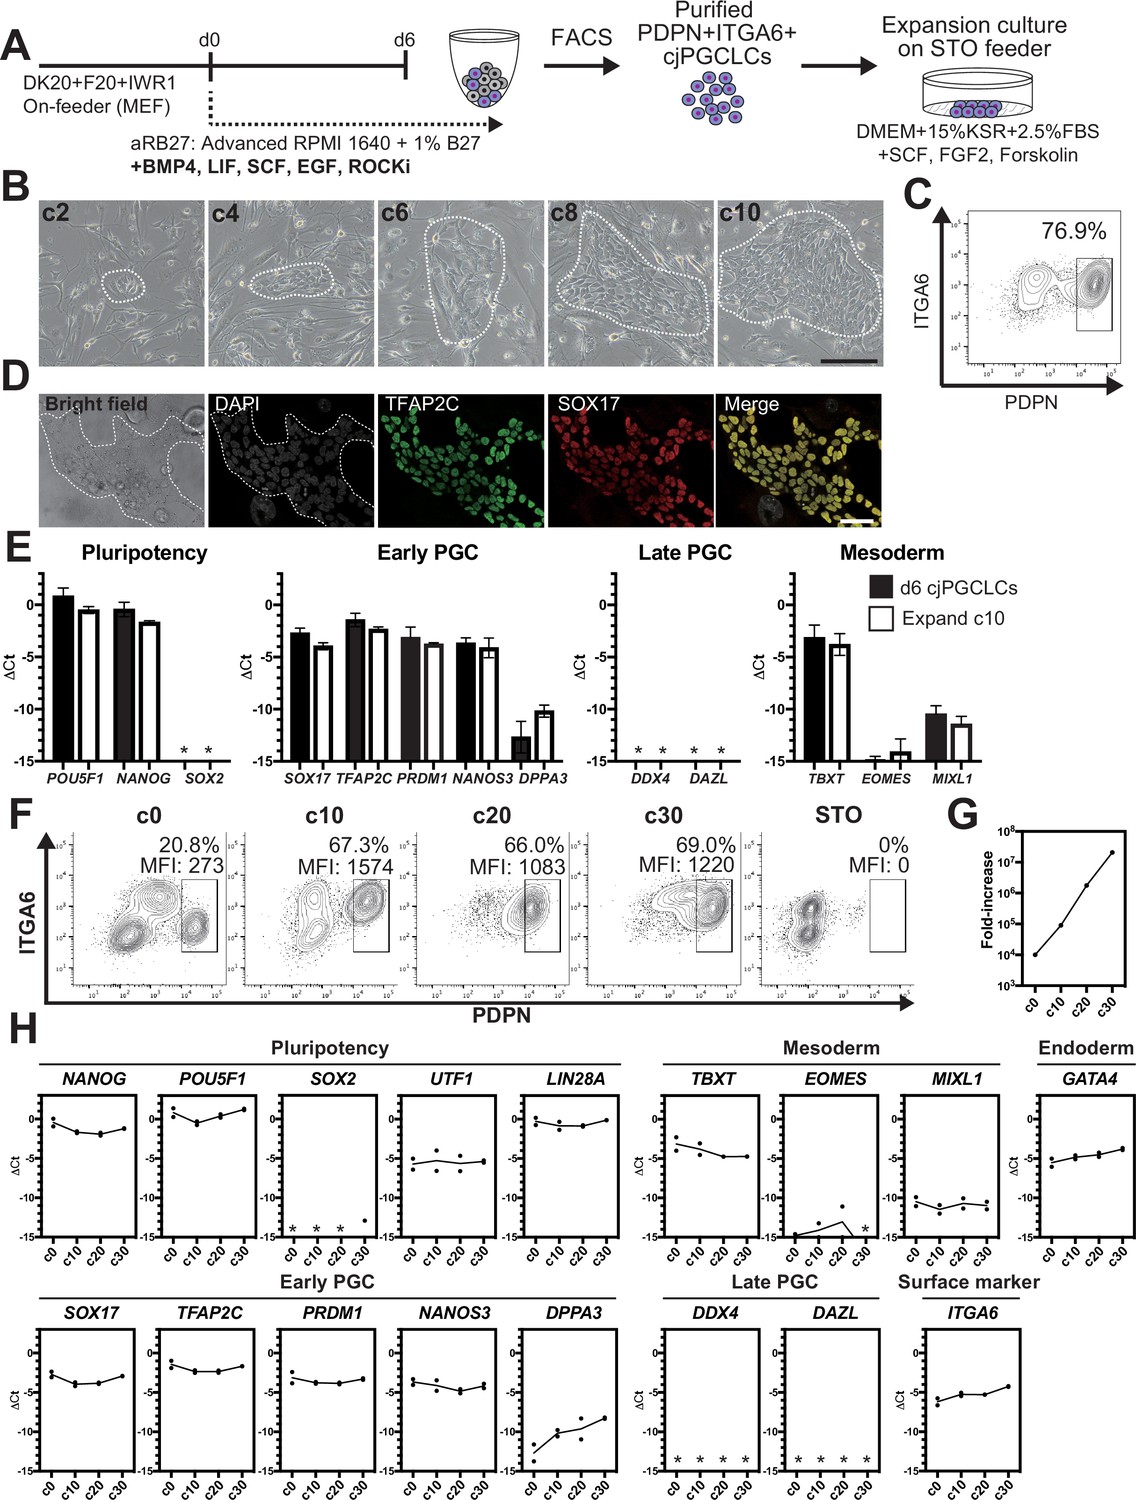
2D expansion culture of Callithrix jacchus primordial germ cell-like cells (cjPGCLCs).
(A) Scheme for expansion culture of cjPGCLCs. (B) BF images of c2, c4, c6, c8, and c10 colonies of cjPGCLCs. The white dashed lines highlight colonies of cjPGCLCs. Scale bars, 200 μm. (C) Fluorescence-activated cell sorting (FACS) analysis of c10 expansion cultures of cjPGCLCs. The percentage of PDPN+ITGA6 + cells is shown. (D) Immunofluorescence (IF) images of expansion culture day 10 (c10) cjPGCLCs for DAPI (white), TFAP2C (green) and SOX17 (red), and the merged image. Scale bars, 50 μm. (E) Gene expression of d6 cjPGCLCs and c10 cjPGCLCs, as measured by quantitative PCR (qPCR). For each gene examined, the ΔCt values from the average Ct values of the two housekeeping genes GAPDH and PPIA (set as 0) were calculated and plotted for two independent experiments. *, not detected. (F) FACS analyses of c0 (d6 cjPGCLCs), c10, c20, c30, and c40 cjPGCLCs. The percentages and mean fluorescence intensity (MFI) of PDPN+ITGA6 + cells are shown. (G) Growth curve of PDPN+ITGA6+ cells during cjPGCLC expansion culture until c30. A total of 10,000 PDPN+ITGA6weak+ d6 PGCLCs were used as a starting cell population. (H) qPCR analyses of the expression of the indicated genes during cjPGCLC expansion culture. Mean values are connected by a line. *, not detected.
Figure 5

Maturation of Callithrix jacchus primordial germ cell-like cells (cjPGCLCs) into a DDX4+ prospermatogonia-like state.
(A) Scheme for xrTestis culture. ALI, air-liquid interphase; xrTestis, xenogeneic reconstituted testis; mGSOs, mouse gonadal somatic cells derived from E12.5 mouse embryonic testes depleted of endogenous germ cells. (B) Bright field images of d15 and d30 xenogeneic reconstituted testes (xrTestes) ALI culture. Bar, 200 μm. (C) (Left) Immunofluorescence (IF) images of d15 (left) xrTestes, showing expression of the indicated key PGC markers (TFAP2C, POU5F1, and NANOG [green]), somatic cell markers (SOX9, Sertoli cell marker [red]; NR2F2, interstitial cell marker [green]), or a gonadal stage germ cell marker, DDX4 (cyan). (D) IF images of d30 xrTestes, indicating expression of the key primate PGC markers (TFAP2C, POU5F1, SOX17), a mouse PGC marker (SOX2), prospermatogonial markers (DDX4, DAZL) or somatic cell markers (NR2F2, SOX9). Merged images with DAPI are shown on the right. Scale bars, 50 μm.
Figure 6 with 2 supplements
Transcriptome accompanying formation of Callithrix jacchus primordial germ cell-like cells (cjPGCLCs).
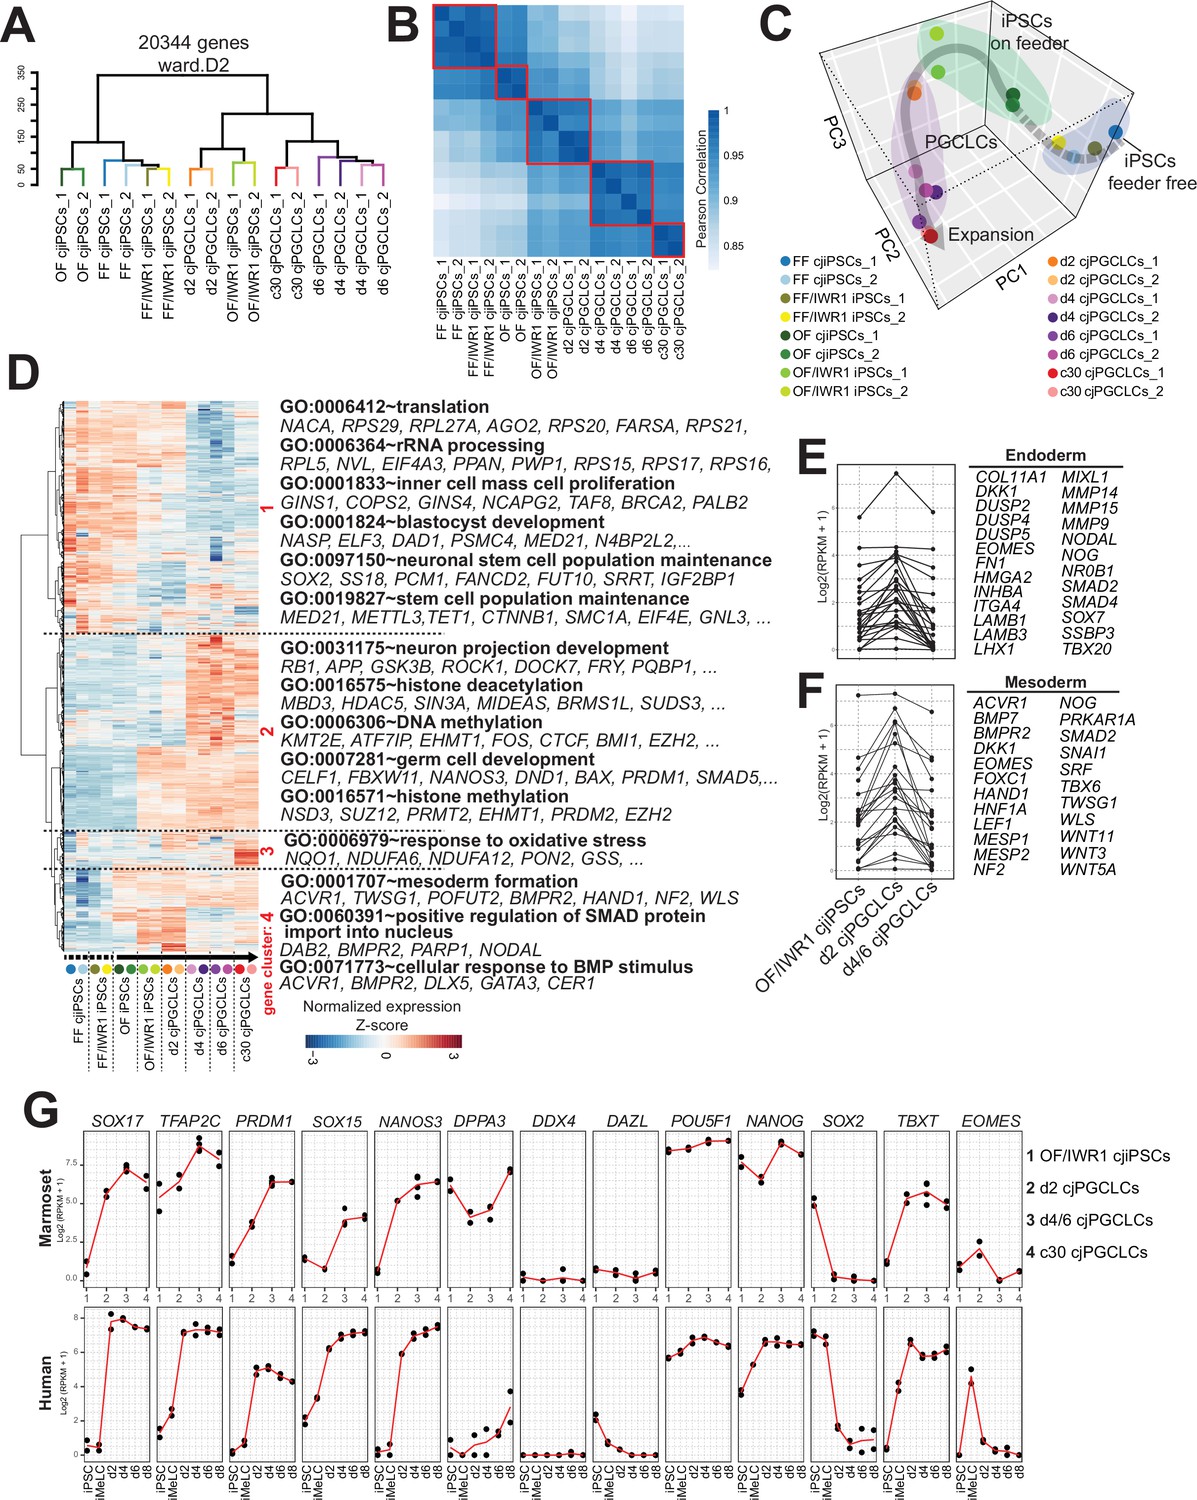
(A) Unsupervised hierarchical clustering (UHC) of the transcriptomes of all samples by using ward.D2. (B) Pearson correlation of samples as in (A). Highly correlated samples are encircled with red lines. (C) Principal component analysis (PCA) of the samples used in this study. The gray arrow represents a trajectory for cjPGCLC specification. (D) UHC of the top 5000 variably expressed genes among samples, which are largely divided into four gene clusters (highlighted in red, roughly categorized as: 1, genes higher in cjiPSCs; 2, genes higher in cjPGCLCs; 3, genes higher in expansion culture cjPGCLCs; 4, genes higher in d2 cjPGCLCs). The gene expression level is represented by a heatmap. Samples were aligned along the estimated trajectory as defined in (C). Gene expression is row scaled with colors indicating the Z-score. Enriched gene ontology (GO) terms and representative genes in each gene cluster are labeled beside the heatmap. (E, F) Expression of endoderm (E) or mesoderm (F) genes during the transition of OF/IWR1 cjiPSCs to d4/6 cjPGCLCs. These genes were selected according to GO terms (GO:0001706, endoderm formation; GO:0001707, mesoderm formation). (G) Gene expression dynamics during cjPGCLC induction and c30 expansion culture, as measured by quantitative PCR (qPCR) (top). For comparison, gene expression dynamics during human PGCLC induction is also shown (bottom). During induction of cjPGCLCs in vitro, key genes showed expression patterns similar to those seen during human PGCLC induction (Sasaki et al., 2015). Expression is normalized by log2(RPKM + 1).
-
Figure 6—source data 1
Top 5000 variably expressed genes among transcriptomes of different types of cells in Figure 6D.
- https://cdn.elifesciences.org/articles/82263/elife-82263-fig6-data1-v2.xlsx
Figure 6—figure supplement 1

Transcriptomic dynamics associated with Callithrix jacchus primordial germ cell-like cell (cjPGCLC) induction.
(A) Expression levels of bulk RNA-seq for all samples, normalized by log2(RPKM + 1). Center line, median; box limits, upper and lower quartiles; whiskers, 1.5× interquartile range. Highly concordant median and upper/lower quantile values for overall gene expression ensured the quality of the cDNA library. (B) Scatter plot comparing average gene expression levels between FF cjiPSCs and FF/IWR1 cjiPSCs. The two samples were highly correlated with no differentially expressed genes (DEGs) identified (r2=0.9981). (C) (Left) Heatmap of gene expression data associated with pre-implantation (145 genes) or post-implantation epiblasts (210 genes) previously identified in cynomolgus monkey embryos in the indicated cjiPSCs (Nakamura et al., 2016). (Right) Expression of representative markers of naïve, primed, or core pluripotency genes, isolated from the gene lists on the left, and key PGC markers. Colors indicate log2(RPKM + 1) normalized expression. (D) Scatter plots showing averaged values of DEGs between the indicated samples. DEGs (log2 fold change >1, p-value <0.05, FDR <0.05) are highlighted in colors. Key genes are annotated. Representative genes and their gene ontology (GO) enrichments for DEGs are shown at right. (E, F) Expression of genes upregulated in OF cjiPSCs (vs. FF cjiPSCs) or in OF/IWR1 cjiPSCs (vs. OF cjiPSCs) in d2 cjPGCLCs. Scatter plot shows the average values of DEGs between the indicated samples. DEGs upregulated in OF cjiPSCs vs. FF cjiPSCs (red, 759 genes) (E) or upregulated in OF/IWR1 cjiPSCs vs. OF cjiPSCs (green, 1501 genes) (F) are highlighted.
-
Figure 6—figure supplement 1—source data 1
Differentially expressed genes (DEGs) from pairwise comparisons in Figure 6—figure supplement 1D.
- https://cdn.elifesciences.org/articles/82263/elife-82263-fig6-figsupp1-data1-v2.xlsx
Figure 6—figure supplement 2

Dynamics of key marker gene expression associated with Callithrix jacchus primordial germ cell-like cell (cjPGCLC) induction.
Dynamics of the expression of key genes during cjPGCLC induction and expansion culture, as measured by quantitative PCR (qPCR).
Figure 7 with 2 supplements
scRNA-seq revealed lineage trajectory and gene expression dynamics during formation of Callithrix jacchus primordial germ cell-like cells (cjPGCLCs).
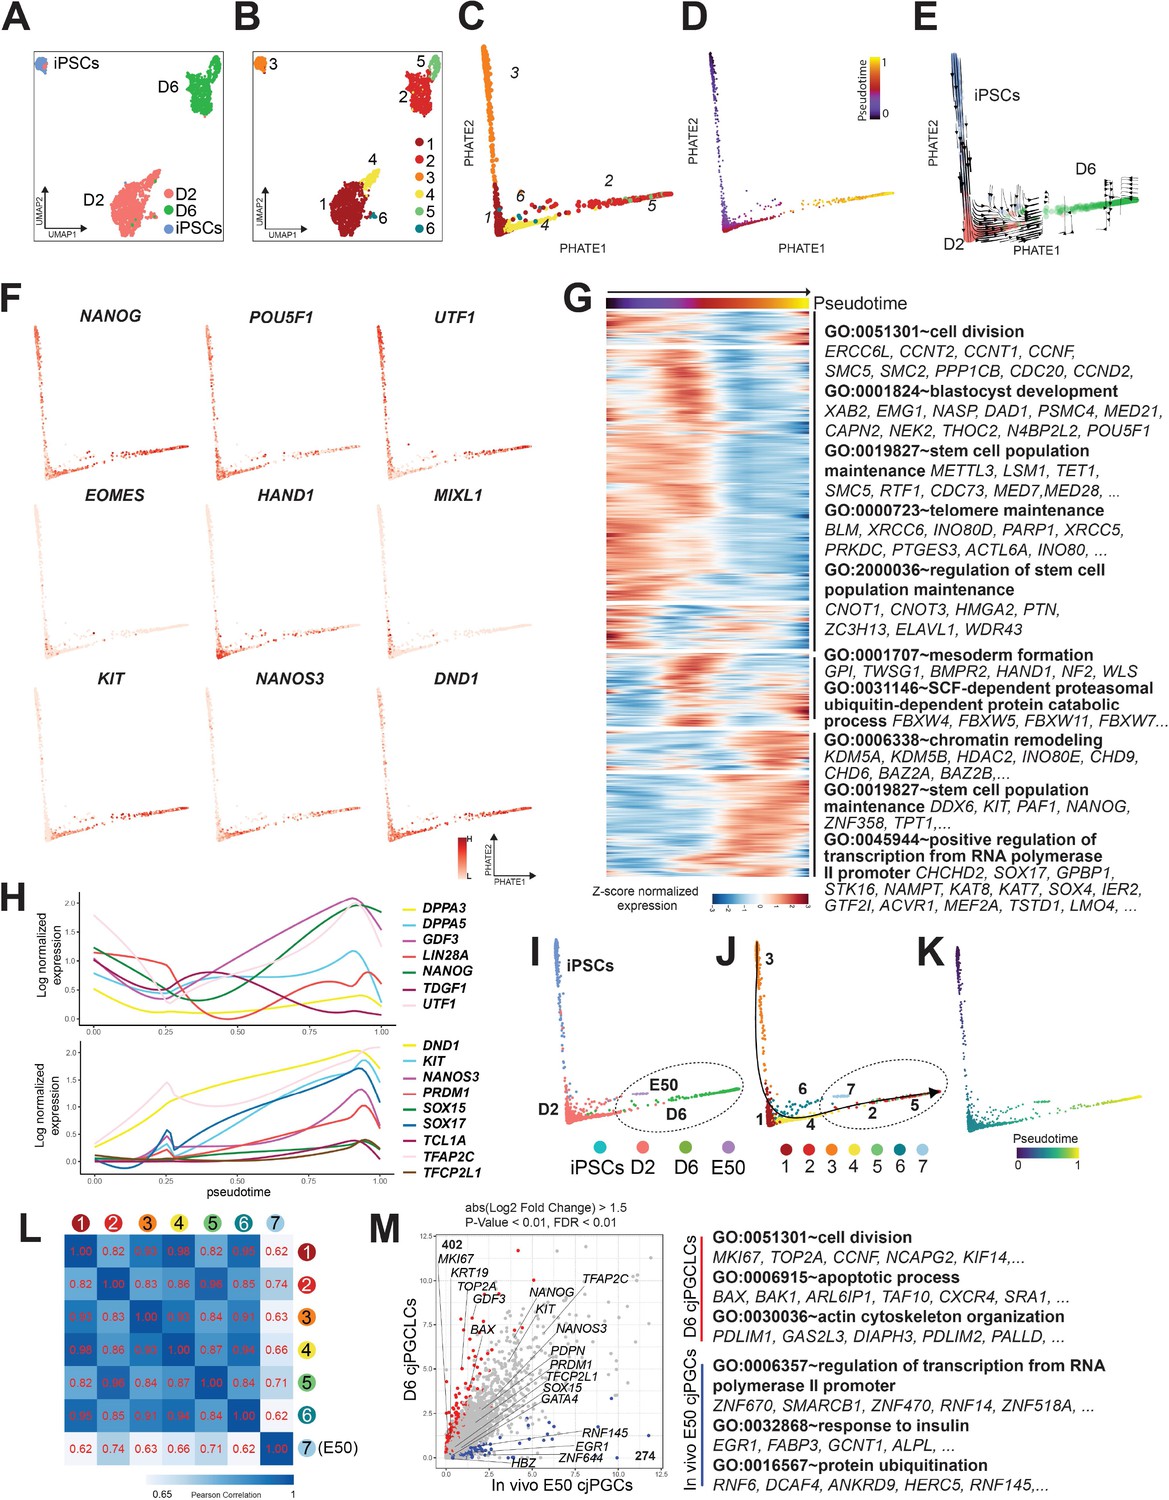
(A, B) Uniform manifold approximation and projection (UMAP) plots showing all cells annotated as ‘pluripotent/germ’ defined in Figure 7—figure supplement 1B, colored according to sample origin (A) or subclusters (clusters 1–6) (B). (C, D) Trajectory analysis of transcriptomes as in (B) projected to PHATE embedding. Cells were colored according to cell clusters (C) or pseudotime (D). (E) PHATE embedding of transcriptomes as in (C) with overlaid RNA velocity. Cells were colored according to sample origin. (F) Expression of key pluripotency-associated genes (top), mesodermal genes (middle), or germ cell markers (bottom) projected on PHATE embedding as in (C). (G) Transcriptome dynamics along the pseudotime trajectory as in (D). The top 5000 highly variable genes are hierarchically clustered with three different patterns along pseudotime. Enriched gene ontology (GO) terms are listed at right. Each row is a gene, and each column is a cell ordered by pseudotime. Expression is log normalized and scaled by row. (H) Expression dynamics of key pluripotency-associated genes (top) or germ cell marker/specifier genes (bottom) aligned along pseudotime as in (D). (I–K) Trajectory analysis of transcriptomes as in (B) combined with those of E50 cjPGCs projected on PHATE embedding, colored according to sample origin (I), cell cluster (J), or pseudotime (K). Cluster 7 consists exclusively of E50 cjPGCs. (L) Pearson correlation of transcriptomes of E50 cjPGCs (cluster 7) and other in vitro-derived clusters (clusters 1–6) as in (B). (M) Scatter plot comparison of the averaged expression values of differentially expressed genes (DEGs) between E50 cjPGCs (cluster 7) and d6 cjPGCLCs (clusters 2/5). DEGs are defined as log2 fold change above 1.5 (p-value <0.01 and FDR <0.01). Over-represented GO terms and representative genes in each GO category are shown on the right.
Figure 7—figure supplement 1
Single-cell transcriptomes during Callithrix jacchus primordial germ cell-like cell (cjPGCLC) induction.
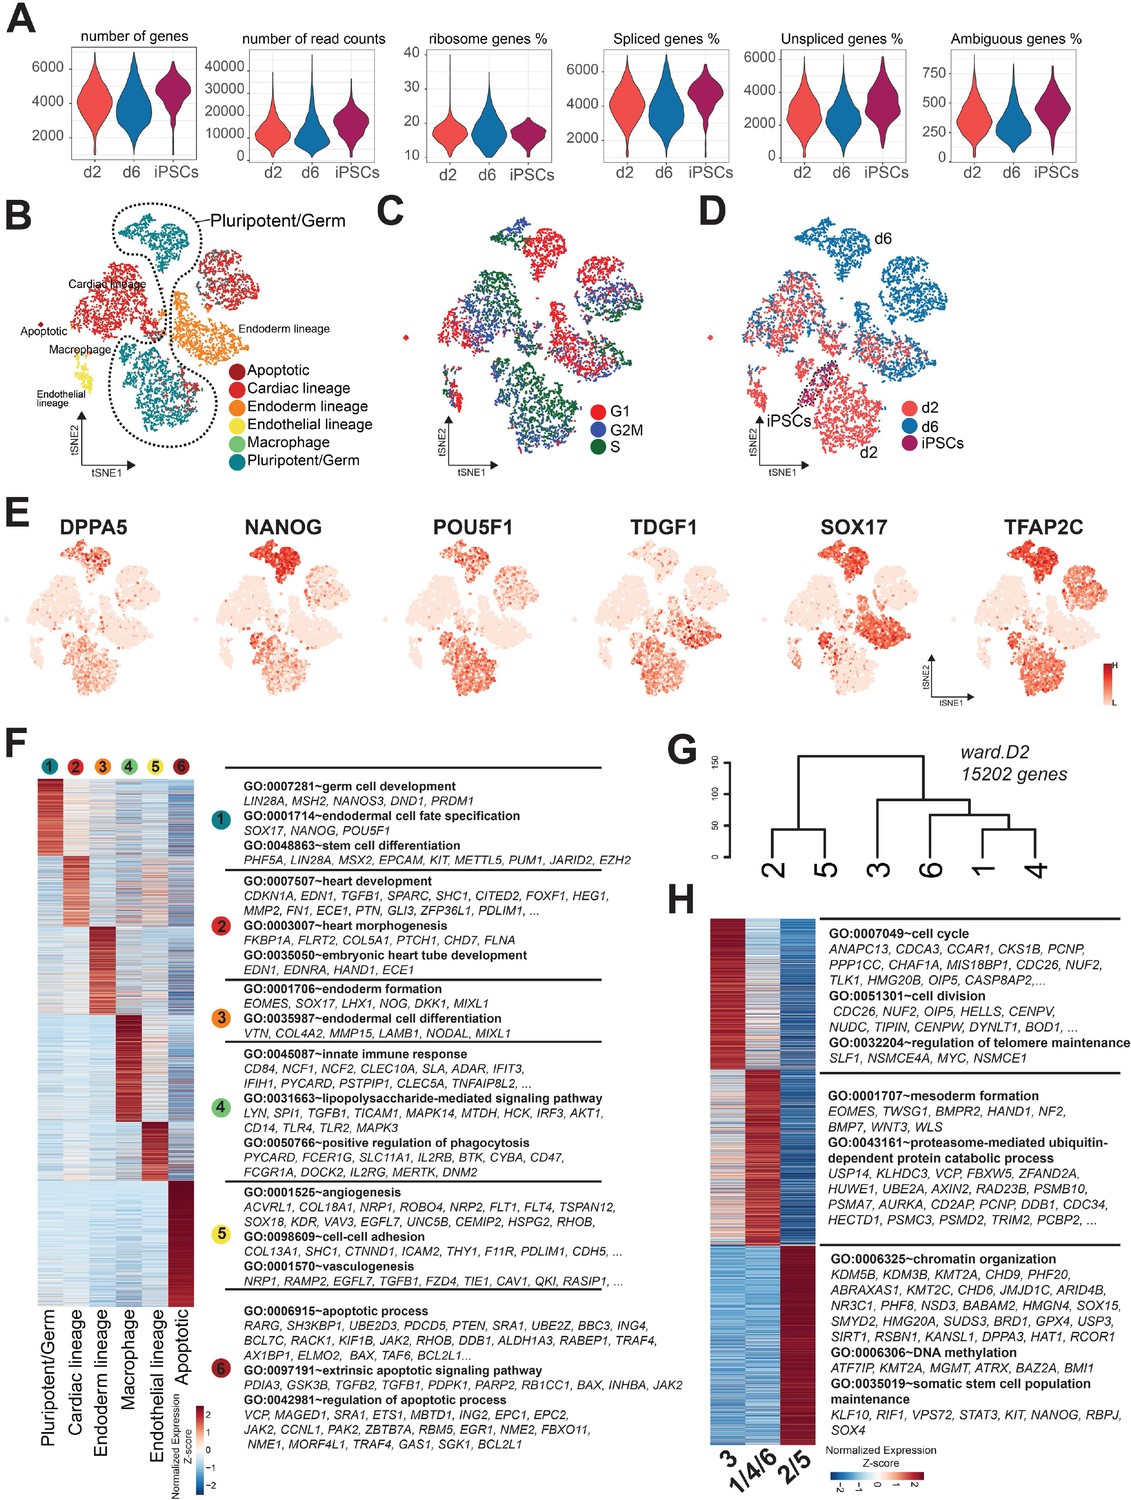
(A) Quality control analyses of all in vitro samples. (B–D) t-Distributed stochastic neighbor embedding (tSNE) plot of aggregated samples. Each dot represents a single cell, colored according to cell clusters (B), cell cycle scoring (C), or sample origin (D). Cell clusters are annotated on the basis of marker genes and colored accordingly. (E) Expression of key pluripotency/germline markers projected on tSNE plot defined in (B). (F) Heatmap of differentially expressed genes (DEGs) (log2 fold change >0.25, p-value <0.01, FDR <0.01) among the cell clusters defined in (B) (1, pluripotent/germ; 2, cardiac lineage; 3, endoderm lineage; 4, macrophage; 5, endothelial lineage; 6, apoptotic). Representative genes and gene ontology (GO) terms are listed at right. (G) Dendrogram showing hierarchical cluster analysis of pseudobulk transcriptomes of respective cell clusters as defined in Figure 7B. Subclusters of the cluster annotated as ‘pluripotent/germ’ in (B). Cell clusters are ordered by ward.D2 using all expressed genes. (H) Heatmap showing the averaged expression values of the DEGs (log2 fold change >0.25, p-value <0.01, FDR <0.01) identified from a multi-group comparison among cluster 3 (cjiPSCs), cluster 1/4/6 (d2 cjPGCLCs), and cluster 2/5 (d6 cjPGCLCs), sorted based on the dendrogram clustering in (G). Enriched GO terms and representative DEGs are shown on the right.
Figure 7—figure supplement 2
Comparison of primordial germ cell-like cells (PGCLCs) between humans and marmosets.
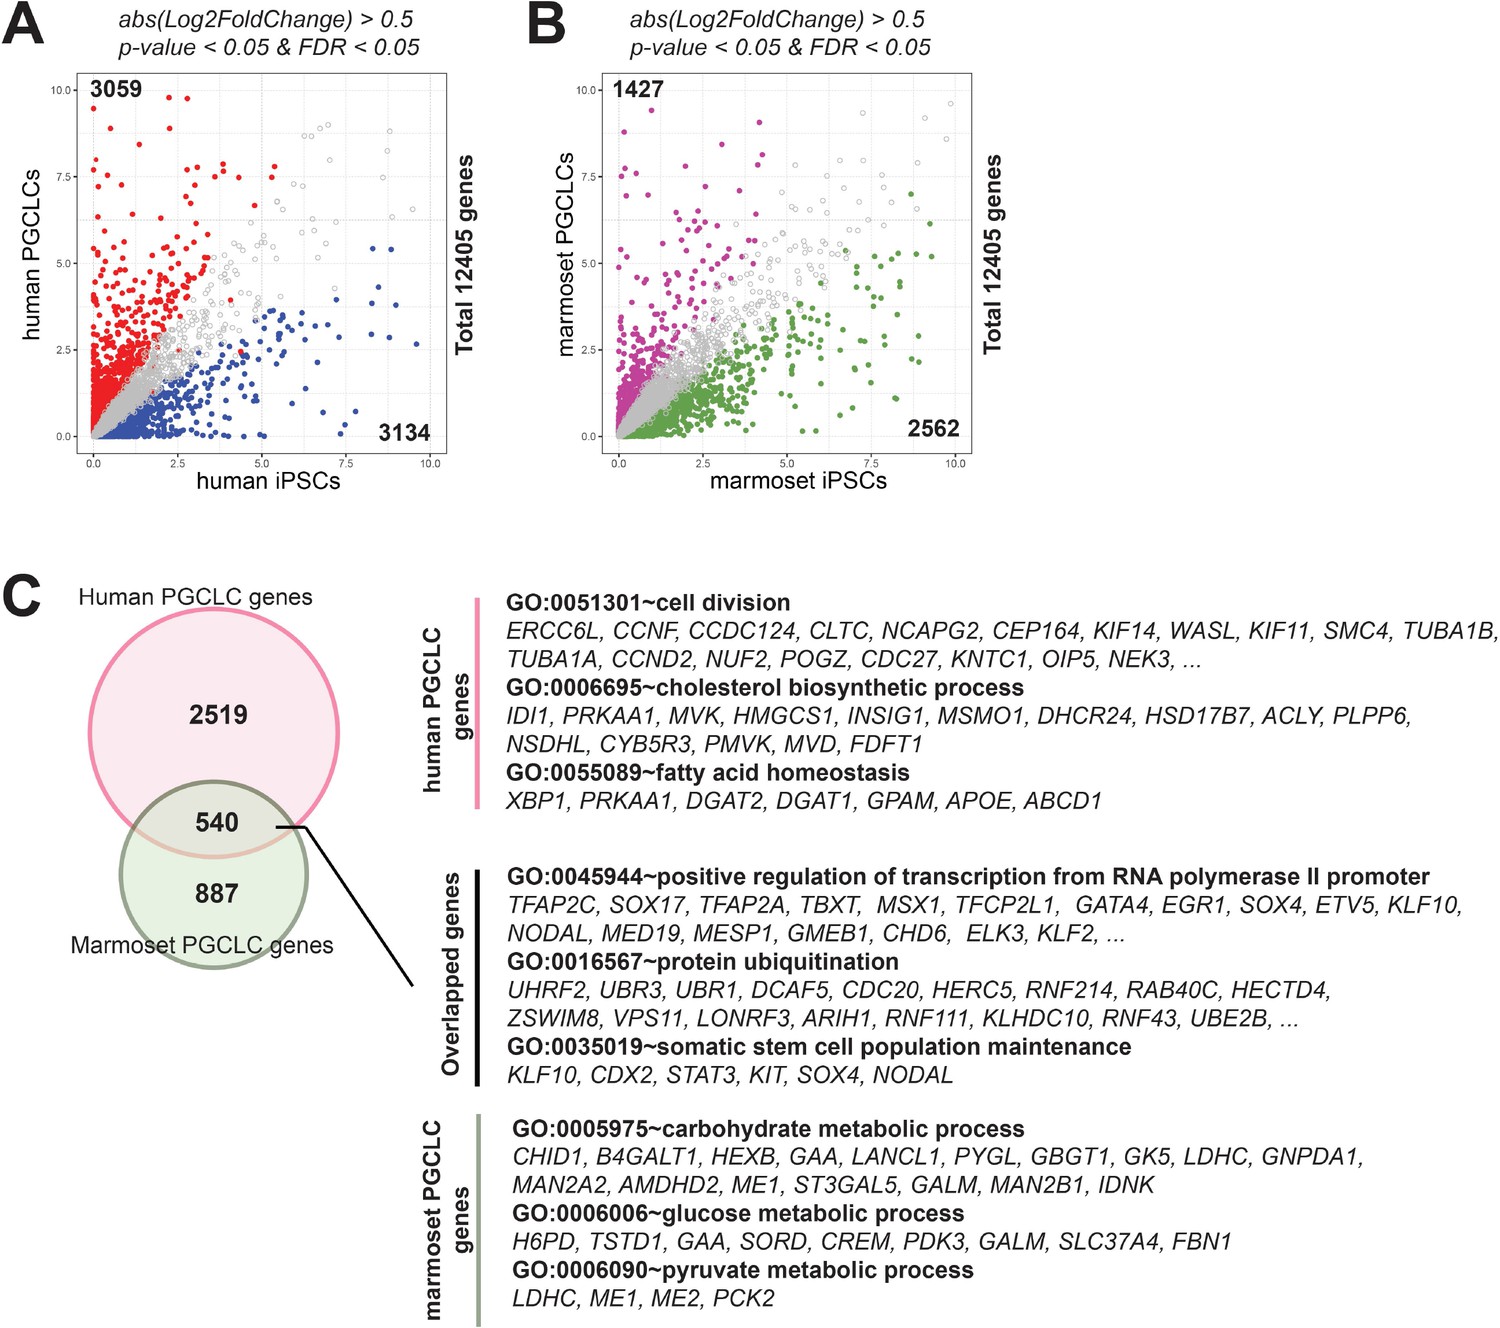
(A, B) Scatter plot showing differentially expressed genes (DEGs) between induced pluripotent stem cell (iPSCs) and PGCLCs in humans (A) or marmosets (B). DEGs are defined as log2 fold change above 0.5, p-value <0.05 and FDR <0.05. (C) Venn diagram showing the overlap of DEGs upregulated in PGCLCs (PGCLC genes, defined in [A] and [B]) in humans and marmosets. Enriched gene ontology terms and representative PGCLC genes specific to humans (2519 genes, top), marmosets (887 genes, bottom), or conserved in both species (540 genes, middle).
Figure 8
Genome-wide DNA methylation in Callithrix jacchus primordial germ cell-like cells (cjPGCLCs).
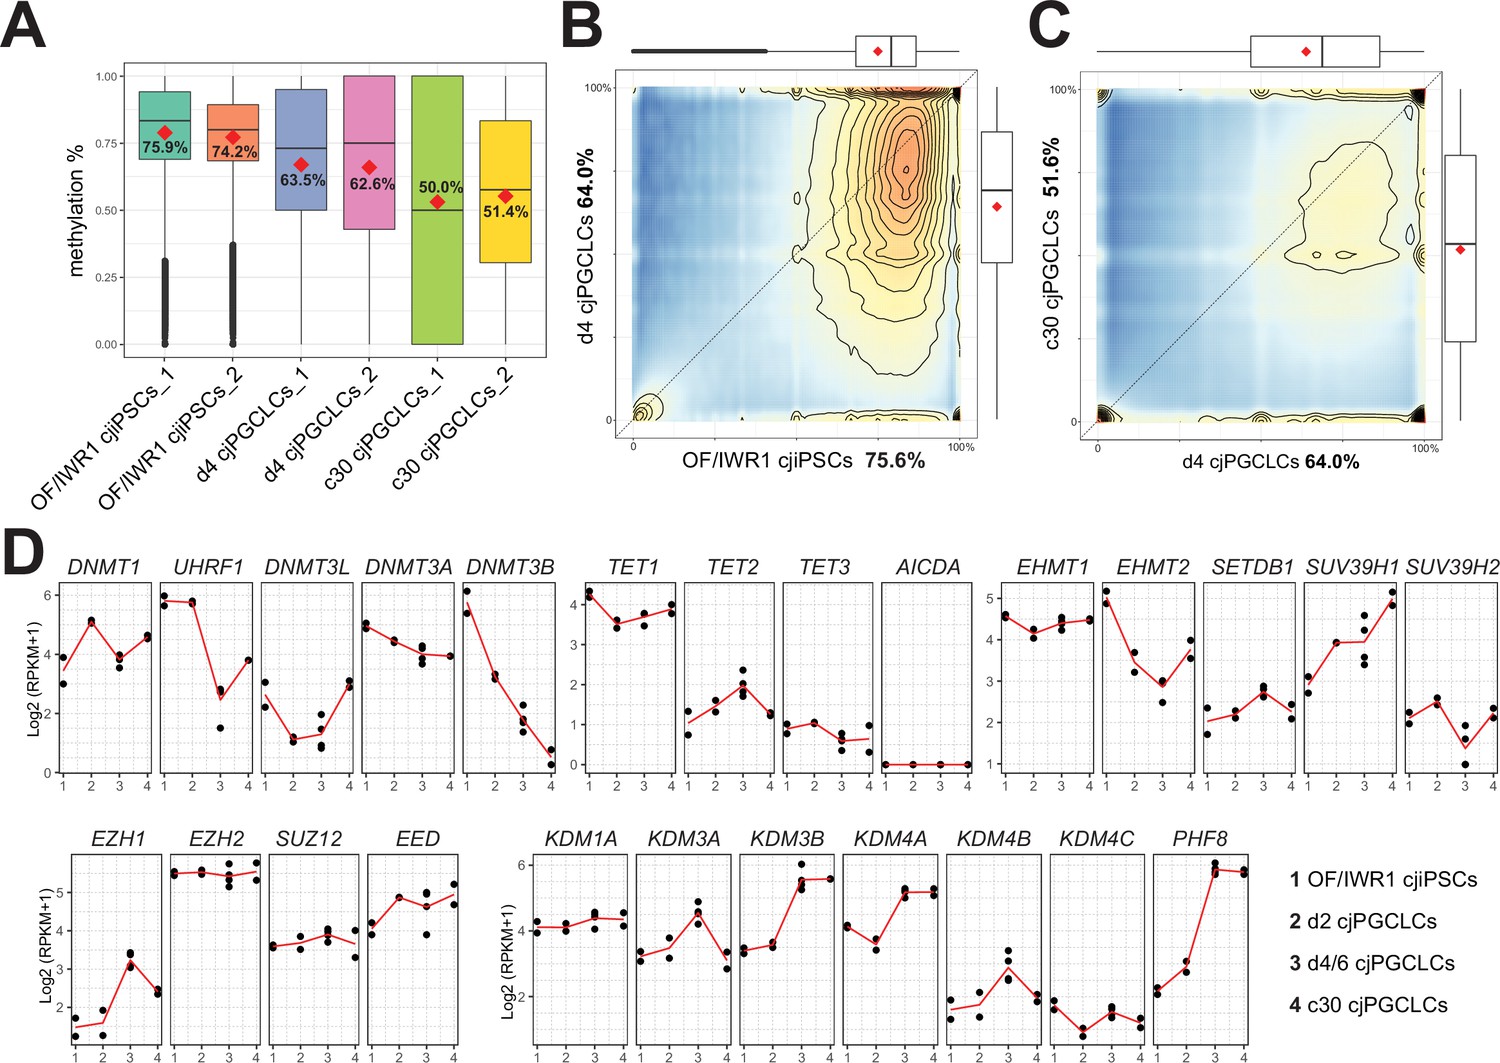
(A) Boxplot showing overall CpG DNA methylation levels. Mean DNA methylation levels (red diamonds) are labeled. Center line, median; box limits, upper and lower quartiles; whiskers, 1.5× interquartile range. (B, C) DNA methylation levels of 2 kb tiles comparing genomes of OF/IWR1 cjiPSCs and d4 cjPGCLCs (B), or d4 PGCLCs and c30 cjPGCLCs (C). Mean methylation levels are labeled in the axis titles, and boxplots show the first and third quartiles and median methylation levels. (D) Gene expression dynamics during cjPGCLC induction and c30 expansion culture for genes associated with DNA methylation and histone modifications. Expression is shown as log2(RPKM + 1).
Tables
Appendix 1—key resources table
| Reagent type (species) or resource | Designation | Source or reference | Identifiers | Additional information |
|---|---|---|---|---|
| Cell line (Callithrix jacchus) | 20201_6 (cjiPSC line) | This paper | Reprogrammed from PBMCs (Donor ID: 38189) | |
| Cell line (Callithrix jacchus) | 20201_7 (cjiPSC line) | This paper | Reprogrammed from PBMCs (Donor ID: 38189) | |
| Cell line (Callithrix jacchus) | 20201_10 (cjiPSCs line) | This paper | Reprogrammed from PBMCs (Donor ID: 38189) | |
| Cell line (Mus musculus) | STO | American Type Culture Collection | 1503 | Feeder for cjPGCLCs expansion |
| Biological sample (Callithrix jacchus) | 38189 | This paper | Hair follicles from the donor 38189 (sibling of 38574) | |
| Biological sample (Callithrix jacchus) | 38574 | This paper | Hair follicles from the donor 38574 (sibling of 38189) | |
| Biological sample (Callithrix jacchus) | 38921 | This paper | Hair follicles from the donor 38921 (twin sibling of 38922) | |
| Biological sample (Callithrix jacchus) | 38922 | This paper | Hair follicles from the donor 38922 (twin sibling of 38921) | |
| Biological sample (Callithrix jacchus) | 38667 | This paper | Hair follicles from the donor 38667 (twin sibling of 38668) | |
| Biological sample (Callithrix jacchus) | 38668 | This paper | Hair follicles from the donor 38668 (twin sibling of 38667) | |
| Biological sample (Callithrix jacchus) | cj embryos (E50, Carnegie stage 11) | This paper | Triplet embryos freshly isolated by hysterectomy | |
| Biological sample (Callithrix jacchus) | cj fetal testis | This paper | Freshly isolated testis from cj fetus at gestational week 19 | |
| Biological sample (Callithrix jacchus) | cj neonatal testis | This paper | Freshly isolated testis from a neonate | |
| Biological sample (Mus musculus) | Mouse fetal testicular somatic cells (E12.5) | This paper | Used for xrTestis culture | |
| Biological sample (Mus musculus) | Mouse embryonic fibroblast | This paper | Isolated from E12.5 mouse embryo, used as feeder cells for cjiPSCs culture | |
| Antibody | Anti-TFAP2C (mouse monoclonal) | Santa Cruz Biotechnology | sc-12762; RRID:AB_667770 | IF (1:200) |
| Antibody | Anti-SOX17 (goat polyclonal) | Neuromics | GT15094; RRID:AB_2195648 | IF (1:150) |
| Antibody | Anti-OCT3/4 (mouse monoclonal) | Santa Cruz Biotechnology | sc-5279; RRID:AB_628051 | IF (1:150) |
| Antibody | Anti-NANOG (goat polyclonal) | R&D Systems | AF1997; RRID:AB_355097 | IF (1:150) |
| Antibody | Anti-DDX4 (goat polyclonal) | R&D Systems | AF2030; RRID:AB_2277369 | IF (1:200) |
| Antibody | Anti-DAZL (rabbit polyclonal) | Abcam | ab34139; RRID:AB_731849 | IF (1:150) |
| Antibody | Anti-SOX2 (mouse monoclonal) | R&D Systems | MAB2018; RRID:AB_358009 | IF (1:150) |
| Antibody | Anti-LAMININ (rabbit polyclonal) | Abcam | ab11575; RRID:AB_298179 | IF (1:200) |
| Antibody | Anti-H3K9me2 (rabbit polyclonal) | MilliporeSigma | 07441; RRID:AB_11212297 | IF (1:150) |
| Antibody | Anti-H3K27me3 (rabbit polyclonal) | MilliporeSigma | 07449; RRID:AB_310624 | IF (1:150) |
| Antibody | Anti-SOX9 (rabbit polyclonal) | MilliporeSigma | AB5535; RRID:AB_2239761 | IF (1:150) |
| Antibody | Anti-PRDM1 (rabbit monoclonal) | Abcam | ab198287 | IF (1:100) |
| Antibody | Alexa Fluor 488-conjugated anti-rabbit IgG (donkey polyclonal) | Life Technologies | A21206; RRID:AB_2535792 | IF (1:500) |
| Antibody | Alexa Fluor 488-conjugated anti-mouse IgG (donkey polyclonal) | Life Technologies | A32766; RRID:AB_2762823 | IF (1:500) |
| Antibody | Alexa Fluor 568-conjugated anti-mouse IgG (donkey polyclonal) | Life Technologies | A10037; RRID:AB_2534013 | IF (1:500) |
| Antibody | Alexa Fluor 568-conjugated anti-rabbit IgG (donkey polyclonal) | Life Technologies | A10042; RRID:AB_2534017 | IF (1:500) |
| Antibody | Alexa Fluor 647-conjugated anti-goat IgG (donkey polyclonal) | Life Technologies | A21447; RRID:AB_2535864 | IF (1:500) |
| Antibody | Alexa Fluor 647-conjugated anti-rabbit IgG (donkey polyclonal) | Life Technologies | A31573; RRID:AB_2536183 | IF (1:500) |
| Antibody | Alexa Fluor 647-conjugated anti-human PDPN (rat monoclonal) | Biolegend | 337007; RRID:AB_1595538 | FACS (5 µl per test) |
| Antibody | BV421-conjugated anti-mouse CD49f (rat monoclonal) | Biolegend | 313623; RRID:AB_2562243 | FACS (5 µl per test) |
| Antibody | Alexa Fluor 488-conjugated anti-human/mouse SSEA3 (rat monoclonal) | Biolegend | 330305; RRID:AB_1279441 | FACS (5 µl per test) |
| Antibody | PE-conjugated anti-human SSEA4 (mouse monoclonal) | Biolegend | 330405; RRID:AB_1089207 | FACS (5 µl per test) |
| Antibody | Anti-SSEA1 antibody Microbeads (mouse monoclonal) | Miltenyi Biotec | 130-094-530; RRID:AB_2814656 | MACS removal of germ cells (20 µl per test) |
| Peptide, recombinant protein | Recombinant human BMP4 | R&D Systems | 314BP-010 | cjPGCLCs induction |
| Peptide, recombinant protein | Recombinant human LIF | MilliporeSigma | LIF1010 | cjPGCLCs induction |
| Peptide, recombinant protein | Recombinant human SCF | R&D Systems | 255-SC-010 | cjPGCLCs induction |
| Peptide, recombinant protein | Recombinant human EGF | R&D Systems | 236-EG | cjPGCLCs induction |
| Peptide, recombinant protein | Recombinant human/murine/rat Activin-A | R&D Systems | 338-AC | Trilineage differentiation |
| Peptide, recombinant protein | Recombinant human FLT-3 ligand | Gibco | PHC9414 | Generation of cjiPSCs lines |
| Peptide, recombinant protein | Recombinant human basic FGF | Gibco | PHG0264 | Generation of cjiPSCs lines |
| Peptide, recombinant protein | Recombinant human IL-3 | Gibco | PHC0034 | Generation of cjiPSCs lines |
| Peptide, recombinant protein | Recombinant human IL-6 | Gibco | PHC0065 | Generation of cjiPSCs lines |
| Peptide, recombinant protein | Recombinant human SCF | Gibco | PHC2111 | Generation of cjiPSCs lines |
| Peptide, recombinant protein | iMatrix-511silk (Laminin-511 E8 fragment) | TAKARA | 892021 | Feeder free cjiPSCs culture |
| Chemical compound, drug | Mitomycin C | MilliporeSigma | M0503 | Inactivation of feeder cells |
| Chemical compound, drug | Y-27632 dihydrochloride (ROCK inhibitor) | Tocris | 1254 | cjPGCLCs induction |
| Chemical compound, drug | Dorsomorphin | MilliporeSigma | P5499-5MG | Trilineage differentiation |
| Chemical compound, drug | SB431542 | MilliporeSigma | S4317 | Trilineage differentiation |
| Commercial assay or kit | CytoTune-iPS 2.0 Sendai Reprogramming Kit | Thermo Fisher | A16517 | |
| Commercial assay or kit | LookOut Mycoplasma PCR Detection Kit | MilliporeSigma | MP0035-1KT | |
| Commercial assay or kit | Chromium Single Cell 3” GEM, Library & Gel Bead Kit v.3 | 10× Genomics | PN-1000092 | |
| Commercial assay or kit | SMRT-Seq HT plus kit | TAKARA | R400748 | |
| Commercial assay or kit | Pico Methyl-Seq Library Prep Kit | Zymo Research | D5455 | |
| Software, algorithm | FACSDiva software v.8.0.2 | BD Biosciences | ||
| Software, algorithm | Leica LasX c 3.7.2 | Leica | ||
| Software, algorithm | R v.4.1.0 | https://www.r-project.org | ||
| Software, algorithm | DAVID v.6.8 | https://david.ncifcrf.gov |
Additional files
-
Supplementary file 1
Primers used in this study.
- https://cdn.elifesciences.org/articles/82263/elife-82263-supp1-v2.docx
-
MDAR checklist
- https://cdn.elifesciences.org/articles/82263/elife-82263-mdarchecklist1-v2.docx
Download links
A two-part list of links to download the article, or parts of the article, in various formats.
Downloads (link to download the article as PDF)
Open citations (links to open the citations from this article in various online reference manager services)
Cite this article (links to download the citations from this article in formats compatible with various reference manager tools)
Efficient generation of marmoset primordial germ cell-like cells using induced pluripotent stem cells
eLife 12:e82263.
https://doi.org/10.7554/eLife.82263


