Joint inference of evolutionary transitions to self-fertilization and demographic history using whole-genome sequences
- Max Planck Institute for Plant Breeding Research, Germany
- Department of Life Science Systems, Technical University of Munich, Germany
- Department of Environment and Biodiversity, Paris Lodron University of Salzburg, Austria
- Université Rennes 1, CNRS, ECOBIO, France
- Department of Ecology and Genetics, Evolutionary Biology Centre, Uppsala University, Sweden
Figures
Figure 1 with 3 supplements
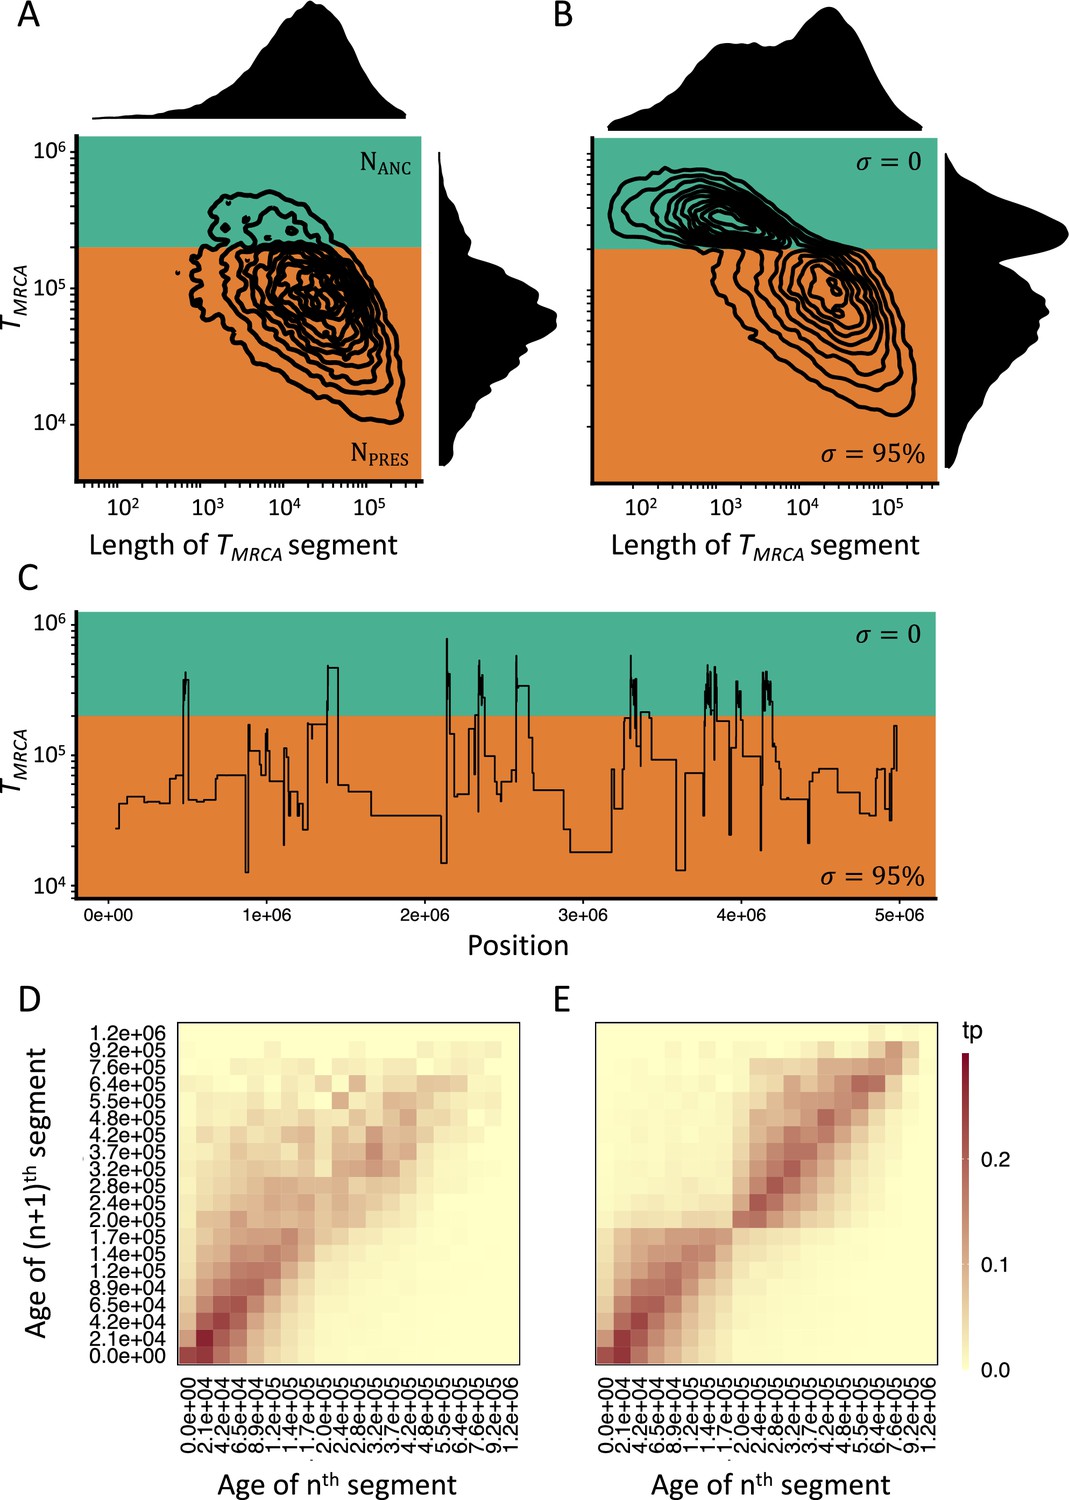
Consequences of a transition to selfing on the genealogies of simulated chromosomes.
(A) Joint and marginal distributions of ages (TMRCA in generations on a log10 scale) and lengths of TMRCA-segments (in bp on a log10 scale) in a selfing population (σ=0.95) with a stepwise change from large (green, NANC = 50,000) to low (orange, NPRES = 26,250) population size. The population sizes were chosen to correspond to the rescaling of the effective population size by the selfing rates used in panel B. (B) Joint and marginal distributions of ages (TMRCA) and lengths of TMRCA-segments (in bp) in a population with a constant population size and a shift from outcrossing (green, σ=0) to predominant selfing (orange, σ=0.95). (C) Spatial distribution along the genome of a subset of the TMRCA-segments simulated in panel B (tσ=200,000 generations). (D) The transition matrix of ages (TMRCA) between adjacent segments along the genome for the data simulated in panel A. This matrix summarizes the probabilities that the nth TMRCA-segment with a given age X is followed by the (n+1)th segment of age Y. The heat colors indicate the transition probabilities (tp). (E) The transition matrix of ages (TMRCA) between adjacent segments along the genome for the data simulated in panel B. The recombination rate for the simulations was set to 3.6×10⁻⁹. The data was acquired by conducting 20 independent replications (see Materials and methods).
Figure 1—figure supplement 1
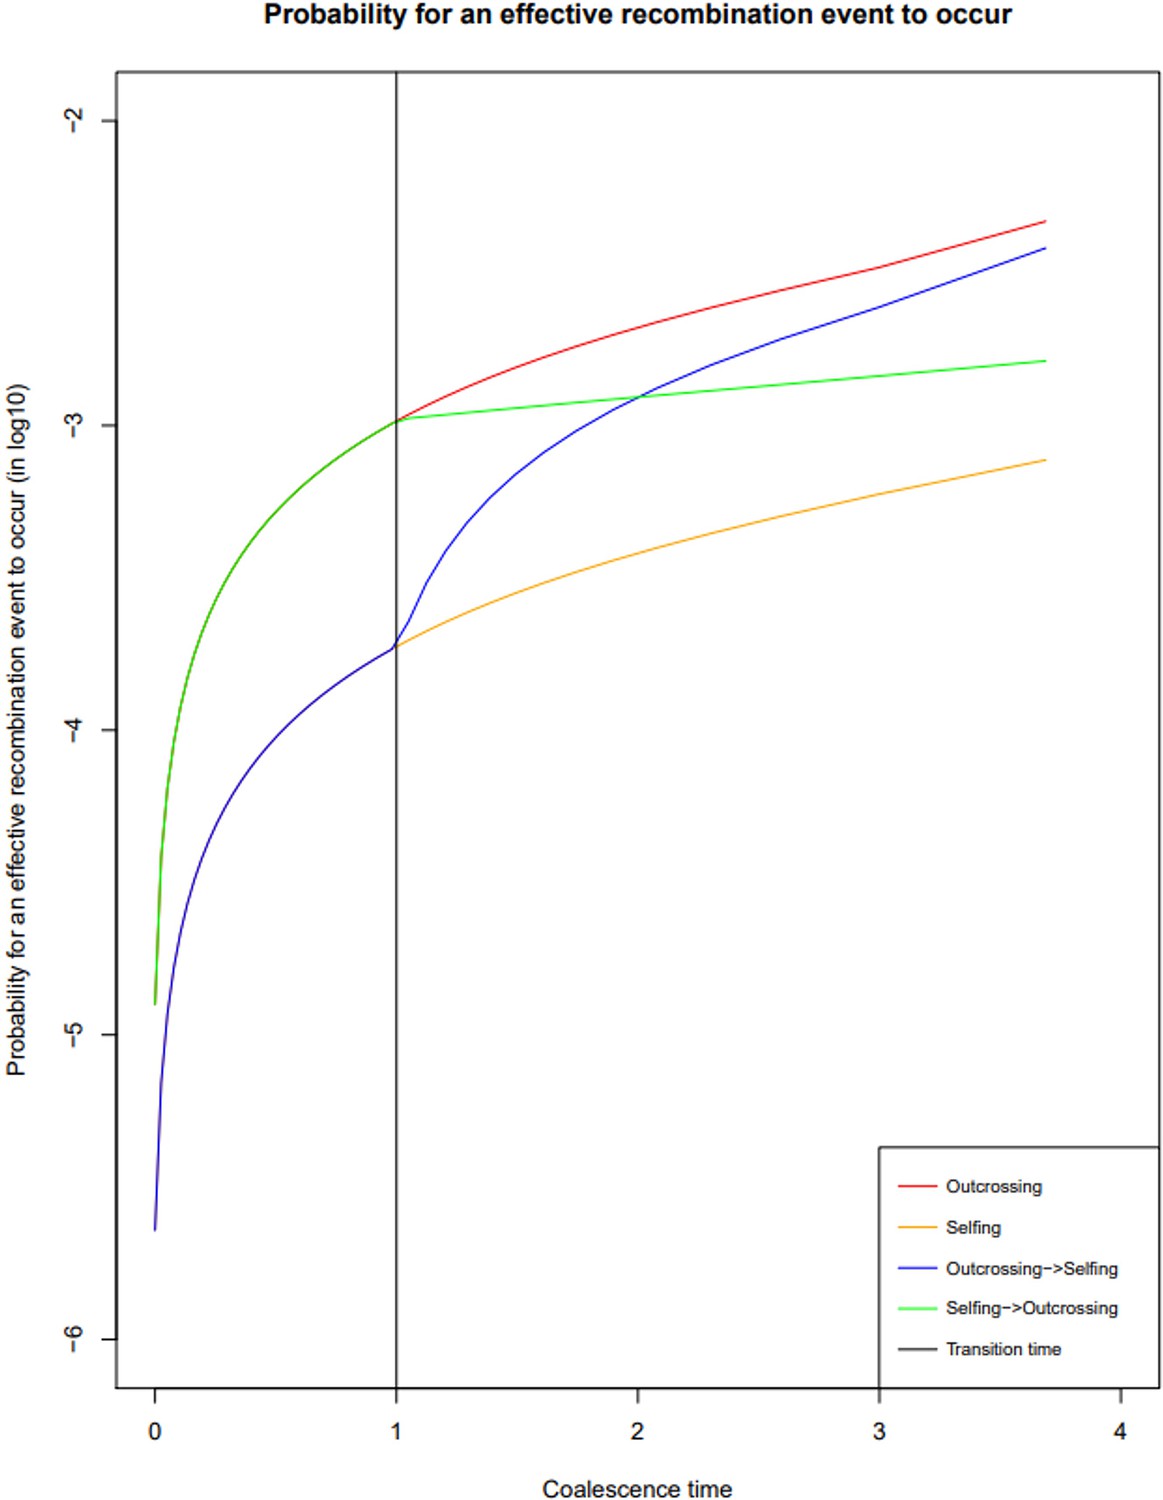
Probability of recombination events over time under different reproductive histories.
Probability of a break in the genealogy to occur in a coalescent tree of sample size two in the absence of selfing (red); in presence of 90% selfing (orange); in the case of a transition from outcrossing to selfing (forward-in-time, blue) and in the case of a transition from selfing to outcrossing (forward-in-time, green). The time of transition is indicated in black. In this case ρ is set to 0.001. The probability of a recombination event having occurred depends on the effective recombination rate, which is in turn negatively impacted by selfing rate.
Figure 1—figure supplement 2
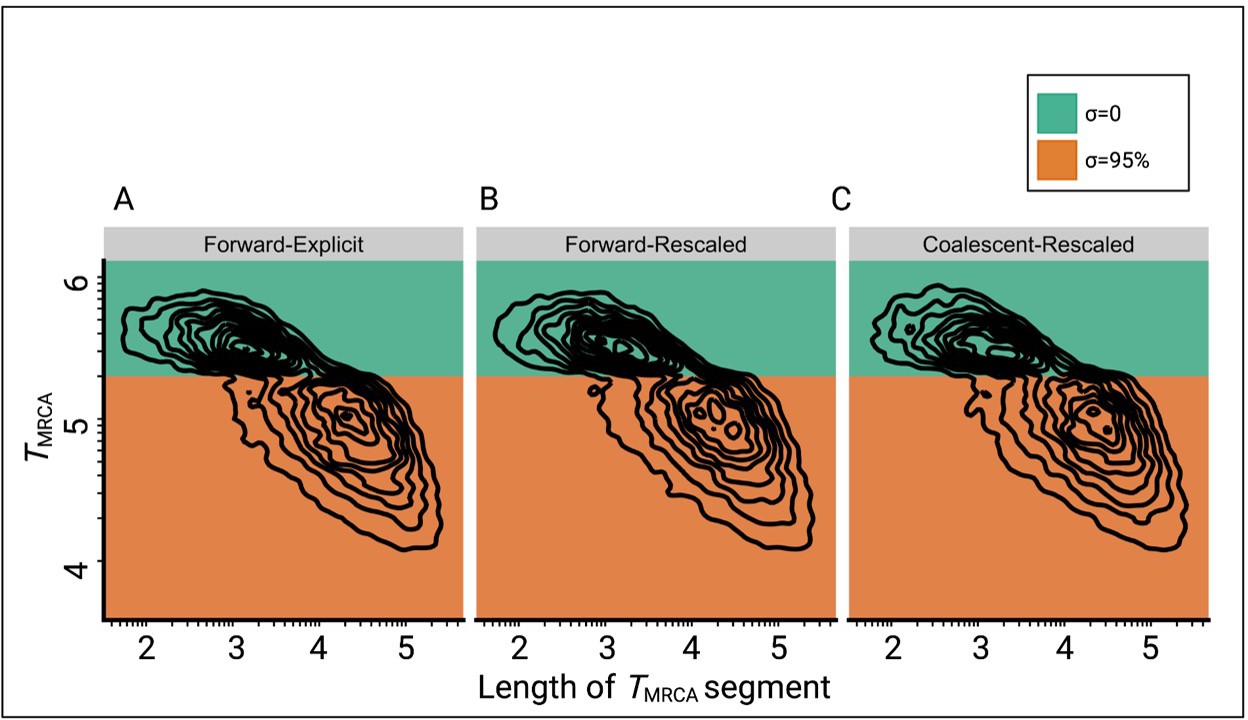
Comparison of the joint distributions of TMRCA and lengths of TMRCA-segments (TL-distribution) under three different simulation approaches.
(A) Explicit selfing implemented in a forward-in-time Wright-Fisher model (slim3). Population size is constant and selfing rate shifts from outcrossing (σ=0, green) to predominant selfing (σ=0.95, orange). TMRCA-segments were defined as contiguous sets of nucleotides sharing the same TMRCA. (B) Shift to selfing is simulated using a forward-in-time Wright-Fisher model (slim3) by rescaling population size and recombination rate at tσ as suggested by Nordborg and Donnelly, 1997 and Nordborg, 2000. (C) Shift to selfing simulated using the coalescent (msprime) by rescaling population size and recombination rate at tσ as in panel B. The data was acquired by conducting 20 independent replications. Axes dimensions are on a log10 scale.
Figure 1—figure supplement 3
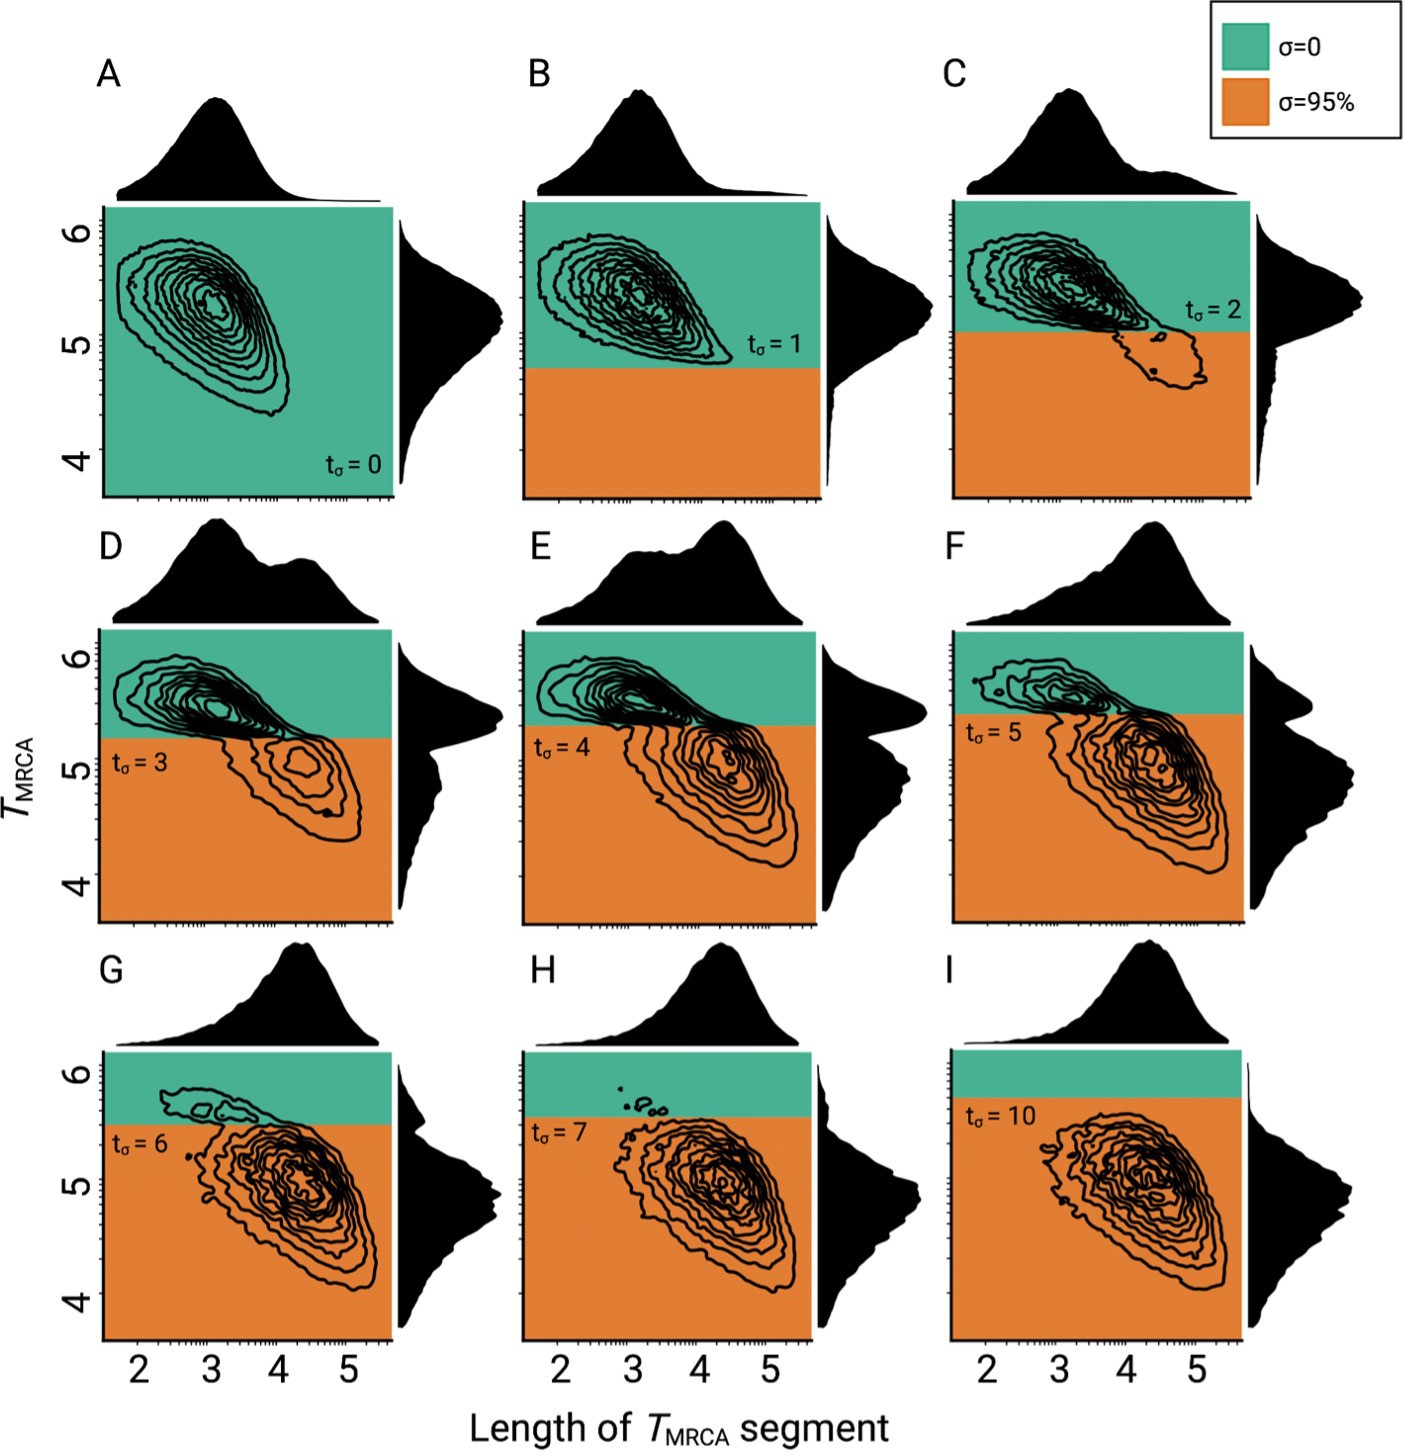
Consequences of a transition to selfing on the genealogies of simulated chromosomes for different ages of the transition.
(A–I) Joint and marginal distributions of ages in generations and lengths of TMRCA-segments in a population with a constant population size and a shift from outcrossing (green) to predominant selfing (orange). TMRCA-segments were defined as contiguous sets of nucleotides sharing the same most recent common ancestor. Transitioning times are provided on Nσ scale. The data was acquired by conducting 20 independent replications. Axes dimensions are in log10.
Figure 2 with 8 supplements
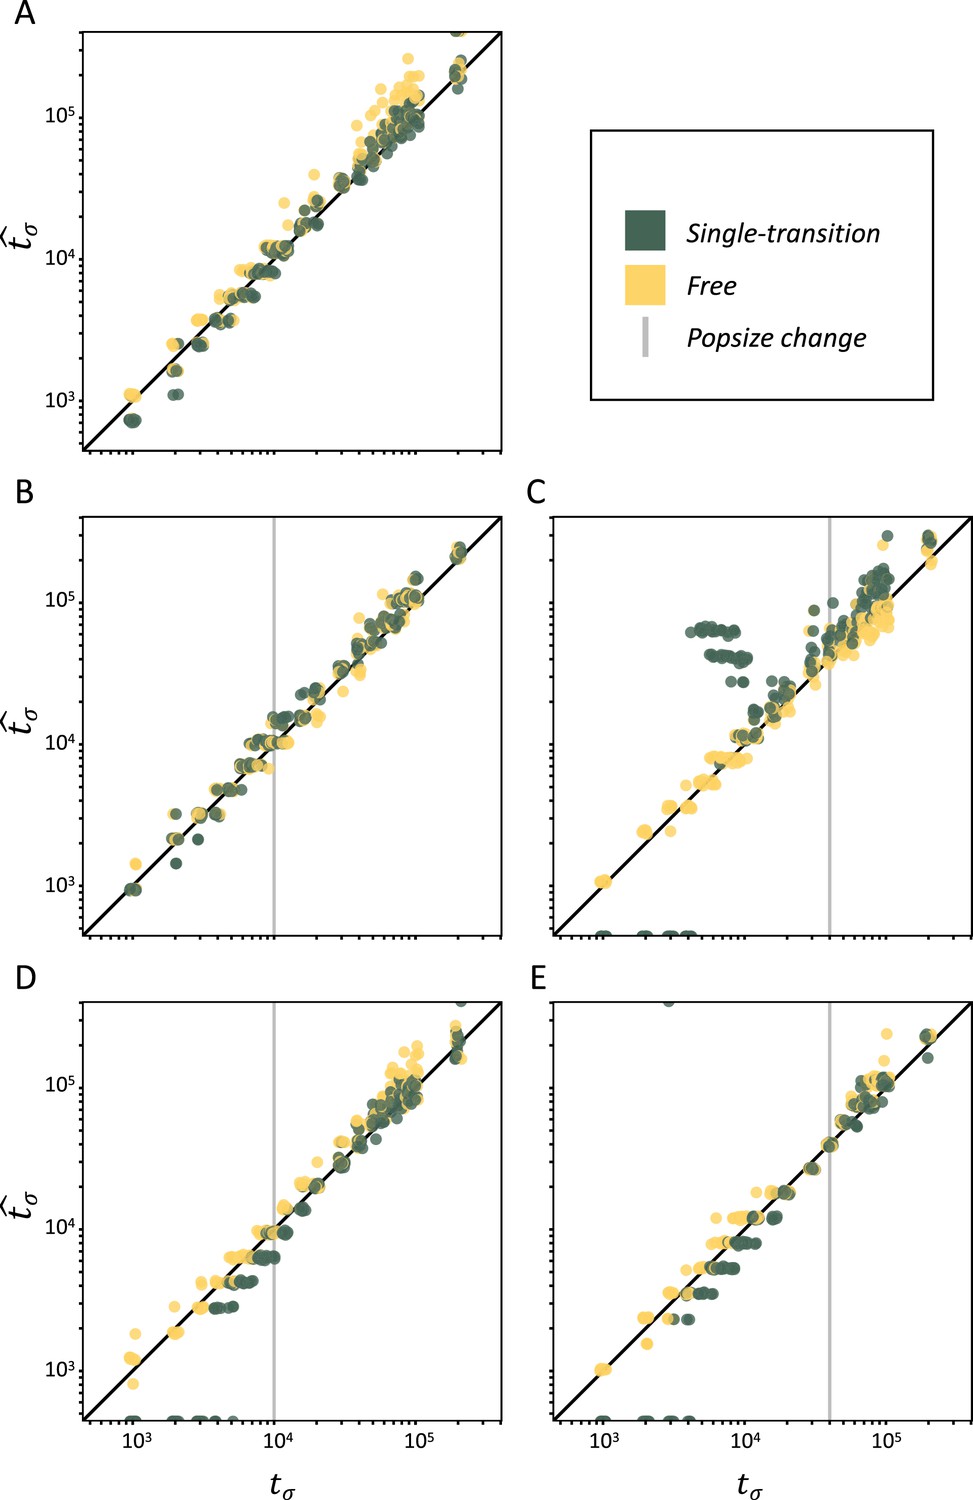
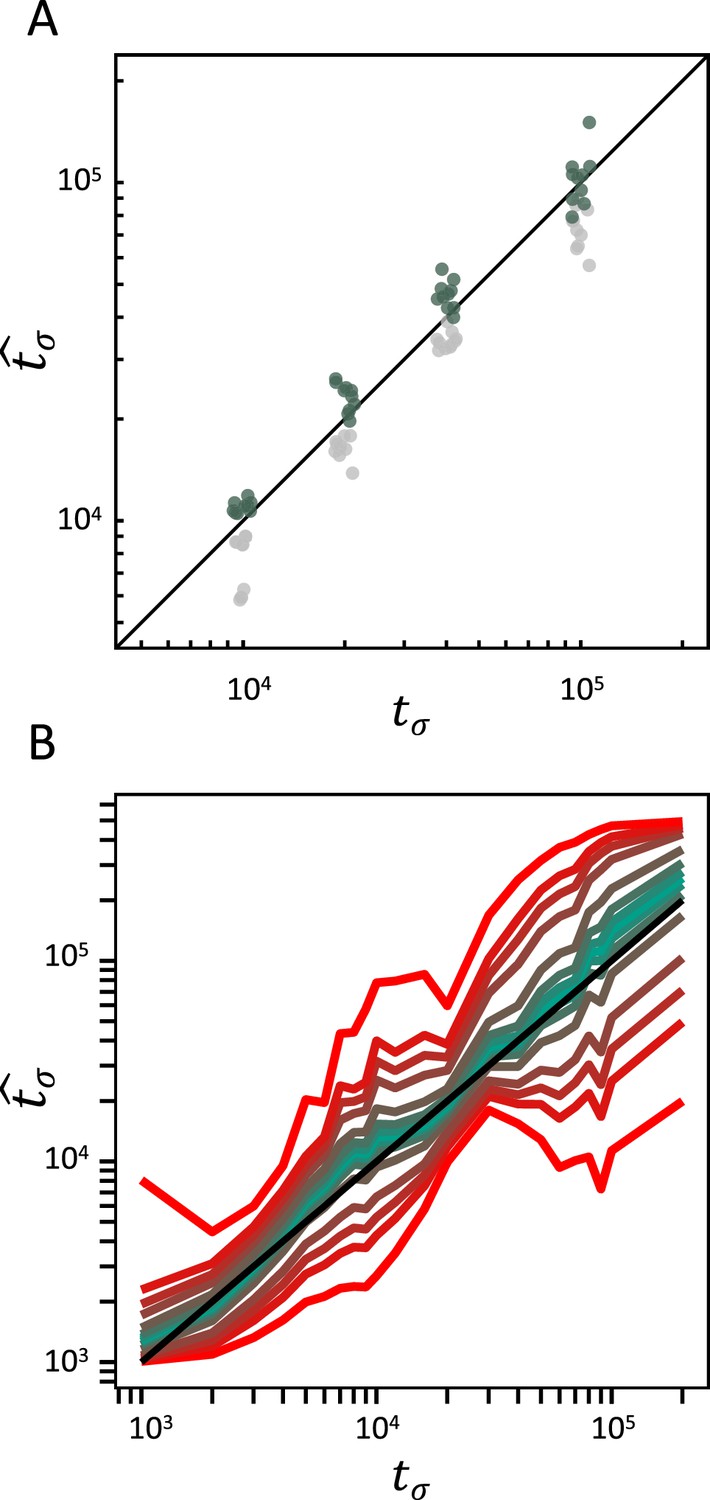
Performance of teSMC on simulated polymorphism data.
Inference of times of transition from outcrossing (σ=0.1) to predominant selfing (σ=0.99) using neutral simulations. The x-axes represent the true value of tσ in units of log10(generations) and the y-axis shows the values of tσ estimated by teSMC. Inference was done using the free mode (yellow) and the one-transition mode (green) of teSMC and 10 replicates per time point. (A) Under constant population size. (B–E) Simulations were done with an additional change in population size, the vertical gray line indicates the age of the change in population size. (B–C) From NANC = 200,000 to NPRES = 40,000 (population crash) at 10,000 generations (B) or 40,000 generations (C) in the past. (D–E) From NANC = 40,000 to NPRES = 200,000 (population expansion) at 10,000 generations (D) or 40,000 generations (E) in the past. The inference process was repeated 10 times for each experimental condition, employing independently simulated data sets.
Figure 2—figure supplement 1
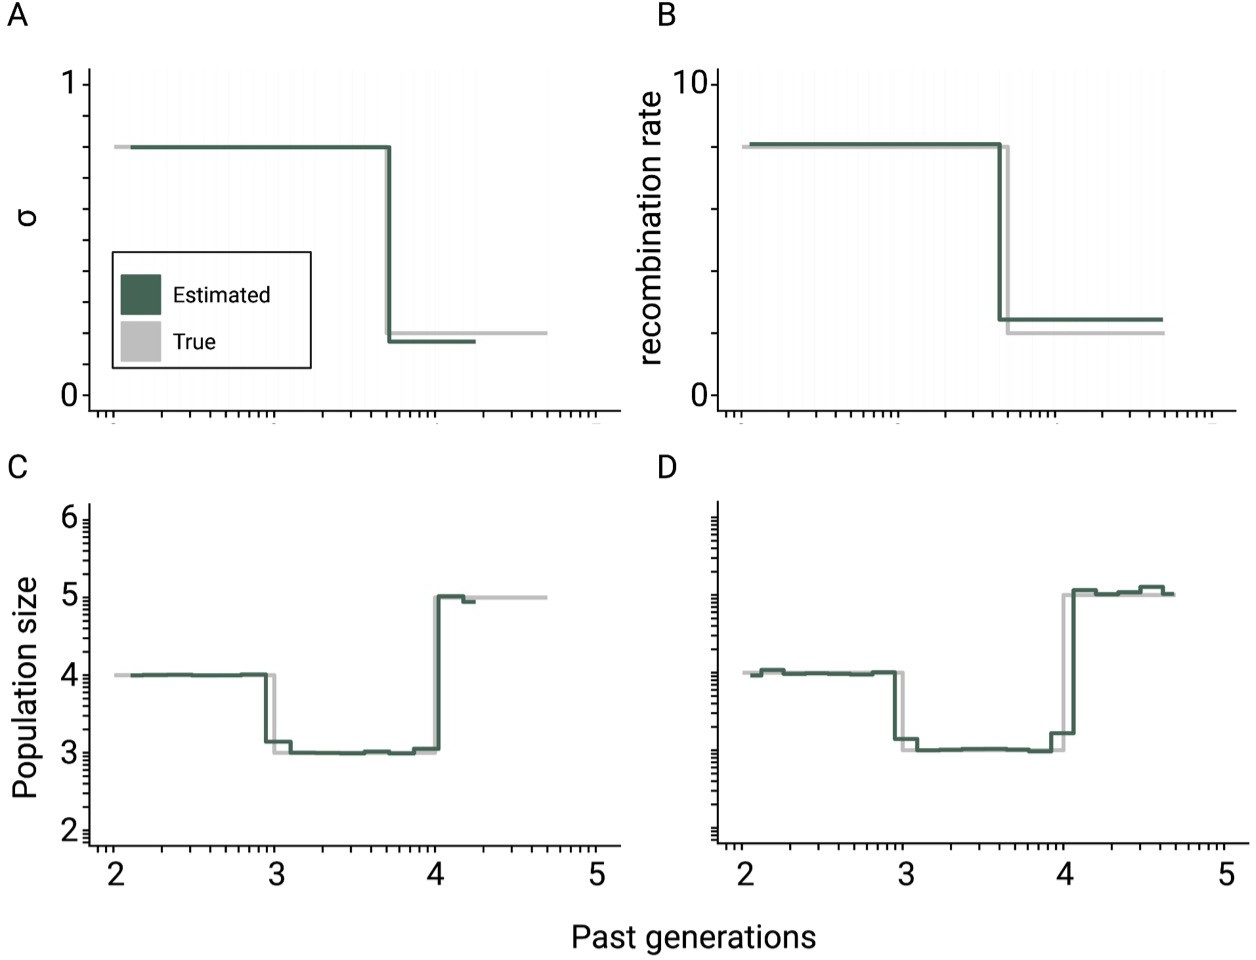
Theoretical convergence of teSMC under complex demography.
Best-case convergence of teSMC using 10 sequences (i.e. haploid genomes) of 100 Mb (green) when population undergoes a bottleneck (true sizes are indicated in gray) with either variation of selfing in time (A,C) or variation of recombination rate in time (B,D). The selfing rate through time is represented in (A) and the corresponding estimated population size is represented in (C); the recombination rate was set at 1×10⁻⁷ per generation per bp. The estimated recombination rate trough time is represented in (B), it changes from 2×10⁻⁸ to 8×10⁻⁸ per generation per bp, and the corresponding population size within (D). The mutation rate is set in all cases to 1×10⁻⁸ per generation per bp.
Figure 2—figure supplement 2
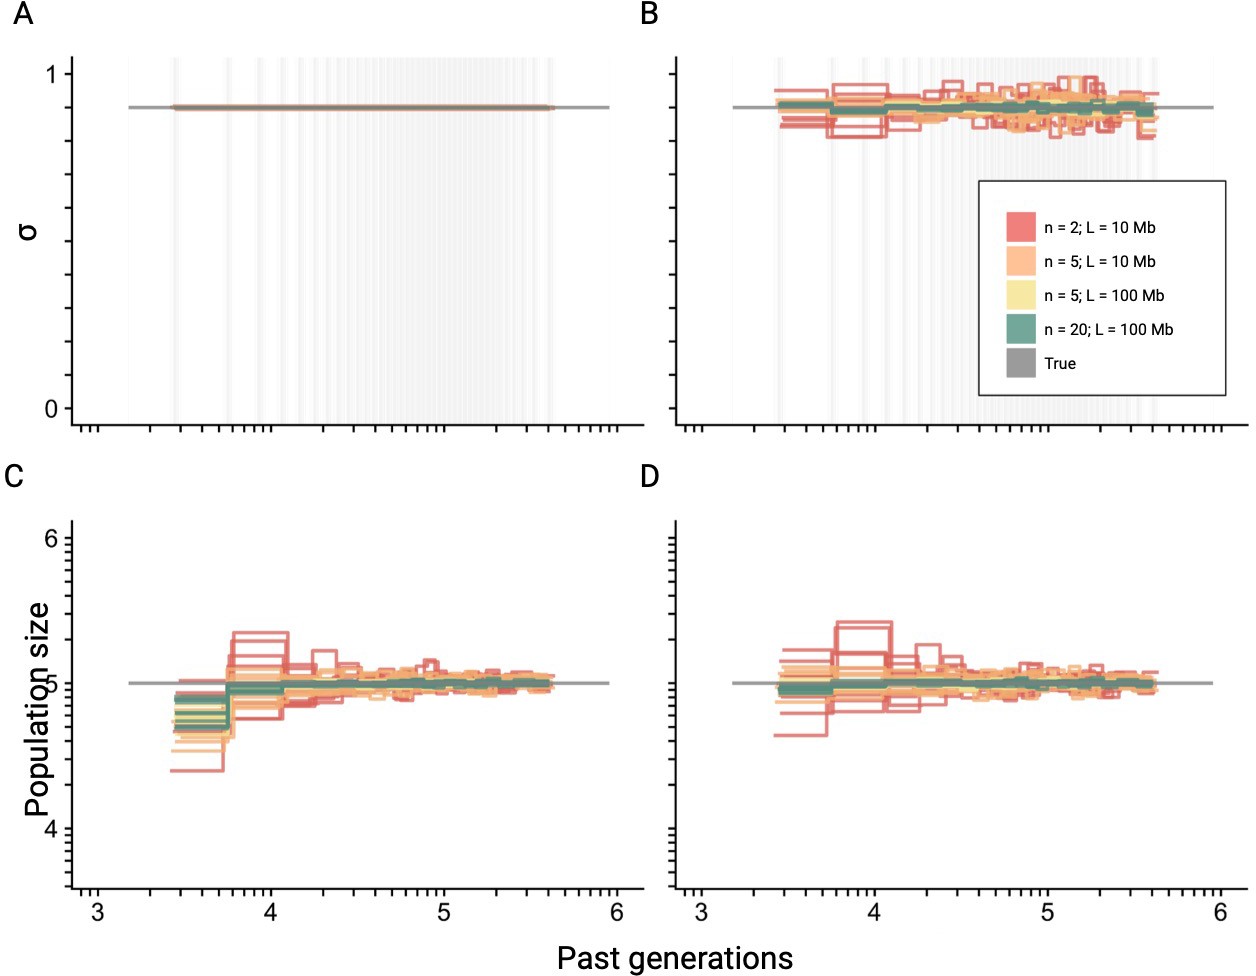
Best-case convergence of teSMC for different amount of data.
Best-case convergence of teSMC using different combinations of sample sizes (, , or sequences; i.e. haploid genomes) and sequence lengths (L=10 Mb or L=100 Mb, see legend). Population size is constant (N=100,000, gray horizontal line) with a constant selfing rate of 0.9. The best-case convergence is estimated assuming that selfing is constant (A, C) or varying in time (B, D). The estimated population size assuming constant selfing in time is represented in (C) and the simultaneously estimated selfing rate in (A). The estimated population size assuming varying selfing rate in time is represented in (D) and the simultaneously estimated selfing rate through time in (B). The recombination was set to r=1 × 10⁻⁸ per generation per bp. Except for the selfing rates, both axes are on a log10 scale. The inference process was repeated 10 times for each experimental condition, employing independently simulated data sets.
Figure 2—figure supplement 3
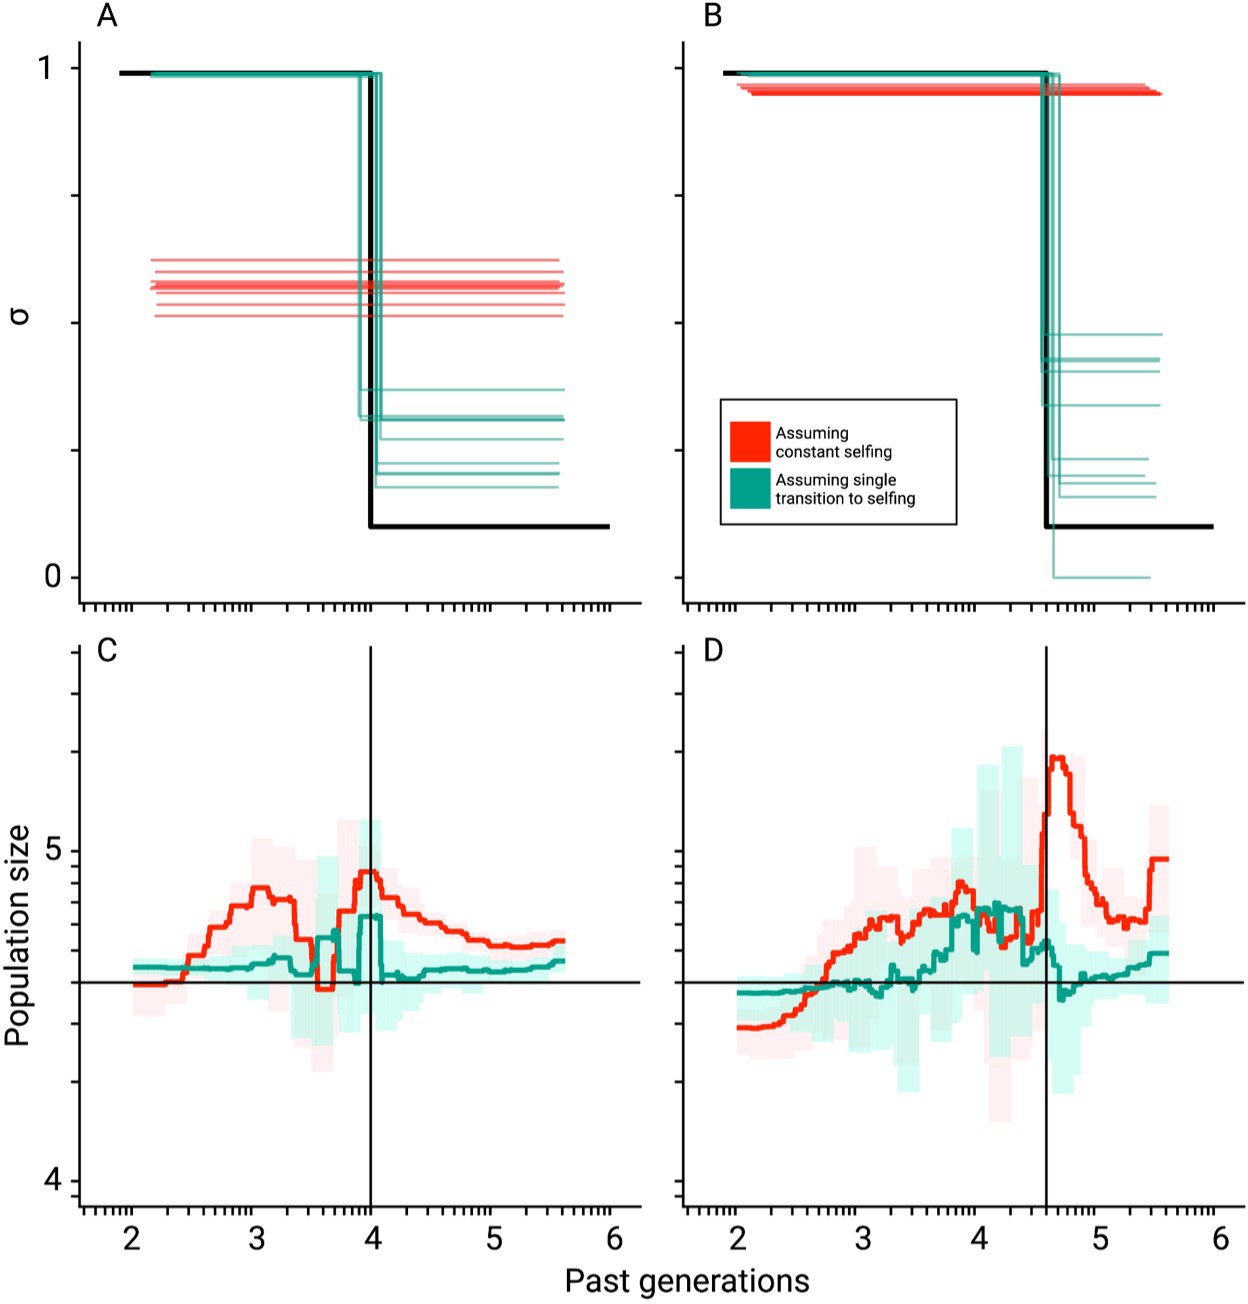
Mis-inference of population sizes when transitions to selfing are not accounted for.
Comparisons between true (black lines) and estimated selfing rates and population sizes estimated by teSMC for 10 replicates. Here, simulations were done using a constant population size (N=40,000) and a transition to selfing from σANC = 0.1 to σPRES = 0.99 at tσ=10,000 (A,C) and 40,000 (B,D). Five chromosomes of 1 Mb each were simulated with mutation and recombination rates set to 1×10⁻⁸ events per generation per bp. Red and green lines indicate results obtained assuming the wrong model (i.e. constant selfing) and the correct model (i.e. single-transition), respectively. For the selfing rates (A,B), results for each replicate are indicated with solid lines. For the population sizes, the 10 replicates were summarized by the green and red shaded areas, where the width of the shaded area corresponds to the range between the minimum and maximum value observed across replicates. The inference process was repeated 10 times for each experimental condition, employing independently simulated data sets.
Figure 2—figure supplement 4
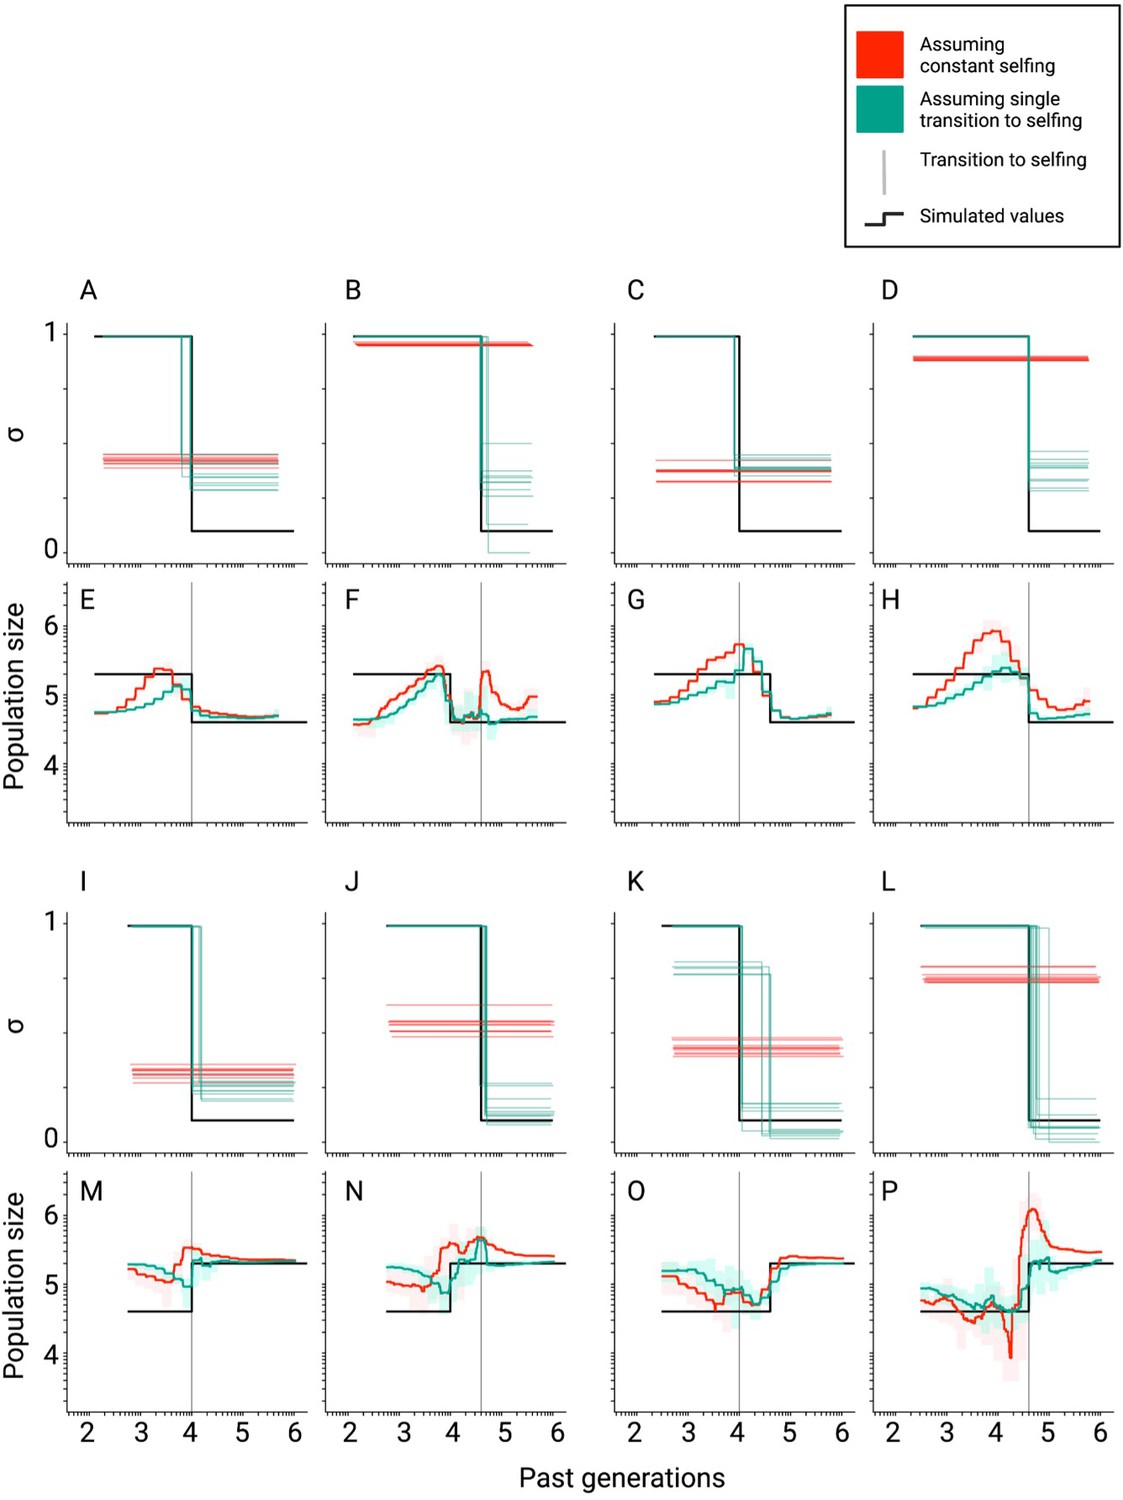
Inference of population sizes and selfing rates estimated by teSMC when both parameters change over time.
(A–P) Comparisons between true (black lines) and estimated selfing rates and population sizes estimated by teSMC for 10 replicates. Here, simulations were done as in Figure 2—figure supplement 3 except for the addition of a single stepwise population-size expansion forward-in-time (first and second rows) or contraction (third and fourth row). The transition to selfing occurred from σANC = 0.1 to σPRES = 0.99 at tσ=10,000 (A, C, E, G, I, K, M, O; first and third column) and 40,000 (B, D, F, H, J, L, N, P; second and forth column). Red and green lines indicate results obtained assuming the wrong model (i.e. constant selfing) and the correct model (i.e. single-transition), respectively. For the selfing rates, results for each replicate are indicated with solid lines. For the population sizes, the 10 replicates were summarized by the green and red shaded areas, where the width of the shaded area corresponds to the range between the minimum and maximum value observed across replicates. The inference process was repeated 10 times for each experimental condition, employing independently simulated data sets.
Figure 2—figure supplement 5
Estimated population sizes by teSMC with variable mutation and recombination rates along the genome.
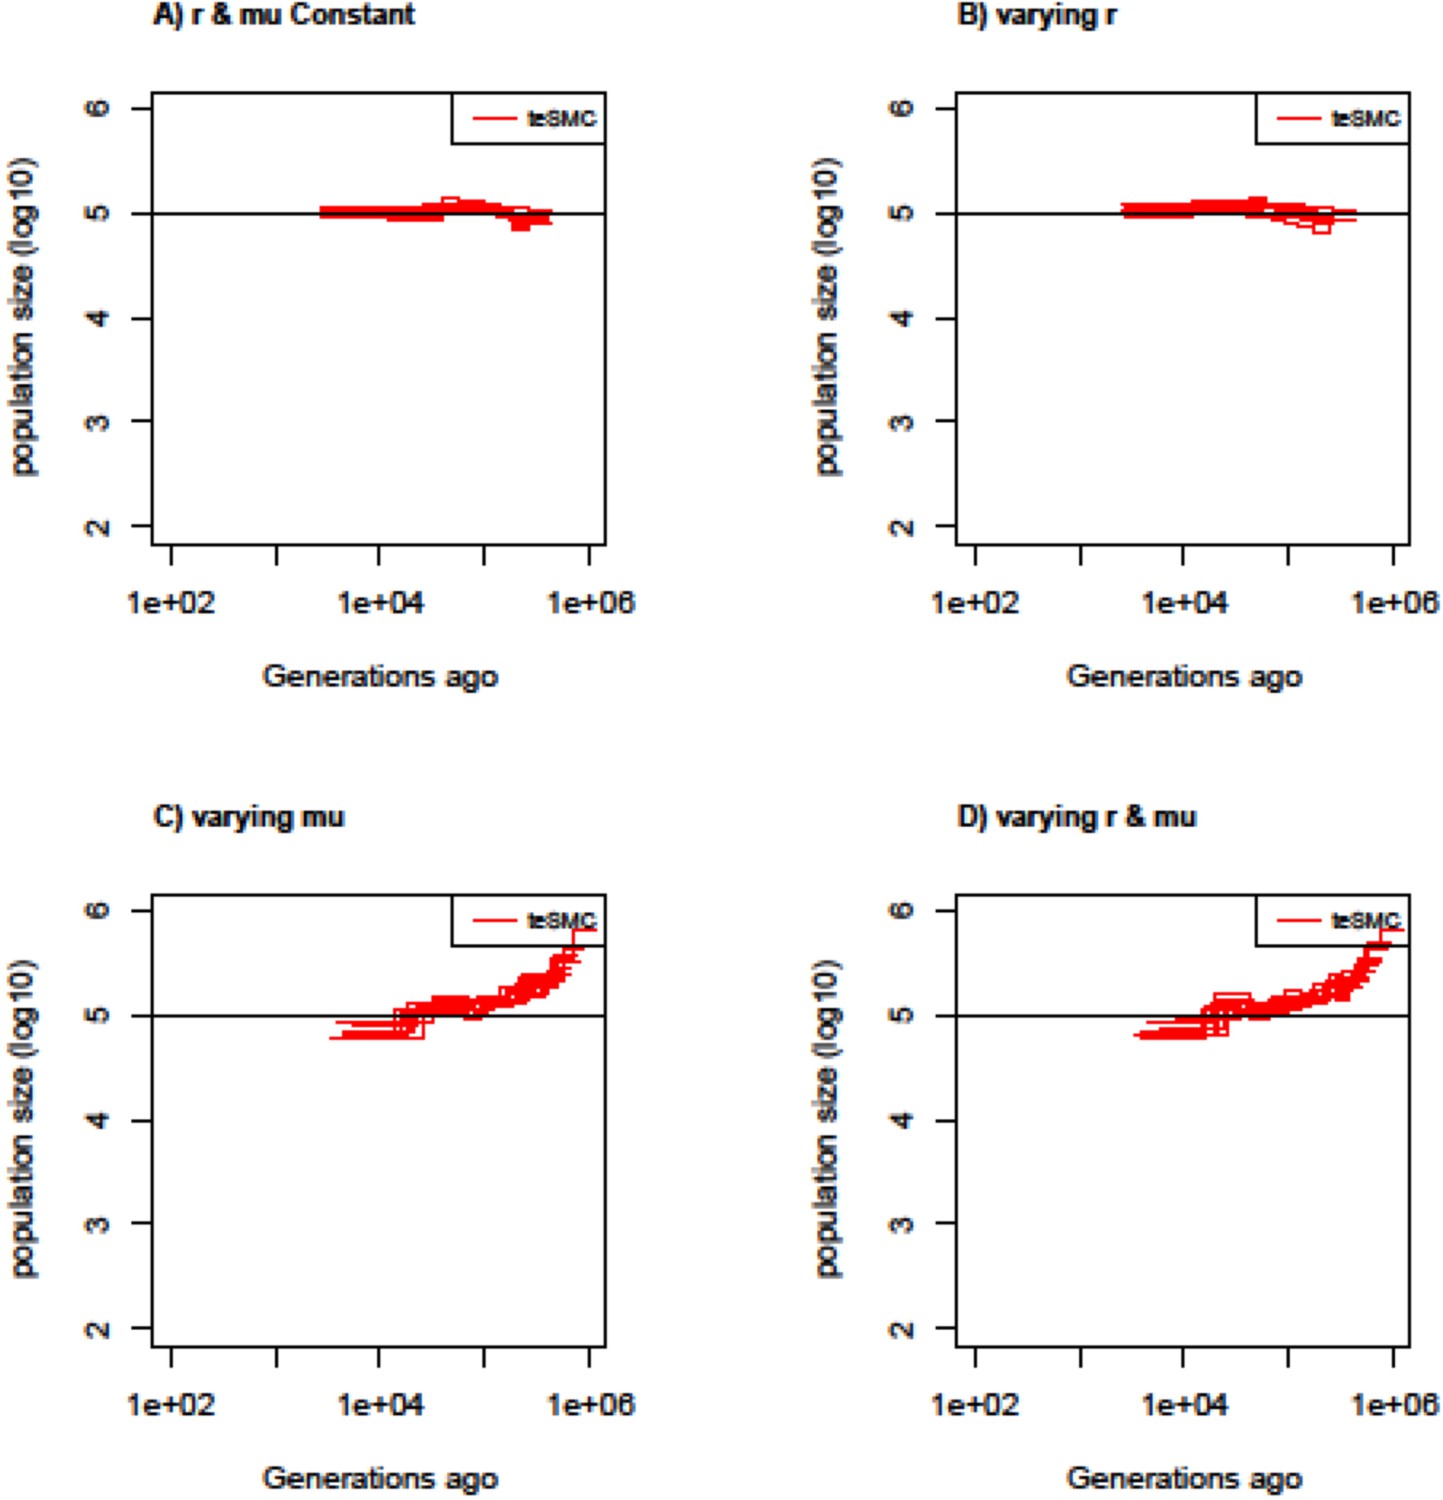
Estimated population sizes by teSMC using 20 sequences (i.e. haploid genomes) of length 5 Mb (red) when population size is constant and set to 100,000 (black line) with a constant selfing value of 0.9. Simulations are performed under four different conditions (A,B,C,D). (A) Recombination and mutation rates are constant along the genome. (B) Recombination rate varies randomly between 5×10⁻⁹ and 2×10⁻⁸ every 50 kb but the mutation rate remains constant. (C) Mutation rate varies between 5×10⁻⁹ and 2×10⁻⁸ every 50 kb but the recombination rate remains constant. (D) Mutation and recombination rates both vary along the genome. When constant, recombination and mutation rates are set to 1×10⁻⁸ per generation per bp. The inference process was repeated 10 times for each experimental condition, employing independently simulated data sets.
Figure 2—figure supplement 6
Estimated selfing rates through time by teSMC with variable mutation and recombination rates along the genome.
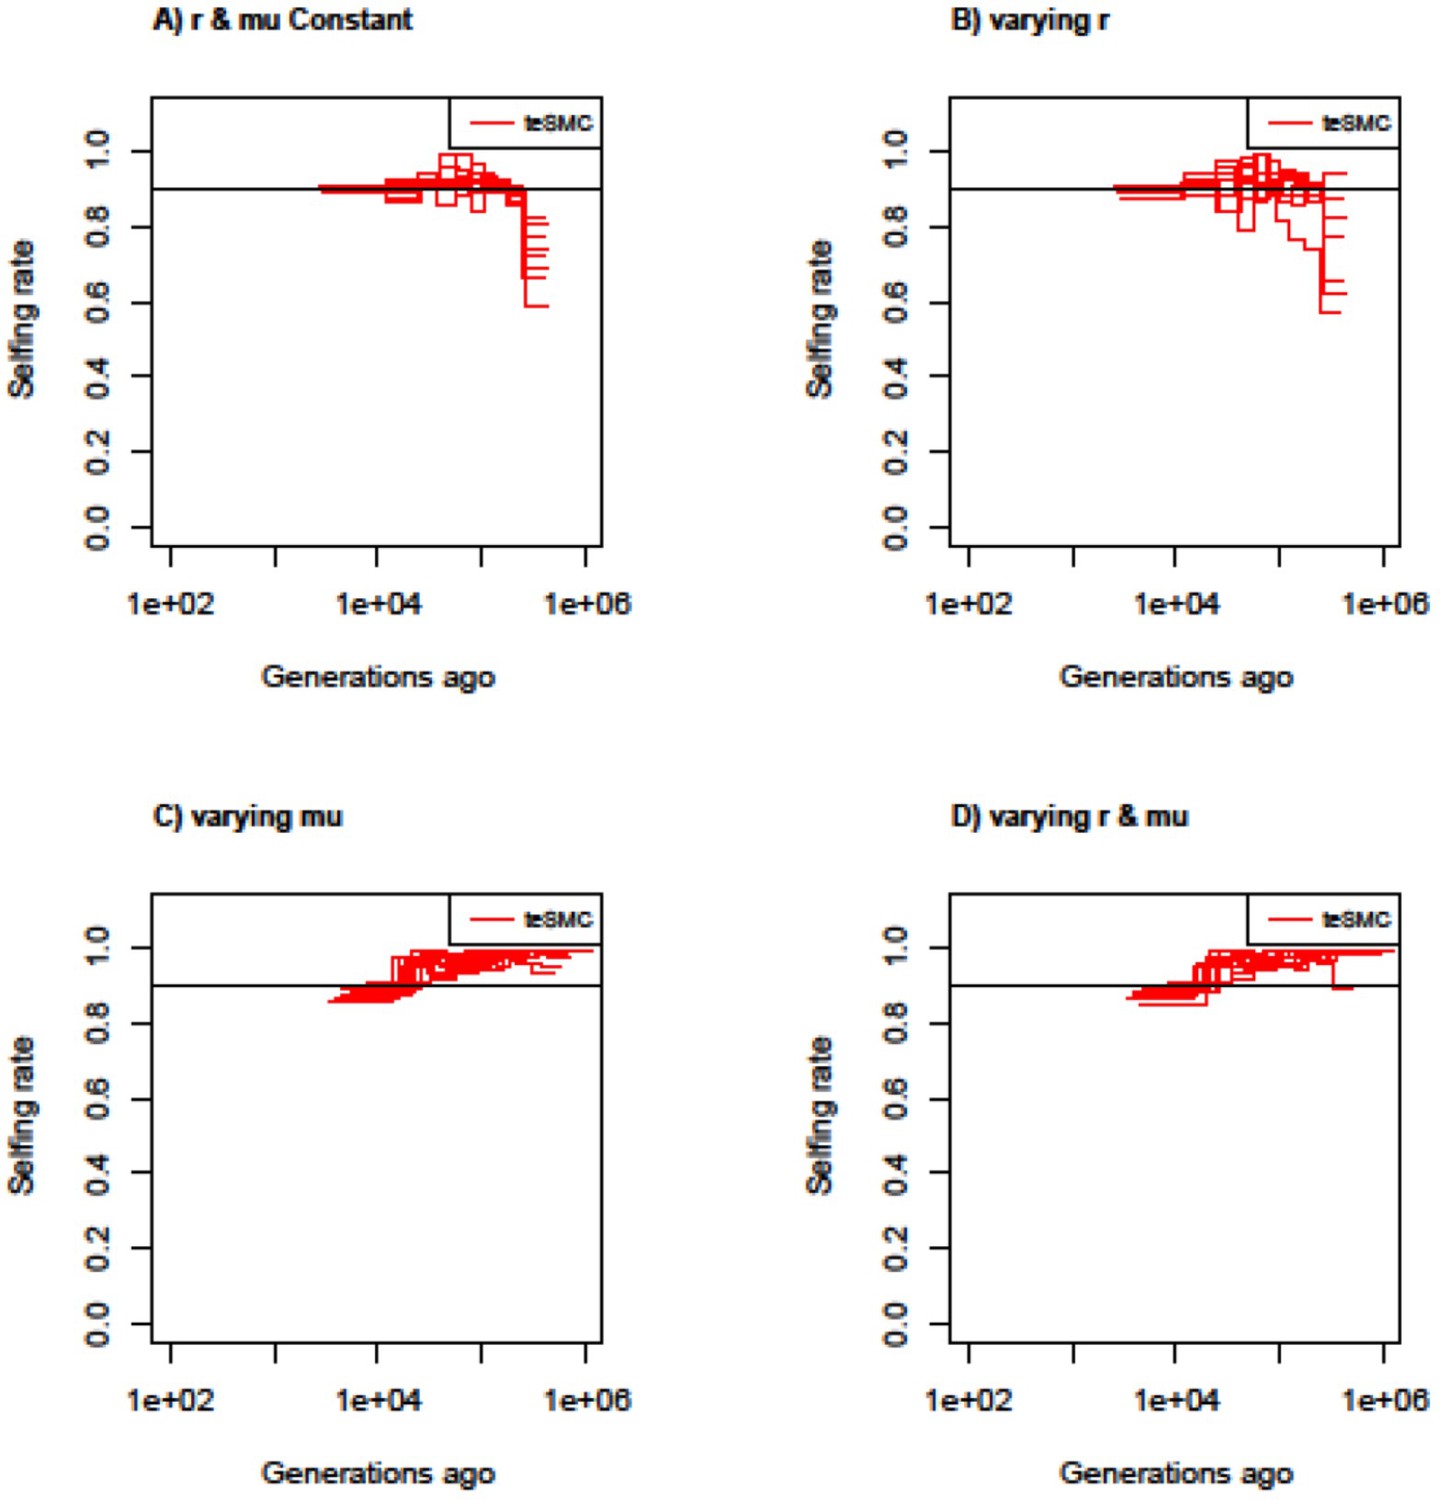
Estimated selfing rates through time estimated by teSMC using 20 sequences (i.e. haploid genomes) of length 5 Mb (red) when population size is constant and set to 100,000 (black line) with a constant selfing value of 0.9. Simulations are performed under four different conditions (A,B,C,D). (A) Recombination and mutation rates are constant along the genome. (B) Recombination rate varies randomly between 5×10⁻⁹ and 2×10⁻⁸ every 50 kb but the mutation rate remains constant. (C) Mutation rate varies between 5×10⁻⁹ and 2×10⁻⁸ every 50 kb, but the recombination rate remains constant. (D) Mutation and recombination rates both vary along the genome. The constant recombination and mutation rate are set to 1×10⁻⁸ per generation per bp. The inference process was repeated 10 times for each experimental condition, employing independently simulated data sets.
Figure 2—figure supplement 7
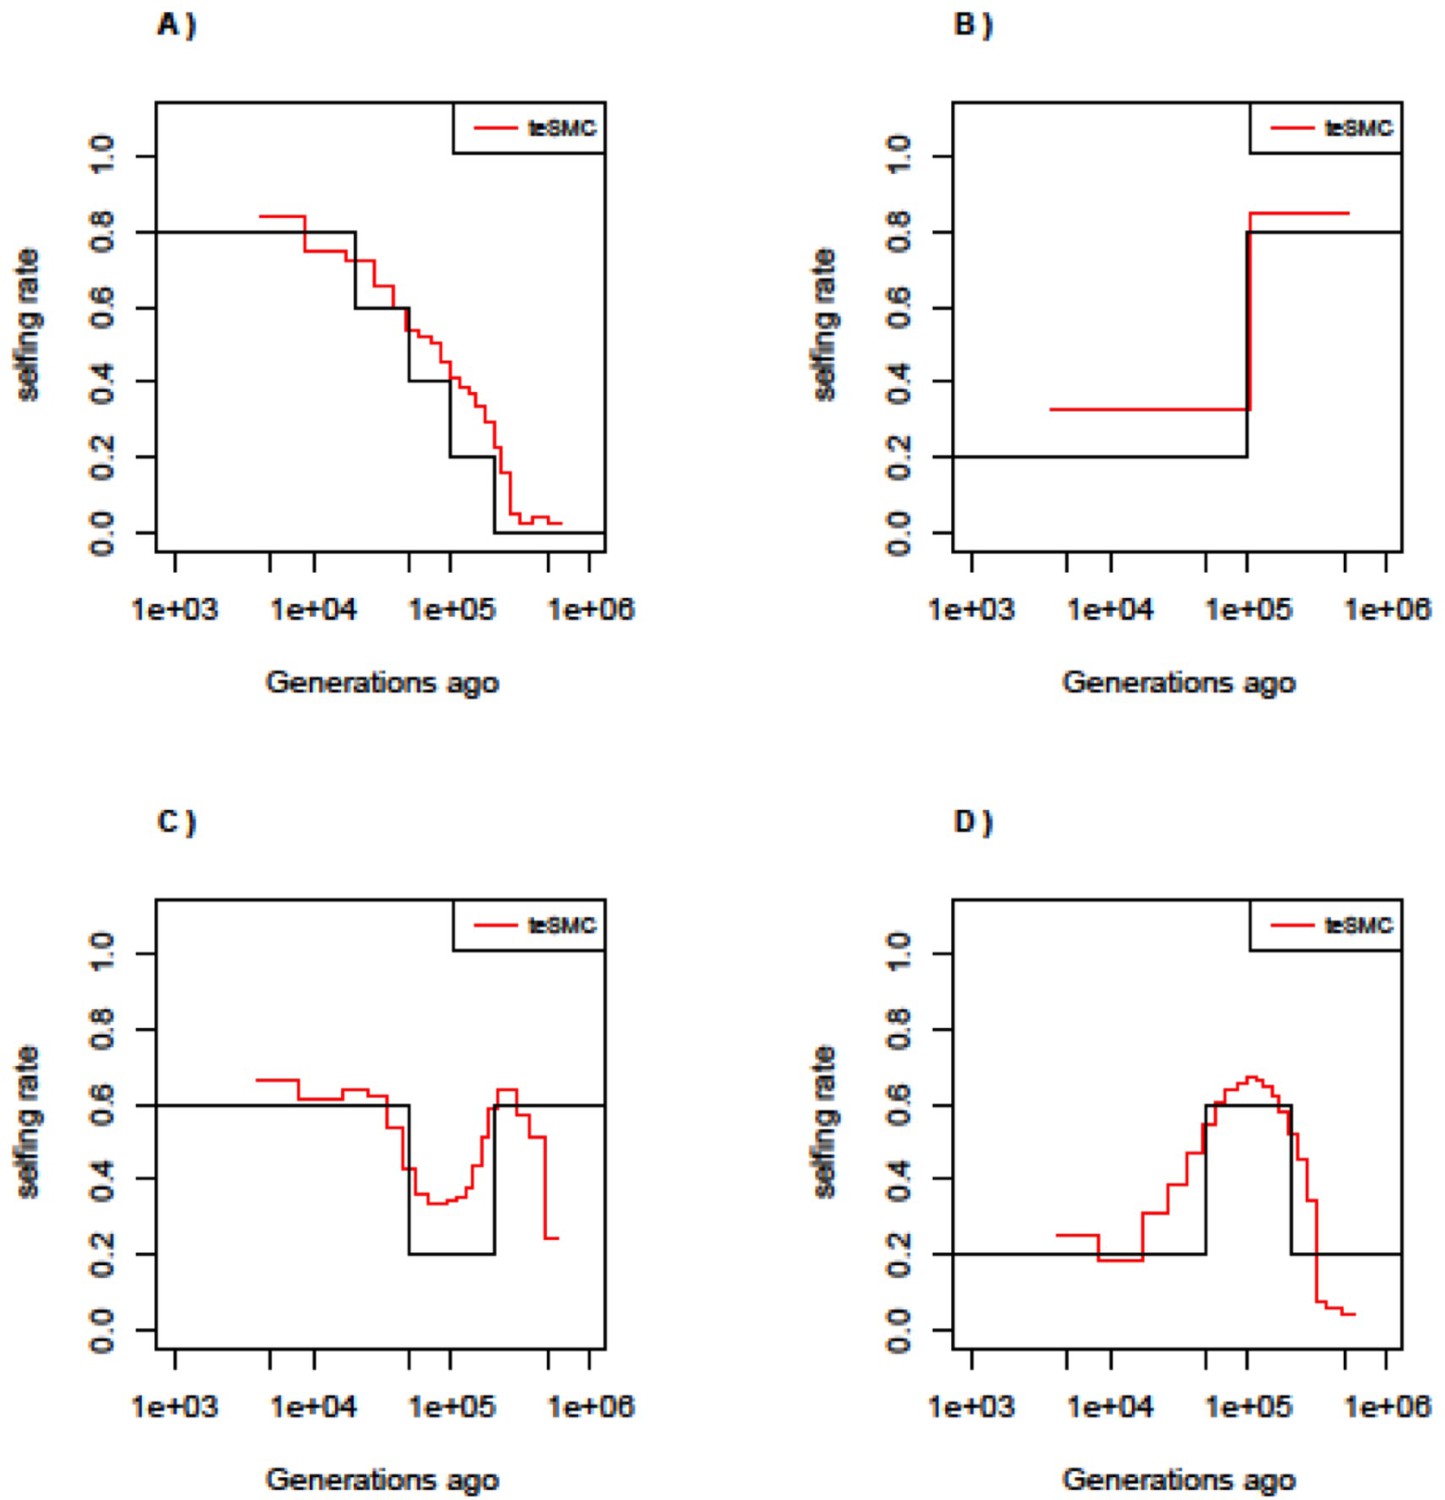
Best-case convergence of teSMC under complex selfing transitions.
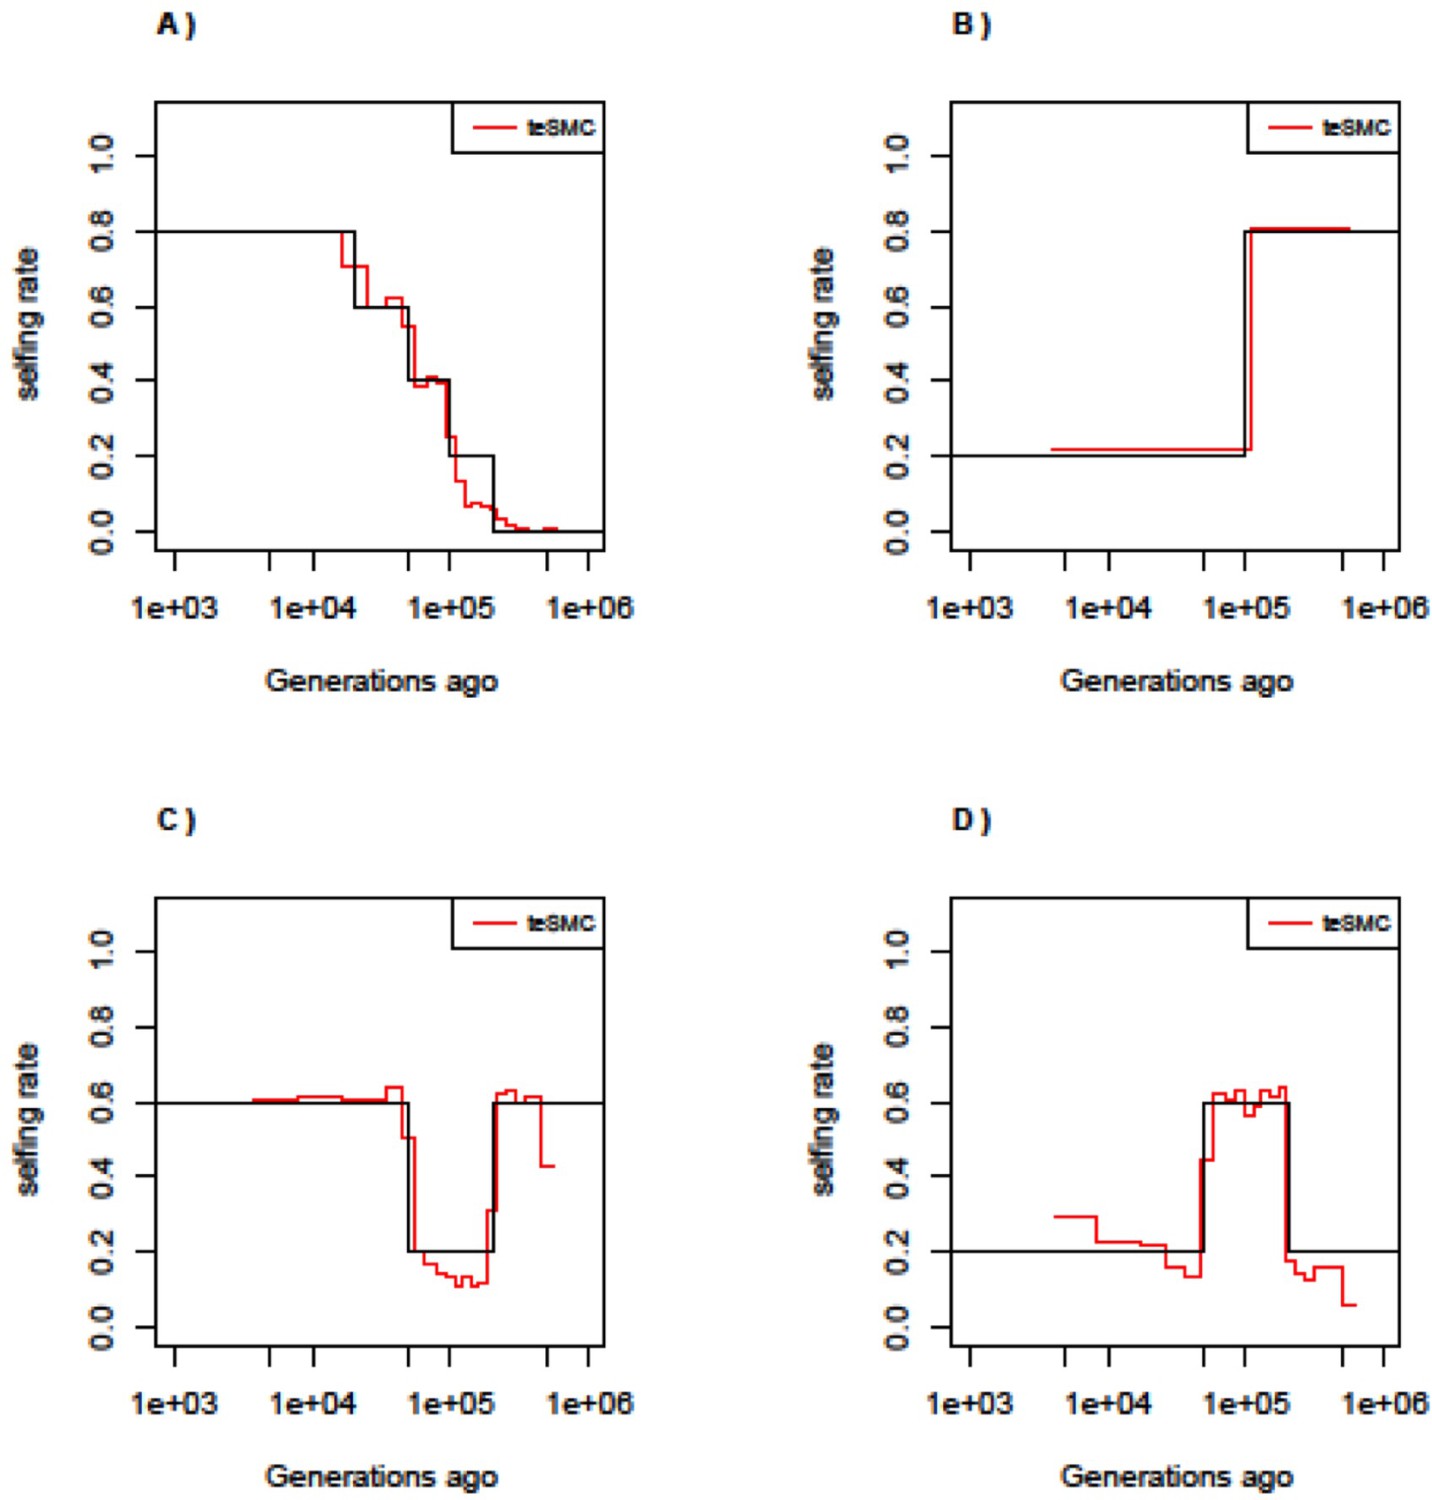
Best-case convergence of teSMC under four different scenarios of selfing transition. (A) Slow transition from outcrossing to selfing. (B) Transition from selfing to outcrossing. (C) Transition from 60% selfing to 80% outcrossing to 60% selfing. (D) Transition from 20% selfing to 60% selfing to 20% selfing. Population size is set to 100,000 and constant in time. Sample size is set to 20 haploid genome and sequence length to 100 Mbp. Recombination and mutation rate are set to 10–8 per generation per bp.
Figure 2—figure supplement 8
Performance of teSMC under complex selfing transitions.
Performance of teSMC on simulated sequence data under four different scenarios of selfing variations. (A) Slow transition from outcrossing to selfing. (B) Transition from selfing to outcrossing. (C) Transition from 60% selfing to 80% outcrossing to 60% selfing. (D) Transition from 20% selfing to 60% selfing to 20% selfing. Population size is set to 100,000 and constant in time. Sample size is set to 10 haploid genomes, with sequence length of 10 Mbp. Mutation and recombination rate are respectively set to 5×10⁻⁸ and 10–8 per generation per bp.
Figure 3 with 2 supplements
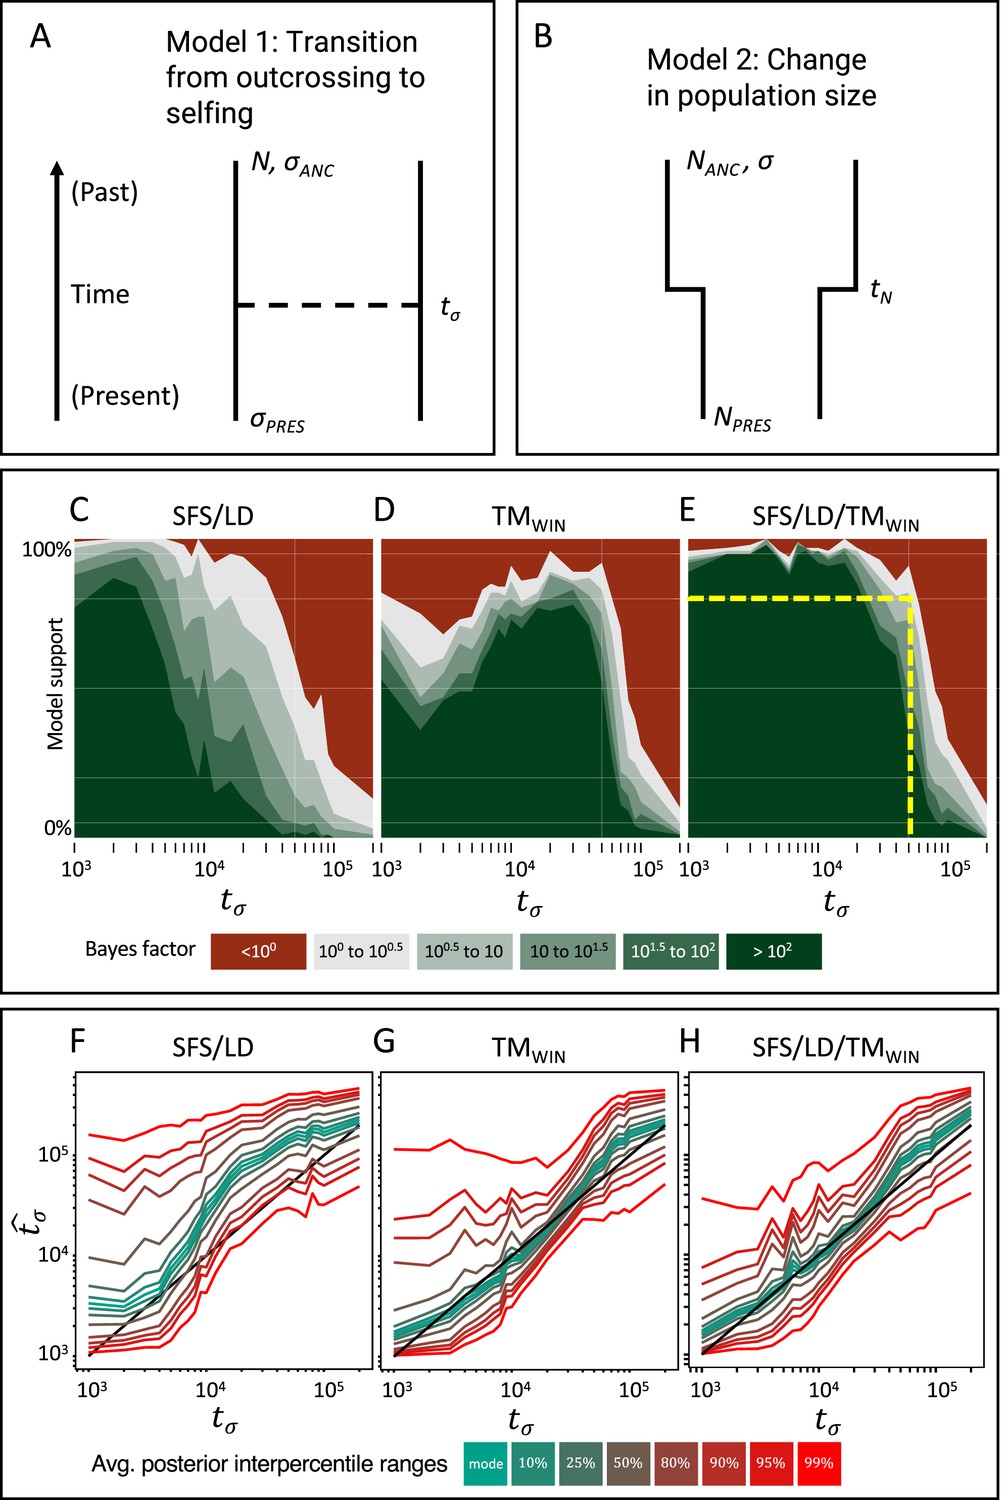
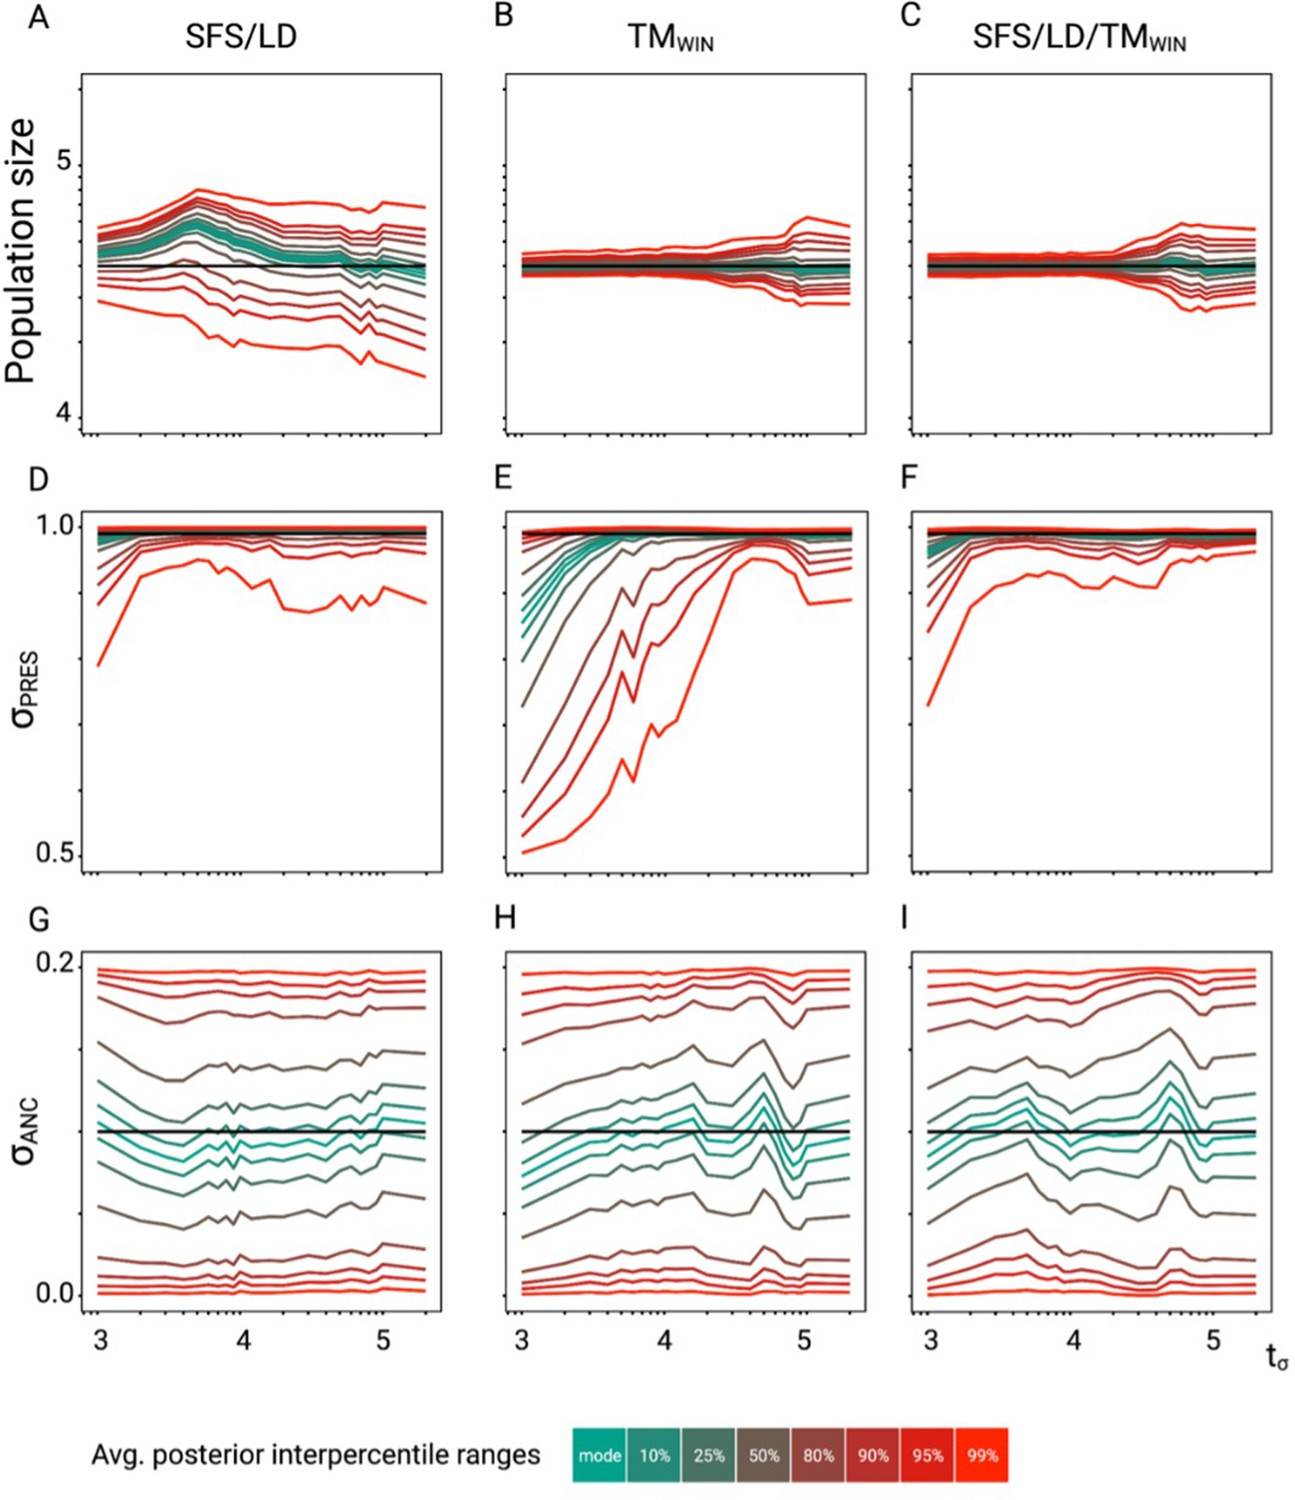
Approximate Bayesian computation (ABC) model choice performance analysis.
(A) Demographic model 1 in the model choice analysis: one population with a single transition from predominant selfing to predominant outcrossing. (B) Demographic model 2 in the model choice analysis: one population with constant selfing and a single change in population size. The parameters of interest are the population sizes (NPRES, NANC), the selfing rates (σANC, σPRES), and the time of change in selfing rate and size (tσ, tN). (C, D, E) Performance of the ABC model choice method using three different summarizations of data and different values of tσ (x-axis). (C) Combining site frequency spectrum (SFS) and linkage disequilibrium (LD). (D) Window-based transition matrix (TMwin). (E) The combination out of SFS, LD, and TMwin. The x-axis represents the investigated range of tσ values in log10(generations). The y-axis indicates how often, for 100 datasets simulated under model 1, tsABC correctly identified the transition-to-selfing model. The yellow dashed lines indicate that, for a Bayes factor of approximately 3 (BF=√10), tsABC identifies the right model 80% of the time, for transitions as old as 51,000 generations (corresponding to 2.5Ne generations in coalescent time units, where Nσ is the effective population size of the selfing population). (F, G, H) Parameter estimation accuracy for the age of a transition to selfing (100 simulated datasets) under a model with constant population size (N=40,000) and a change in selfing rate from σANC = 0.1 to σPRES = 0.99. Colored lines represent average quantiles for 100 posterior distributions.
Figure 3—figure supplement 1
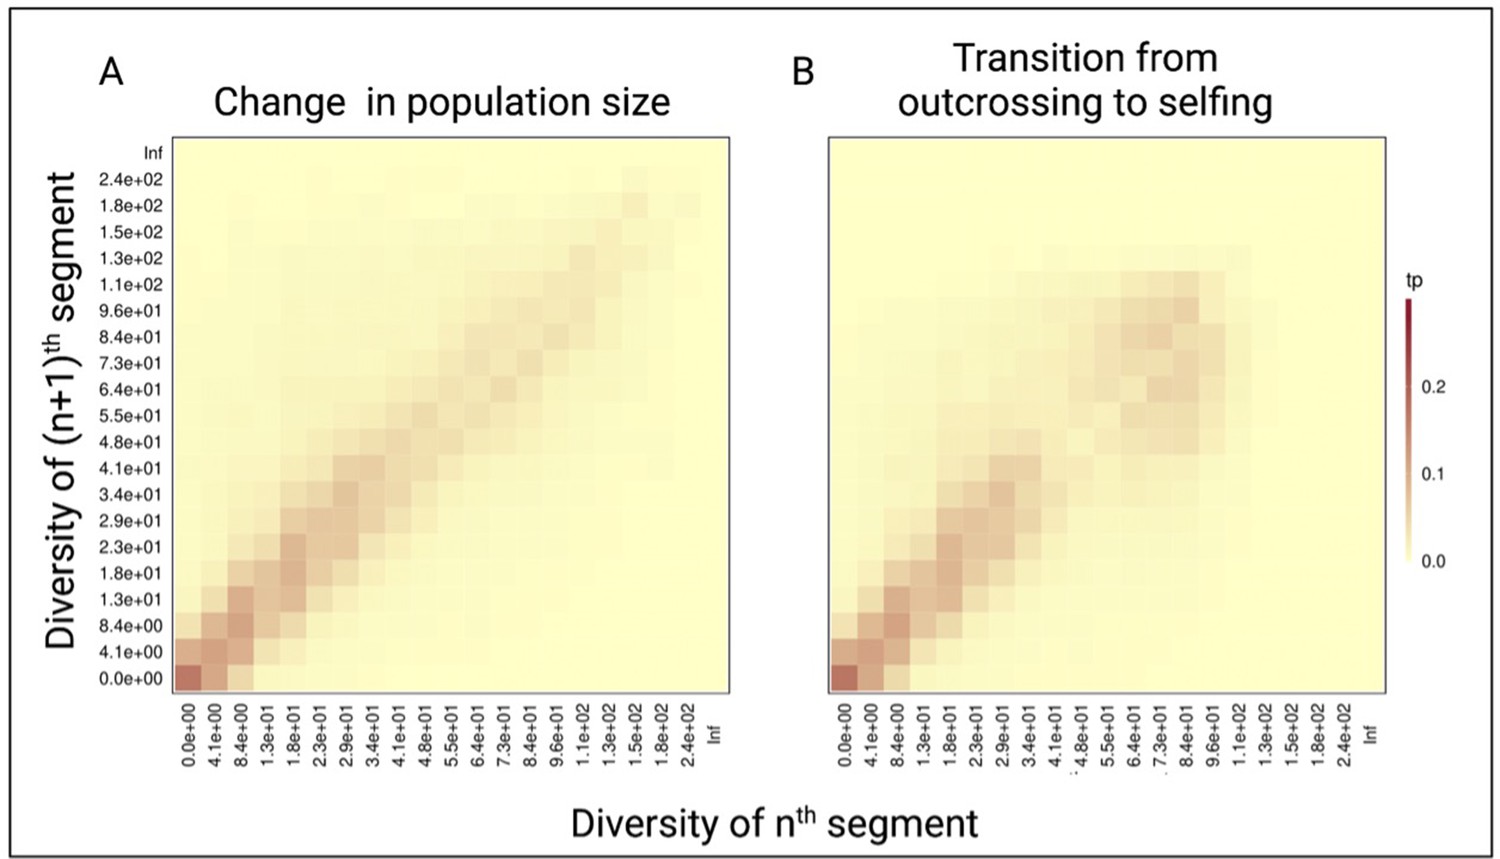
Pairwise diversity transition matrices used in tsABC.
(A) The transition matrix of pairwise diversity (TMwin) between adjacent non-overlapping 10 kb windows measured for 1 Mb of data simulated with the population-size change model (Figure 3B) in an outcrossing population with a stepwise change from NANC = 100,000 to low NPRES = 50,500. The population sizes were chosen to correspond to the rescaling of the effective population size by the selfing rates used in panel B. (B) The same transition matrix of pairwise diversity as in panel A for a constant population (N=100,000) but with a transition from outcrossing to predominant selfing (σ=0.99). The recombination rate was set to 1×10⁻⁸. These matrices summarize the probabilities that the nth window with a given diversity X is followed by the (n+1)th window of diversity Y. The heat colors indicate the transition probabilities (tp). The data was acquired by conducting 20 independent replications.
Figure 3—figure supplement 2
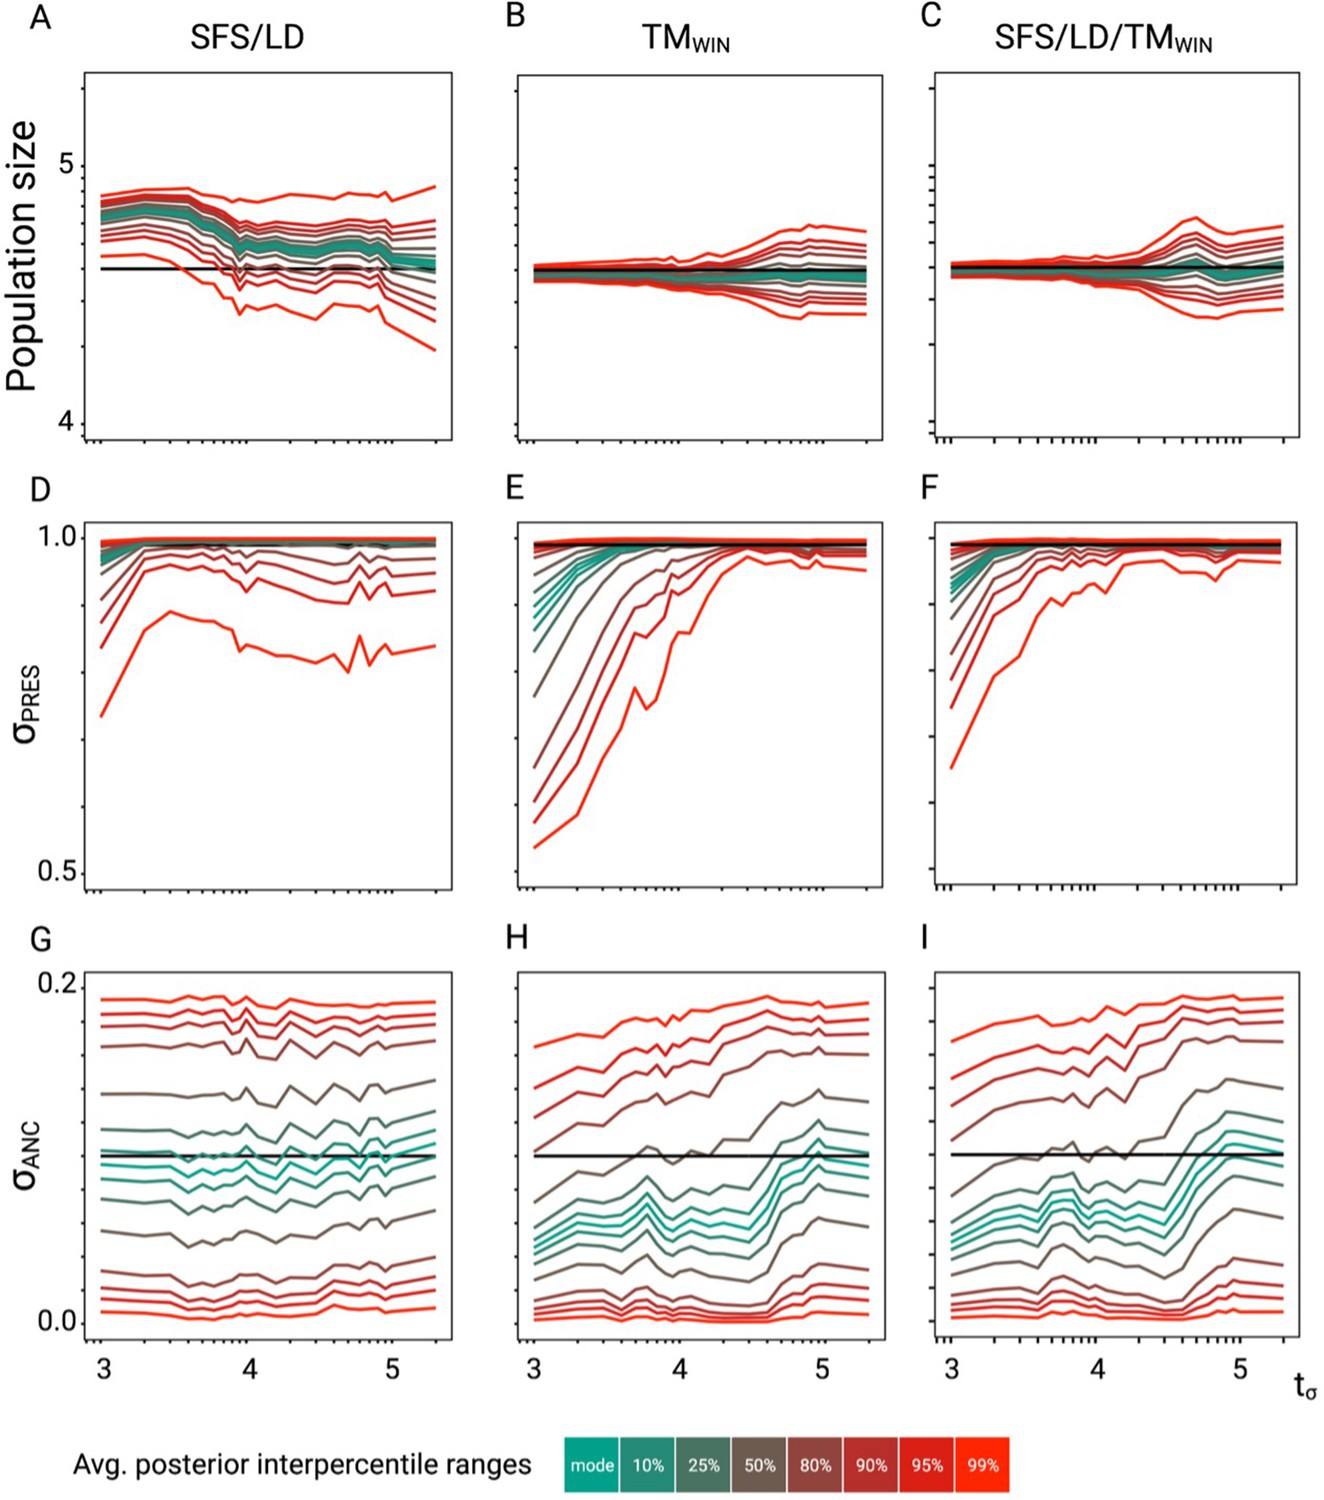
Approximate Bayesian computation (ABC) performance analysis.
Parameter re-estimation of the three additional parameters of the model described in Figure 3. (A, B, C) Re-estimation of the population size on 100 datasets simulated under a model with constant population size (N=40,000) and a change in selfing rate from σANC = 0.1 to σPRES = 0.99. Colored lines represent the average quantiles for 100 posterior distributions corresponding to the given credible intervals. (D, E, F) Re-estimation of the present selfing rate on 100 datasets simulated under a model with constant population size (N=40,000) and a change in selfing rate from σANC = 0.1 to σPRES = 0.99. Colored lines represent the average quantiles for 100 posterior distributions corresponding to the given credible intervals. (G, H, I) Re-estimation of the ancestral selfing rate on 100 datasets simulated under a model with constant population size (N=40,000) and a change in selfing rate from σANC = 0.1 to σPRES = 0.99. Colored lines represent the average interpercentile ranges for 100 posterior distributions corresponding to the given credible intervals.
Figure 4 with 1 supplement
Accuracy of teSMC and tsABC in the presence of background selection (BGS).
Inference of times of transition from outcrossing (σ=0.1) to predominant selfing (σ=0.99) using (A) teSMC and (B) tsABC. Simulations were done under constant population size and negative selection acting on exonic sequences. The spatial distribution of exonic sequences was fixed and taken from the annotation of A. thaliana. Negative selection was modeled using the distribution of fitness effects from Hämälä and Tiffin, 2020. (A) Comparison between simulated values of tσ and estimates obtained with teSMC using the one-transition mode. Estimations were conducted with and without masking exonic sequences subject to negative selection. The inference process was repeated 10 times for each experimental condition, employing independently simulated data sets. (B) Same analyses as in panel A but conducted with tsABC. Except for selection, simulations were done as in Figure 3H. Colored lines represent the average quantiles for 100 posterior distributions obtained with tsABC.
Figure 4—figure supplement 1
Accuracy of tsABC in the presence of background selection (BGS).
Parameter re-estimation of the three remaining parameters of the model (see Figure 3A). (A, B, C) Re-estimation of the population size on 100 datasets simulated under a model with constant population size (N=40,000) and a change in selfing rate from σANC = 0.1 to σPRES = 0.99. Colored lines represent the average quantiles for 100 posterior distributions corresponding to the given credible intervals. (D, E, F) Re-estimation of the present selfing rate on 100 datasets simulated under a model with constant population size (N=40,000) and a change in selfing rate from σANC = 0.1 to σPRES = 0.99. Colored lines represent the average quantiles for 100 posterior distributions corresponding to the given credible intervals. (G, H, I) Re-estimation of the ancestral selfing rate on 100 datasets simulated under a model with constant population size (N=40,000) and a change in selfing rate from σANC = 0.1 to σPRES = 0.99. Colored lines represent the average quantiles for 100 posterior distributions corresponding to the given credible intervals. The panels should be compared with the case without linked negative selection in Figure 2—figure supplement 6. Colored lines represent the average interpercentile ranges for 100 posterior distributions obtained with tsABC.
Figure 5 with 2 supplements
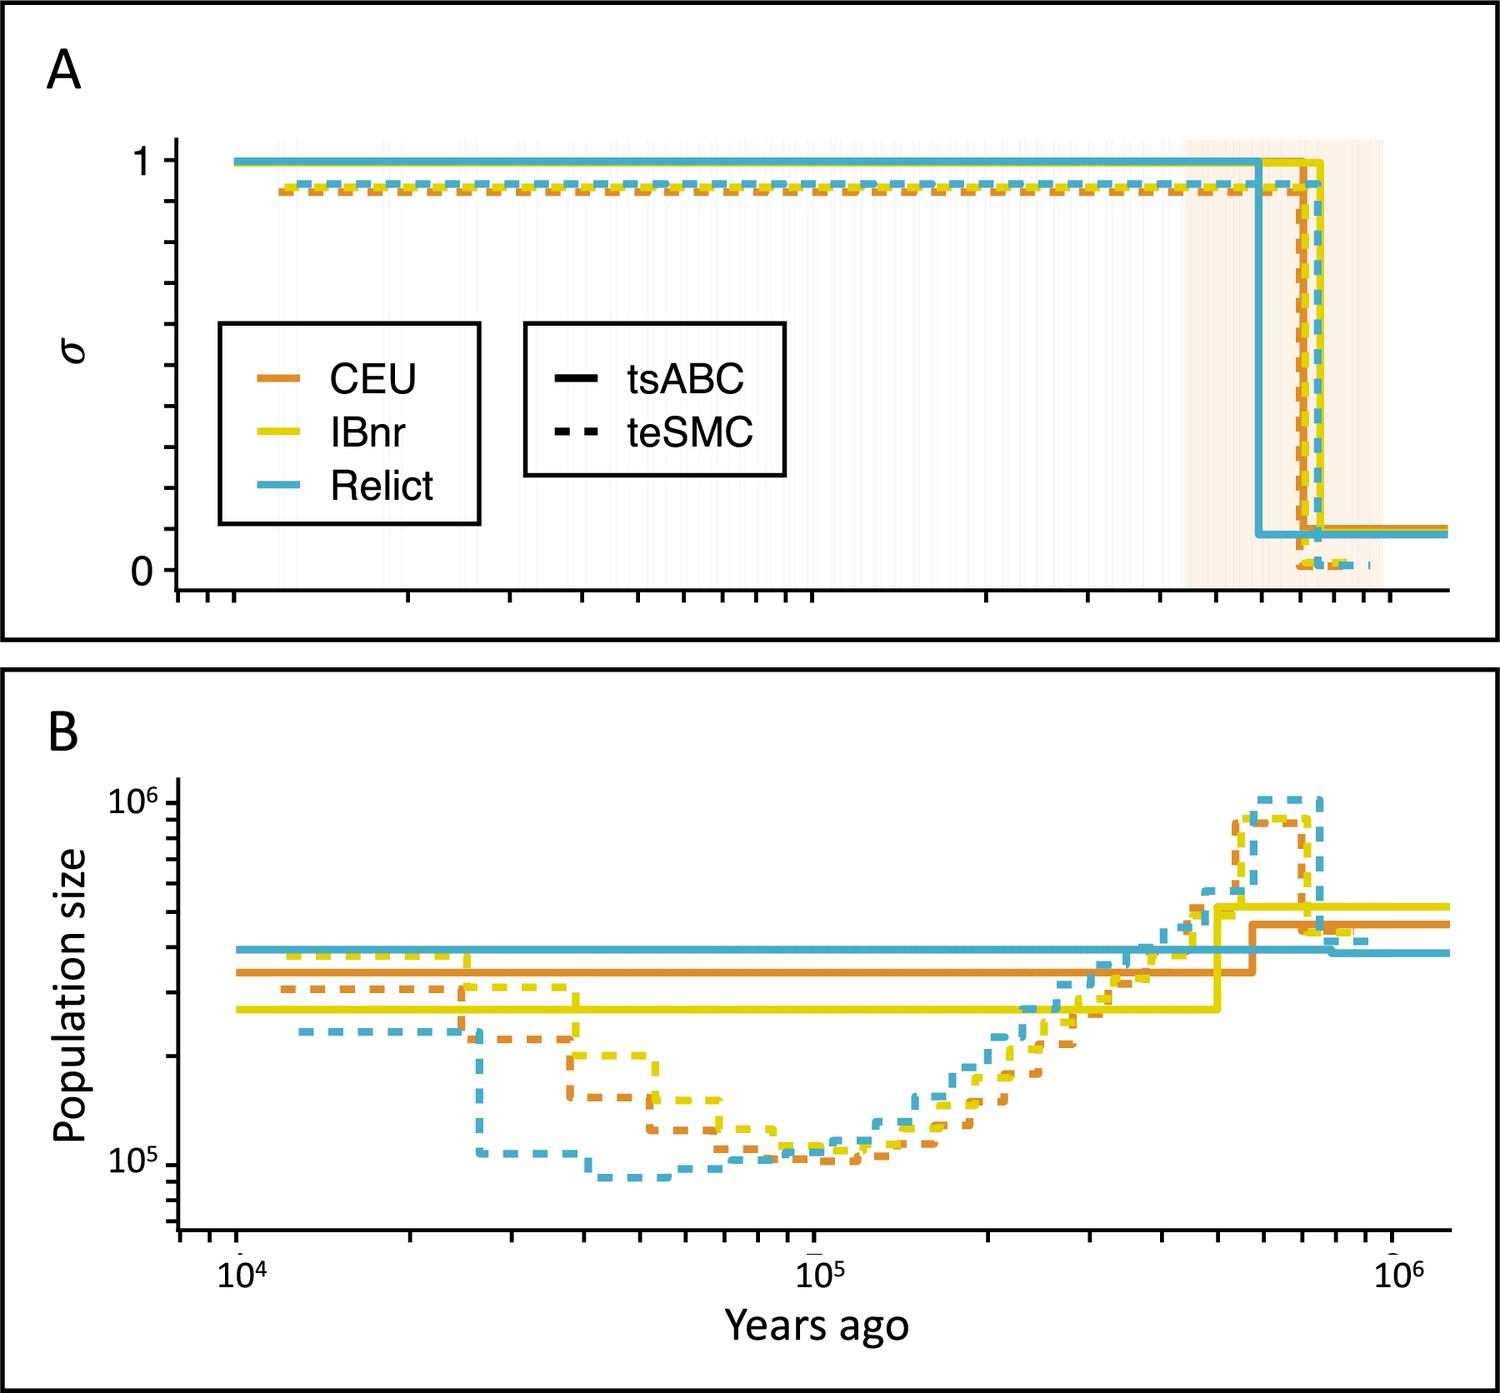
Inference of the time of transition from outcrossing to selfing in A. thaliana.
(A) Inferred transitions from outcrossing to selfing for three independent genetic clusters of A. thaliana from the 1001 genomes project (CEU, IBnr, Relict) using tsABC and teSMC. The 95% CI (CEU) of the posterior distribution of tσ (tsABC) is indicated in light-orange. (B) Co-estimated population sizes over time with a single population change (tsABC) or piecewise constant (teSMC). 20 samples (CEU, IBnr for teSMC), 17 samples (Relicts), 99 samples (CEU, tsABC), or 66 samples (IBnr, tsABC) were used.
Figure 5—figure supplement 1
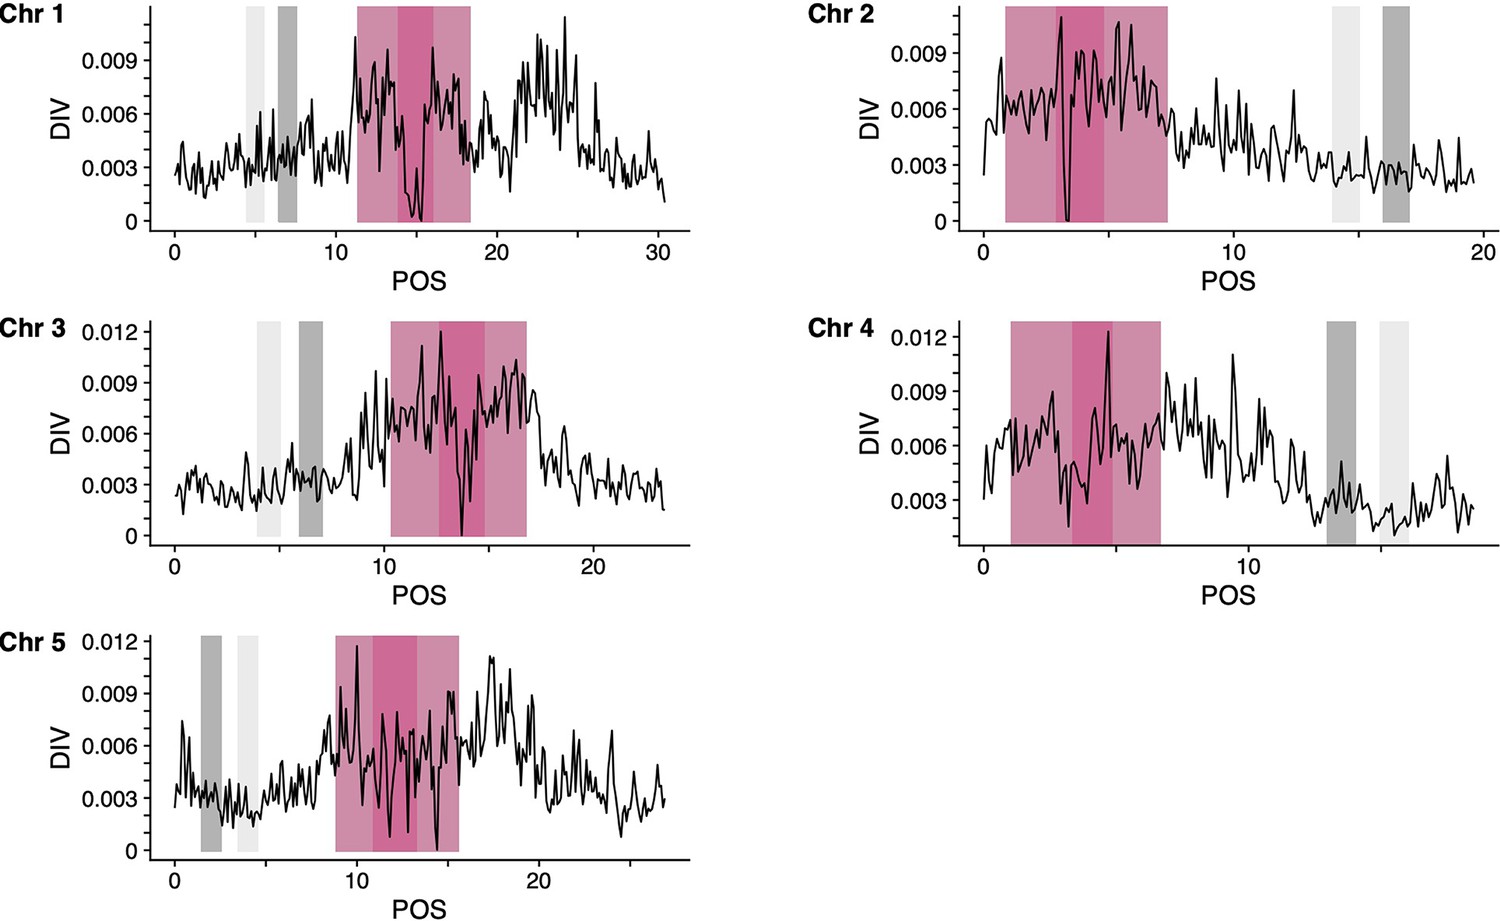
Genomic regions of A. thaliana genome (TAIR10) used for the teSMC and tsABC analyses.
Panels show, for the five chromosomes of A. thaliana, the nucleotide diversity (pi) calculated with tskit using a sliding window of 100 kb. Results are shown only for the CEU sample used (n=99) for the teSMC and tsABC analyses. Genomic regions used for the teSMC and tsABC analyses are highlighted in gray. The same regions were used to obtain the exonic distribution for the BGS simulations in Figure 4. Regions highlighted in dark and light pink represent the coordinates of the centromeres and pericentromeres, respectively (Underwood et al., 2018). Regions indicated in light gray were used to conduct a replicate of the statistical inference with teSMC (Figure 5—figure supplement 2).
Figure 5—figure supplement 2
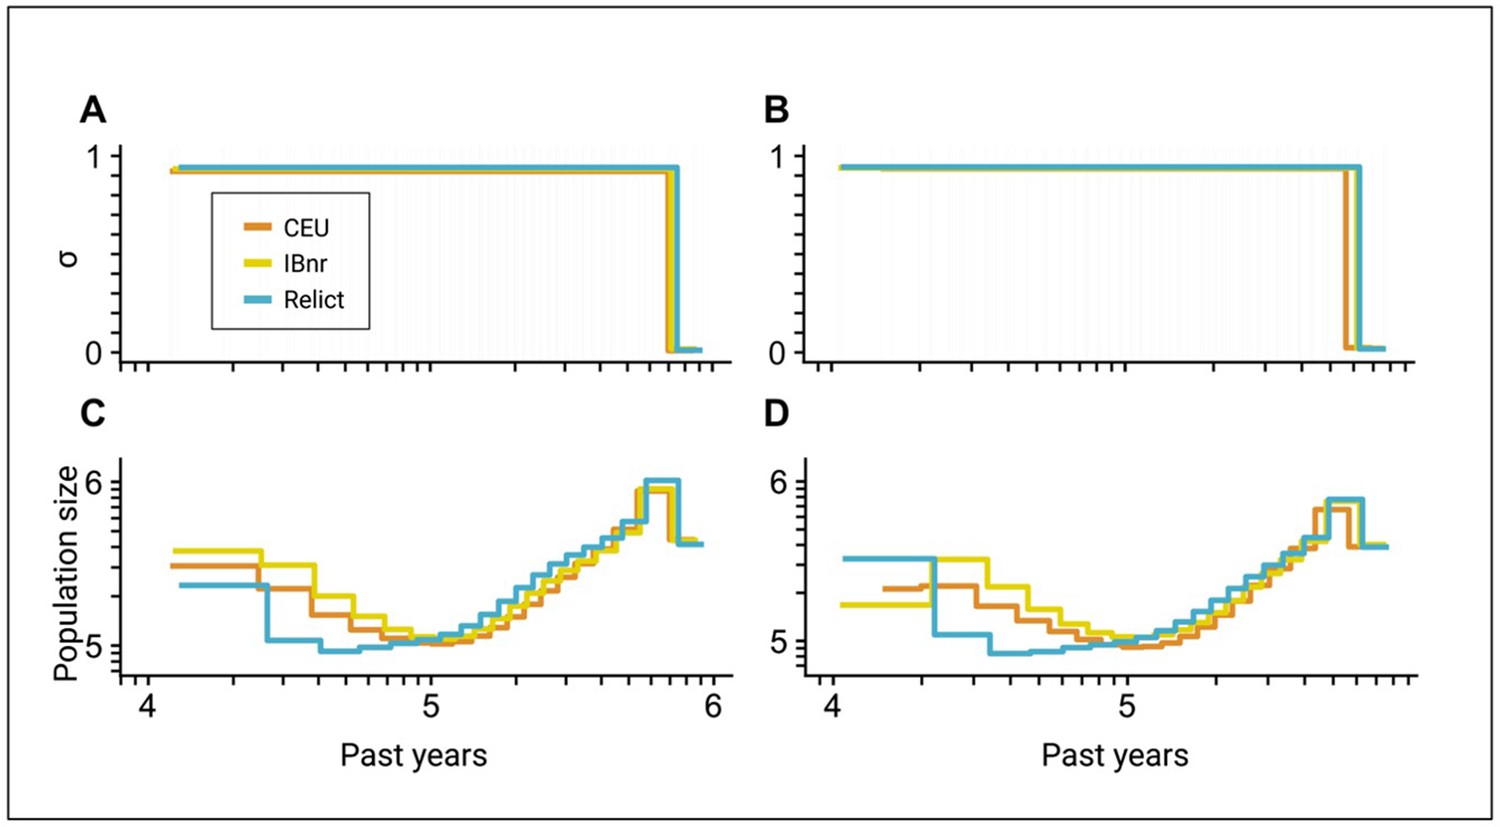
Inference of the time of transition from outcrossing to selfing in A. thaliana using two different sets of genomic regions.
(A, B) Inferred transitions from outcrossing to selfing for three ancestry groups of A. thaliana from the 1001 genomes project (CEU: central European, IBnr: Iberia non-relict, Relict) using teSMC. (C, D) Co-estimated population sizes over time as piecewise constant (teSMC). Panels A and C are identical to the teSMC results in Figure 5. Panels B and C show a replicate of the inference procedure using an alternative set of genomic regions (see Figure 5—figure supplement 1). 20 samples (CEU, IBnr for teSMC), 17 samples (Relicts), 99 samples (CEU, tsABC), or 66 samples (IBnr, tsABC) were used.
Tables
Table 1
Estimated times of transitions from predominant outcrossing to predominant selfing in A. thaliana.
Estimations were conducted for three different ancestry groups: central Europe (CEU), Iberian non-relicts (IBnr), and Relicts using both teSMC and tsABC. The 95% CI of all jointly inferred parameters are provided in Supplementary file 1, Table S6. For both methods, polymorphism data was measured on five genomic regions of 1 Mb, located on the five chromosomes of A. thaliana. For teSMC exonic regions were excluded from the analysis. Only accessions with cluster membership >95% were included.
| Method | Population | Sample size | Mode | 95% credibility interval | |
|---|---|---|---|---|---|
| teSMC | CEU | 20 | 697,490 | NA | NA |
| teSMC | IBnr | 20 | 713,421 | NA | NA |
| teSMC | Relicts | 17 | 749,668 | NA | NA |
| tsABC | CEU | 99 | 707,995 | 443,486 | 973,841 |
| tsABC | IBnr | 66 | 756,976 | 397,049 | 988,708 |
| tsABC | Relicts | 17 | 592,321 | 386,406 | 934,499 |
Additional files
-
Supplementary file 1
Supplementary tables.
Parameters for simulated datasets to investigate the performance of tsABC. Table S2: Parameter priors used for the performance analysis of tsABC. Table S3: Parameter priors used to estimate the transition from outcrossing to selfing in A. thaliana. Table S4: A. thaliana samples with >95% cluster membership (https://1001genomes.github.io/admixture-map/) used to estimate the transition from outcrossing to selfing obtained from the 1001 genomes website (https://1001genomes.org/data/GMI-MPI/releases/v3.1/SNP_matrix_imputed_hdf5/1001_SNP_MATRIX.tar.gz). Table S5: Genomic regions of A. thaliana in TAIR10 used for the tsABC and teSMC analyses. Table S6: Jointly estimated parameters in the context of transitions from predominant outcrossing to predominant selfing in A. thaliana.
- https://cdn.elifesciences.org/articles/82384/elife-82384-supp1-v2.xlsx
-
MDAR checklist
- https://cdn.elifesciences.org/articles/82384/elife-82384-mdarchecklist1-v2.docx
Download links
A two-part list of links to download the article, or parts of the article, in various formats.
Downloads (link to download the article as PDF)
Open citations (links to open the citations from this article in various online reference manager services)
Cite this article (links to download the citations from this article in formats compatible with various reference manager tools)
Joint inference of evolutionary transitions to self-fertilization and demographic history using whole-genome sequences
eLife 12:e82384.
https://doi.org/10.7554/eLife.82384


