SIMMER employs similarity algorithms to accurately identify human gut microbiome species and enzymes capable of known chemical transformations
- Pharmaceutical Sciences and Pharmacogenomics Graduate Program, University of California, San Francisco, United States
- Institute of Data Science and Biotechnology, Gladstone Institutes, United States
- Rheumatology Division, Department of Medicine, University of California, San Francisco, United States
- Department of Microbiology & Immunology, University of California, San Francisco, United States
- Chan Zuckerberg Biohub-San Francisco, United States
- Department of Epidemiology & Biostatistics, University of California, San Francisco, United States
- Institute for Human Genetics, University of California, San Francisco, United States
- Bakar Computational Health Sciences Institute, University of California, San Francisco, United States
Figures
Figure 1
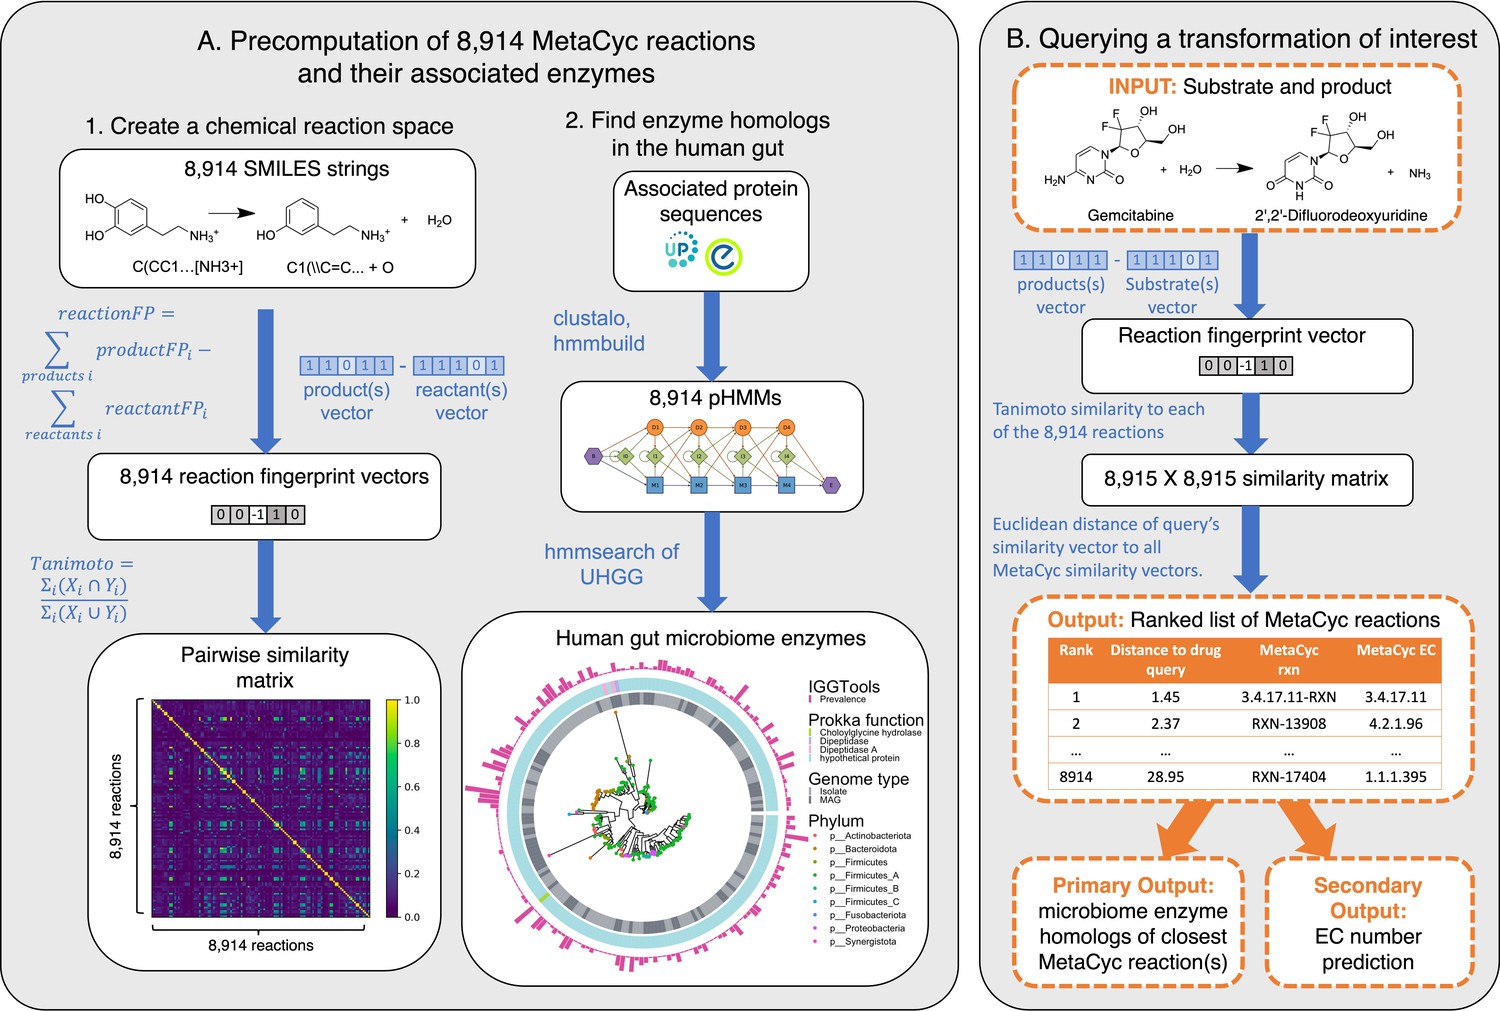
SIMMER architecture.
(A) Precomputation on 8914 gene-annotated bacterial reactions downloaded from MetaCyc. Chemical fingerprints representing each MetaCyc reaction were created from SMILES descriptors. A latent chemical space was then created via a pairwise reaction similarity matrix based on Tanimoto coefficients. For each reaction, relevant gene sequences were retrieved from UniProt and Entrez database linkouts and used to create multiple sequence alignments and subsequent profile hidden Markov models (pHMMs) using ClustalO and HMMER3, respectively. pHMMs were used to retrieve homologs in a catalog of human gut microbiome genes. (B) Running a SIMMER query. After receiving a reaction query (input compound, cofactors, and products), SIMMER fingerprints the reaction and compares it to the precomputed chemical space from (A). MetaCyc reactions are sorted by similarity to the query. From the most similar reaction(s), human gut microbiome enzymes are reported along with their abundance and prevalence in gut microbiomes. As an auxiliary output, Enzyme Commission (EC) numbers are predicted based on enrichment in the ranked reaction list.
Figure 2 with 4 supplements
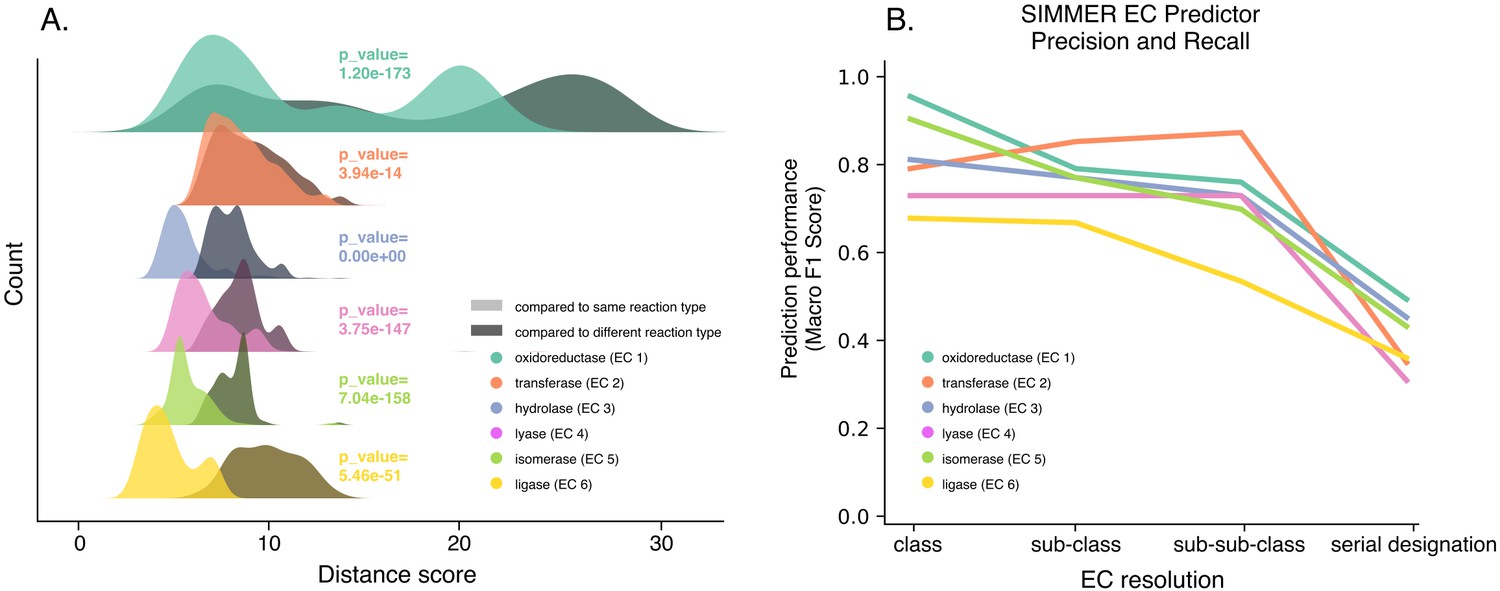
SIMMER’s chemical representations capture information relevant to enzymatic reactions.
(A) SIMMER clusters similar reactions together in chemical space. To analyze SIMMER’s ability to group chemically similar reactions, we examined reaction similarity within versus without Enzyme Commission (EC) classes using the precomputed MetaCyc reaction dataset (N = 8914 reactions). A silhouette-like euclidean distance score was created by determining for each reaction its euclidean distance to all reactions within its EC class versus outside its EC class. For all EC classes, scores were smaller within versus without EC classes using SIMMER’s chemical representation, indicating that SIMMER can detect reaction similarity within EC classes. From the pairs of distributions, we computed a Kolmogorov statistic to determine if the distributions significantly (p < 0.05) differed. (B) The F1-score, or harmonic mean of SIMMER’s precision and recall, when predicting EC numbers on a subset of the MetaCyc database (N = 576 reactions total; 96 per EC class). The score is high for EC classes, and it generally decreases as an EC number’s resolution increases.
-
Figure 2—source data 1
Euclidean distances for reactions in the same versus other EC classes across reaction representations, and performance statistics for SIMMER's EC class predictor.
- https://cdn.elifesciences.org/articles/82401/elife-82401-fig2-data1-v3.xlsx
Figure 2—figure supplement 1
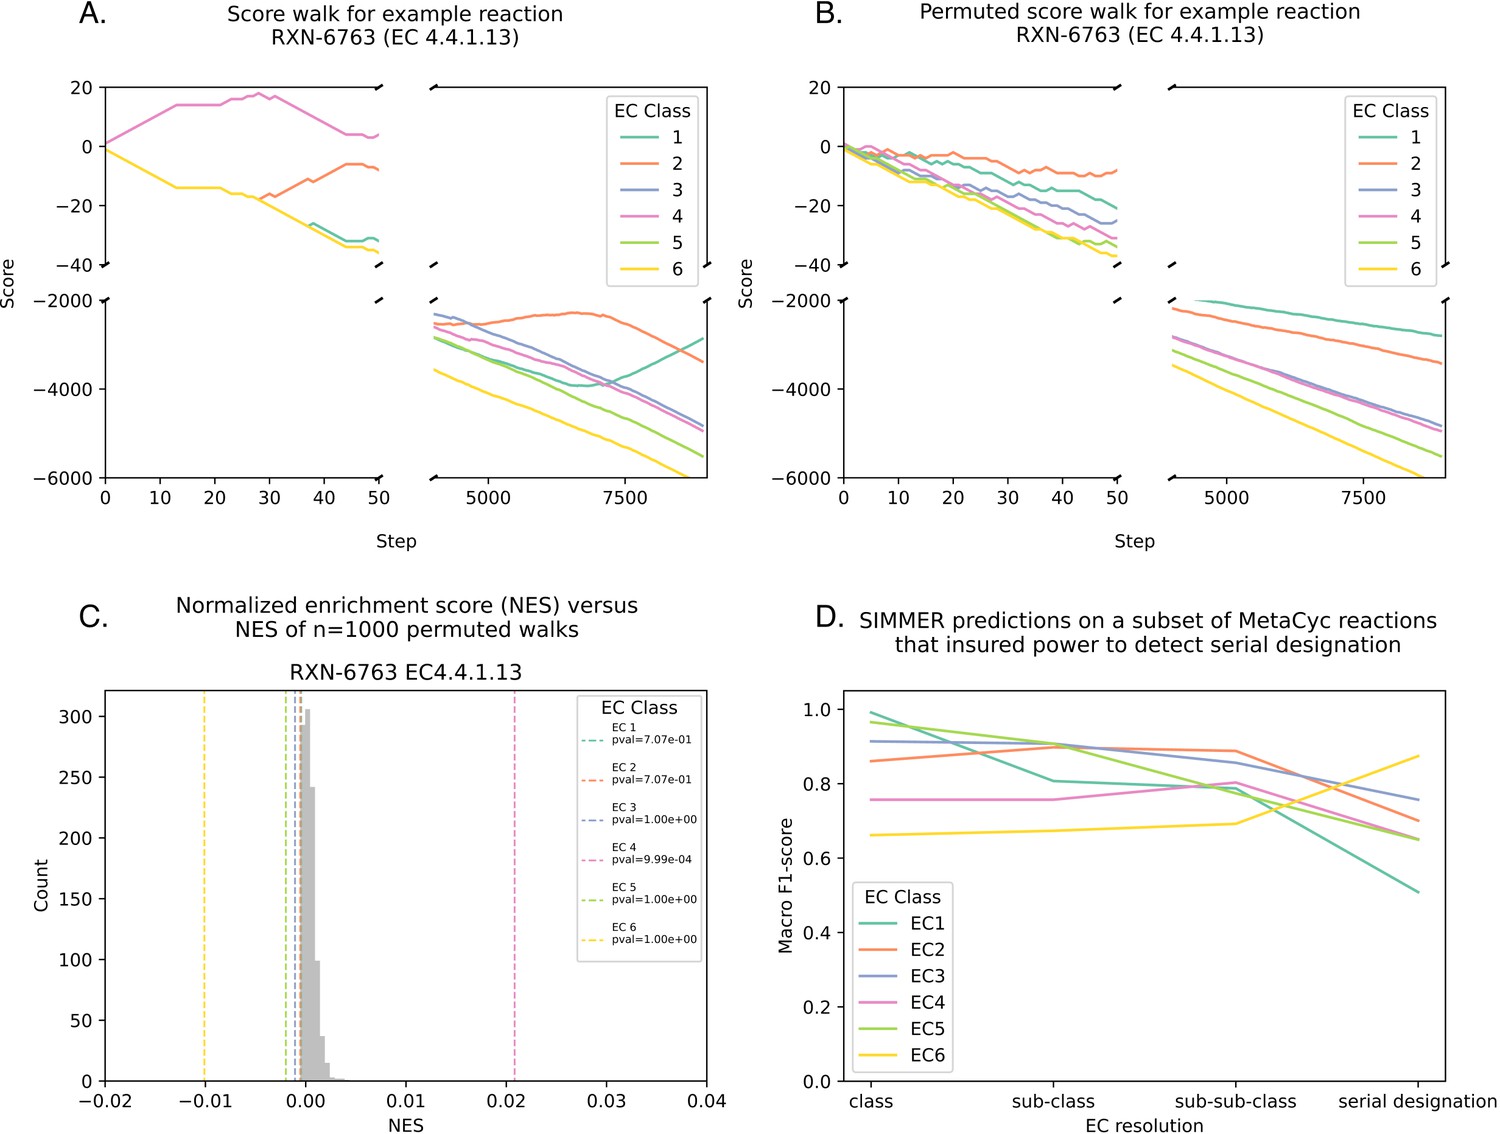
SIMMER predicts an Enzyme Commission (EC) code (i.e., reaction type) for a query reaction if there is an enrichment of a particular EC at the top of the reaction list.
(A) For each EC code associated with MetaCyc reactions, an enrichment score (ES) was calculated by walking down the ranked list of reactions. Starting with a score of zero, each time the given EC is encountered the score increases by one, and each time a different EC is encountered the score decreases by one. Panel A is an example of such a walk with MetaCyc reaction RXN-6763. (B) Significance is established by comparing the true ES to the ES achieved from 1000 permutations of a shuffled reaction list. Panel B is an example of how RXN-6763 loses its EC enrichment structure after shuffling. (C) Because the MetaCyc database of reactions is unbalanced in its EC code representation, ES scores for a given EC type are divided by the number of times the EC in question occurs in the database. This yields a normalized ES (NES) for SIMMER reporting. This is also performed for the shuffled distributions. (D) For the serial designation of an EC code (the most granular description of an EC code), SIMMER’s performance diminished (Figure 2B), because enrichment calculations suffer from increased uniqueness in the ranked list and therefore reduced power to determine a match. This is proven here, as when the database is subsampled to ensure at least three of each unique serial designation, F1-scores (the harmonic mean of precision and recall) and accuracy remain high despite the increased EC resolution.
Figure 2—figure supplement 2
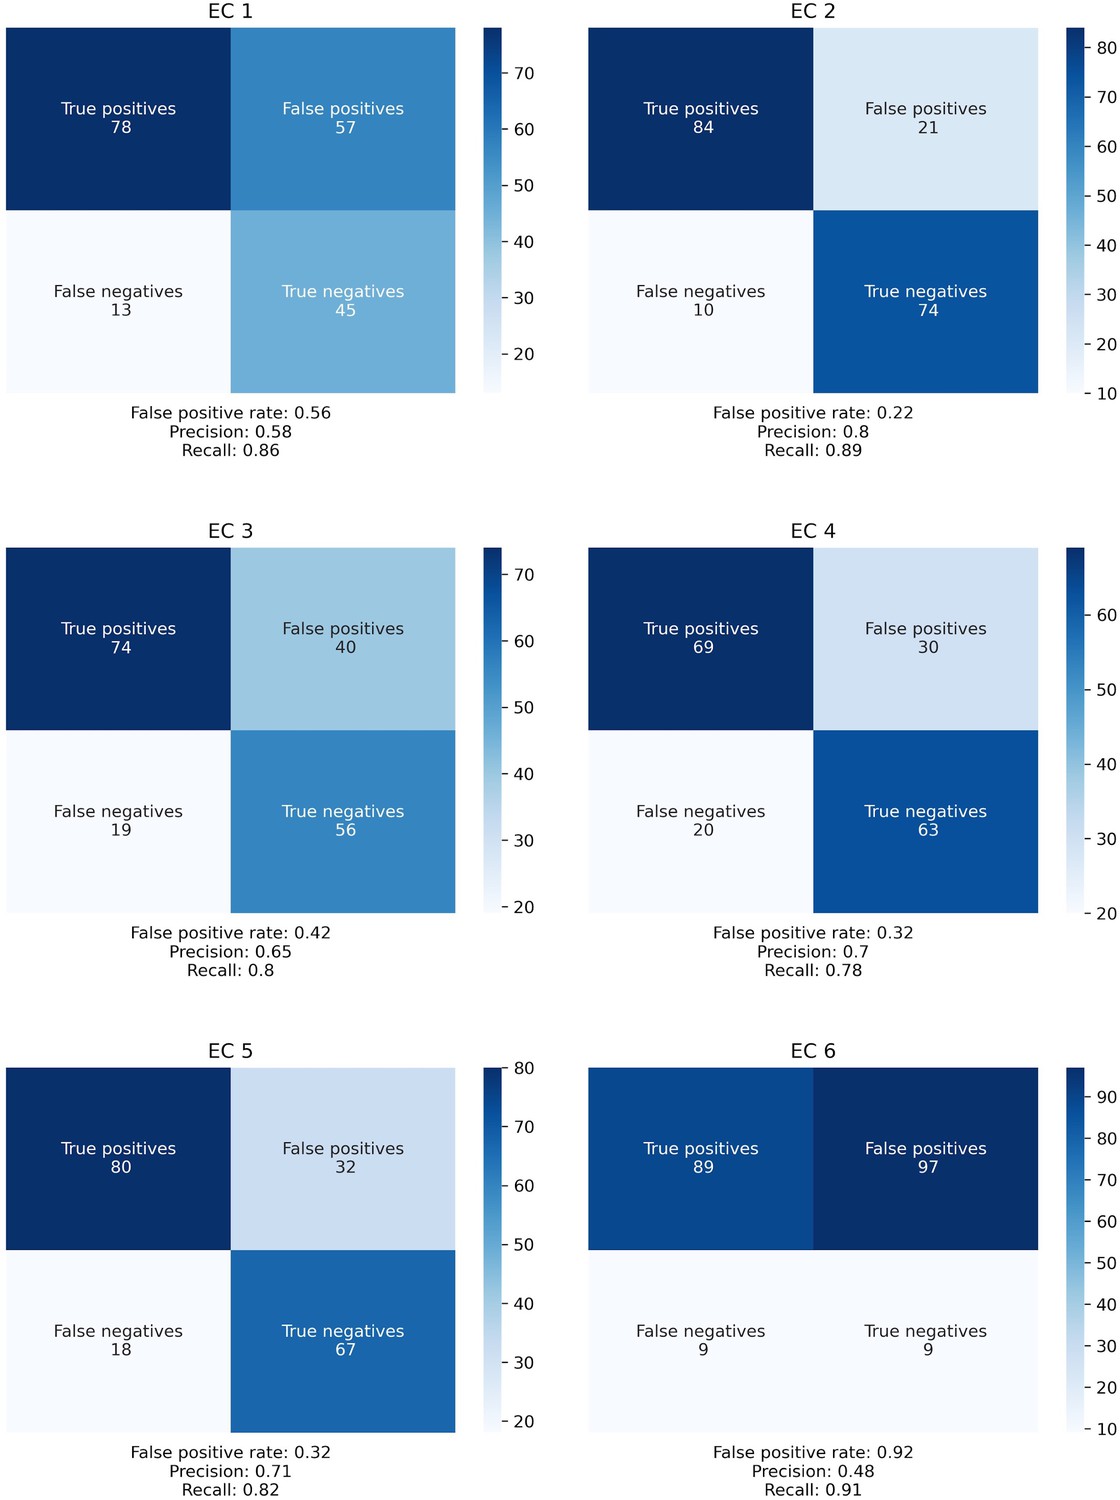
Confusion matrices for SIMMER Enzyme Commission (EC) class predictions.
The confusion matrices describe the same data as Figure 2B, but expanded out to describe the absolute number of true positives, false positives, false negatives, and true negatives for each EC class.
Figure 2—figure supplement 3
Euclidean distance distributions and silhouette scores for top-level Enzyme Commission (EC) codes are resilient to fingerprint type.
Distributions are computed as described in Figure 2A.
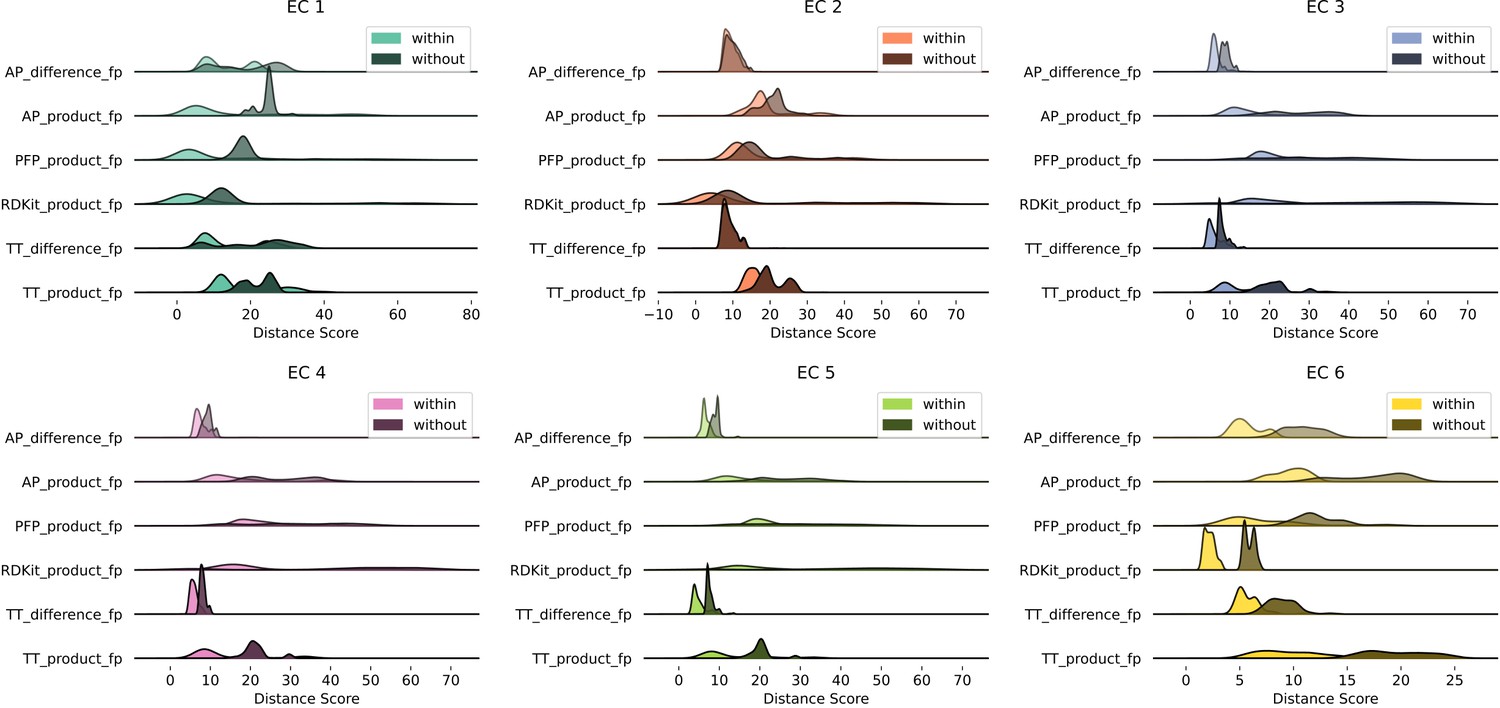
Figure 2—figure supplement 4
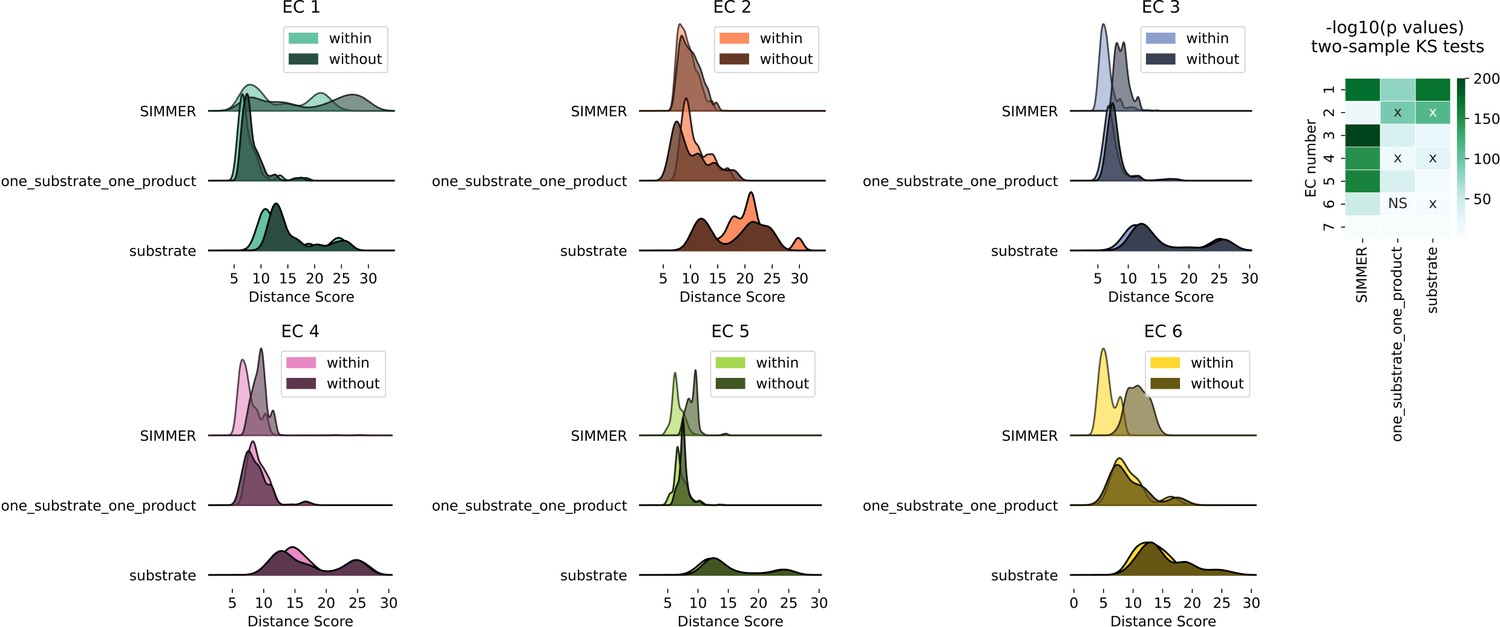
Euclidean distance distributions and silhouette scores for top-level Enzyme Commission (EC) codes are sensitive to chemical representation type.
Distributions are computed as described in Figure 2A. The resulting score distributions were used to compare SIMMER’s resilience to different chemical representations, such as removal of products and cofactors (the representation methods employed by DrugBug [Sharma et al., 2017] and MicrobeFDT [Guthrie et al., 2019]) or the inclusion of exactly one substrate and exactly one product (the Mallory et al. method [Mallory et al., 2018]). For all EC classes, scores were smaller within versus without EC classes using SIMMER’s chemical representation, indicating that SIMMER can detect reaction similarity within EC classes. However, this was not consistently true when using only the input compound without cofactors or products (substrate), or when using only one substrate and product (one_substrate_one_product). From the pairs of distributions, we computed a Kolmogorov statistic to determine if the distributions significantly (p < 0.05) differed. This showed that the differences were statistically significant for SIMMER chemical representations and reduced, or in the wrong direction, when using a reduced representation. X’s in the KS test heatmap indicate an incorrect direction of difference (without grouping closer than within).
Figure 3

SIMMER’s chemical representations can be used to find shared, responsible enzymes.
(A) When SIMMER was queried with a MetaCyc reaction, other reactions driven by the same enzyme are returned as the most similar. As a contrast, reactions driven by a different enzyme yield a more uniform rank distribution. Solid lines of the violin plots depict median reaction similarity rank and dashed lines represent lower and upper quartile ranges. (B) There is a negative association between pairwise reaction euclidean distance and pairwise protein global percent identity, but it is highly variable, demonstrating the need for protein searches that do not rely on high global percent identity to capture shared function.
-
Figure 3—source data 1
Pairwise similarities for SIMMER's underlying chemical and protein data.
- https://cdn.elifesciences.org/articles/82401/elife-82401-fig3-data1-v3.xlsx
Figure 4 with 1 supplement
An expanded list of gut bacterial enzymes relevant to known cases of drug metabolism.
Eleven of the 18 enzymes responsible for positive control drug metabolism events have high-confidence homologs that we gathered by filtering for biological significance.
-
Figure 4—source data 1
UHGG database identifiers for all putative homologs of the 18 previously characterized drug metabolizing enzymes.
- https://cdn.elifesciences.org/articles/82401/elife-82401-fig4-data1-v3.xlsx
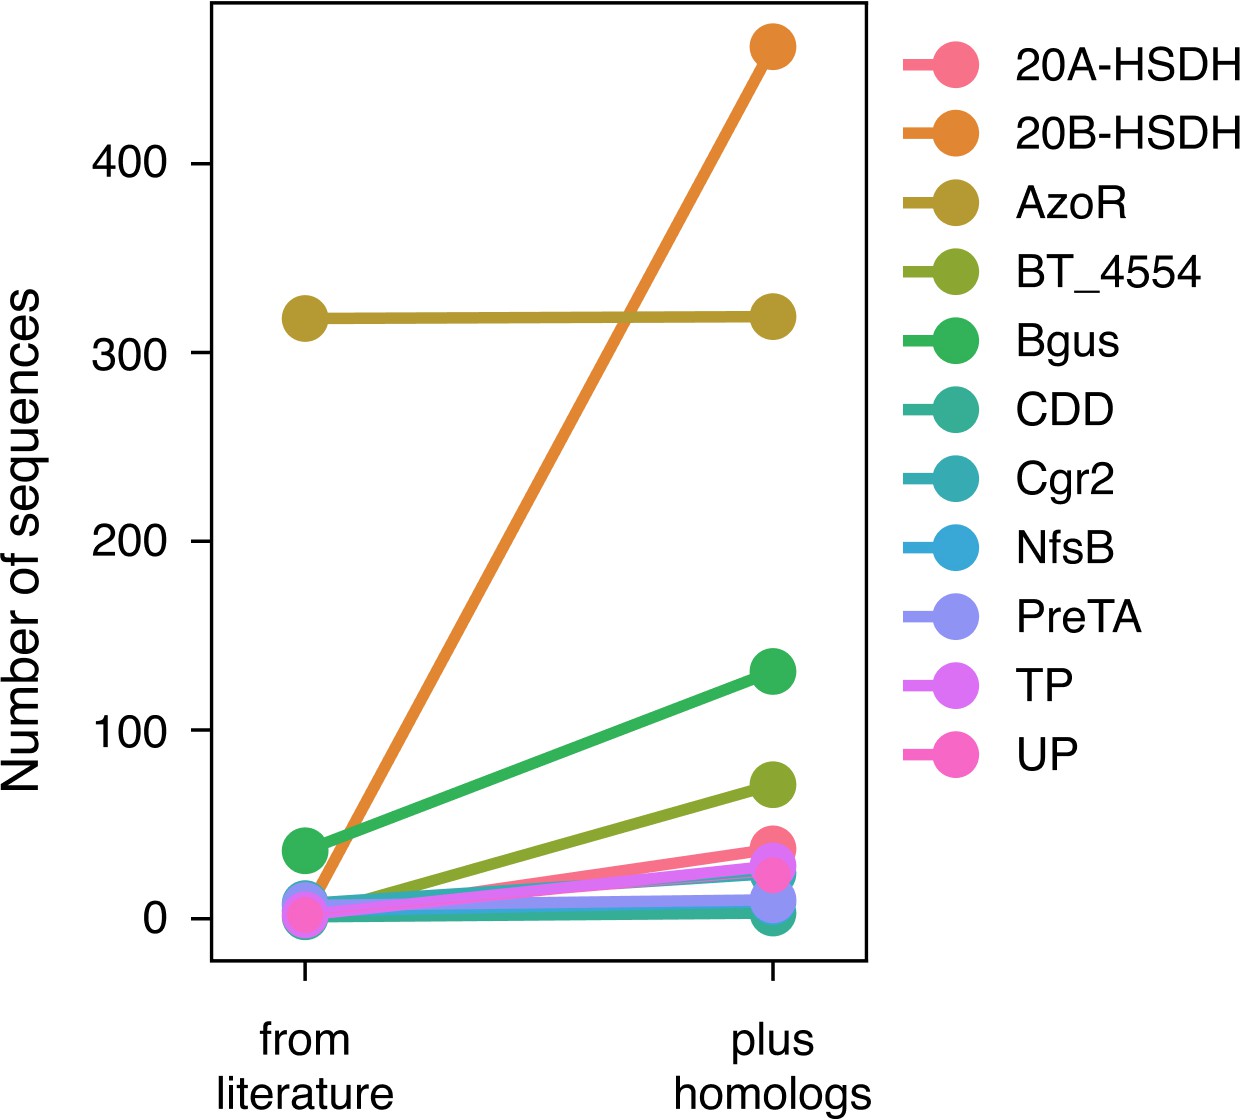
Figure 4—figure supplement 1
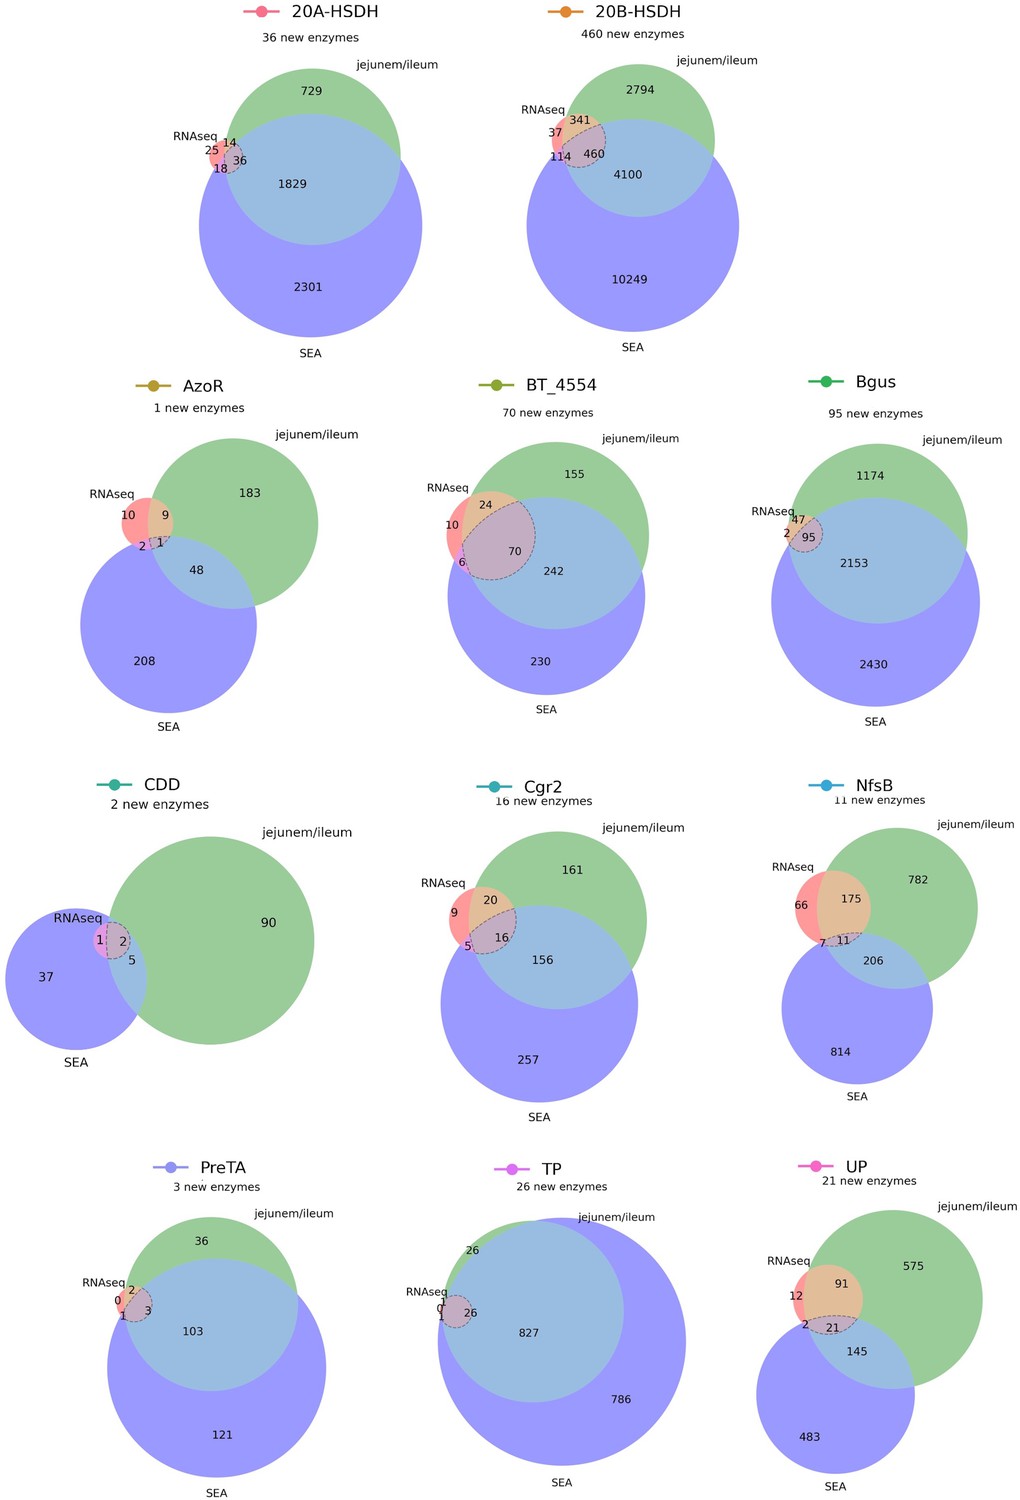
An expanded list of gut bacterial enzymes relevant to known cases of drug metabolism.
52,849 total candidate homologs (a median of 1087 candidates per enzyme) were obtained via profile hidden Markov model (pHMM) searches with sequences from the literature. These putative homologs were filtered for presence in the human jejunum/ileum, presence in RNA-sequencing studies, and predicted affinity for the substrate in question using SEA. This resulted in 741 additional enzyme sequences for 33 positive control reactions.
Figure 5 with 2 supplements
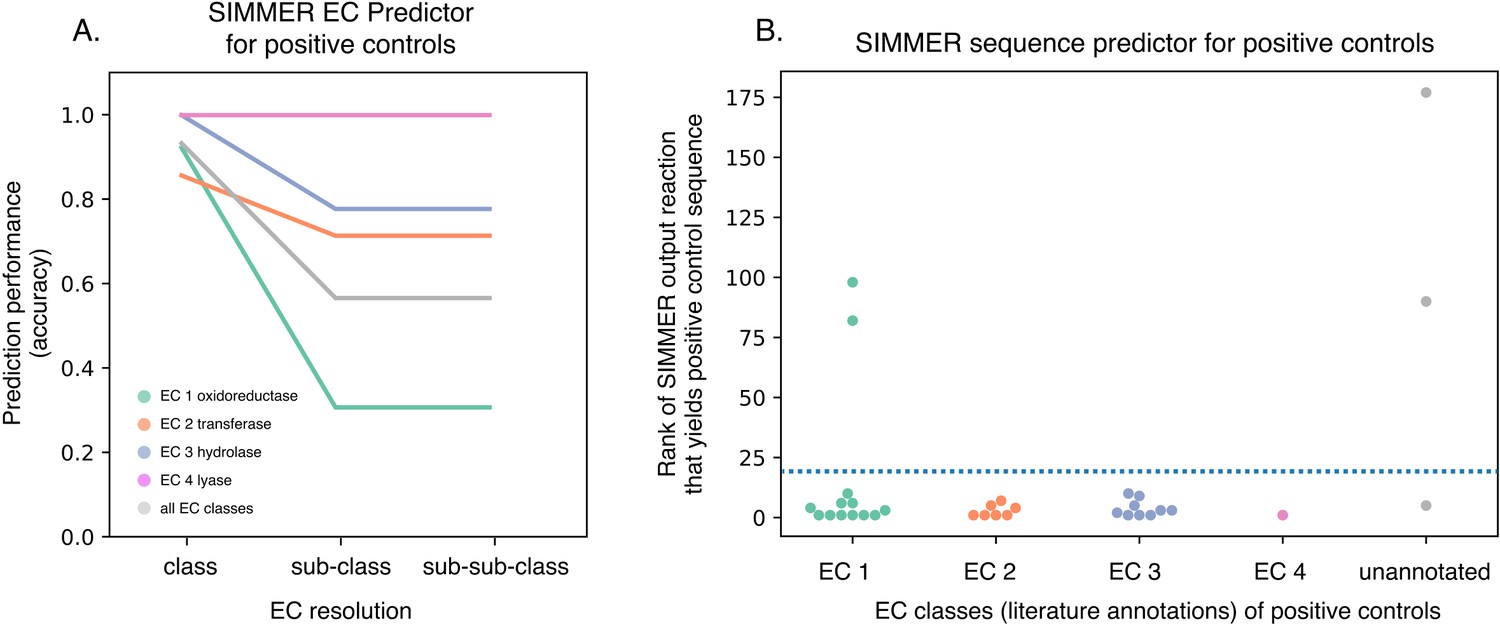
SIMMER captures known gut bacterial enzymes involved in drug metabolism.
(A) SIMMER accurately predicted Enzyme Commission (EC) classes for 28 previously characterized reactions that possess EC annotations. As with the MetaCyc database (Figure 2B), accuracy dropped off as EC resolution increased. (B) SIMMER predicted bacterial sequences previously shown to drive 33 drug metabolism events in the gut microbiome. Depicted is the rank (out of N = 8914 reactions) of the MetaCyc reaction that yielded a gut microbiome homolog matching the known positive control sequence. Reported accuracy is based on such a reaction being within the top 20 ranked reactions (dashed blue line).
-
Figure 5—source data 1
Performance analysis of 33 known chemical transformations (positive controls) using SIMMER's full representation or only a substrate.
- https://cdn.elifesciences.org/articles/82401/elife-82401-fig5-data1-v3.xlsx
Figure 5—figure supplement 1
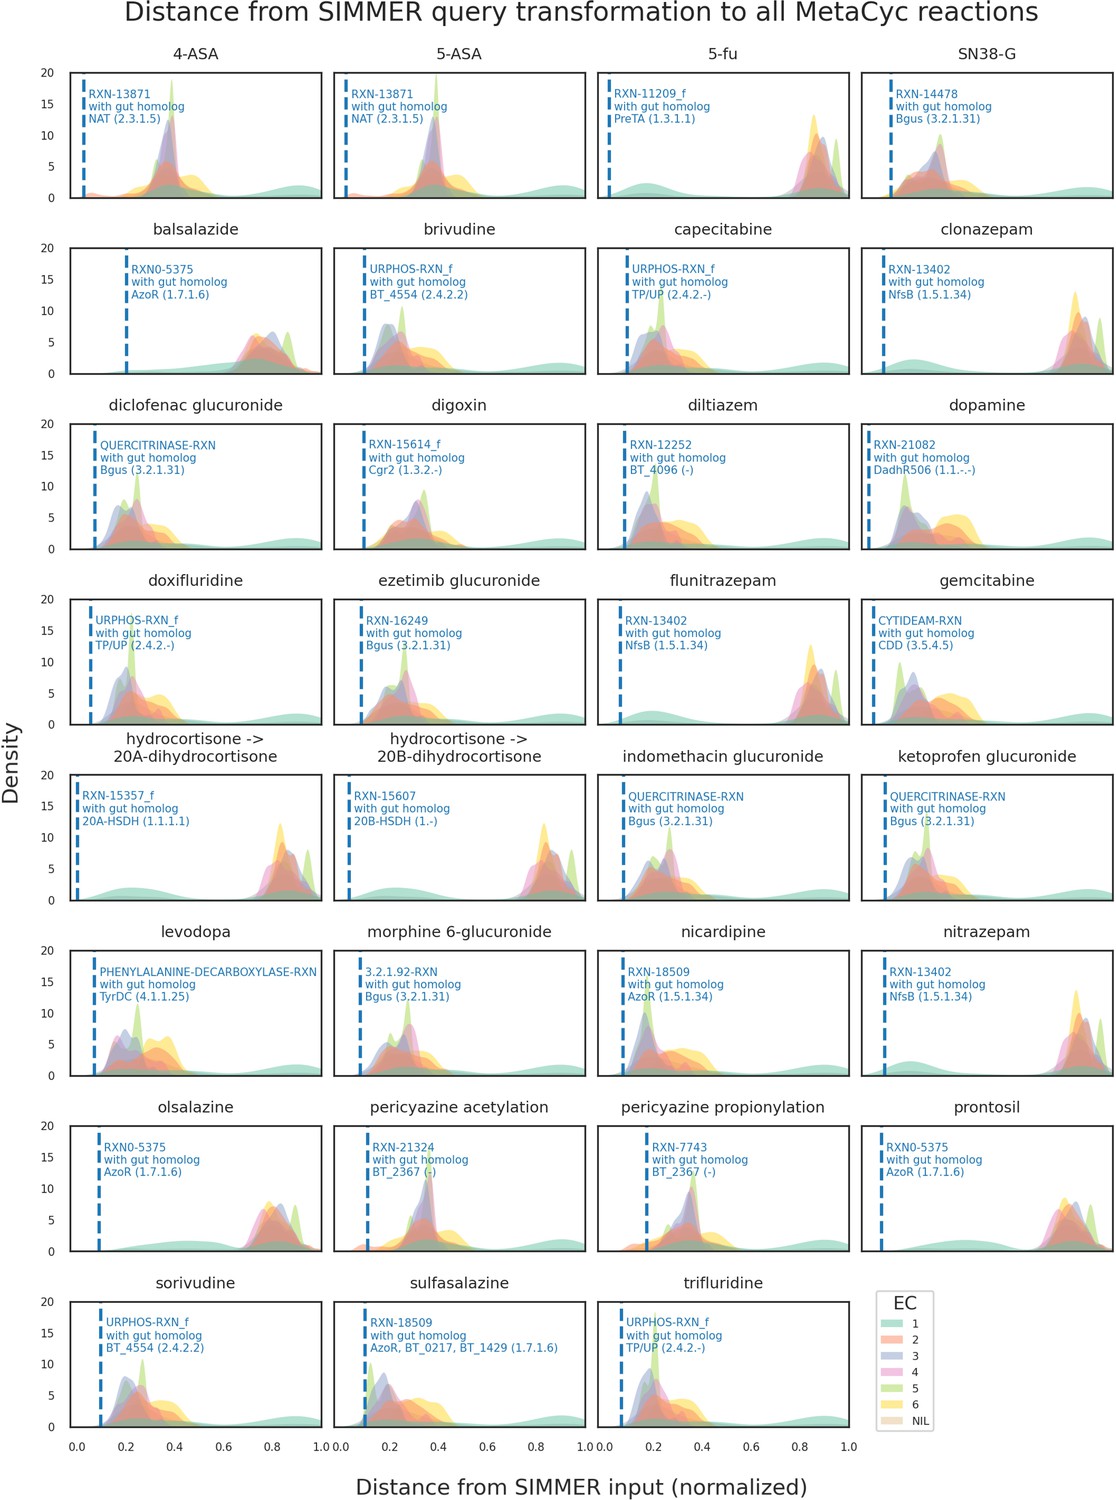
Distributions of all MetaCyc reactions’ euclidean distances to the positive control list queries.
For this analysis, 31 of the positive control reactions was queried to SIMMER. Distributions were created based on all (N = 8914) MetaCyc reactions’ distance to a given input metabolism event, and colored by their Enzyme Commission (EC) class annotation in MetaCyc (oxidoreductases, transferases, etc.). The dashed blue line depicts the MetaCyc reaction that yielded a gut microbiome homolog matching the known positive control sequence. For example, when queried with 5-ASA acetylation, SIMMER outputs a most-similar MetaCyc reaction (RXN-13871) that SIMMER linked (via sequence similarity) to an N-acetyltransferase known from previous literature to drive 5-ASA metabolism in the human gut.
Figure 5—figure supplement 2
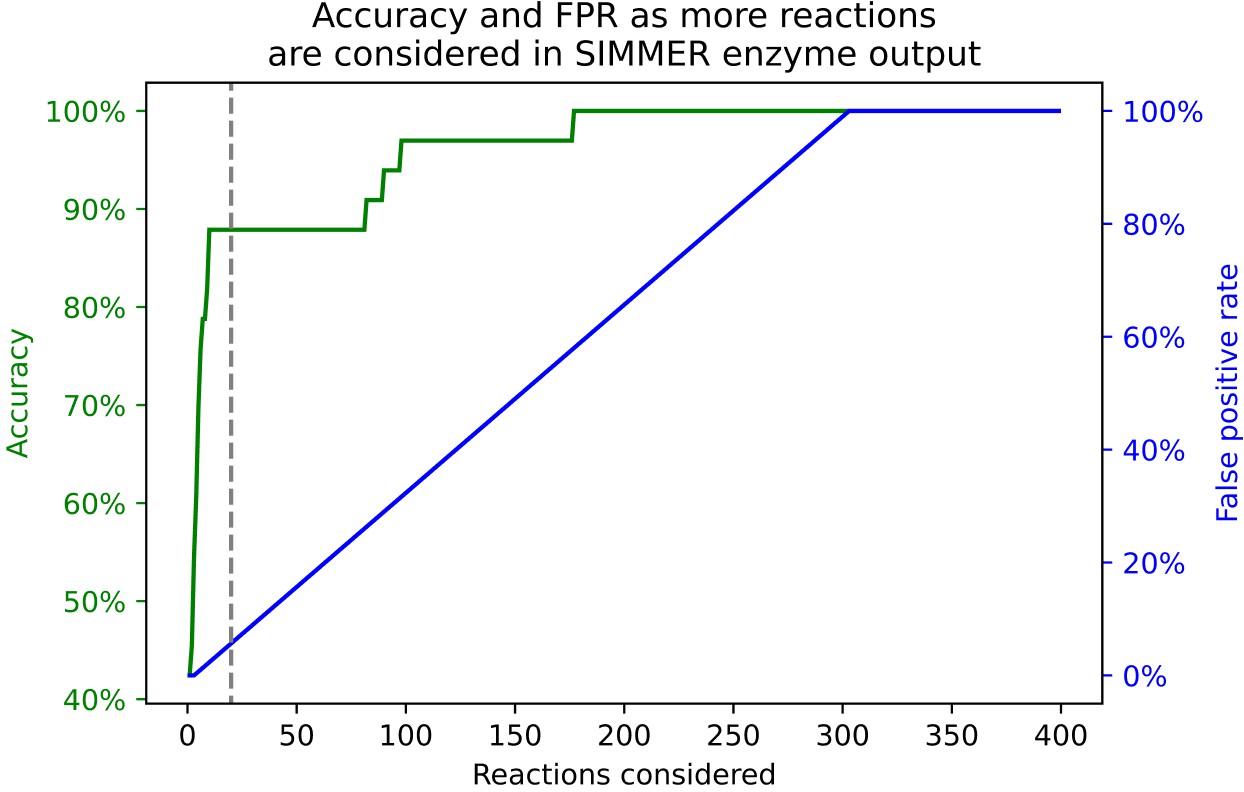
The relationship between accuracy and false positives as a user explores more reactions from SIMMER’s prediction output.
Accuracy is defined as whether or not the enzymes responsible for 33 positive control reactions are found in SIMMER’s sequence results for the closest N MetaCyc reactions. The dashed gray line represents our cutoff (N = 20 reactions) chosen for the accuracy measures in Figure 5 and Table 1. We defined the false positive rate as all output reactions preceding that which yields the positive control enzyme sequence within a given reaction number cutoff.
Figure 6
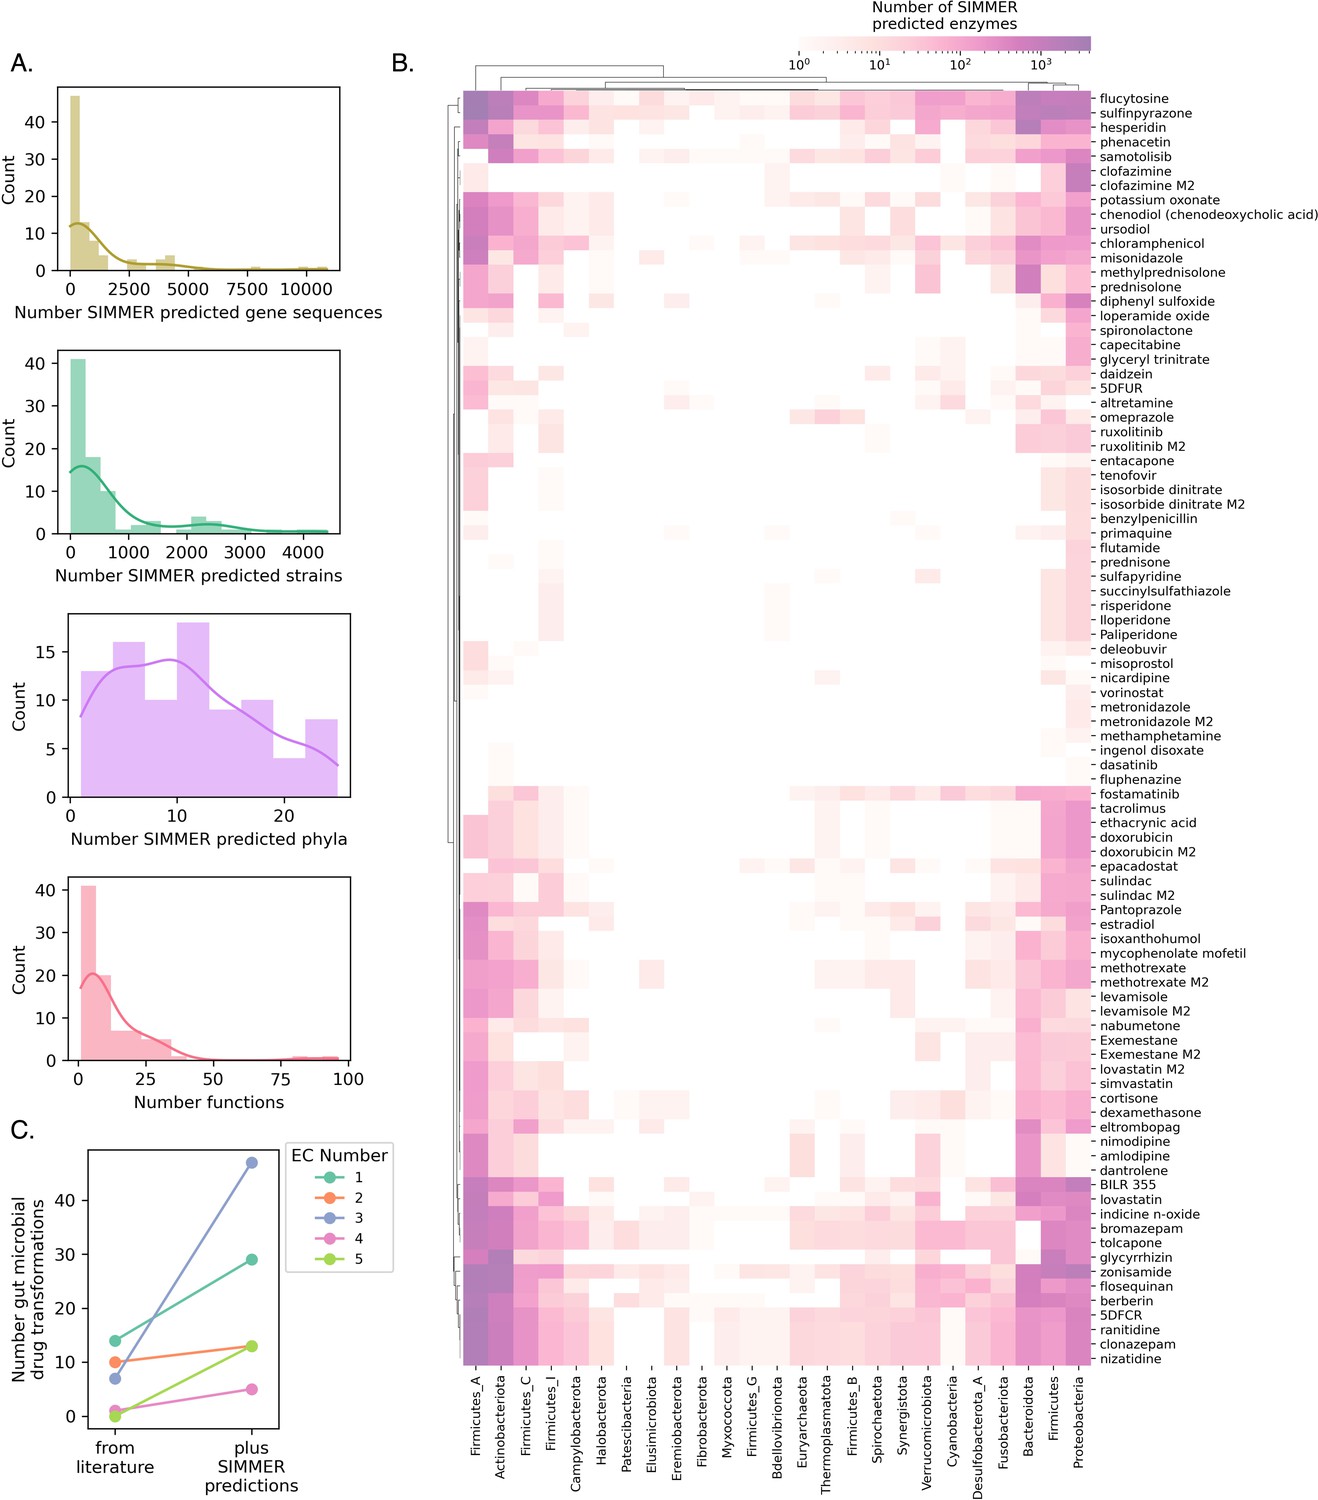
SIMMER predicts novel drug metabolizing enzymes.
(A) Distributions depict the unique number of genes, strains, and phyla predicted to be responsible for 88 reported drug transformation reactions, as well as predicted gene functions. (B) A heatmap illustrating, for a given phylum, the number of unique drug-metabolizing enzymes predicted to conduct 88 different drug metabolism events. (C) Enzyme Commission Class representation for bacterial transformations of therapeutics before and after the employment of SIMMER. Our predictions greatly expand the number of characterized reduction (EC1), hydrolysis (EC2), and isomerization (EC5) events and modestly increase the number of transferase (EC2) and lyase (EC4) events.
-
Figure 6—source data 1
SIMMER's enzyme predictions (with phyogenetic annotations) and EC predictions for 88 previously uncharacterized reactions.
- https://cdn.elifesciences.org/articles/82401/elife-82401-fig6-data1-v3.xlsx
Figure 7
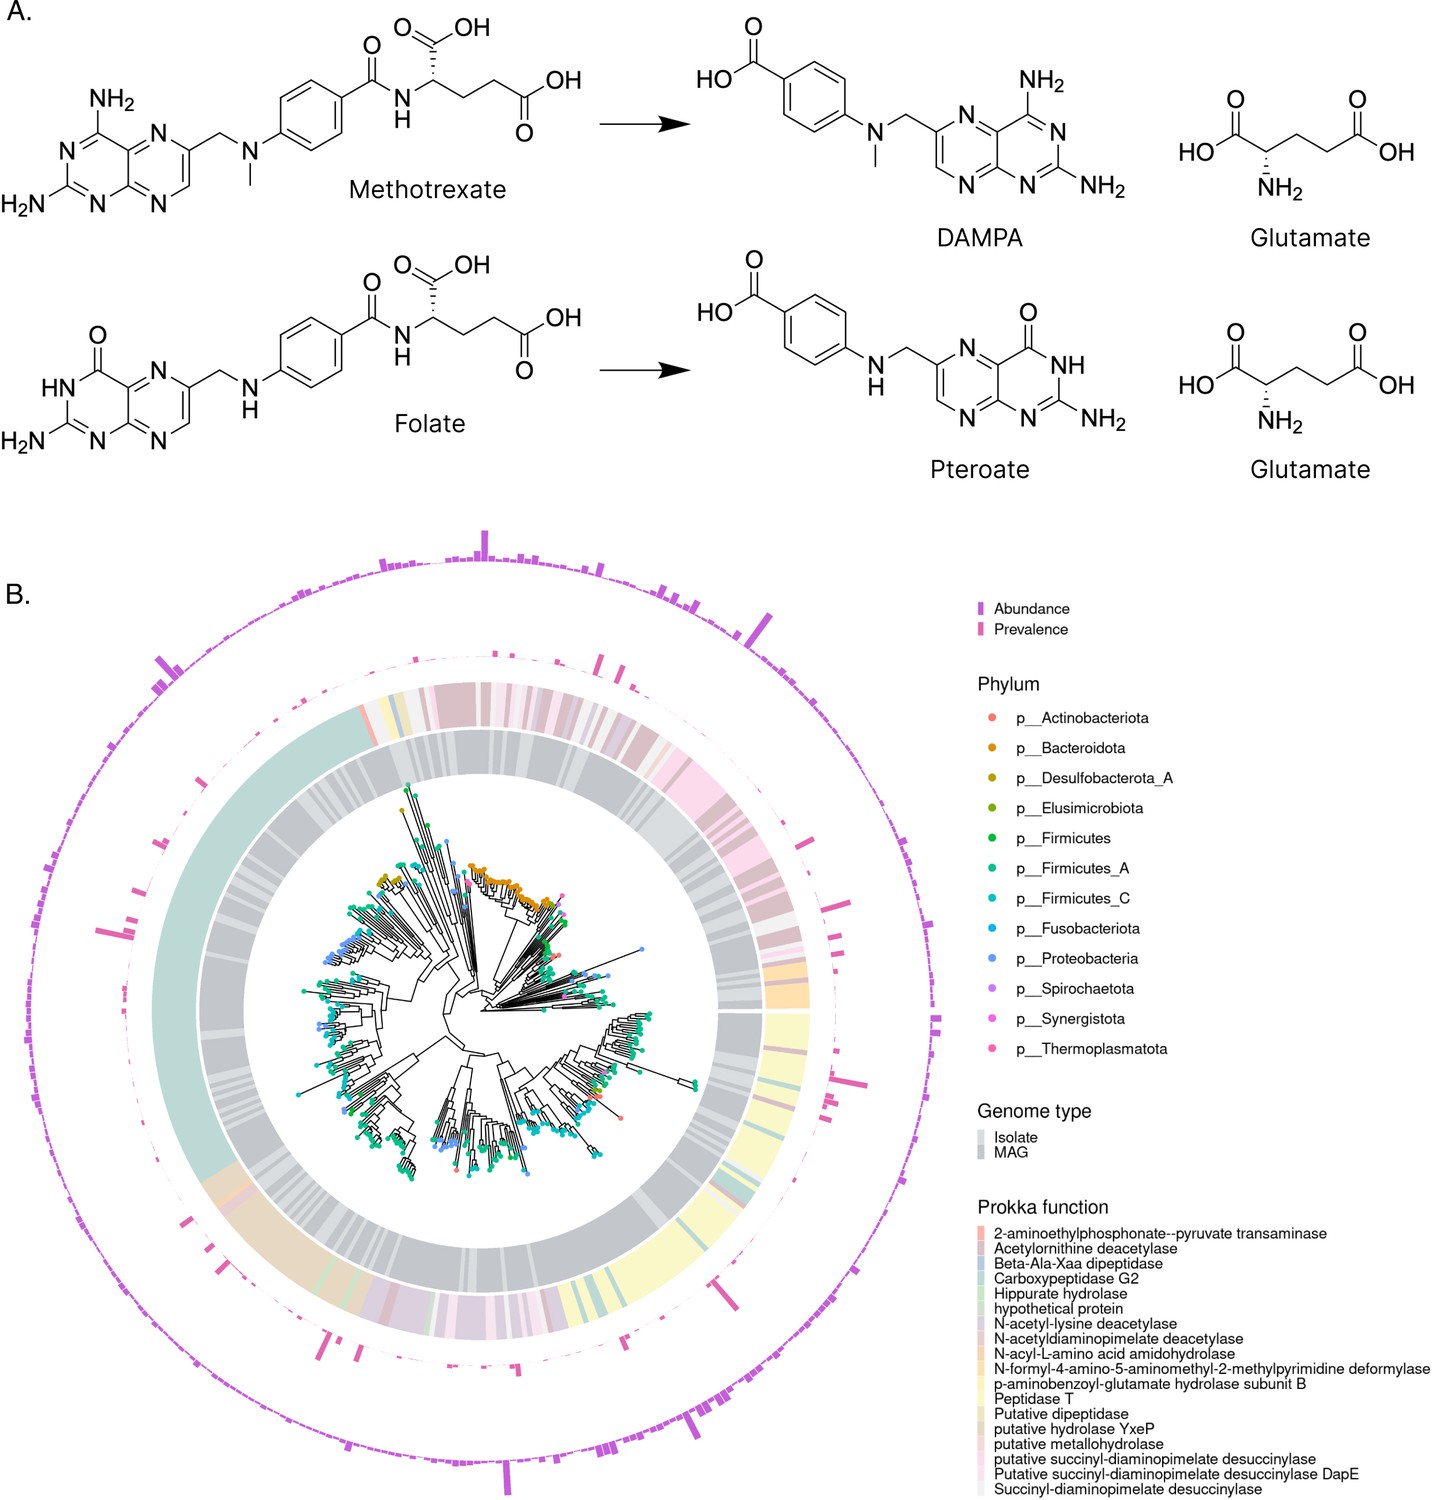
SIMMER predicts methotrexate (MTX) metabolizing enzymes similar to known environmental MTX metabolizers.
(A) When queried with MTX hydrolysis to 2,4-diamino-N10-methylpteroic acid (DAMPA) and glutamate, SIMMER found that folate hydrolysis was the most chemically similar MetaCyc reaction. (B) SIMMER predicted 2286 unique bacterial sequences putatively capable of MTX hydrolysis to DAMPA and glutamate. There was great variability in the prevalence and abundance of these sequences in healthy human metagenomic data. Among the strains with predictions, Firmicutes were most common. The most frequent Prokka annotation was Carboxypeptidase G2.
-
Figure 7—source data 1
SIMMER's enzyme prediction output table for MTX hydrolysis to DAMPA and glutamate: 2,286 bacterial sequences and their UHGG database identifiers, taxonomy, predicted function, and prevalence and abundance in healthy humans.
- https://cdn.elifesciences.org/articles/82401/elife-82401-fig7-data1-v3.xlsx
Figure 8 with 2 supplements
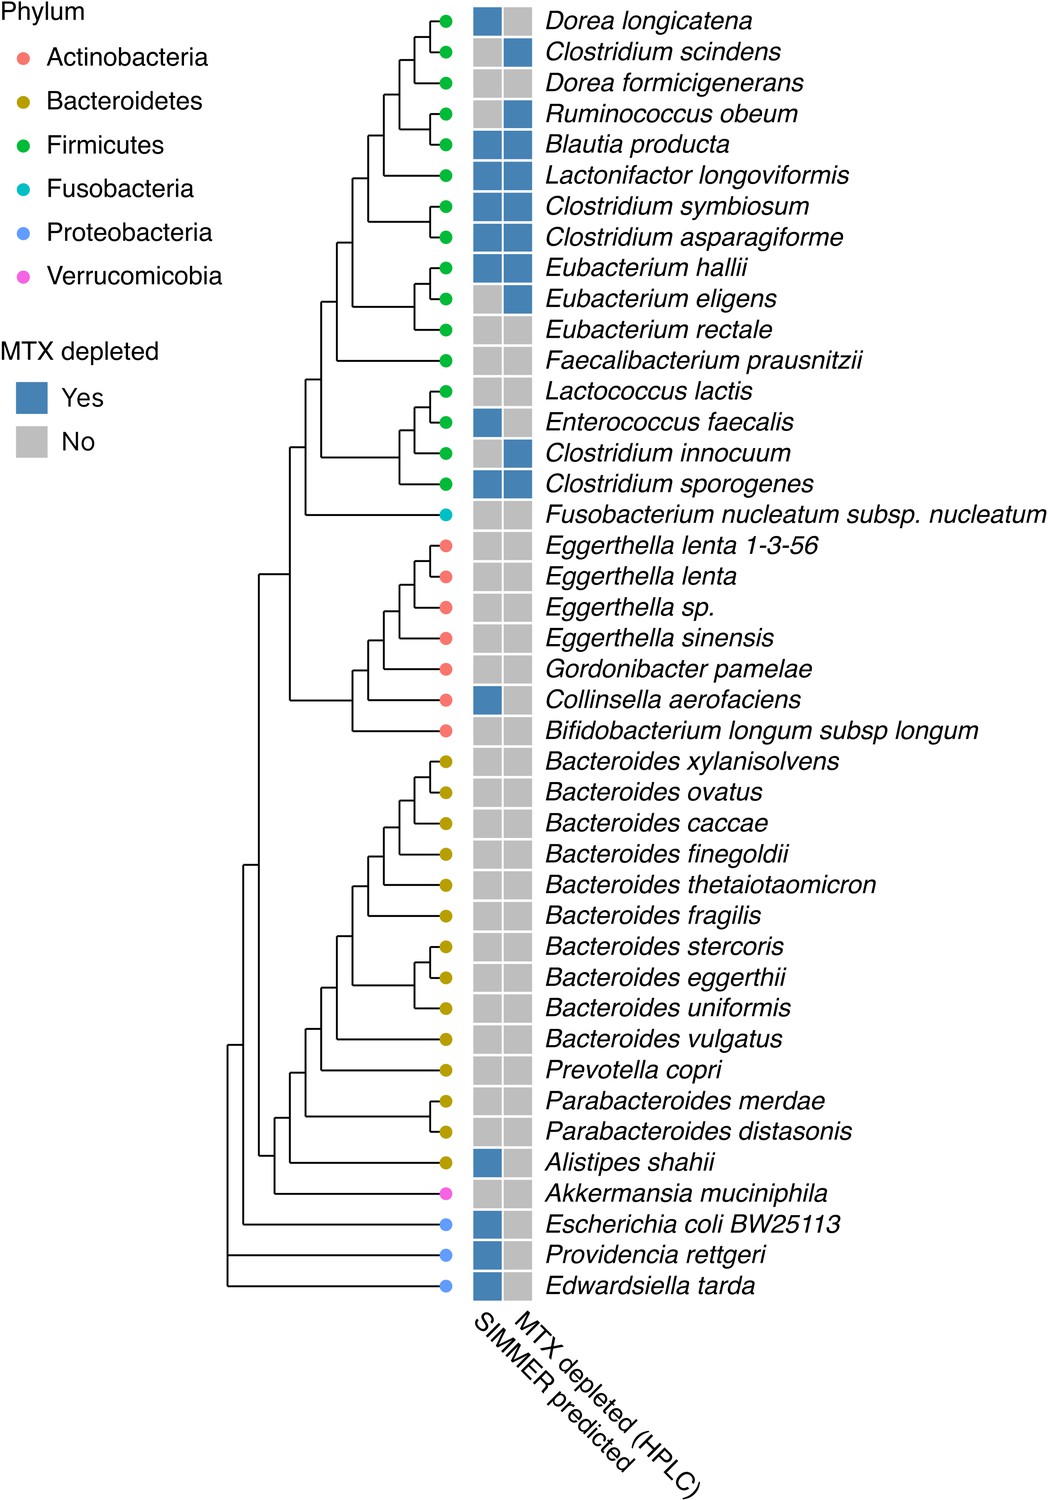
SIMMER accurately predicted bacterial strains capable of methotrexate (MTX) depletion.
A diverse panel of 42 isolates was incubated with MTX, and depletion (yes/no) measured via HPLC (50% decrease relative to sterile controls). SIMMER predicted (yes/no) that 13 of the 42 isolates were capable of MTX metabolism, and HPLC experiments showed that 10 isolates depleted MTX (SIMMER prediction p-value = 0.046, Fisher’s exact test). The maximum likelihood phylogenetic tree (PhyML) was created using 16S rRNA gene sequences from the 42 organisms’ closest representatives in the Greengenes database.
-
Figure 8—source data 1
Identifiers and assembly file names for 42 isolates incubated with MTX, and example HPLC traces from two MTX depleting strains.
- https://cdn.elifesciences.org/articles/82401/elife-82401-fig8-data1-v3.xlsx
Figure 8—figure supplement 1
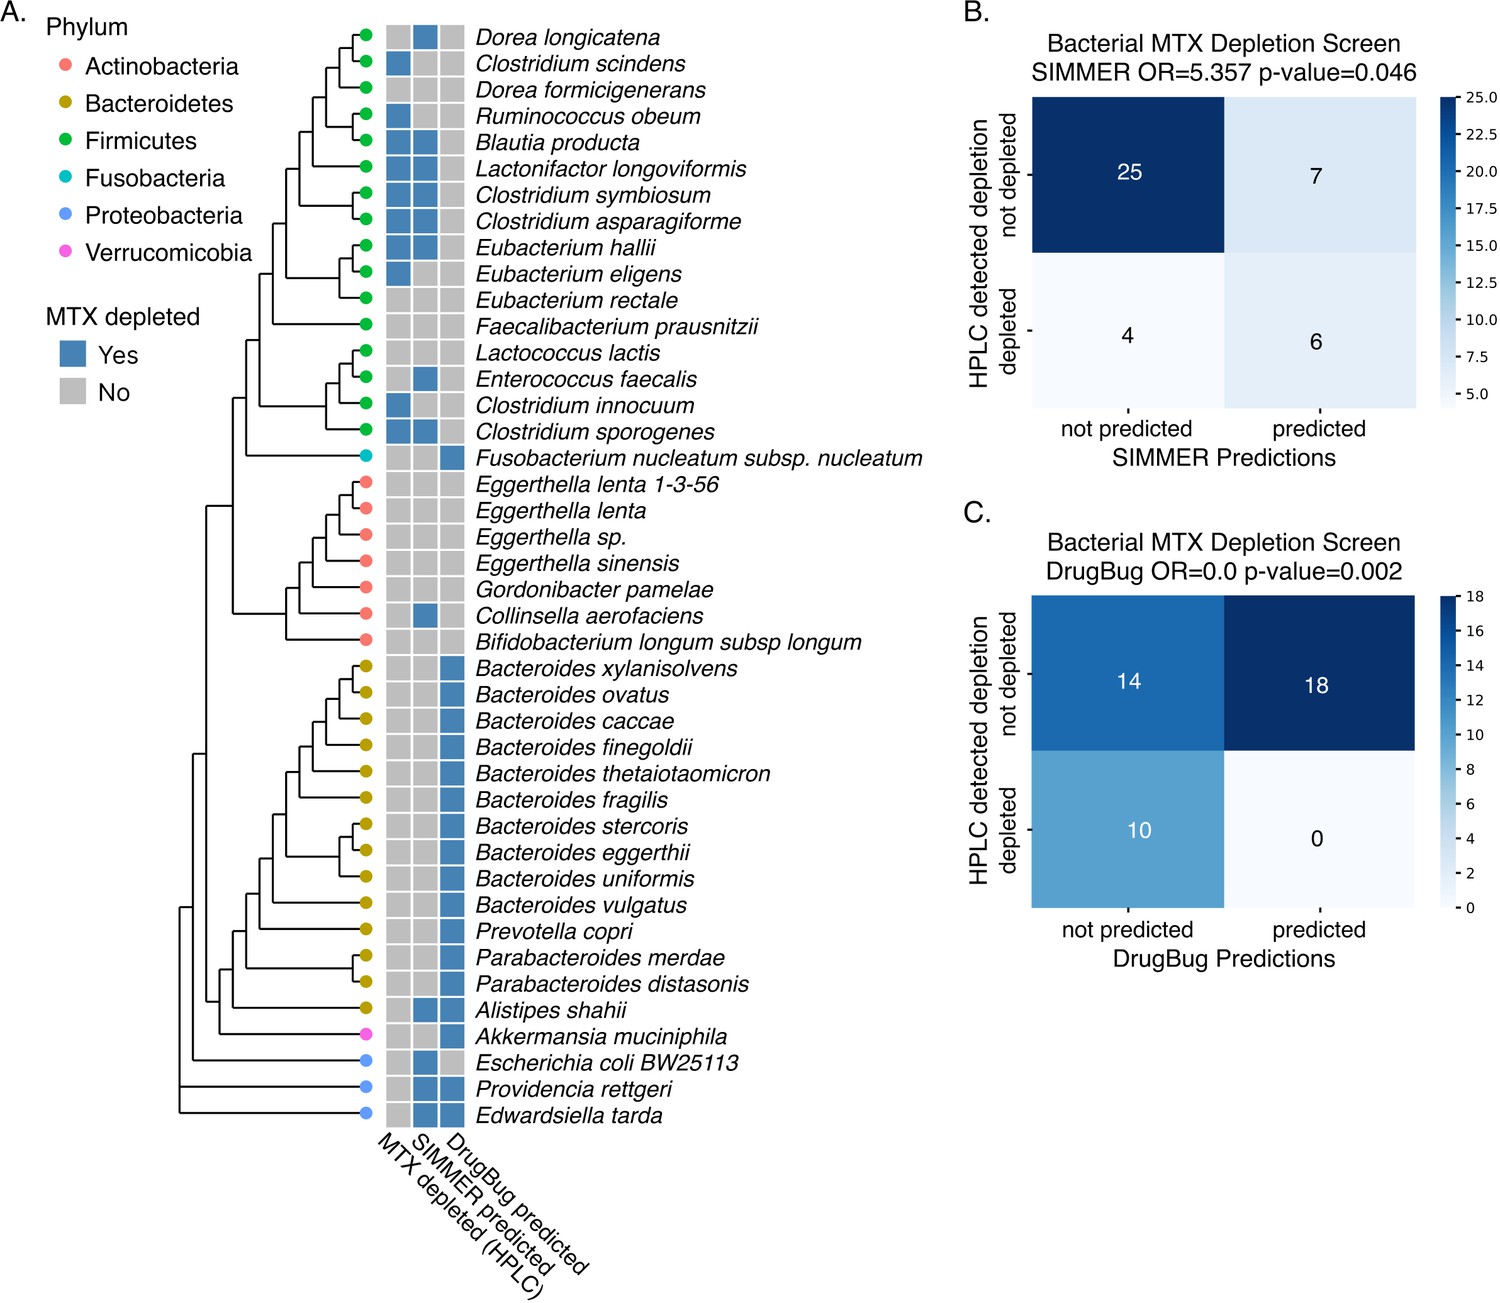
DrugBug methotrexate (MTX) metabolism predictions.
(A) In tandem with SIMMER predictions, we evaluated DrugBug species predictions for MTX metabolism in our in vitro assay. Unlike SIMMER, DrugBug predictions did not predict a single species capable of depleting MTX in the high-performance liquid chromatography (HPLC) assay. Additionally, by this HPLC assay, we were not able to validate any of DrugBug’s predicted MTX-metabolizing strains. MicrobeFDT could not be evaluated in our in vitro assay because it does not make species or enzyme predictions. (B) Confusion matrix for SIMMER predictions. Significance was determined with a Fisher’s exact test. (C) Confusion matrix for DrugBug predictions. Significance was determined with a Fisher’s exact test.
Figure 8—figure supplement 2
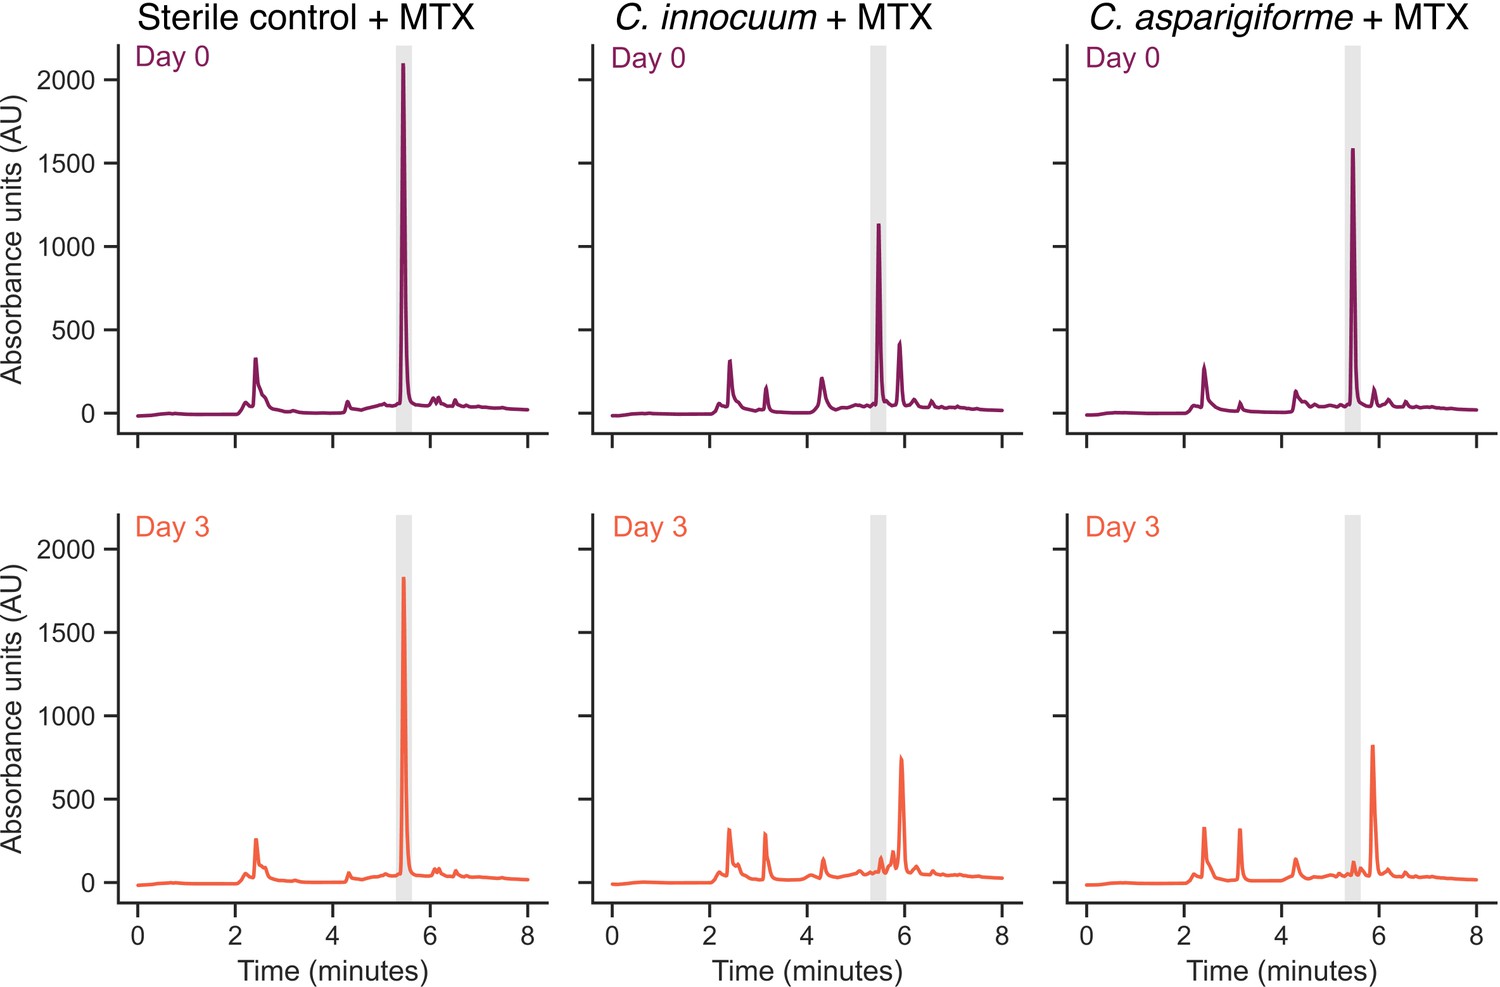
Representative methotrexate (MTX) depletion high-performance liquid chromatography (HPLC) traces.
Representative HPLC traces of bacteria that exhibited MTX depletion. The top row represents bacteria (or sterile control) after incubation with MTX for 15 hr, and the second row represents bacteria (or sterile control) after incubation with MTX for 72 hr. The gray shaded area represents the retention time of MTX (5.5 min).
Figure 9
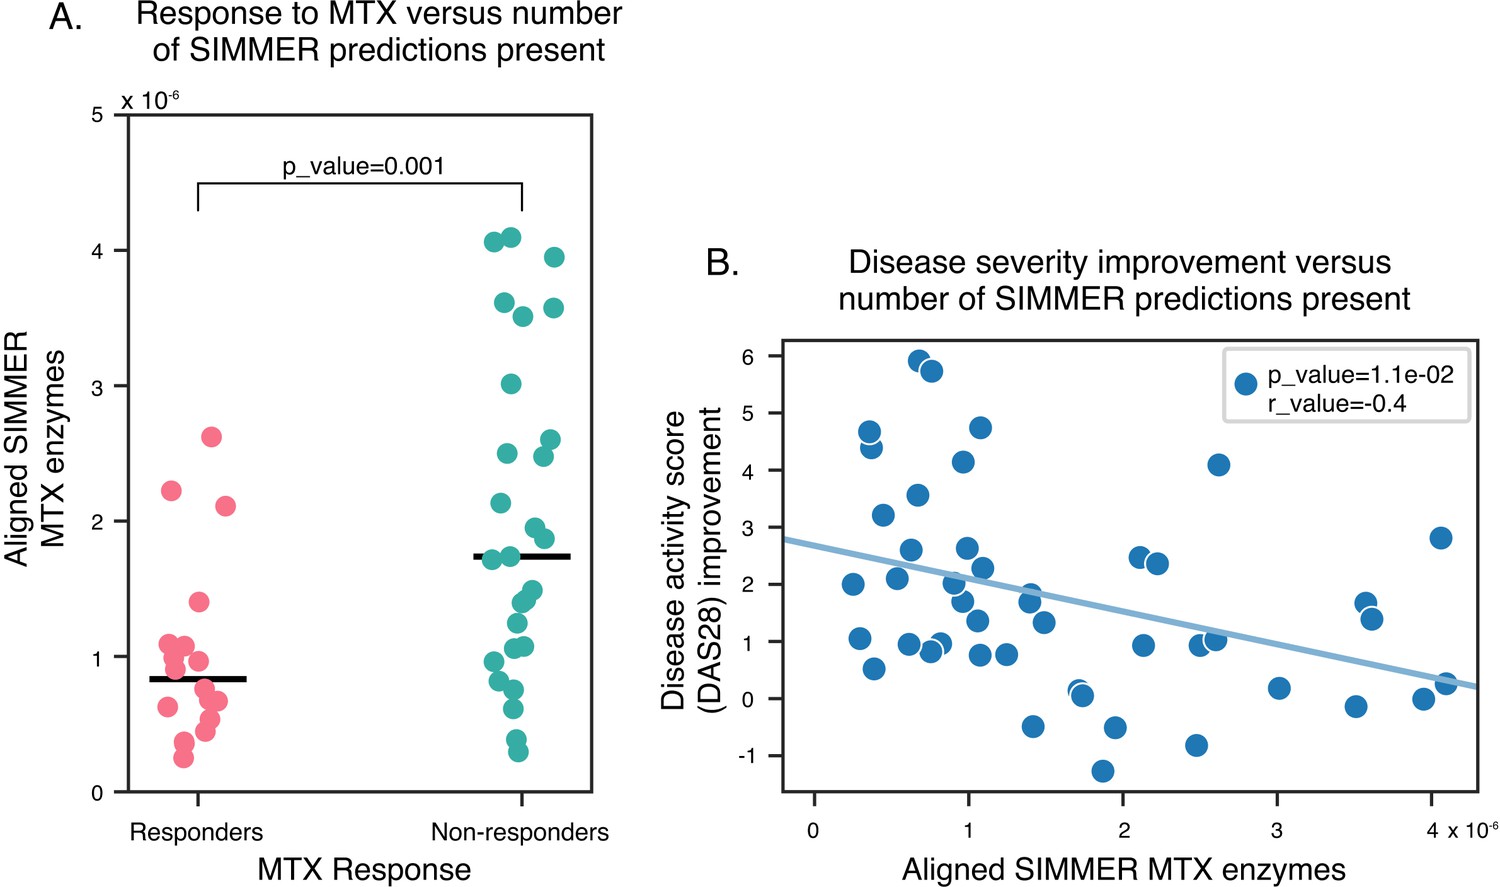
SIMMER enzyme predictions are enriched in methotrexate (MTX) non-responders.
N = 368 of SIMMER predicted sequences for MTX hydrolysis were found in new-onset RA patients with variable MTX response. (A) SIMMER enzyme predictions (normalized by read depth) were enriched in MTX non-responders (Generalized Linear Model (GLM) Poisson, p-value = 0.001), and (B) a significant negative association between disease severity improvement and number of SIMMER enzyme predictions (normalized by read depth) was observed (Pearson correlation = −0.4, Student’s t-test p-value = 0.01).
-
Figure 9—source data 1
Disease activity (DAS28) scores, MTX response status, and number of SIMMER predicted enzymes for RA patients.
- https://cdn.elifesciences.org/articles/82401/elife-82401-fig9-data1-v3.xlsx
Figure 10 with 1 supplement

SIMMER predicted enzymes explain inter-individual variations in drug metabolism.
(A) Donors (N = 20) from the Javdan et al. 16S rRNA gene sequencing study (Javdan et al., 2020) possessed an enrichment of genomes harboring SIMMER enzyme predictions when metabolism of a given drug was observed. Violin plot curves were made using a seaborn package that performs a kernel density estimation of the underlying datapoint distribution. Chemical transformations were drawn using ChemDraw software. Single asterisks denote p-values ≤0.05, and double asterisks denote p-values ≤0.01 (t-test). (B) There was a significant correlation between a human stool sample’s ability to consume dexamethasone (consumption slope, a.u.), to produce 17-oxodexamethasone (production slope, a.u.), and the number of aligned SIMMER predicted sequences for side-chain cleavage of dexamethasone. Patient (N = 28) conversion slopes and metagenomics data were accessed from the original study (Zimmermann et al., 2019b). Chemical structures were drawn using ChemDraw software.
-
Figure 10—source data 1
SIMMER predictions for previously published drug metabolism studies.
- https://cdn.elifesciences.org/articles/82401/elife-82401-fig10-data1-v3.xlsx
Figure 10—figure supplement 1
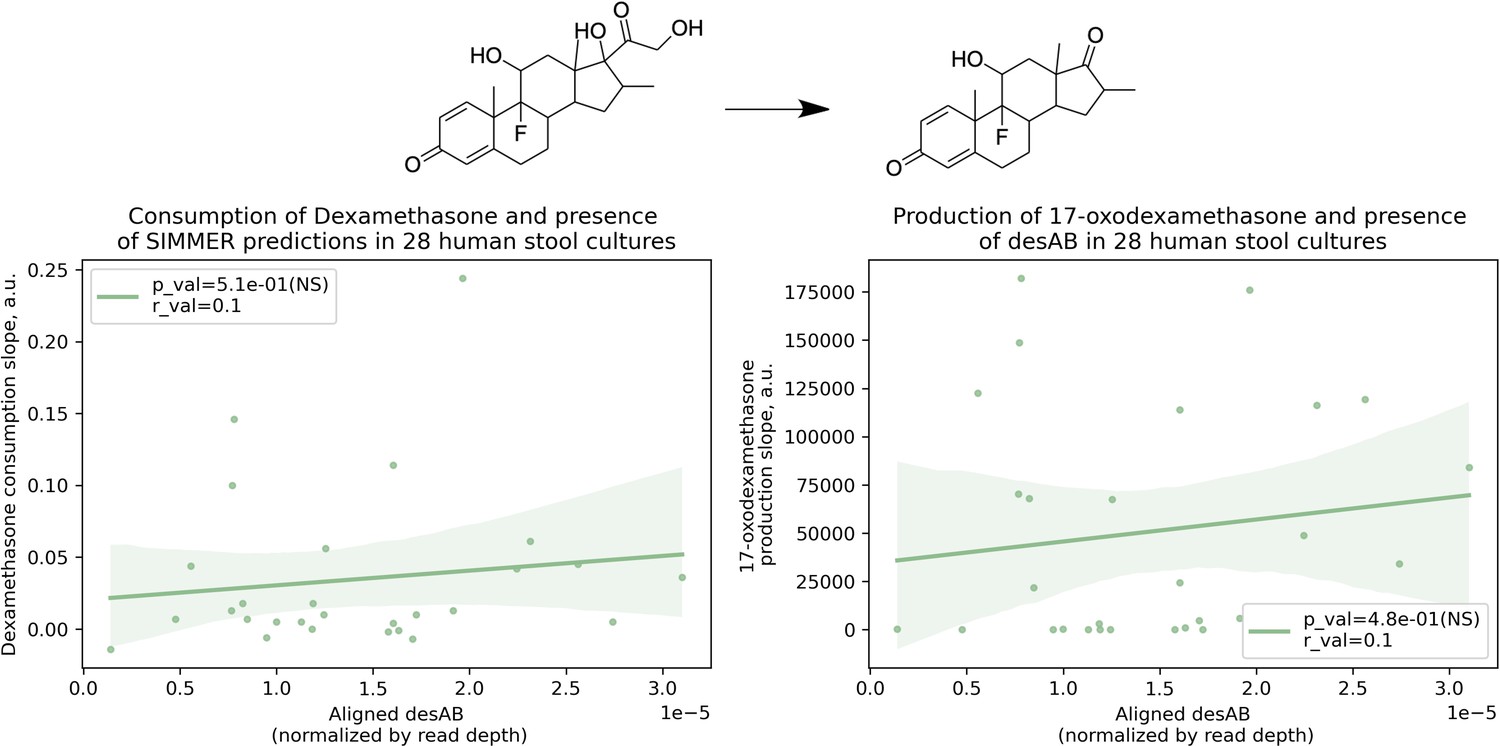
Dexamethasone metabolism is not significantly correlated with presence of desAB.
There was not a significant correlation between a human stool sample’s ability to consume dexamethasone (consumption slope, a.u.) or to produce 17-oxodexamethasone (production slope, a.u.), and the number of aligned desAB sequences. Patient (N = 28) conversion slopes and metagenomics data were accessed from the original study (Zimmermann et al., 2019b). This adds confidence to the finding described in Figure 7B, as it means SIMMER enzyme predictions were not correlated with dexamethasone metabolism due to co-occurrence in C. scindens with a gene previously reported to underlie bacterial side-chain cleavage of steroids (Ly et al., 2020).
Figure 11
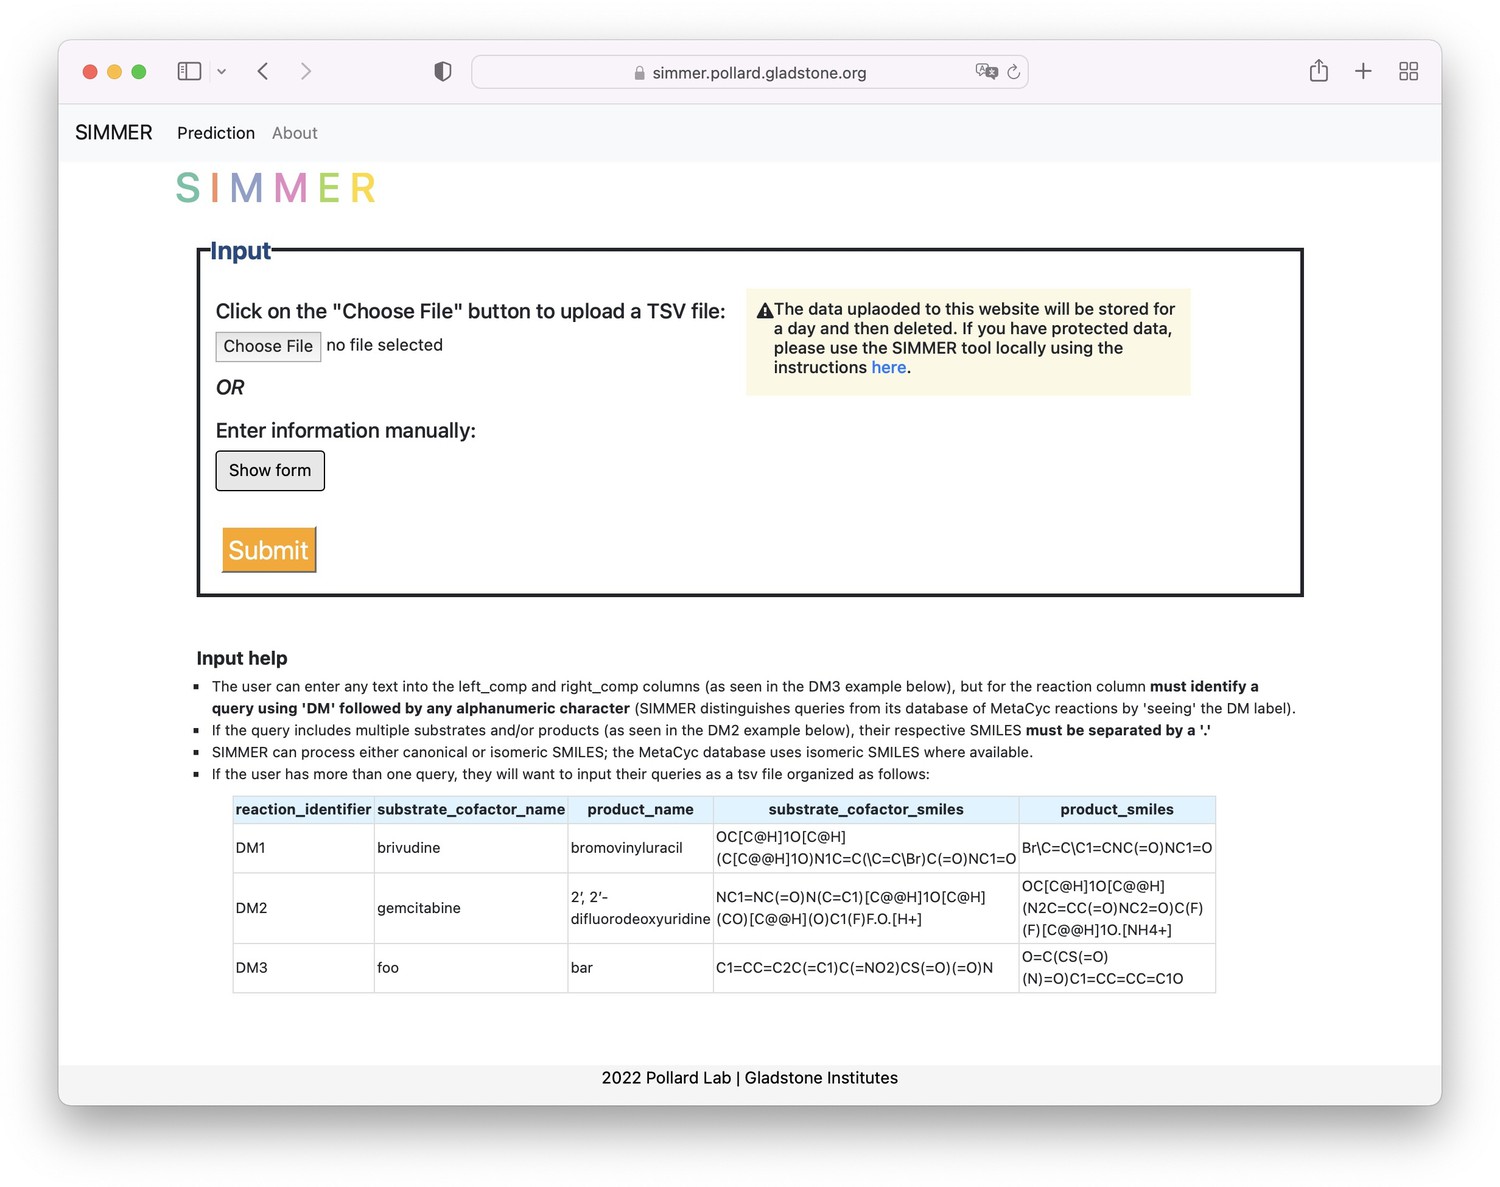
SIMMER web tool.
The landing page for the SIMMER website (https://simmer.pollard.gladstone.org/) allows the user to upload a TSV file of queries or add a single query manually to run SIMMER on. It is recommended to use the command-line tool (https://github.com/aebustion/SIMMER; Bustion, 2023) for more than 10 input queries.
Author response image 1
Tables
Table 1
Comparison to existing methods.
| DrugBug (Sharma et al., 2017) | MicrobeFDT (Guthrie et al., 2019) | SIMMER | ||
|---|---|---|---|---|
| Underlying databases | Number of chemicals | 2324 compounds | 10,822 compounds | 8914 reactions (12,439 unique compounds) |
| Number of bacterial genomes | 491 (custom database) | 3008 (IMG) | 286,997 (UHGG) | |
| Input types | Accepts novel SMILES | ✓ | ||
| User options for different chemical fingerprints | ✓ | ✓ | ||
| Output types | Reaction similarity measure | ✓ | ||
| EC predictions | ✓ | ✓ | ✓ | |
| Enzyme and species predictions | ✓ | ✓ | ||
| Function predictions | ✓ | |||
| Prevalence/abundance | ✓ | ✓ | ||
| Network relationships | ✓ | |||
| Usability | Web server | ✓ | ✓ | |
| Command-line tool | ✓ | |||
| Docker container | ✓ | |||
| Accuracy | Prediction of previously characterized enzymes | 3% | NA | 88% |
| Prediction of previously characterized EC numbers | 37% | 29% | 93% |
-
Table 1—source data 1
All data relevant to the comparison of SIMMER, DrugBug, and MicrobeFDT methods.
- https://cdn.elifesciences.org/articles/82401/elife-82401-table1-data1-v3.xlsx
Key resources table
| Reagent type (species) or resource | Designation | Source or reference | Identifiers | Additional information |
|---|---|---|---|---|
| Chemical compound, drug | Methotrexate | Sigma-Aldrich | M9929-100MG | |
| Strain, strain background (Bacteroides thetaiotaomicron) | Bacteroides thetaiotaomicron | DSM 2079 | ||
| Strain, strain background (Clostridium asparagiforme) | Clostridium asparagiforme | DSM 15981 | ||
| Strain, strain background (Clostridium sporogenes) | Clostridium sporogenes | ATCC 15579 | ||
| Strain, strain background (Clostridium symbiosum) | Clostridium symbiosum | DSM 934 | ||
| Strain, strain background (Akkermansia muciniphila) | Akkermansia muciniphila | DSM 22959 | ||
| Strain, strain background (Alistipes shahii) | Alistipes shahii | DSM 19121 | ||
| Strain, strain background (Bacteroides caccae) | Bacteroides caccae | DSM 19024 | ||
| Strain, strain background (Bacteroides eggerthii) | Bacteroides eggerthii | DSM 20697 | ||
| Strain, strain background (Bacteroides finegoldii) | Bacteroides finegoldii | DSM 17565 | ||
| Strain, strain background (Bacteroides fragilis) | Bacteroides fragilis | DSM 2151 | ||
| Strain, strain background (Bacteroides ovatus) | Bacteroides ovatus | DSM 1896 | ||
| Strain, strain background (Bacteroides stercoris) | Bacteroides stercoris | DSM 19555 | ||
| Strain, strain background (Bacteroides uniformis) | Bacteroides uniformis | DSM 6597 | ||
| Strain, strain background (Bacteroides vulgatus) | Bacteroides vulgatus | DSM 1447 | ||
| Strain, strain background (Bacteroides xylanisolvens) | Bacteroides xylanisolvens | DSM 18836 | ||
| Strain, strain background (Bifidobacterium longum) | Bifidobacterium longum subsp longum | DSM 20219 | ||
| Strain, strain background (Blautia producta) | Blautia producta | DSM 3507 | ||
| Strain, strain background (Clostridium innocuum) | Clostridium innocuum | DSM 1286 | ||
| Strain, strain background (Clostridium scindens) | Clostridium scindens | DSM 5676 | ||
| Strain, strain background (Collinsella aerofaciens) | Collinsella aerofaciens | DSM 3979 | ||
| Strain, strain background (Dorea formicigenerans) | Dorea formicigenerans | DSM 3992 | ||
| Strain, strain background (Dorea longicatena) | Dorea longicatena | DSM 13814 | ||
| Strain, strain background (Edwardsiella tarda) | Edwardsiella tarda | ATCC 23685 | ||
| Strain, strain background (Eggerthella lenta) | Eggerthella lenta 1-3-56 | DSM 110906 | ||
| Strain, strain background (Eggerthella lenta) | Eggerthella lenta | DSM 2243 | ||
| Strain, strain background (Eggerthella sinensis) | Eggerthella sinensis | DSM 16107 | ||
| Strain, strain background (Eggerthella sp.) | Eggerthella sp. | DSM 11767 | ||
| Strain, strain background (Enterococcus faecalis) | Enterococcus faecalis | DSM 2570 | ||
| Strain, strain background (Escherichia coli) | Escherichia coli BW25113 | DSM 27469 | ||
| Strain, strain background (Eubacterium eligens) | Eubacterium eligens | DSM 3376 | ||
| Strain, strain background (Eubacterium hallii) | Eubacterium hallii | DSM 3353 | ||
| Strain, strain background (Eubacterium rectale) | Eubacterium rectale | DSM 17629 | ||
| Strain, strain background (Faecalibacterium prausnitzii) | Faecalibacterium prausnitzii | DSM 17677 | ||
| Strain, strain background (Fusobacterium nucleatum) | Fusobacterium nucleatum subsp. nucleatum | DSM 15643 | ||
| Strain, strain background (Gordonibacter pamelae) | Gordonibacter pamelae | DSM 110924 | ||
| Strain, strain background (Lactococcus lactis) | Lactococcus lactis | DSM 20481 | ||
| Strain, strain background (Lactonifactor longoviformis) | Lactonifactor longoviformis | DSM 17459 | ||
| Strain, strain background (Parabacteroides distasonis) | Parabacteroides distasonis | DSM 20701 | ||
| Strain, strain background (Parabacteroides merdae) | Parabacteroides merdae | DSM 19495 | ||
| Strain, strain background (Prevotella copri) | Prevotella copri | DSM 18205 | ||
| Strain, strain background (Providencia rettgeri) | Providencia rettgeri | DSM 4542 | ||
| Strain, strain background (Ruminococcus obeum) | Ruminococcus obeum | DSM 25238 |
Additional files
-
Supplementary file 1
Literature curated list of drug metabolism events in the human gut microbiome.
- https://cdn.elifesciences.org/articles/82401/elife-82401-supp1-v3.xlsx
-
Supplementary file 2
SMILES used as SIMMER input.
- https://cdn.elifesciences.org/articles/82401/elife-82401-supp2-v3.xlsx
-
MDAR checklist
- https://cdn.elifesciences.org/articles/82401/elife-82401-mdarchecklist1-v3.pdf
Download links
A two-part list of links to download the article, or parts of the article, in various formats.
Downloads (link to download the article as PDF)
Open citations (links to open the citations from this article in various online reference manager services)
Cite this article (links to download the citations from this article in formats compatible with various reference manager tools)
SIMMER employs similarity algorithms to accurately identify human gut microbiome species and enzymes capable of known chemical transformations
eLife 12:e82401.
https://doi.org/10.7554/eLife.82401


