Creating an atlas of the bone microenvironment during oral inflammatory-related bone disease using single-cell profiling
- State Key Laboratory of Oral Diseases, National Clinical Research Center for Oral Diseases, Department of Cariology and Endodontics, West China Hospital of Stomatology, Sichuan University, China
- State Key Laboratory of Oral Diseases, National Clinical Research Center for Oral Diseases, Department of Orthognathic and TMJ Surgery, West China Hospital of Stomatology, Sichuan University, China
- Hospital of Stomatology, Guanghua School of Stomatology, Sun Yat-Sen University, Guangdong Provincial Key Laboratory of Stomatology, China
- Maine Medical Center Research Institute, United States
- State Key Laboratory of Oral Diseases, National Clinical Research Center for Oral Diseases, Department of Oral Implantology, West China Hospital of Stomatology, Sichuan University, China
- State Key Laboratory of Oral Diseases, National Clinical Research Center for Oral Diseases, Department of Orthodontics, West China Hospital of Stomatology, Sichuan University, China
Figures
Figure 1 with 1 supplement
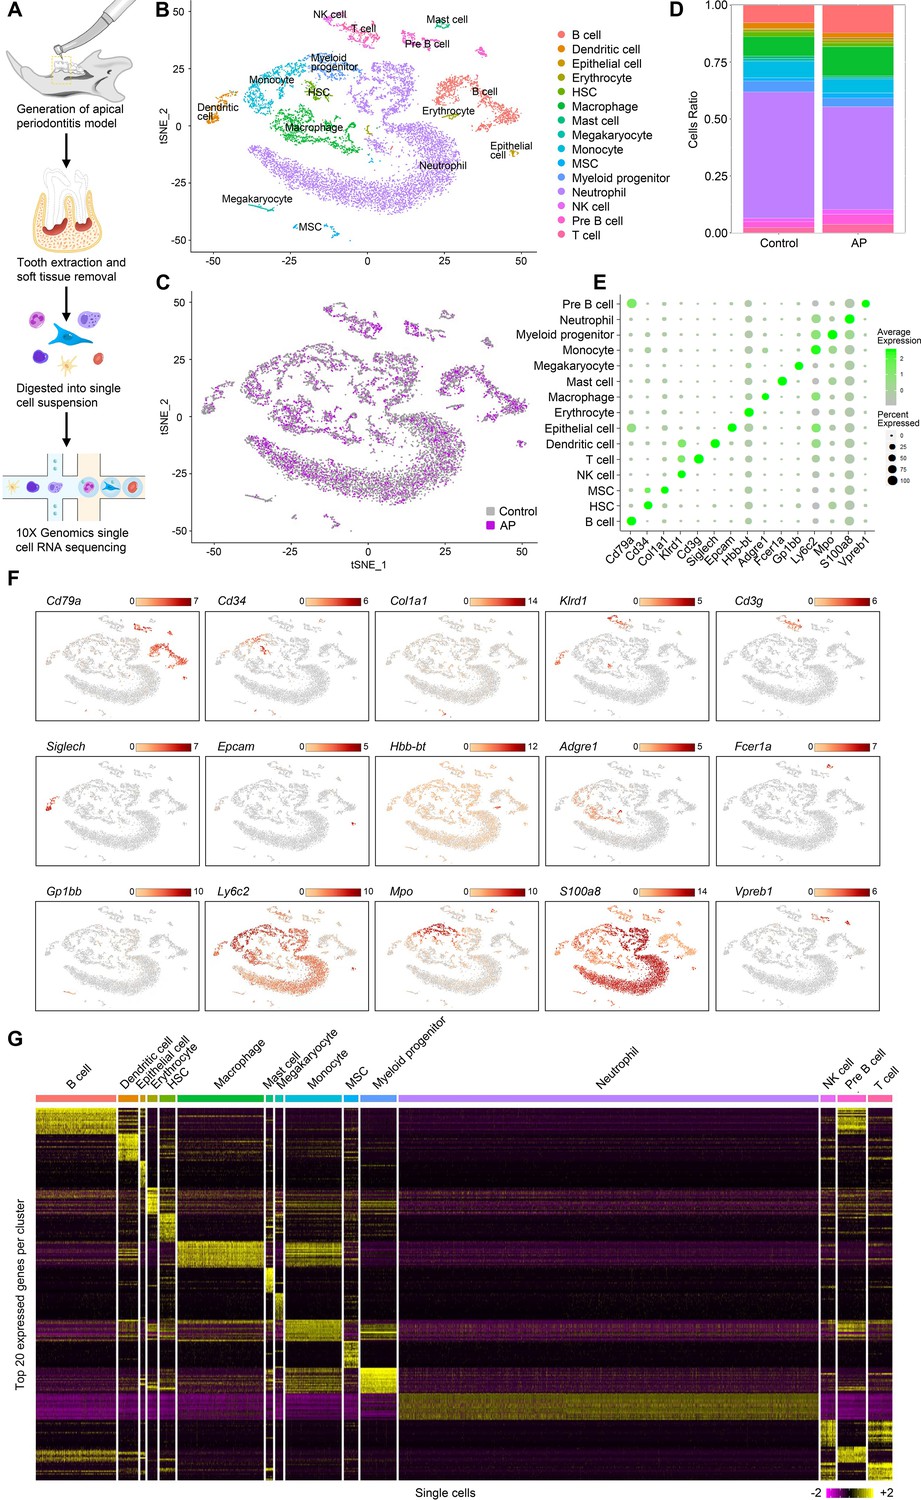
Identification of the single-cell atlas of alveolar bone using scRNA-sequencing (scRNA-seq) and unbiased clustering.
(A) Schematic diagram of the experimental design. (B–C) t-Stochastic neighbor embedding (t-SNE) representation of aligned gene expression data in single cells extracted from mandibles of control mice (n=8340) and apical periodontitis (AP) mice (n=6808) showing 15 distinct clusters and cellular origin. (D) Relative abundance of 15 cell populations composing alveolar bone under healthy and AP conditions. (E) Expression of gene markers in distinct cell types. (F) Gene expression patterns projected onto t-SNE plots of marker genes. Scale: log-transformed gene expression. (G) Heatmap showing the 20 most upregulated genes (ordered by decreasing Padj value) in each cluster defined in B. Scale: log2 fold change.
Figure 1—figure supplement 1

Quality control results of the sequencing data.
Figure 2
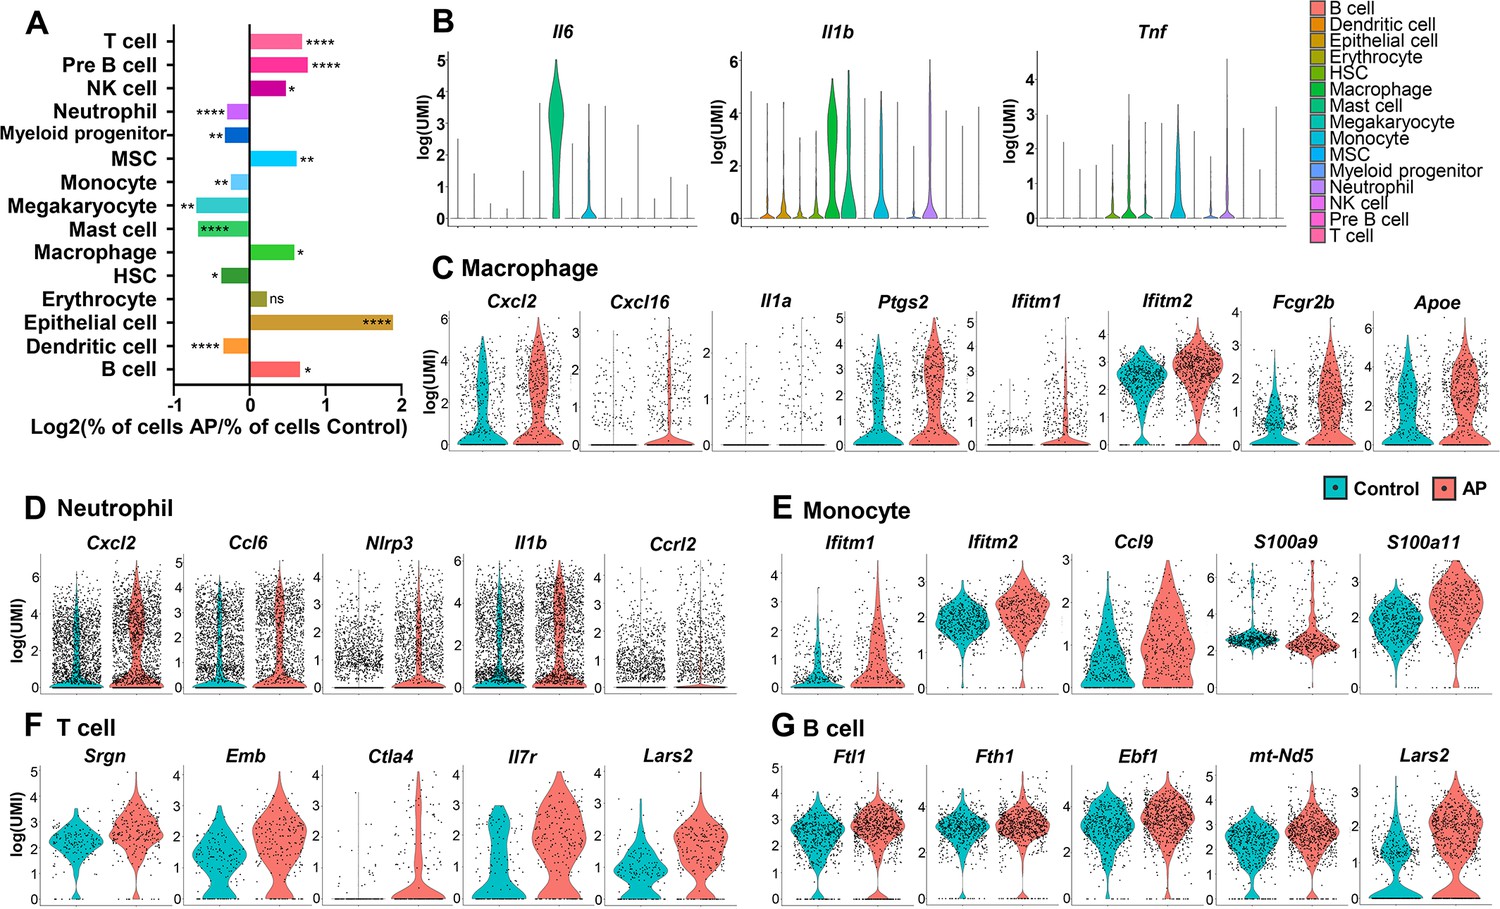
Changes in frequency and transcriptional expression pattern in each cell population from control and apical periodontitis (AP) groups.
(A) Bar plot of cells per cluster (AP versus control). Normalization to overall number of inputs per condition. Fisher’s exact test with Bonferroni correction was used. *p<0.05, **p<0.01, and ****p<0.0001. All data were exhibited as mean ± SEM. (B) Violin plots of cluster-specific expression of representative genes. (C–G) Violin plots showing genes that significantly changed in each cluster from control and AP.
Figure 3 with 1 supplement
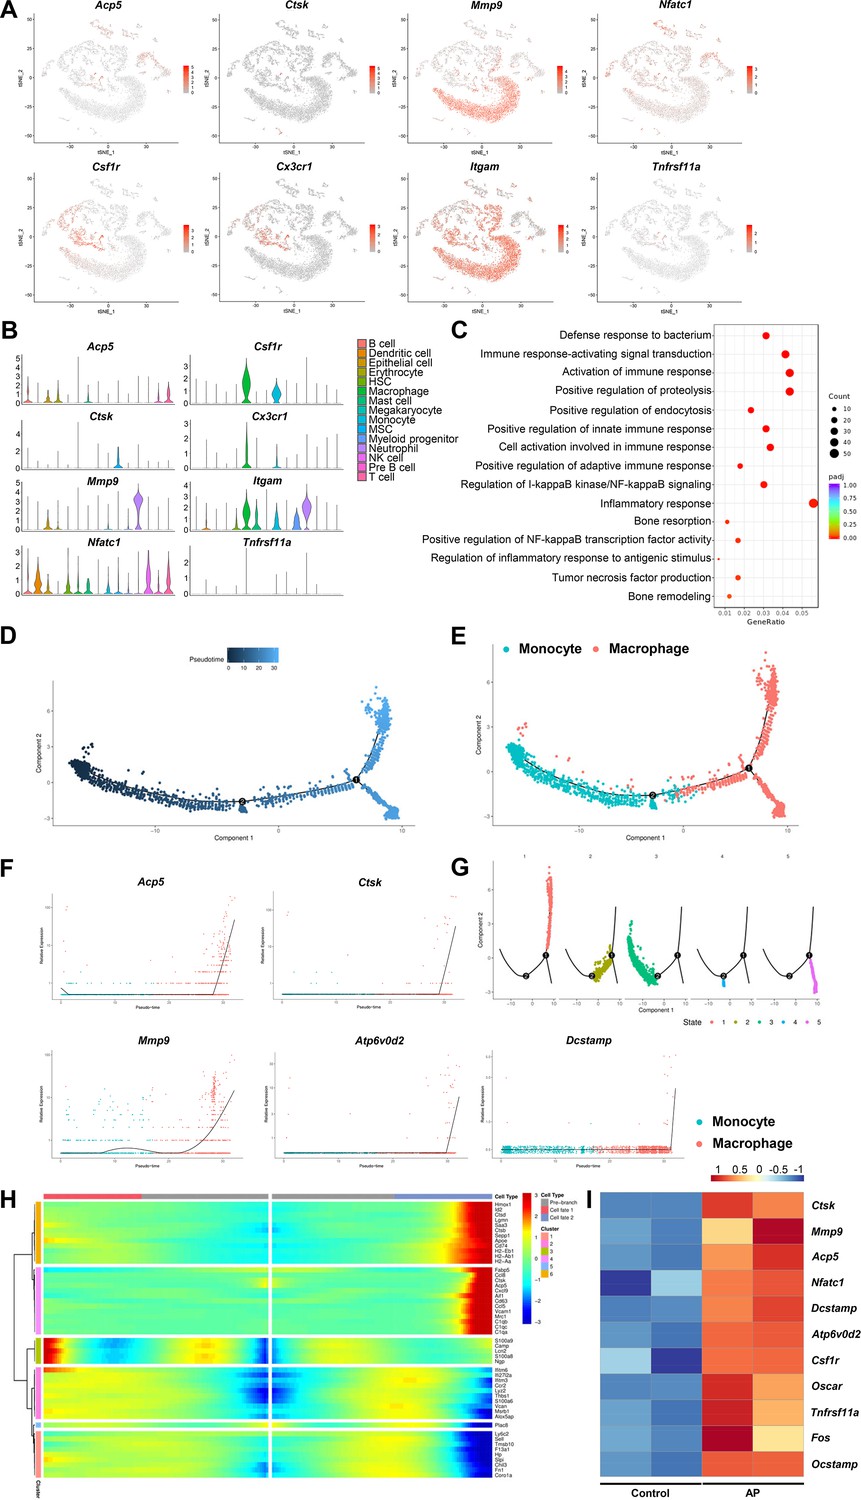
Inflammatory-related bone resorption under apical periodontitis (AP) situation.
(A) The expression levels of markers of osteoclasts and osteoclast precursors. (B) Violin plots of the expression of osteoclastogenesis genes. (C) Gene Ontology (GO) enrichment analysis of the biological functions of macrophage cluster. (D) Trajectory order of the monocyte/macrophage populations by pseudotime value. (E) The differentiation trajectory of monocyte and macrophage clusters presented on a t-stochastic neighbor embedding (t-SNE) visualization. (F) The expression patterns of osteoclast markers during the trajectory of monocyte/macrophage populations. (G) Distribution of monocytes/macrophages on the developmental tree by clusters. (H) Heatmap of differential genes of three states. (I) Heatmap of genes associated with osteoclastogenesis in bulk RNA-seq analysis.
Figure 3—figure supplement 1
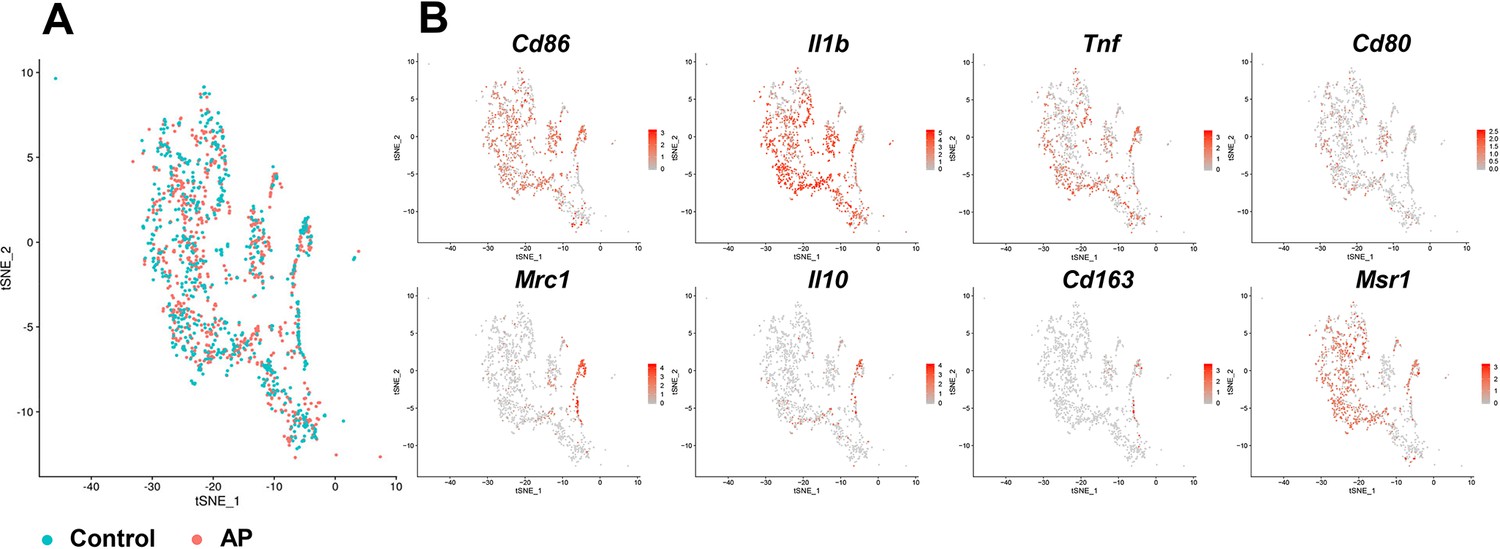
The expression pattern of markers of M1-like macrophages and M2-like macrophages in macrophage cluster.
Figure 4

Apical periodontitis (AP) suppressed transcriptionally inferred cellular interactions and increased a self-supporting network within the mesenchymal stem cell (MSC) cluster.
(A–C) Network plot of ligand-receptor activity in control (A), AP (B), and AP versus control (C). (D) Bar plot of top 10 most abundant ligands in all inferred ligand-receptor interactions. (E) Ranking of ligand/source regarding communication gains in AP state. (F and G) Sankey plot listing all predicted source, receptor, and receiver interactions associated with Fn1 and Sele.
Figure 5 with 3 supplements
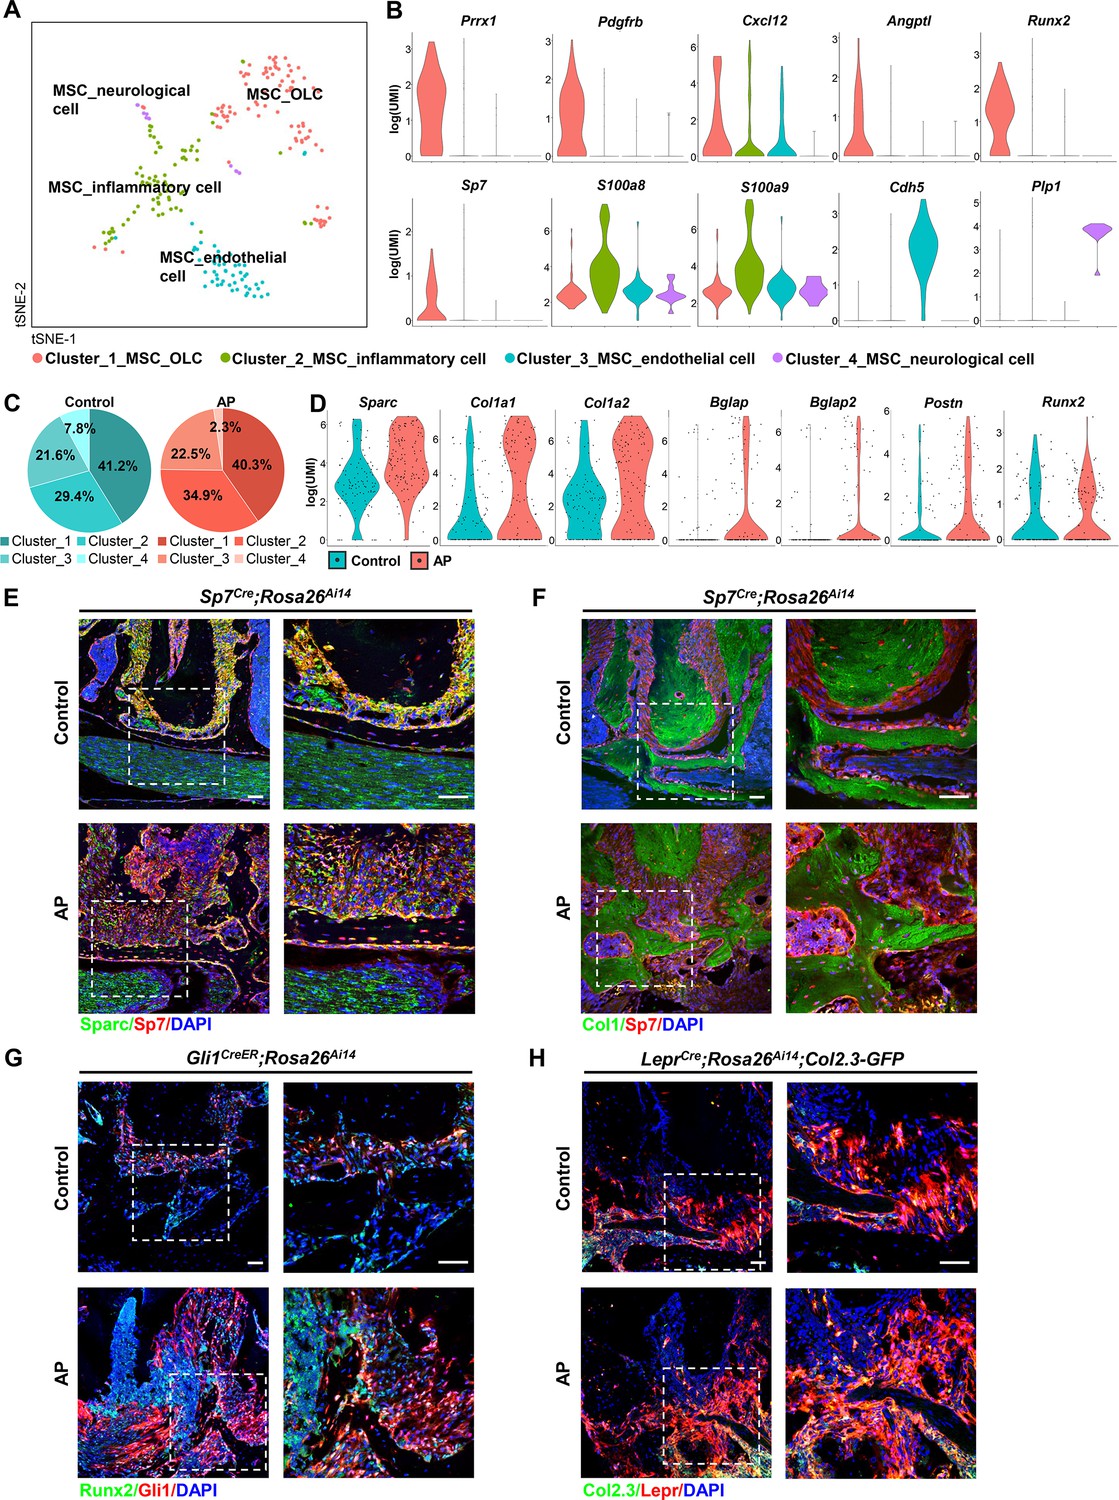
Identification and characterization of apical periodontitis (AP)-associated mesenchymal stem cell (MSC) population and its subclusters.
(A) t-Stochastic neighbor embedding (t-SNE) representation an unsupervised clustering of single cells within the MSC cluster. (B) Violin plots of MSC subcluster-specific expression of representative genes. (C) The percentages of four subclusters of MSC population were quantified in control and AP groups. (D) Violin plots depict the changes in the expression of top upregulated genes in the MSC cluster. (E and F) Immunofluorescence double staining of Sparc (E) and Col1 (F) in Sp7-expressing osteoprogenitors. Scale bar, 50 μm. (G) Immunofluorescence double staining of Runx2 in Gli1+ periodontal stem cells (PDLSCs). Scale bar, 50 μm. (H) Lineage tracing analysis of Lepr+ PDLSCs and Col2.3+ osteoblasts. Scale bar, 50 μm.
Figure 5—figure supplement 1

Red fluorescent protein expression in Prrx1Cre;Rosa26Ai14, Sp7Cre;Rosa26Ai14, Gli1CreER;Rosa26Ai14, and LeprCre;Rosa26Ai14;Col2.3-GFP mouse models.
Scale bar, 50 μm.
Figure 5—figure supplement 2

Gene Ontology (GO) enrichment analysis of the biological functions of mesenchymal stem cell (MSC) subclusters.
Figure 5—figure supplement 3

Real-time quantitative PCR (qPCR) and bulk RNA-seq analysis of osteogenic markers during apical periodontitis (AP) situation.
(A) Gene expression of Runx2, Sparc, Col1a1, Col1a2, and Bglap in samples of control and AP mouse mandibles. n=6 in control group and n=7 in AP group. *p<0.05, **p<0.01, ***p<0.001, and ****p<0.0001. All data were exhibited as mean ± SEM. (B) Heatmap of representative genes associated with osteogenesis in bulk RNA-seq analysis.
Figure 6
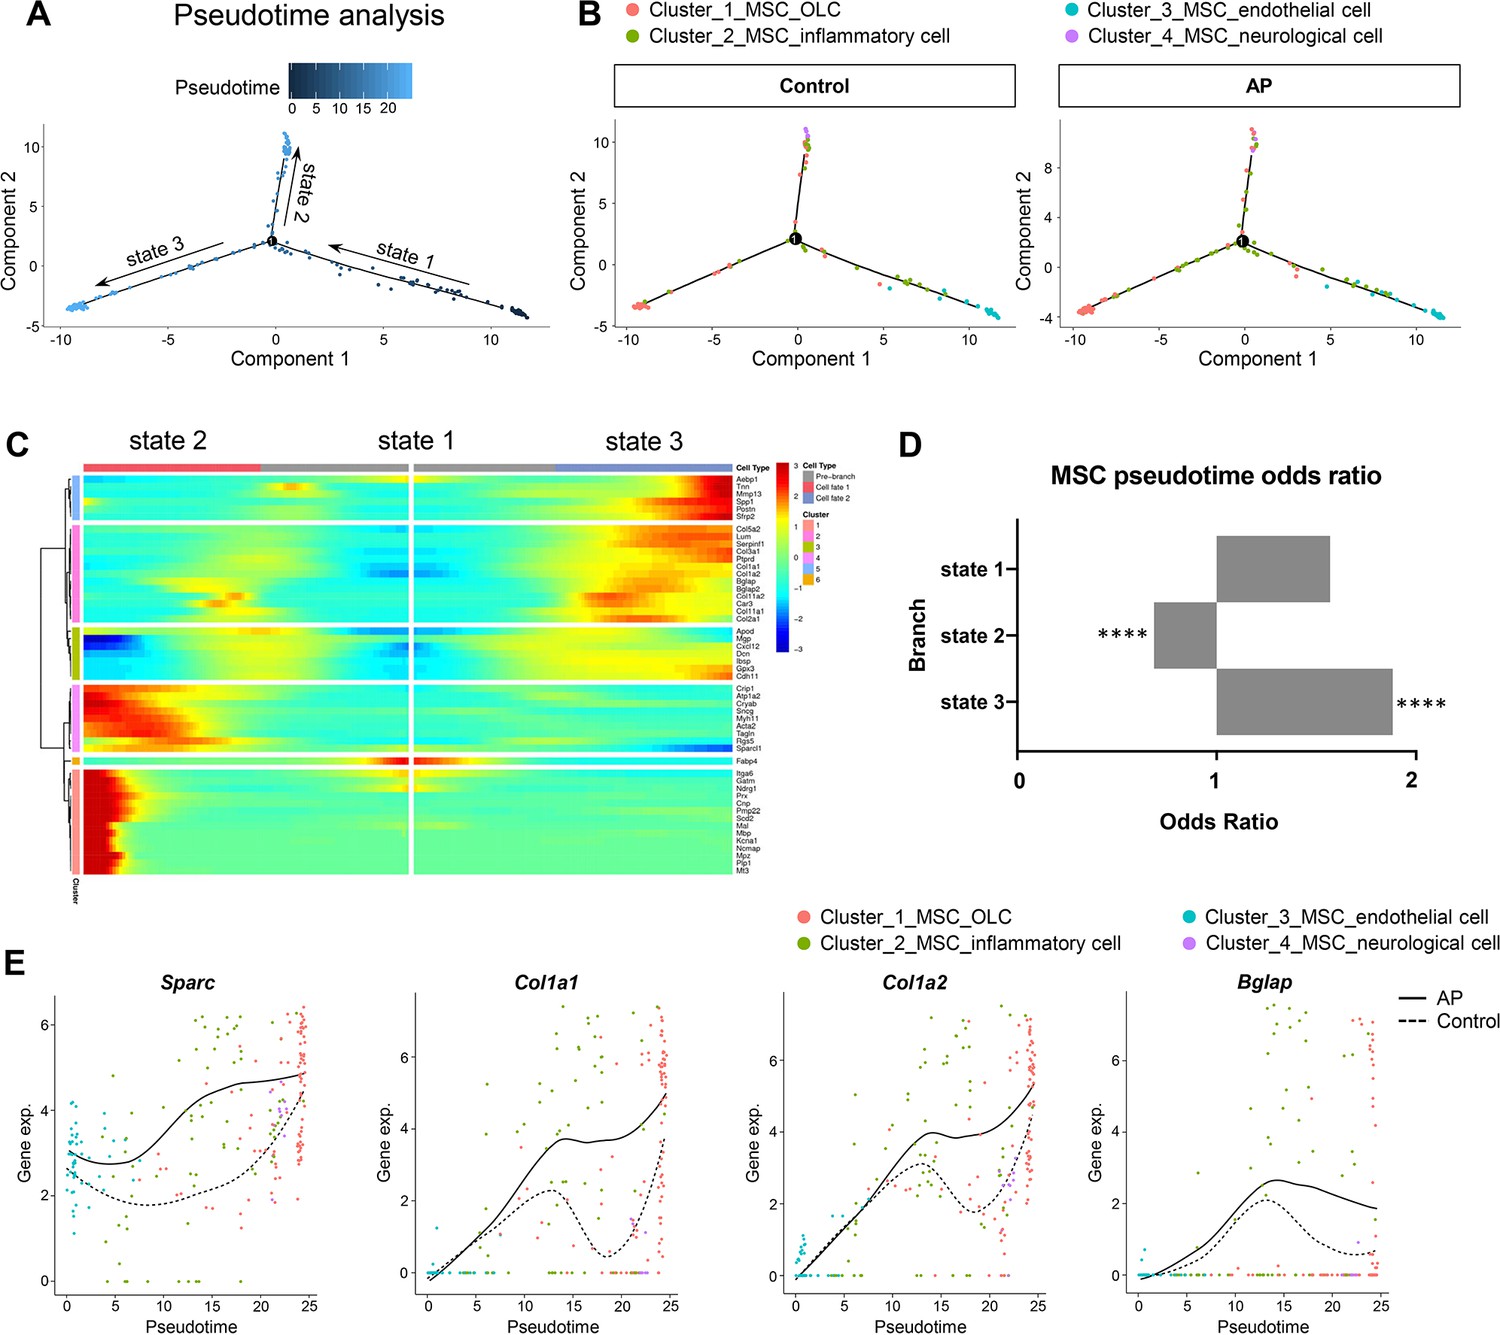
Apical periodontitis (AP) stimulates mesenchymal stem cell (MSC) differentiation toward osteoblast lineage cells.
(A) Pseudotime analysis of the MSC population. (B) Reconstructed cell differentiation trajectory of MSC populations in control and AP groups. (C) Heatmap of differential genes of three states. (D) Bar plot of numerical changes between AP and control in respective states as identified in pseudotime analysis. Fisher’s exact test with Bonferroni correction was used. ****p<0.0001. All data were exhibited as mean ± SEM. (E) Comparison between the pseudotime gene trajectories of MSC subpopulations showed upregulation of Sparc, Col1a1, Col1a2, and Bglap. Black line indicates AP, and dotted lines indicate control.
Figure 7
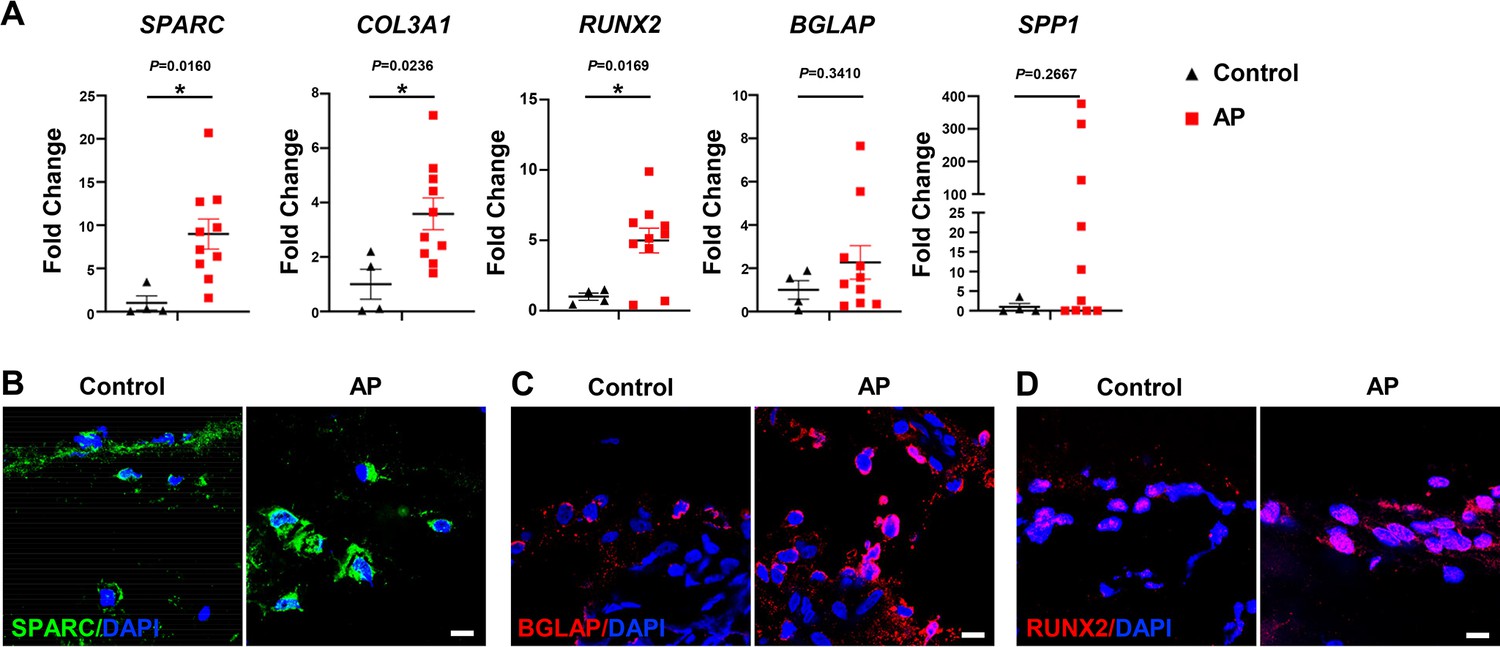
Human alveolar bone in apical periodontitis (AP) is associated with higher osteolineage subcluster (OLC)-associated transcripts.
(A) Gene expression of SPARC, COL3A1, RUNX2, SPP1, and BGLAP in samples of healthy individuals and AP patients showed an upregulated expression in AP group. n=4 in healthy individuals and n=10 in AP patients. *p<0.05. All data are shown as the mean ± SEM. (B–C) Immunofluorescence staining of SPARC, BGLAP, and RUNX2 in bone marrow of human alveolar bone exhibited high osteogenic protein levels in AP. n=4. Scale bar, 10 μm.
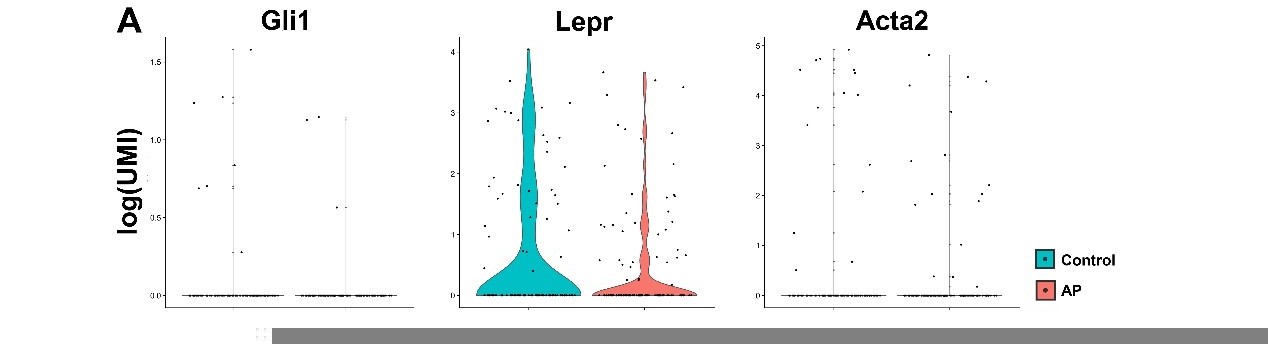
Author response image 1
Additional files
-
Supplementary file 1
Quantitative RT-PCR (qRT-PCR) primer sequences.
- https://cdn.elifesciences.org/articles/82537/elife-82537-supp1-v2.docx
-
MDAR checklist
- https://cdn.elifesciences.org/articles/82537/elife-82537-mdarchecklist1-v2.docx
-
Source data 1
Source data files for Figure 1D, Figure 1—figure supplement 1B, Figure 2A, Figure 3I, Figure 4D-E, Figure 5C, Figure 5—figure supplement 3A-B, Figure 6D and Figure 7A.
- https://cdn.elifesciences.org/articles/82537/elife-82537-data1-v2.zip
Download links
A two-part list of links to download the article, or parts of the article, in various formats.
Downloads (link to download the article as PDF)
Open citations (links to open the citations from this article in various online reference manager services)
Cite this article (links to download the citations from this article in formats compatible with various reference manager tools)
Creating an atlas of the bone microenvironment during oral inflammatory-related bone disease using single-cell profiling
eLife 12:e82537.
https://doi.org/10.7554/eLife.82537


