ErbB signaling is a potential therapeutic target for vascular lesions with fibrous component
- A.I. Virtanen Institute for Molecular Sciences, University of Eastern Finland, Finland
- Department of Plastic Surgery, Helsinki University Hospital and University of Helsinki, Finland
- VASCERN VASCA European Reference Centre, Helsinki University Hospital, Finland
- Department of Radiology, HUS Diagnostic Center and Helsinki University Hospital and University of Helsinki, Finland
- Department of Pathology, HUSLAB, Helsinki University Hospital and University of Helsinki, Finland
- Department of Pediatric Surgery, New Children's Hospital, Helsinki University Hospital and University of Helsinki, Finland
- Science Service Center, Kuopio University Hospital, Finland
- Gene Therapy Unit, Kuopio University Hospital, Finland
Figures
Figure 1 with 2 supplements
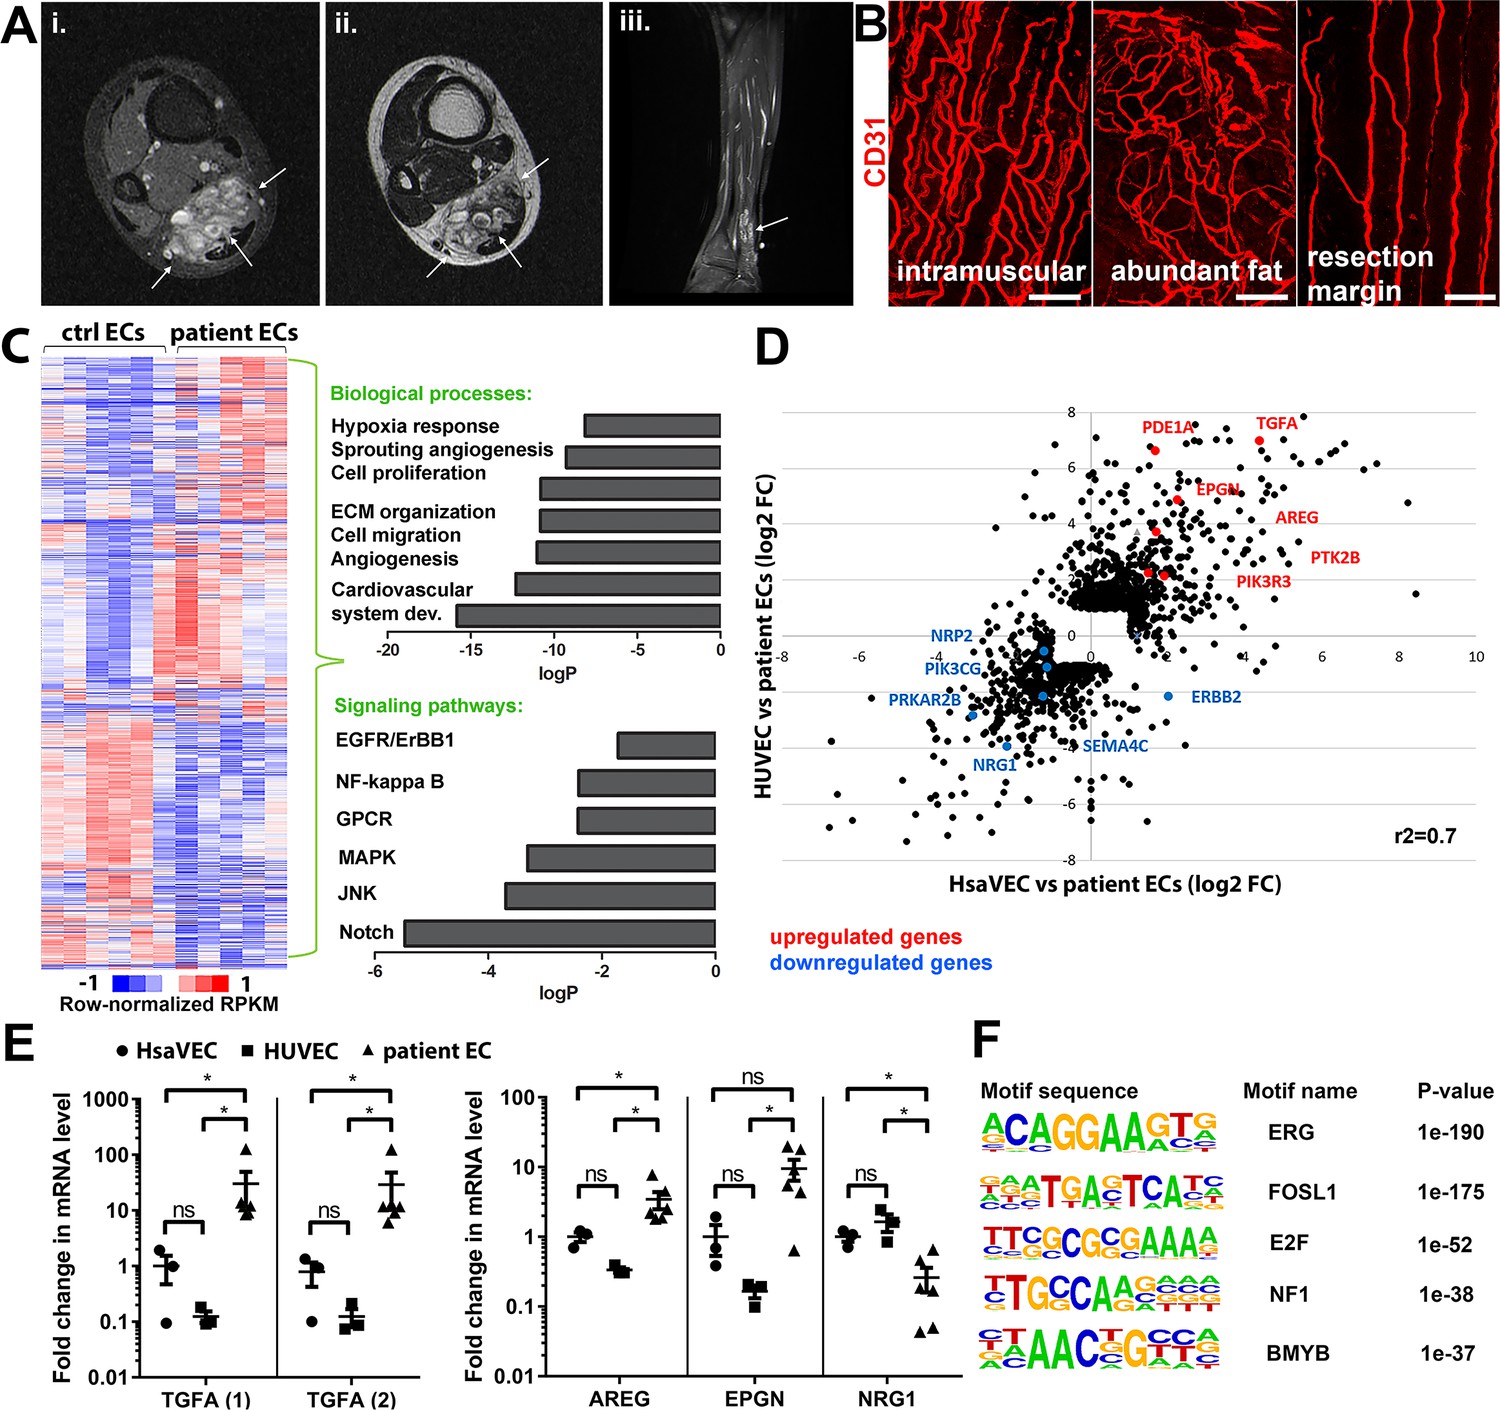
Genes involved in ErbB signaling pathway are upregulated in patient-derived endothelial cells (ECs) in vascular lesions with the venous components.
(A) Magnetic resonance images of an angiomatosis of soft tissue (AST) lesion (arrows) in the soleus muscle show the replacement of the normal muscle by dilated venous channels, diffusely enhancing small vessels and adipose tissue. (i) Axial T1-weighted fat-saturated contrast-enhanced image. (ii) Axial T2-weighted image. (iii) Sagittal T2-weighted fat-saturated image. (B) 1mm-thick whole immunomounts were prepared from patient lesions, immunolabeled, and imaged by laser scanning confocal microscopy. Images of the vasculature in the AST lesion located in the shin of a 16-year-old female are shown. Endothelial cells are immunolabeled with CD31 antibody (red). Vasculature of the same lesion in the intramuscular area (i), with abundant fat (ii) and next to resection margin (iii) are presented. Longitudinal vessels are seen. Scale bars, 100 µm. (C) Heatmap of normalized RPKM values (−1–1) of the differentially regulated genes in patient-derived ECs compared to HUVEC and human saphenous vein endothelial cells (HsaVEC) control cells detected by bulk RNA-seq. Clustering was performed using Spearman’s rank correlation. Biological processes and cell signaling pathways detected by gene ontology analysis in patient-derived ECs. (D) Scatter plot of the fold changes in gene expression comparing patient-derived and control ECs. Selected genes involved in PIK3CA, VEGFR2, and ErbB1-4 signaling are highlighted in red (upregulated) and blue (downregulated). Pearson correlation value (r2) is shown. (E) Changes in mRNA expression levels of ErbB ligands (transforming growth factor A (TGFA), with two different assays; amphiregulin, AREG; epigen, EPGN1; neuregulin 1, NRG1) were validated with RT-qPCR from patient-derived and control ECs. Mean and SEM is presented (HsaVEC and HUVEC, n=3; patient ECs, n=5). Kruskal-Wallis test with two-stage step-up method of Benjamini, Krieger, and Yekutieli to control FDR [TGFA (1), TGFA (2), AREG; data not normally distributed] or Brown-Forsythe and Welch ANOVA with Dunnet T3 post hoc test (NRG1, EPGN; data normally distributed but unequal variances). *p<0.05. (F) Sequence motifs associated with differentially regulated genes in patient-derived ECs.
Figure 1—figure supplement 1
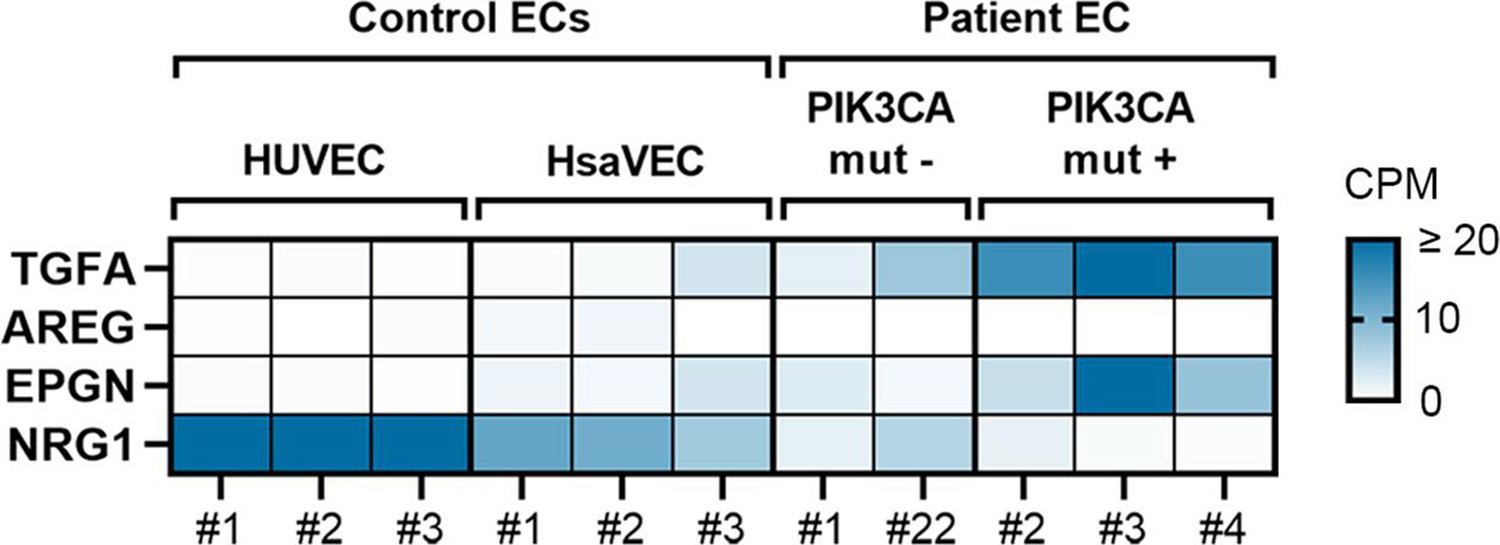
Highest expression of TGFA and EPGN is shown in patient ECs positive for oncogenic PIK3CA variants.
RNA-seq data revealed that the highest levels of transforming growth factor A (TGFA) and epigen (EPGN) mRNA were detected in patient-derived endothelial cells (ECs) having an oncogenic PIK3CA variant (PIK3CAmut+ Patient EC) in comparison to control ECs (HUVEC, human saphenous vein endothelial cells, HsaVEC) and patient-derived ECs without any oncogenic PIK3CA variant (PIK3CAmut− Patient ECs), while NRG1 mRNA was lower in patient-derived EC than control ECs. Data is presented in a heatmap format and shows normalized sequencing reads (counts per million reads, CPM) for the target gene expression in each sample separately. Scale 0–20 CPM (CPM values ≥20 are presented with the highest color intensity).
Figure 1—figure supplement 2
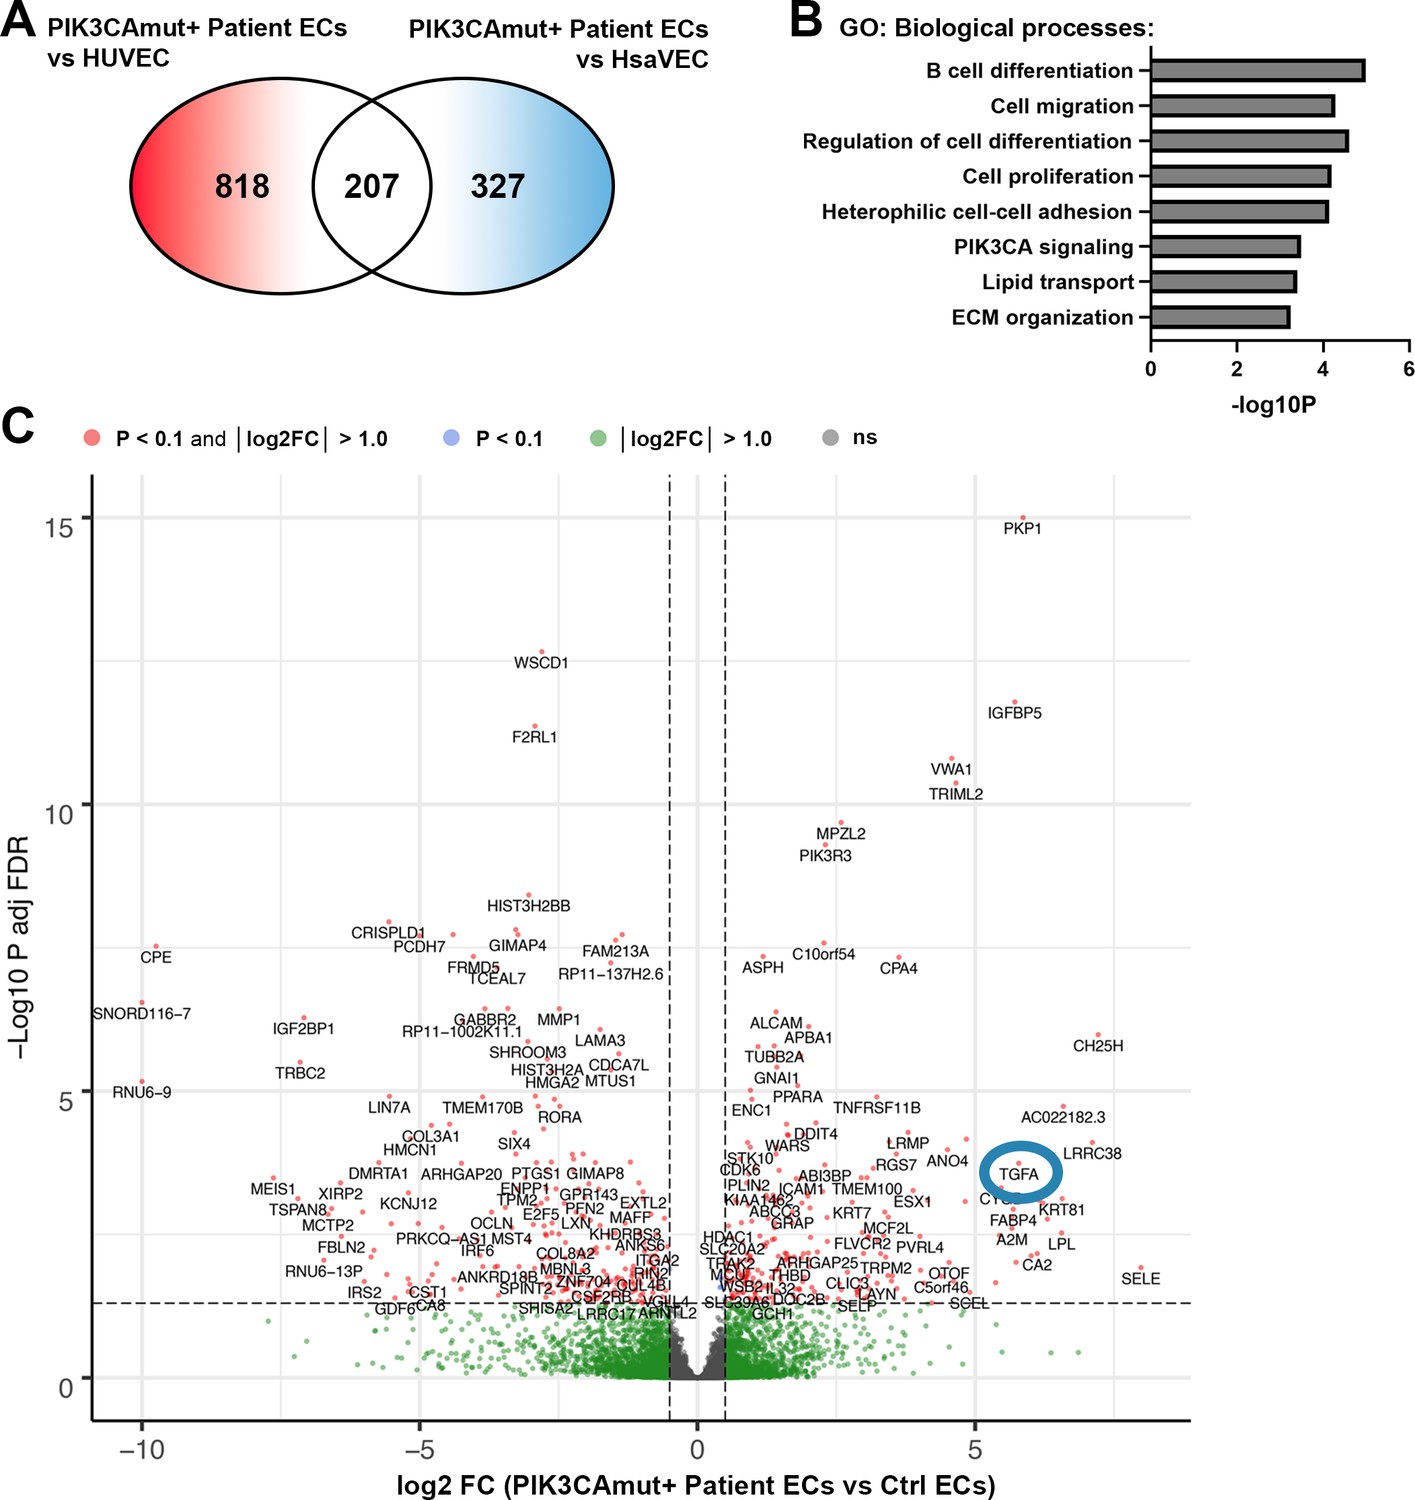
TGFA and genes related to cell migration, proliferation, and ECM organization, are regulated in patient ECs with oncogenic PIK3CA variant.
(A) Further analysis demonstrated 818 differentially expressed genes (DEGs) between PIK3CAmut+ Patient endothelial cells (ECs) and HUVEC, and 327 DEGs between PIK3CAmut+ Patient ECs and human saphenous vein endothelial cells (HsaVECs) (FDR-adjusted p-value <0.1, log2 FC >1.0 for both comparison). Since gene expression patterns in HUVECs and HsaVECs were rather similar (compared to patient-derived ECs), both control EC types were clustered together for the downstream analysis. Final analysis revealed 499 (FDR-adjusted p-value <0.1, log2 FC >1.0) DEGs between PIK3CAmut+ Patient ECs (n=3) and control ECs (HUVEC and HsaVEC, n=6). (B–C) Biological processes detected by gene ontology analysis of DEGs (B) and a volcano plot of the genes (C) are presented. (C) A blue circle highlights the detection of transforming growth factor A (TGFA) as one of the top upregulated DEGs with connection to patient-derived ECs with an oncogenic PIK3CA variant.
Figure 2 with 3 supplements
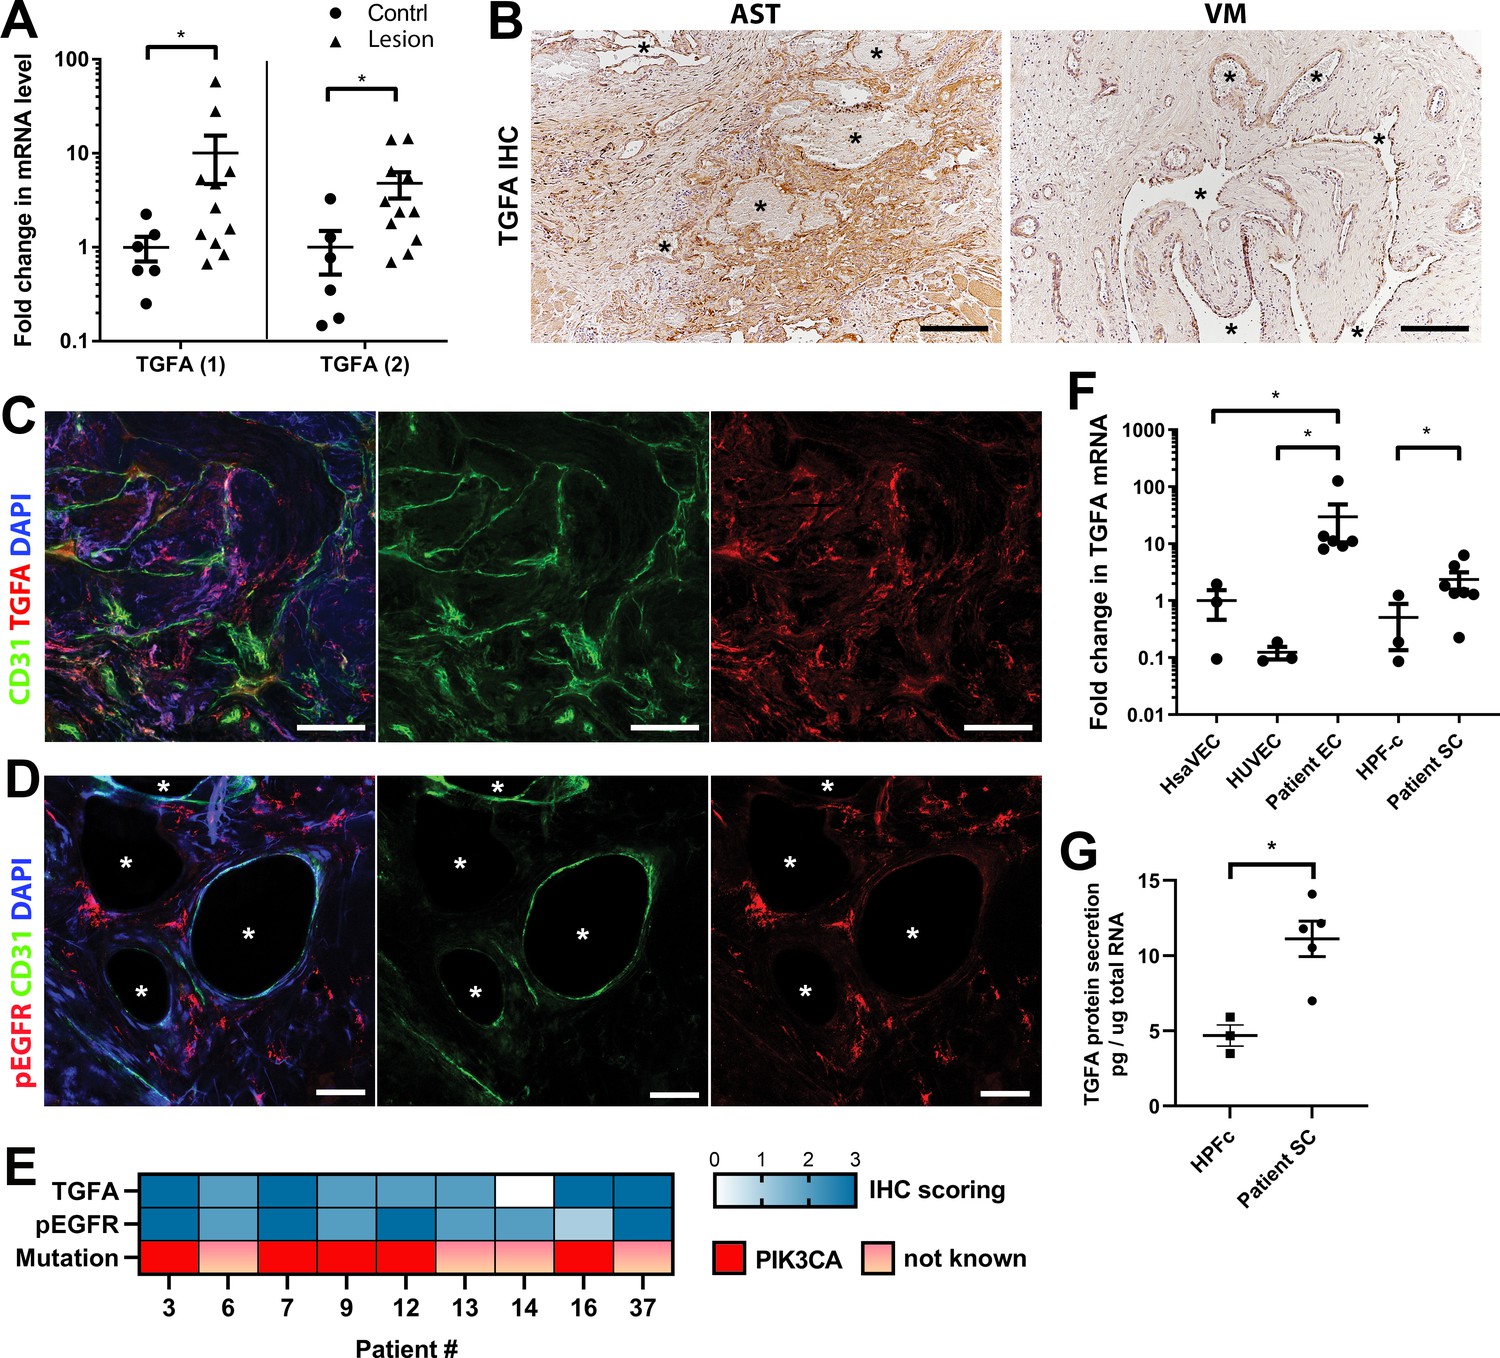
Epidermal growth factor receptor (EGFR)/ErbB1 ligand transforming growth factor A (TGFA) is upregulated in venous malformation (VM) and angiomatosis of soft tissue (AST) patient tissue samples.
(A) RT-qPCR analysis showed significantly higher expression of TGFA mRNA (with two different assays) in VM and AST tissue than in the control group. Mean and SEM are presented (lesions n=11; control group, n=6), analyzed using two-tailed Mann-Whitney U test. *, p<0.05. (B) Representative images of TGFA expression in AST and VM patient samples. See Figure 2—figure supplement 2 for normal skeletal muscle control. TGFA signal was detected in lesions in the endothelium, pericytes, and intrastromal cells by immunohistochemistry. Asterisks point out the largest vascular lumens which, especially in AST, are commonly tightly packed with erythrocytes. Scale bars, 200 µm. (C) Representative whole immunomount images of CD31-labeled endothelium (green) and TGFA expression (red) in a patient diagnosed with intramuscular AST. Nuclei are stained with DAPI (blue). Longitudinal vessels are seen. Scale bars, 100 µm. (D) Representative confocal images of phosphorylated epidermal growth factor receptor (EGFR) (red) expression in AST lesion. Endothelium is labeled with CD31 antibody (green), and nuclei with DAPI. Vascular lumens are indicated with white asterisks in the cross-sections. Scale bars, 50 µm. (E) Heatmap of TGFA and pEGFR protein expression and presence of oncogenic PIK3CA variants in AST patients. Level of protein expression was scored (0–3) based on the detected signal in immunocytochemistry (0, none; 1, low; 2, medium; and 3, high). (F) RT-qPCR analyses of TGFA expression in patient-derived endothelial cells (ECs) and intervascular stromal cells (SCs). Selection of ECs was performed by CD31 MicroBead Kit. Stromal cells were characterized by western blot and showed to be negative for EC marker CD31, and positive for fibroblast and smooth muscle cell marker vimentin (see Figure 2—figure supplement 2). The data is presented as relative mean fold change to HsaVEC control group and SEM (Human saphenous vein endothelial cells:HsaVEC, HUVEC, and HPF-c, n=3; patient ECs, n=5; patient SCs, n=6). Statistical significance was analyzed using Kruskal-Wallis test with two-stage step-up method of Benjamini, Krieger and Yekutieli to control FDR (ECs) or two-tailed Mann-Whitney U test (SCs; in both analyses, data not normally distributed). *p<0.05. (G) TGFA was shown to be secreted from patient-derived intervascular stromal cells (SCs) by ELISA (patient SC n=5; HPF-c n=3). Two-tailed unpaired t-test with Welch’s correction (data normally distributed but unequal variances). **p<0.005.
Figure 2—figure supplement 1
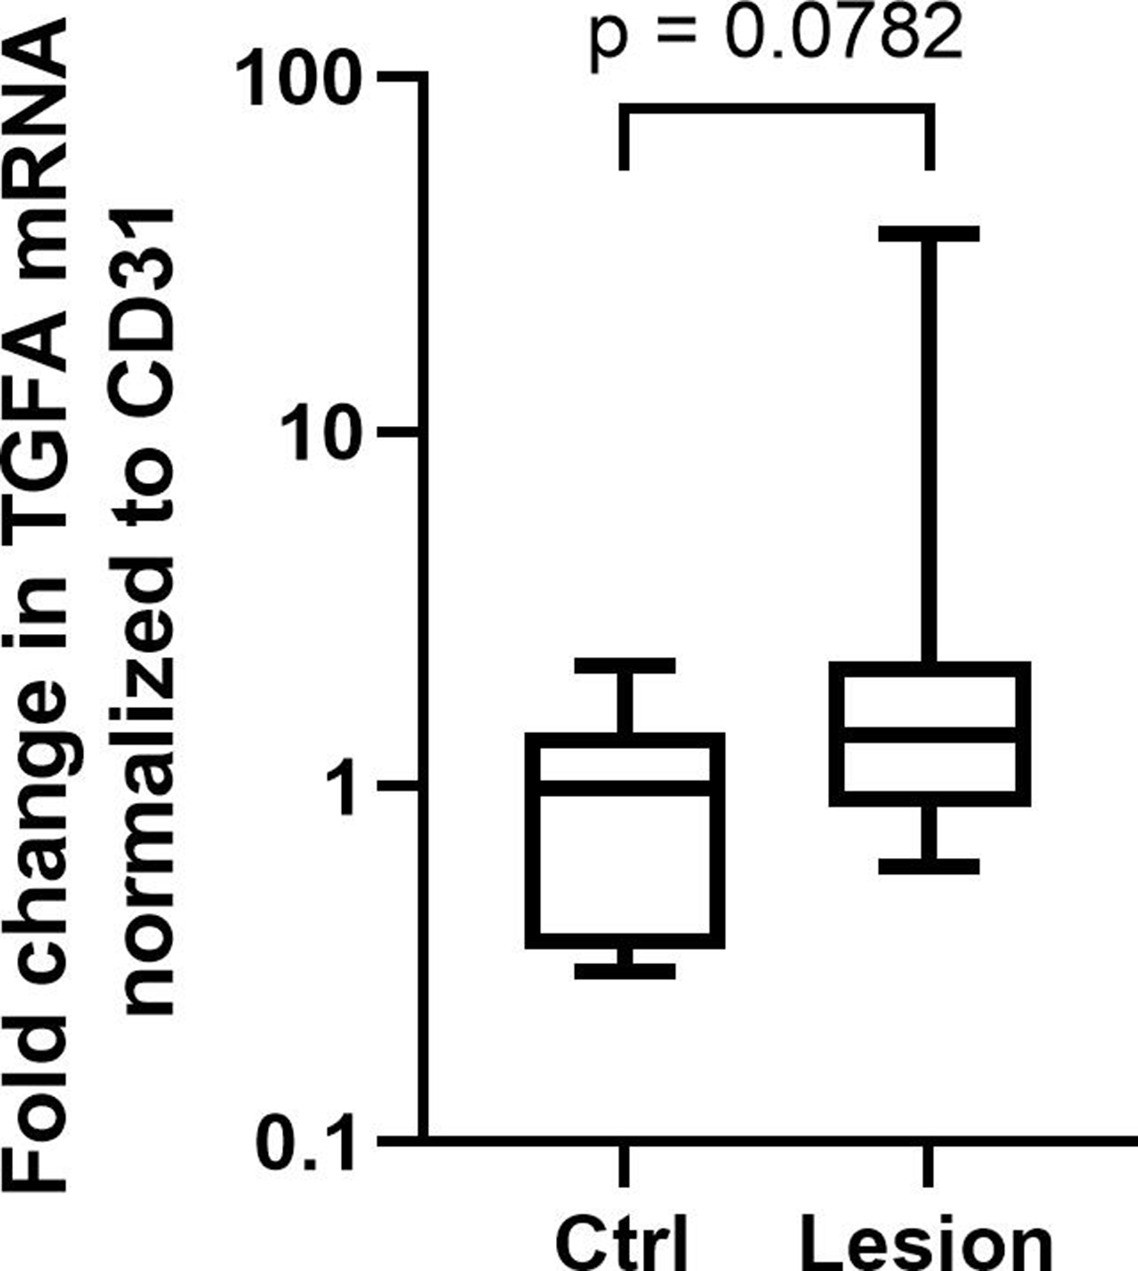
TGFA expression in patient lesions normalized to vascular EC marker.
RT-qPCR analysis showed a trend (p = 0.0782) toward higher expression of transforming growth factor A (TGFA) mRNA in venous malformation (VM) and angiomatosis of soft tissue (AST) patient tissues than in the control group also when normalized to endothelial cell (EC) marker CD31/PECAM1, indicating that upregulation of TGFA mRNA expression would not be only due to increased vasculature/EC content. Mean and SEM are presented (lesions n=11; control group, n=6). Two-tailed Mann-Whitney U testdata not normally distributed.
-
Figure 2—figure supplement 1—source data 1
Raw data for western blot images.
- https://cdn.elifesciences.org/articles/82543/elife-82543-fig2-figsupp1-data1-v2.zip
Figure 2—figure supplement 2
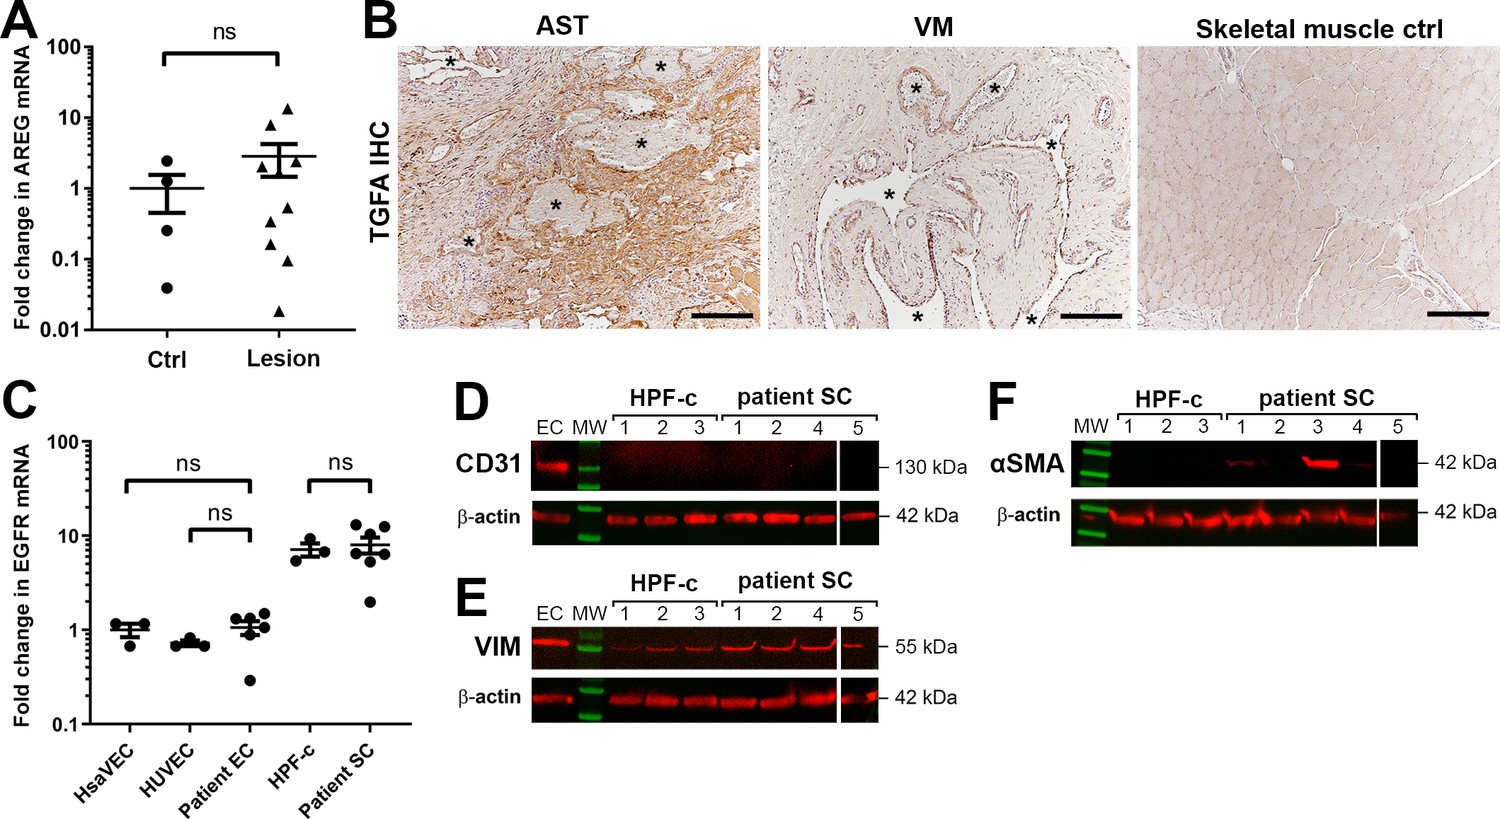
TGFA and EGFR are expressed in patient cells.
A) RT-qPCR analysis of ErbB1 ligand amphiregulin (AREG) mRNA in venous malformation (VM) and angiomatosis of soft tissue (AST) lesions. Mean and SEM are presented (lesions n=10; control group, n=4; 1 lesion sample and 2 controls are not included in the blot due to having AREG mRNA expression under the detection limit). Two-tailed Mann-Whitney U test. *p<0.05; ns, no significant difference. (B) Representative images of transforming growth factor A (TGFA) expression in AST and VM patient samples and in normal skeletal muscle control. TGFA signal was detected in lesions in the endothelium, pericytes, and intrastromal cells by immunohistochemistry. Asterisks point out the largest vascular lumens detected in the pathological samples. Scale bars, 200 µm. (C) Epidermal growth factor receptor (EGFR) expression levels in patient-derived endothelial cells (ECs) and intervascular stromal cells. The data is presented as relative mean fold change to human saphenous vein endothelial cells (HsaVEC) control group and SEM (HsaVEC, HUVEC, and HPF-c, n=3; patient ECs and patient SCs, n=6). Kruskal-Wallis test with two-stage step-up method of Benjamini, Krieger and Yekutieli to control FDR (ECs; data not normally distributed) or two-tailed unpaired t-test with Welch’s correction (SCs; data normally distributed but unequal variances). *p<0.05; ns, no significant difference. (D–F) Western blot analysis for cell-type specific markers. Besides evident cell morphology, patient-derived intervascular stromal cells were confirmed to be CD31 negative (D). All samples were positive for a fibroblast marker vimentin (E). Some intervascular stromal cells were shown to be positive for αSMA (F), a typical marker of activated fibroblasts and smooth muscle cells. (D–F) β-actin was used as a control to confirm equal loading of the samples.
Figure 2—figure supplement 3
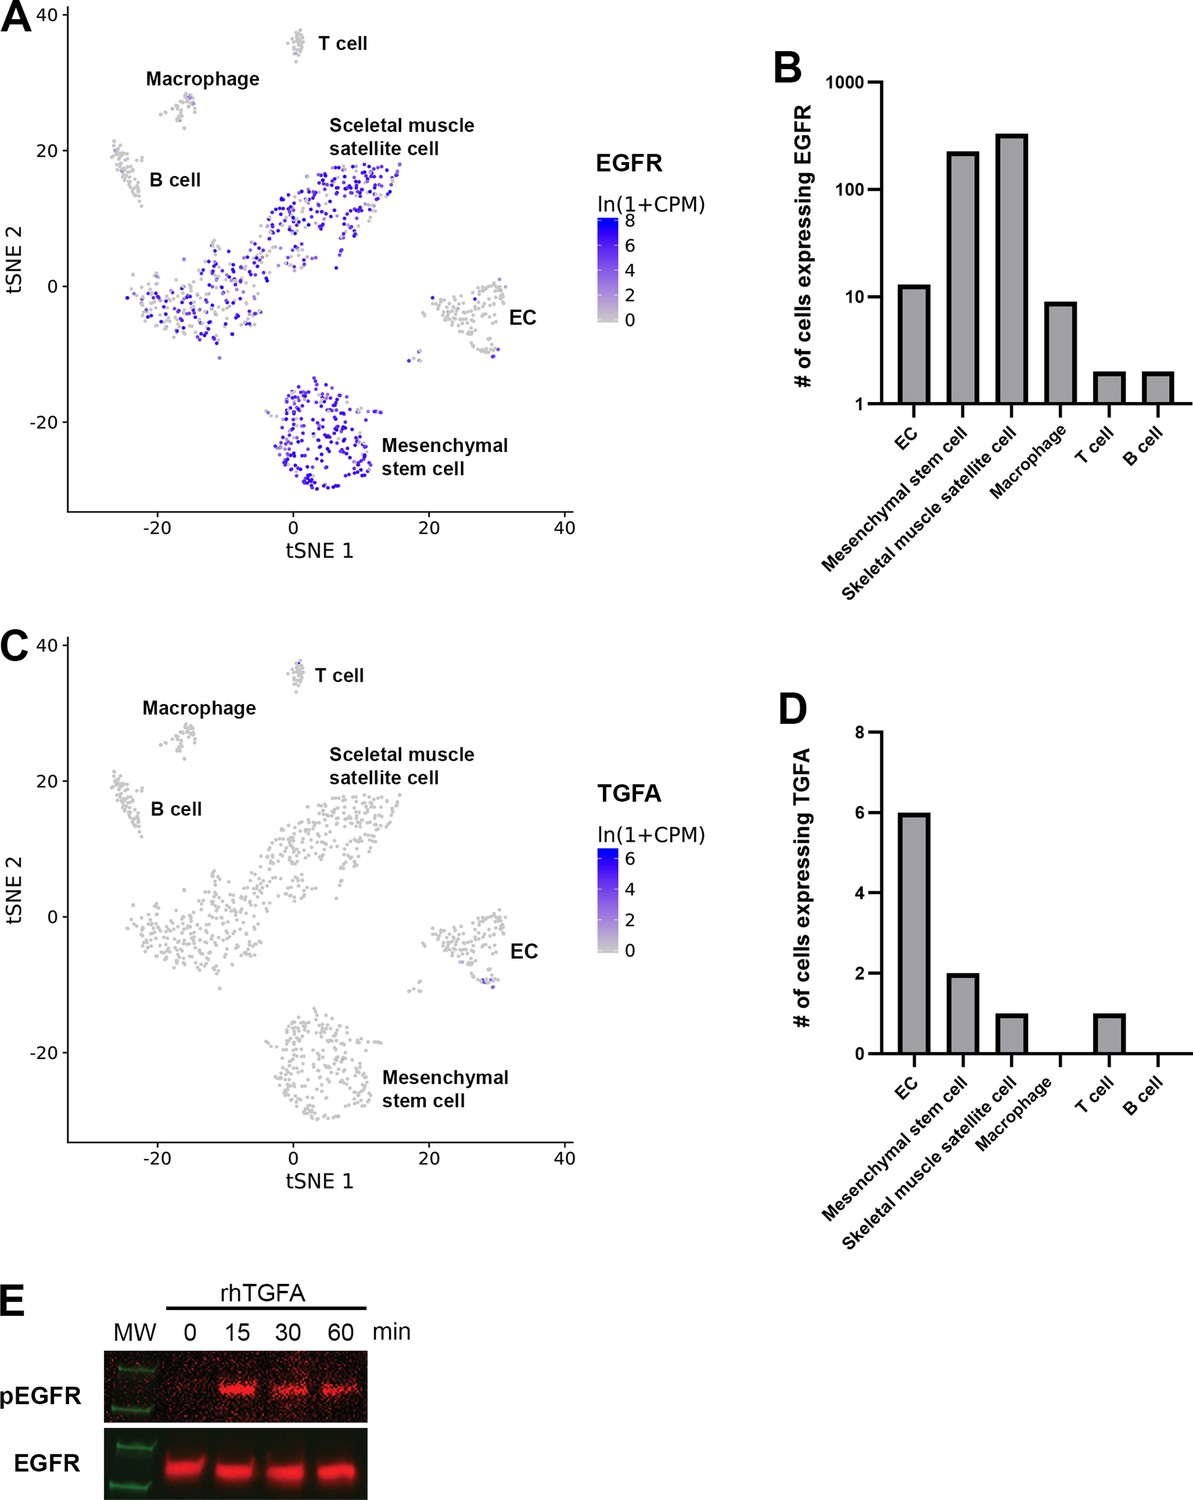
scRNAseq data from mouse lower limb skeletal muscle presenting clusters positive for EGFR and TGFA.
scRNAseq data from mouse lower limb skeletal muscle (Tabula Muris, czbiohub.org) of epidermal growth factor receptor (EGFR) (A–B) and transforming growth factor A (TGFA) (C–D) expression. EGFR was expressed mainly in mesenchymal stem cells and skeletal muscle satellite cells but only a small portion in endothelial cells (ECs). A very few TGFA+ were detected in mouse normal healthy skeletal muscle.
Figure 3 with 3 supplements
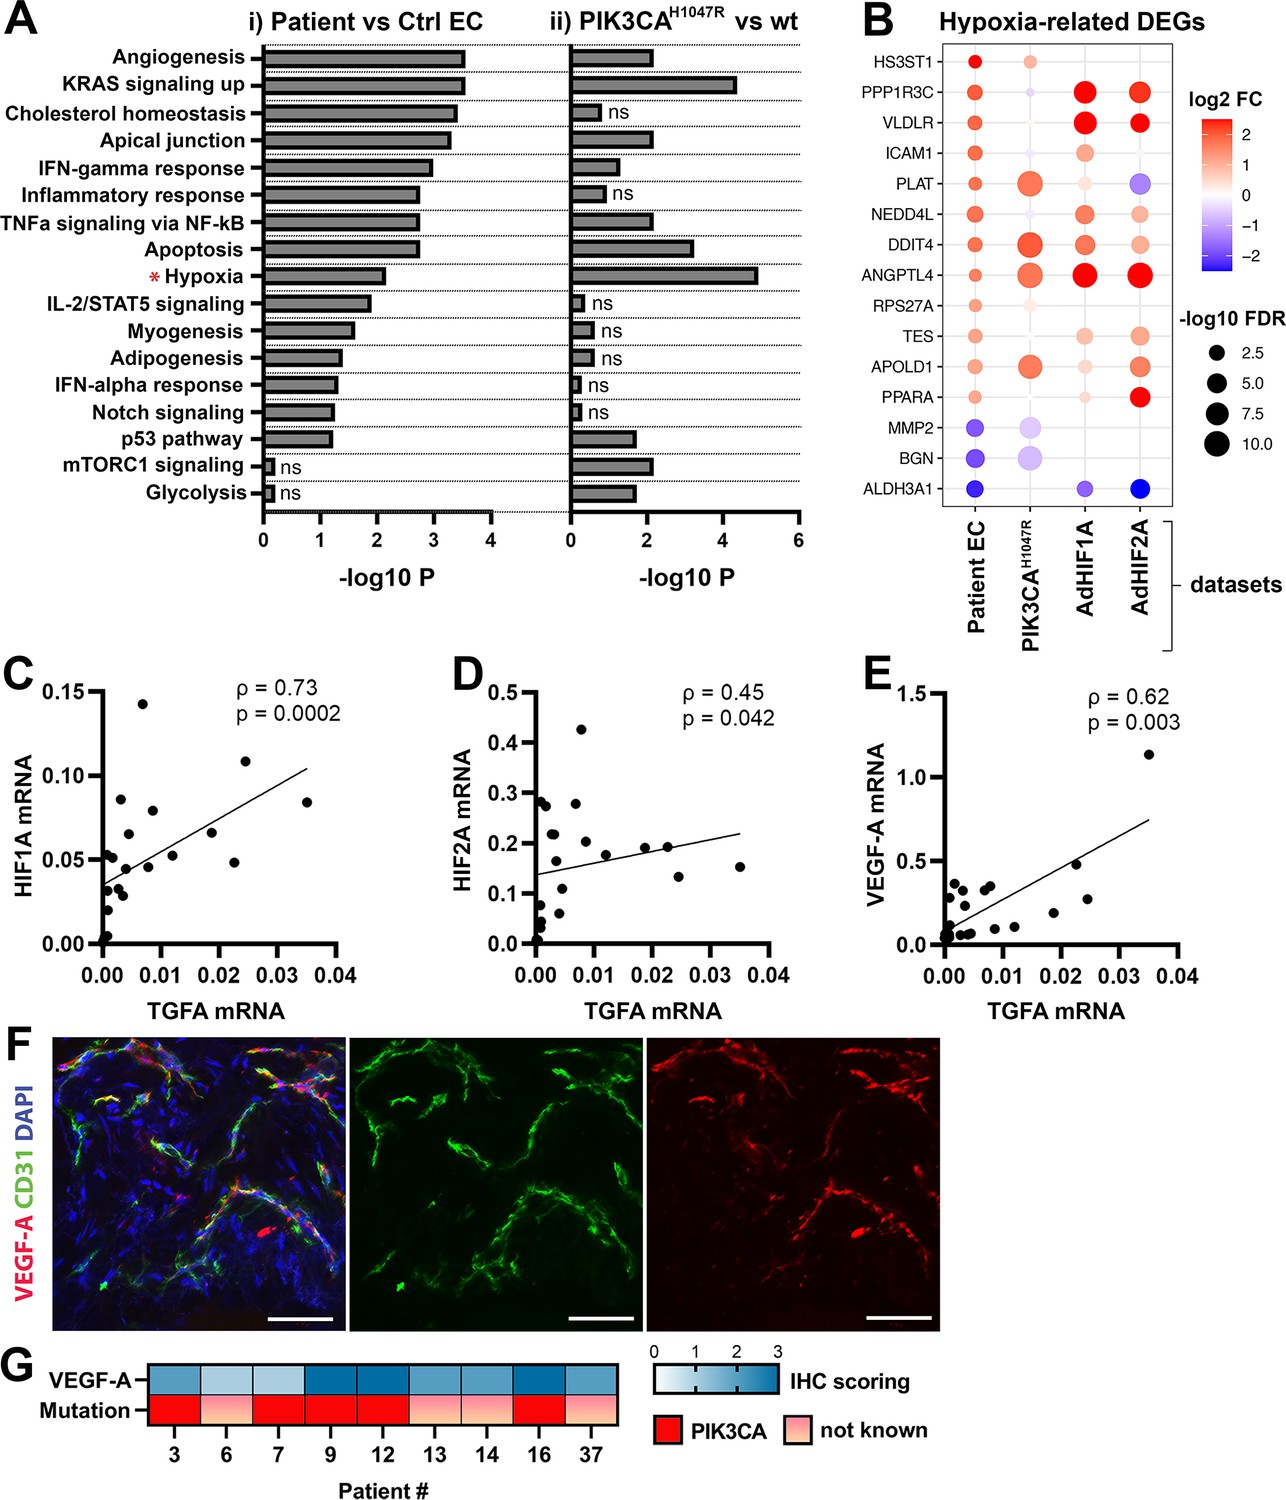
Oncogenic PIK3CAH1047R induces enrichment of hallmark hypoxia.
(A) Several shared MSigDB Hallmarks were found in bulk RNA-seq data from (i) patient-derived endothelial cells (ECs) vs control ECs (left panel), and (ii) ECs expressing PIK3CAwt or most common oncogenic variant detected in patient lesions, PIK3CAH1047R (right panel). Hallmark analysis was performed with the EnrichR web server, using adjusted p-value <0.1 to define terms with significant enrichment of differentially expressed genes (DEGs). Hallmark Hypoxia (*) was detected as one of the top hallmarks in both RNA-seq datasets. (B) Top 15 hypoxia-related genes differentially expressed between patient-derived vs control ECs, shown to be regulated in PIK3CAH1047R expressing ECs and/or by HIF1A/HIF2A. (C–E) Correlation between transforming growth factor A (TGFA) and HIF1A (C), HIF2A (D), and VEGFA (E) mRNA expression levels detected in angiomatosis of soft tissue (AST) and venous malformation (VM) lesions (n=23). Spearman’s test was used to define correlation (data not normally distributed). Rho, Spearman’s rank correlation coefficient. (F) Representative whole immunomount images of vasculature in AST lesion expressing VEGF-A (red) detected by confocal microscopy. Endothelium is labeled with CD31 antibody (green) and nuclei with DAPI (blue). Co-localization of VEGF-A and CD31 markers are seen in yellow. Longitudinal vessels are seen. Scale bars, 50 µm. (G) Heatmap of VEGF-A expression and presence of oncogenic PIK3CA variants in AST patients. Level of VEGF-A expression was scored (0–3) based on the detected signal in immunocytochemistry (0, none; 1, low; 2, medium; and 3, high).
Figure 3—figure supplement 1
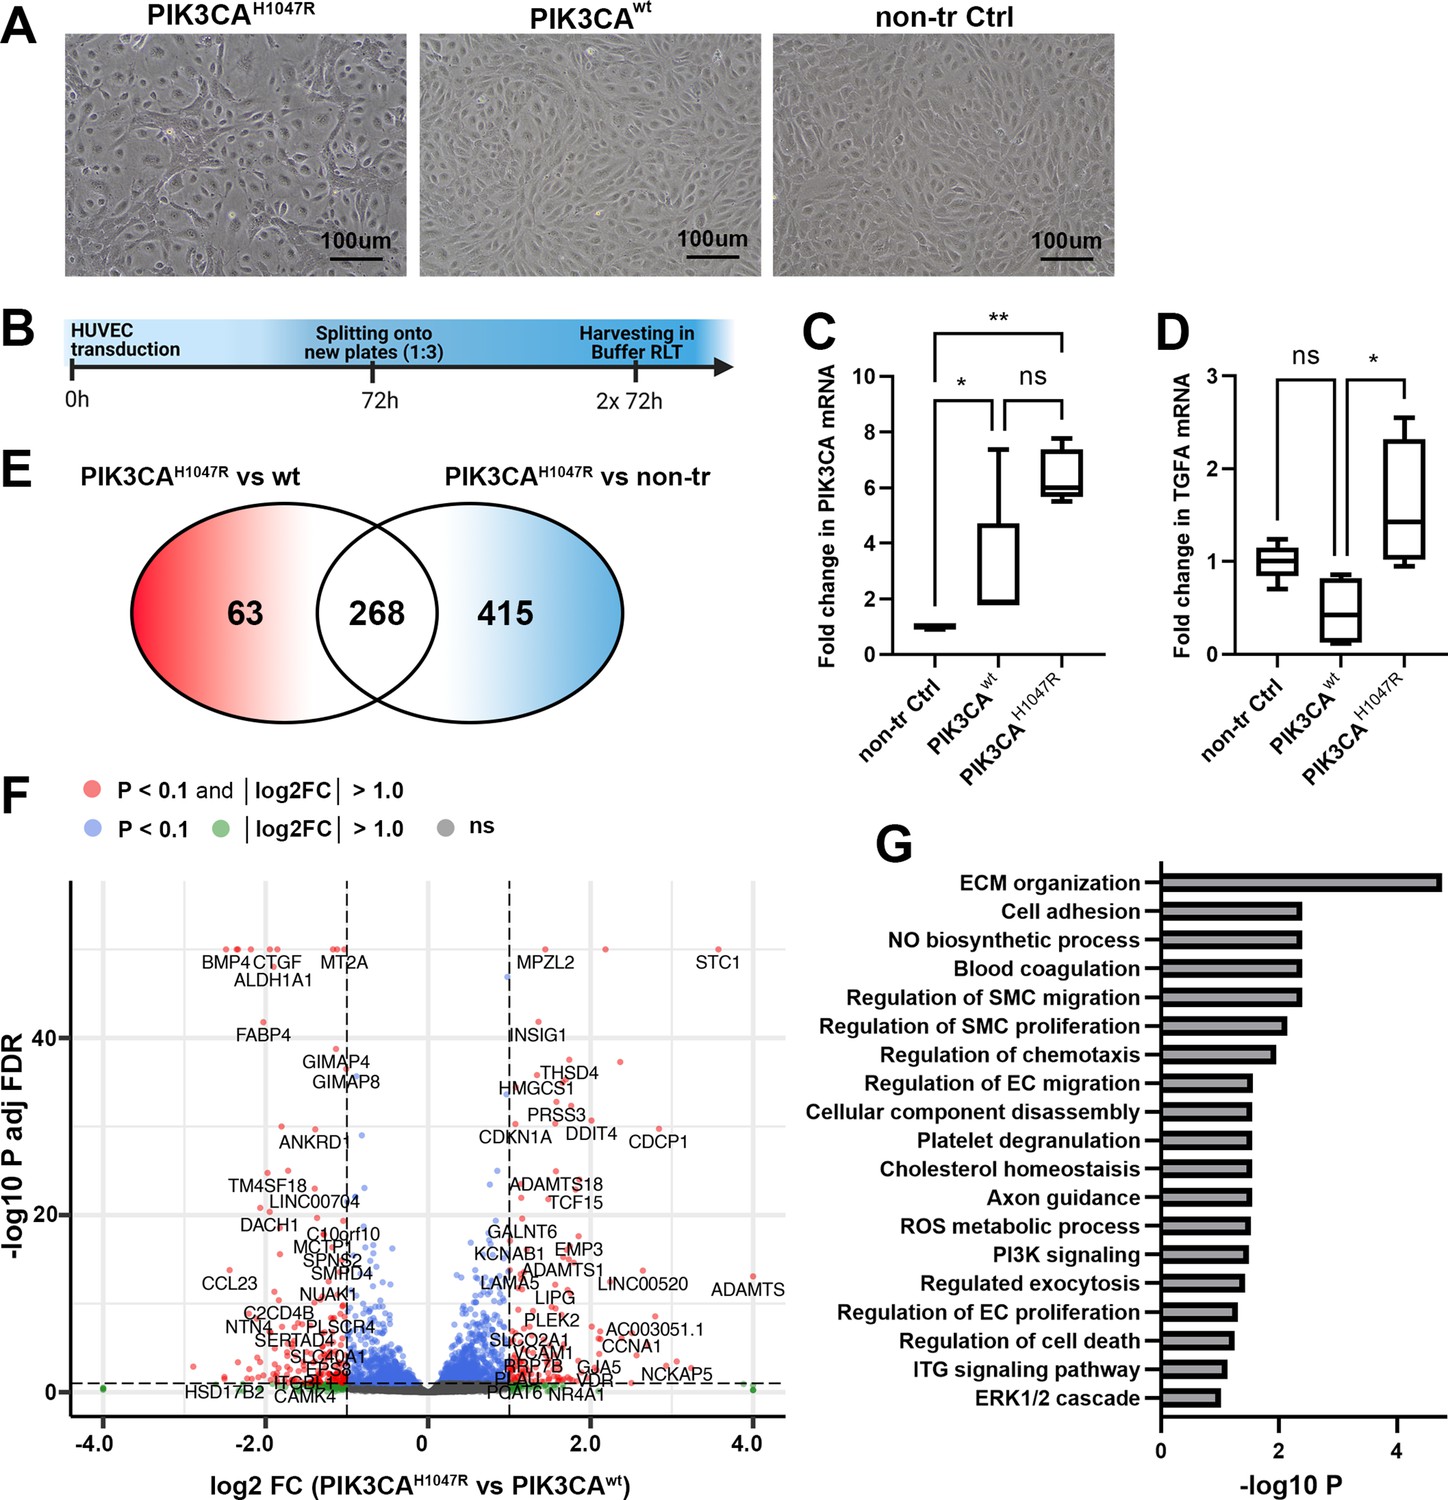
Oncogenic PIK3CAH1047R induces morphological and transcriptional changes in transduced ECs.
(A) In-line with previous publications (Limaye et al., 2015), expression of oncogenic PIK3CAH1047R induced morphological changes in HUVECs. Representative images of HUVECs transfected with a lentiviral vector (LV) encoding PIK3CAH1047R and PIK3CAwt (A), in comparison to the morphology of non-transduced HUVECs. Scale bars, 100 µm. (B) Schematics showing the preparation of cell culture samples for RNA-sequencing experiments to analyze transcriptional changes induced by PIK3CAH1047R in HUVECs. PIK3CAwt-transduced and non-transduced HUVECs were used as controls (n=4 in each group). (C–D) Significantly higher expression of PIK3CA mRNA was detected in cells expressing PIK3CAH1047R or PIK3CAwt than non-transduced cells, confirming that lentiviral transduction worked, and the vectors are functional (C), meanwhile transforming growth factor A (TGFA) mRNA was significantly induced in endothelial cells (ECs) expressing PIK3CAH1047R (D). Data are representative of two independent experiments done in 5–8 replicates and shown as mean and SEM. Kruskal-Wallis test with two-stage step-up method of Benjamini, Krieger and Yekutieli to control FDR (data not normally distributed). *p<0.05; **p<0.01. (E–G) RNA-sequencing revealed 268 genes that were differently expressed in PIK3CAH1047R than PIK3CAwt or non-transduced HUVECs, demonstrated using Venn diagram (E) and a Volcano plot (F). Biological processes detected by gene ontology analysis of differentially expressed genes (G).
Figure 3—figure supplement 2
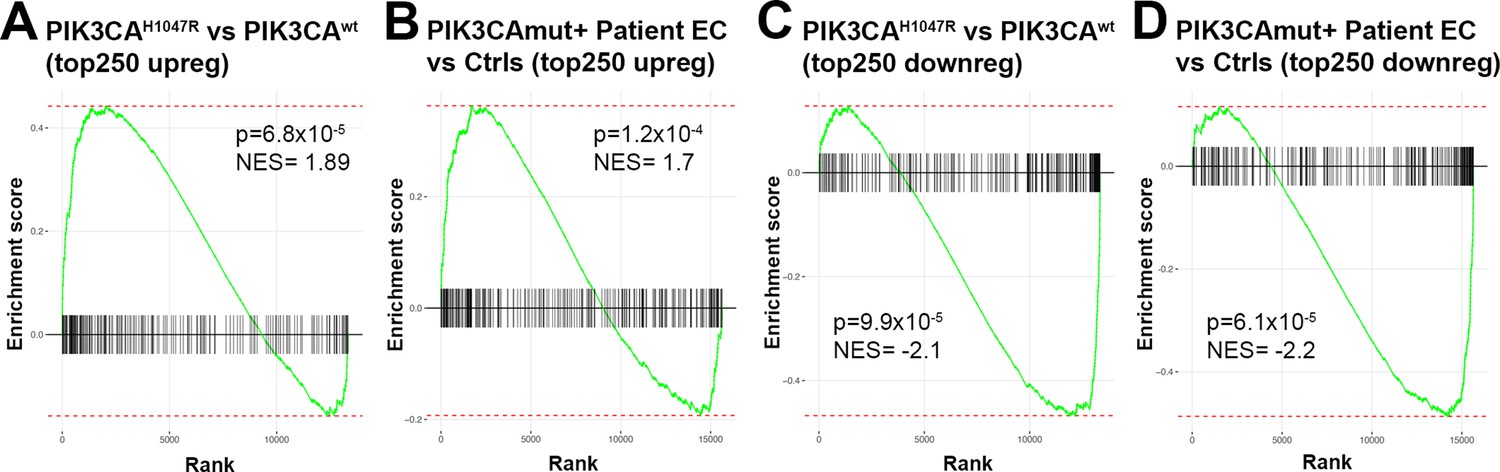
Comparison of bulk RNA-sequencing data of patient-derived endothelial cells and PIK3CAH1047R transduced primary endothelial cells.
Gene set enrichment analysis (GSEA) for RNAseq data from done for upregulated (A–B) or down-regulated (C–D) differentially expressed genes (DEGs) confirms that the RNA-seq data from HUVECs overexpressing PIK3CAH1047R (vs PIK3CAwt) is well in-line with the RNA-seq data from patient-derived endothelial cells (ECs) (vs control ECs); thus, justifying that PIK3CAH1047R (vs PIK3CAwt)-transduced ECs is a feasible model to be used in further experiments. In the GSEA analysis, top 250 DEGs upregulated in PIK3CAH1047R vs PIK3CAwt-transduced HUVECs were compared to the custom gene set consisting of top 250 DEGs upregulated in PIK3CAmut+ patient ECs vs control ECs (HUVEC, HsaVEC; all EC types from three donors) (A) and vice versa (B). Top 250 downregulated DEGs from both RNA-seq experiments were compared similarly, by using data from PIK3CAmut+ patient ECs vs control ECs as a query set in (C) and data from PIK3CAH1047R vs PIK3CAwt-transduced HUVECs as a query set in (D). p-values between 6.1 × 10⁻⁵ and 1.2 × 10⁻⁴ are considered as a high significance for correlation between the data sets, NES, and normalized enrichment score.
Figure 3—figure supplement 3
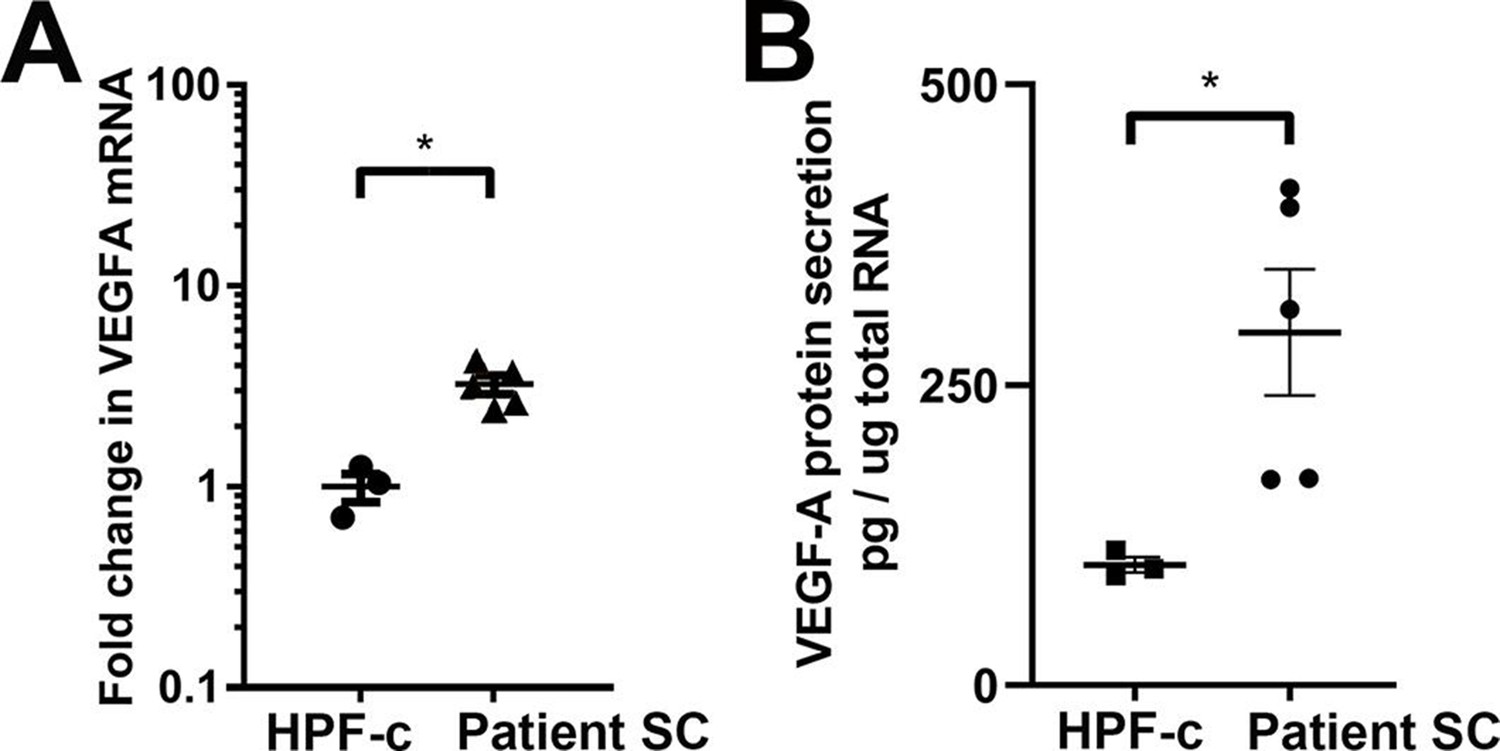
VEGF-A is upregulated and secreted from patient-derived stromal cells.
(A) RT-qPCR analysis of VEGFA mRNA expression in patient stromal cells (SCs) and control fibroblasts (SCs, n=6; HPF-c, n=3). Two-tailed Mann-Whitney U test (data not normally distributed). *, p<0.05. (B) VEGF-A secretion from patient SCs analyzed by ELISA (SC n=5; HPF-c n=3). Two-tailed unpaired t-test with Welch’s correction (data normally distributed but unequal variances). *p<0.05.
Figure 4 with 2 supplements
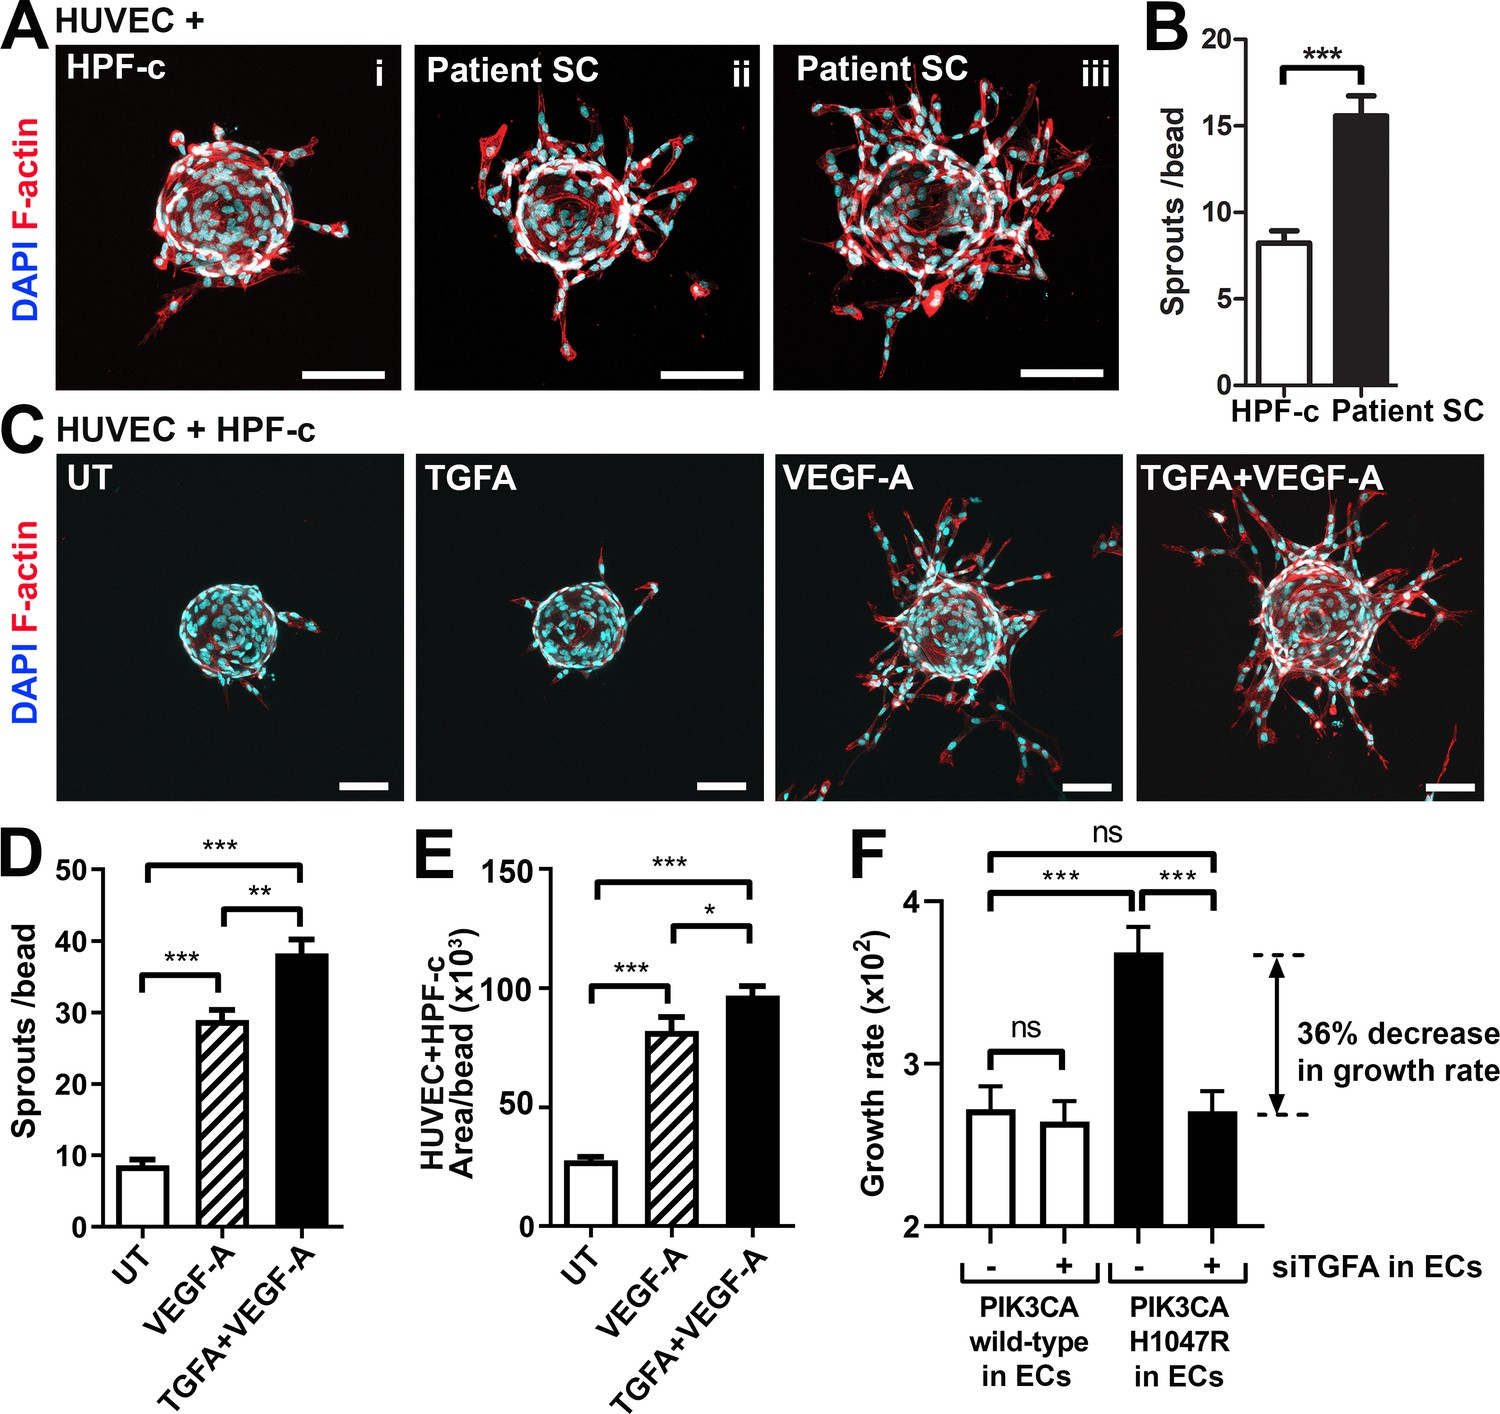
Patient stromal cells (SCs) and transforming growth factor A (TGFA) induce an angiogenic endothelial cell (EC) phenotype together with VEGF-A.
(A–B) Venous malformation (VM) patient SCs induce sprouting of genotypically normal ECs. HUVECs on collagen-coated beads were embedded into a fibrin gel and patient SCs or control HPF-c cells were put on top. Representative images are presented at d7. ECs are labeled with phalloidin (red). nuclei with DAPI (blue; A) The number of sprouts per bead in each condition is shown (B). Two independent experiments were done in triplicates. Two-tailed Mann-Whitney U test (data not normally distributed). *p<0.05. In all images, scale bar is 100 µm. (C–E) Fibrin bead assay with HUVECs and HPF-c cells shows increased EC sprouting after stimulation with rhVEGF-A and rhTGFA at d6. ECs are labeled with phalloidin (red), and nuclei with DAPI (blue; C). The number of sprouts per bead (D) or sprout area (E) in each condition was determined from confocal images by ImageJ (45 beads/group). 2 independent experiments were done in triplicates. Brown-Forsythe and Welch ANOVA with Dunnet T3 post-hoc test (D) or Kruskal-Wallis test with two-stage step-up method of Benjamini, Krieger and Yekutieli to control FDR (E). ***p<0.001. (F) Co-culture experiments with HPF-c and HUVEC cells showed an increased growth rate in wells with PIK3CAH1047R-expressing ECs in comparison to wells with ECs expressing PIK3CAwt. The response was abolished after inhibition of endogenous TGFA in ECs by specific siRNA, demonstrating the involvement of TGFA in PIK3CAH1047R-induced responses. Wells with siCtrl-transduced ECs (marked to be negative for siTGFA) were used as a control group in the experiments. Cellular growth was monitored using IncuCyte Live-Cell Imaging system. Data are presented as relative growth rate from two experiments done in triplicates. One-way ANOVA with Bonferroni or Sidac post-hoc test. ***p<0.001. In all data, mean and SEM are presented.
Figure 4—figure supplement 1
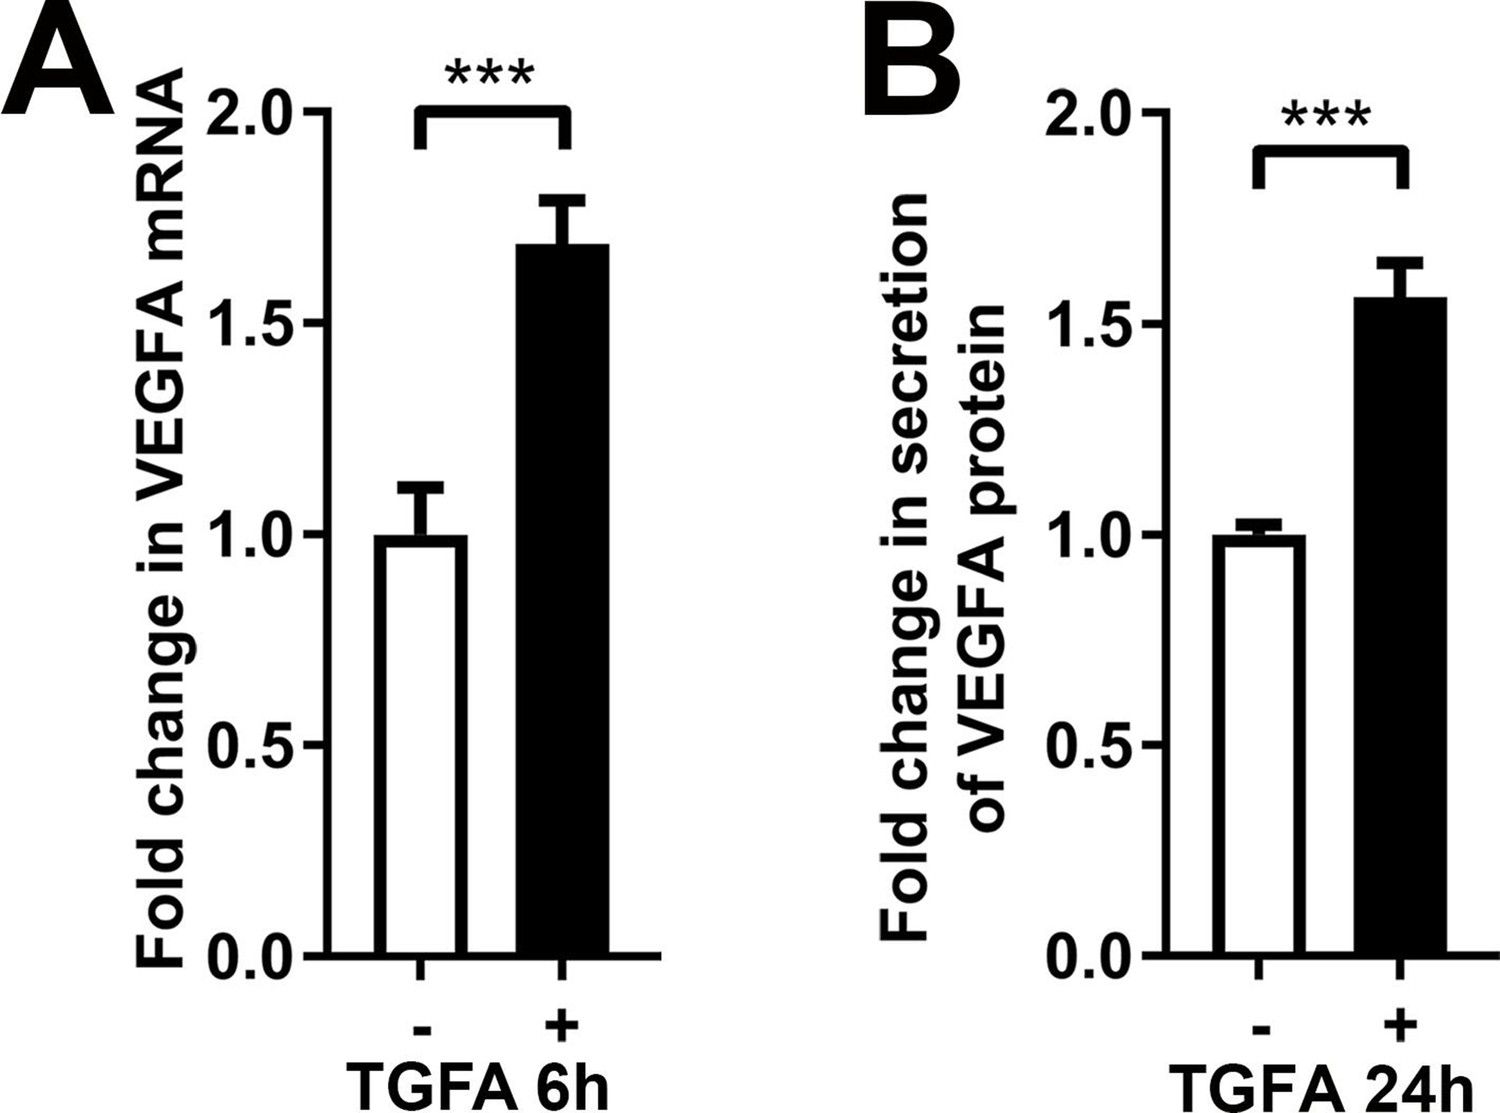
rhTGFA stimulation induces VEGFA in normal fibroblasts.
rhTGFA stimulation of HPF-c cells increased VEGFA mRNA expression (A, 6 hr) and VEGF-A protein secretion (B, 24 hr). The data is from three independent experiments done in triplicates. Two-tailed Mann-Whitney U test (data not normally distributed). ***p<0.001.
Figure 4—figure supplement 2
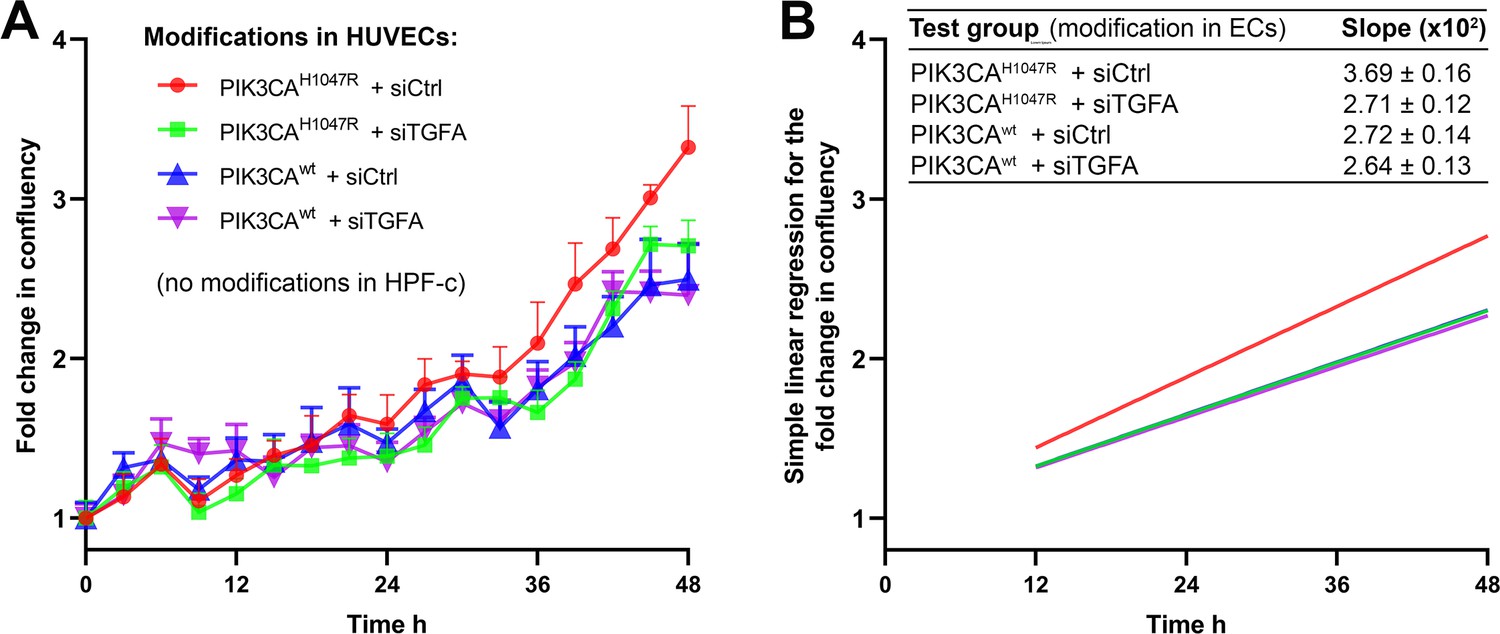
Quantification for the proliferation of cells in co-culture experiments combining endothelial cells (ECs) expressing PI3KCAH1047R or PI3KCAwt wt+/−TGFA and genetically normal HPF-c.
Knock-down of transforming growth factor A (TGFA) was performed using siRNA targeting to TGFA and non-targeting control siRNA as a control. Just prior to imaging, HUVECs and HPF-c were mixed at a ratio of 8:1 to induce crosstalk between the cell types in cultures without the external addition of growth factors. Cell growth was monitored using IncuCyte S3 Live-cell Imaging System for 48 hr in 3 hr intervals, four images/well. (A) Growth curves for each condition show fold change in the confluency of cells in relation to time. Data are presented as mean and SEM from two experiments done in triplicates. (B) Simple linear regression for cell growth in each condition. Regression lines were generated between time points 12–48 hr, as the first 12 hr were considered as a time when the cells settle on wells after seeding. Mean and SEM of the slopes of the regression lines, indicating the growth rate of the cells, are shown in the table.
Figure 5 with 1 supplement
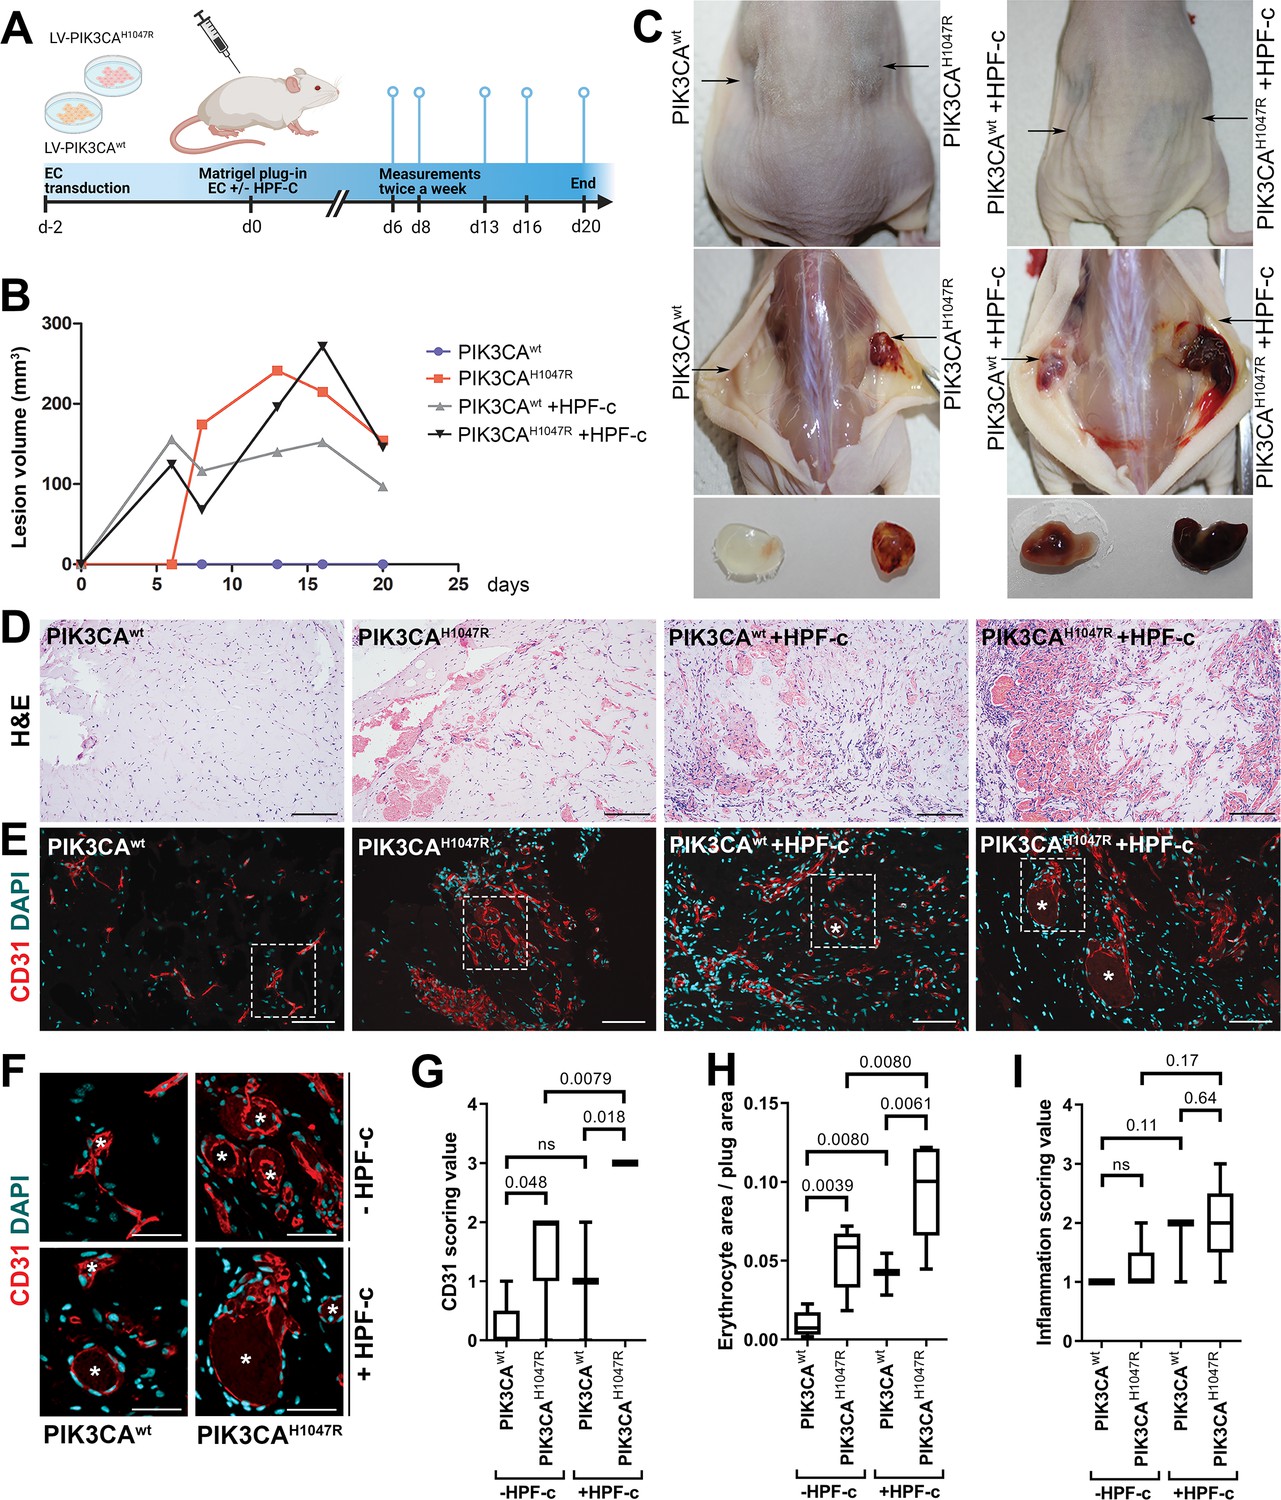
Fibroblasts induce vascularization in a mouse xenograft model for vascular lesions.
(A) Subcutaneous injection of matrigel with HUVECs transduced with PIK3CAwt or PIK3CAH1047R encoding lentivirus vectors, with or without primary fibroblasts, was performed in athymic Nude-Foxn1nu mice. A timeline of the animal experiment is presented. (B) Lesion volume measured by caliper from day 6 to day 20 (n=5 ECwt, n=5 ECH1047R, n=3 ECwt+ FB, n=5 ECH1047R+ FB). (C) Representative images of mice and dissected lesion explants on day 20. (D, E) Explant sections stained with hematoxylin and eosin (H&E; D) or EC marker CD31 (red) and DAPI (nuclei, blue; E). Scale bars, 200 µm, H&E; 100 µm, CD31. (F) Close-up of the vascular lumens detected in the explants with or without fibroblasts (CD31, red; DAPI, blue). Scale bars, 50 µm. (G) Scoring for vascularization of CD31-stained sections. The highest vascularization score was observed in the explants with HUVECs expressing PIK3CAH1047R and fibroblasts. (H, I) Quantification of erythrocyte area/plug (H) and inflammation scoring were (I) done on H&E-stained sections. Data are presented as mean and variation, and analyzed using (G, I) two-tailed Mann-Whitney U test (to compare scoring between each 2 groups) or (H) Brown-Forsythe and Welch ANOVA with two-stage step-up method of Benjamini, Krieger and Yekutieli to control FDR. Exact p-values are presented and *p<0.05 considered as statistically significant difference.
Figure 5—figure supplement 1
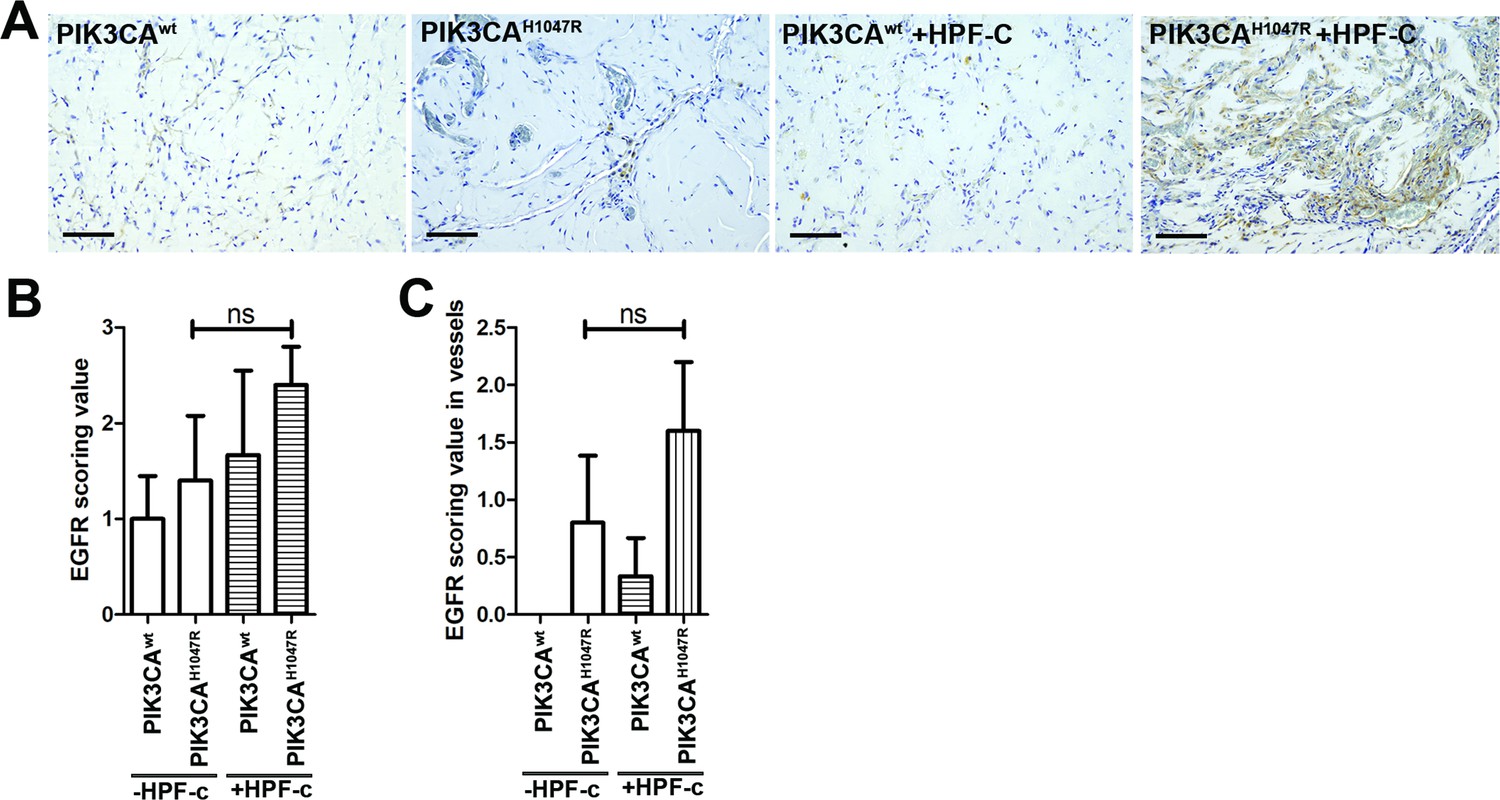
EGFR expression in mouse xenograft sections.
Subcutaneous injection of matrigel with HUVECs transfected with wt or PIK3CAH1047R expressing lentivirus vectors with/without primary fibroblasts was performed in athymic Nude-Foxn1nu mice. (A) Explant sections stained with epidermal growth factor receptor (EGFR) antibody. Scale bars, 100 µm. (B–C) EGFR expression was scored in the explants in the lesion area (B) and in vascular structures (C). Two-tailed Mann-Whitney U test. ns, not significant difference.
Figure 6
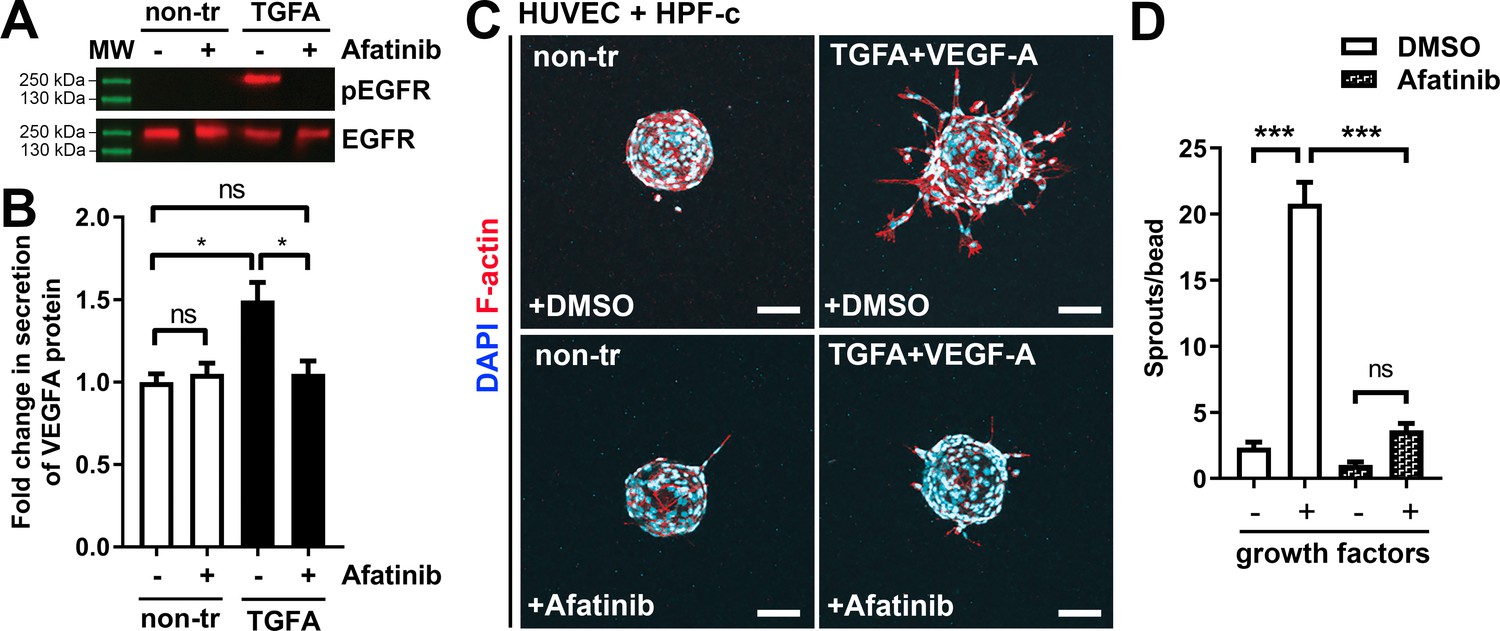
Afatinib reduces VEGF-A secretion, angiogenesis, and lesion size.
(A) Afatinib decreased EGFR/ErbB1-phosphorylation in rhTGFA-stimulated HPF-c cells. Total epidermal growth factor receptor (EGFR) was used to control equal loading of the samples. (B) VEGF secretion measured by ELISA from rhTGFA-stimulated control fibroblasts (HPF-c) with or without afatinib treatment. Two independent experiments done in triplicates are presented as mean and SEM. Brown-Forsythe and Welch ANOVA with Dunnet T3 post-hoc test. **p<0.01. (C, D) In the fibrin bead assay with HUVECs and HPF-c, afatinib inhibited endothelial cell (EC) sprouting induced by co-stimulation with rhVEGF-A and rhTGFA. Representative images of each group are presented at d7 (C) ECs are labeled with phalloidin (red) and nuclei with DAPI (blue). Scale bars, 100 µm. Quantitative analysis for the number of sprouts per bead (D) was performed with ImageJ software (30 beads/group). Afatinib treatment was started at d3 after HUVECs had already formed angiogenic sprouts. The data from two independent experiments done in triplicates are presented as mean and SEM. One-way ANOVA with Bonferroni post-hoc test. *p<0.05; ***p<0.001.
-
Figure 6—source data 1
Raw data for western blot images.
- https://cdn.elifesciences.org/articles/82543/elife-82543-fig6-data1-v2.zip
Figure 7
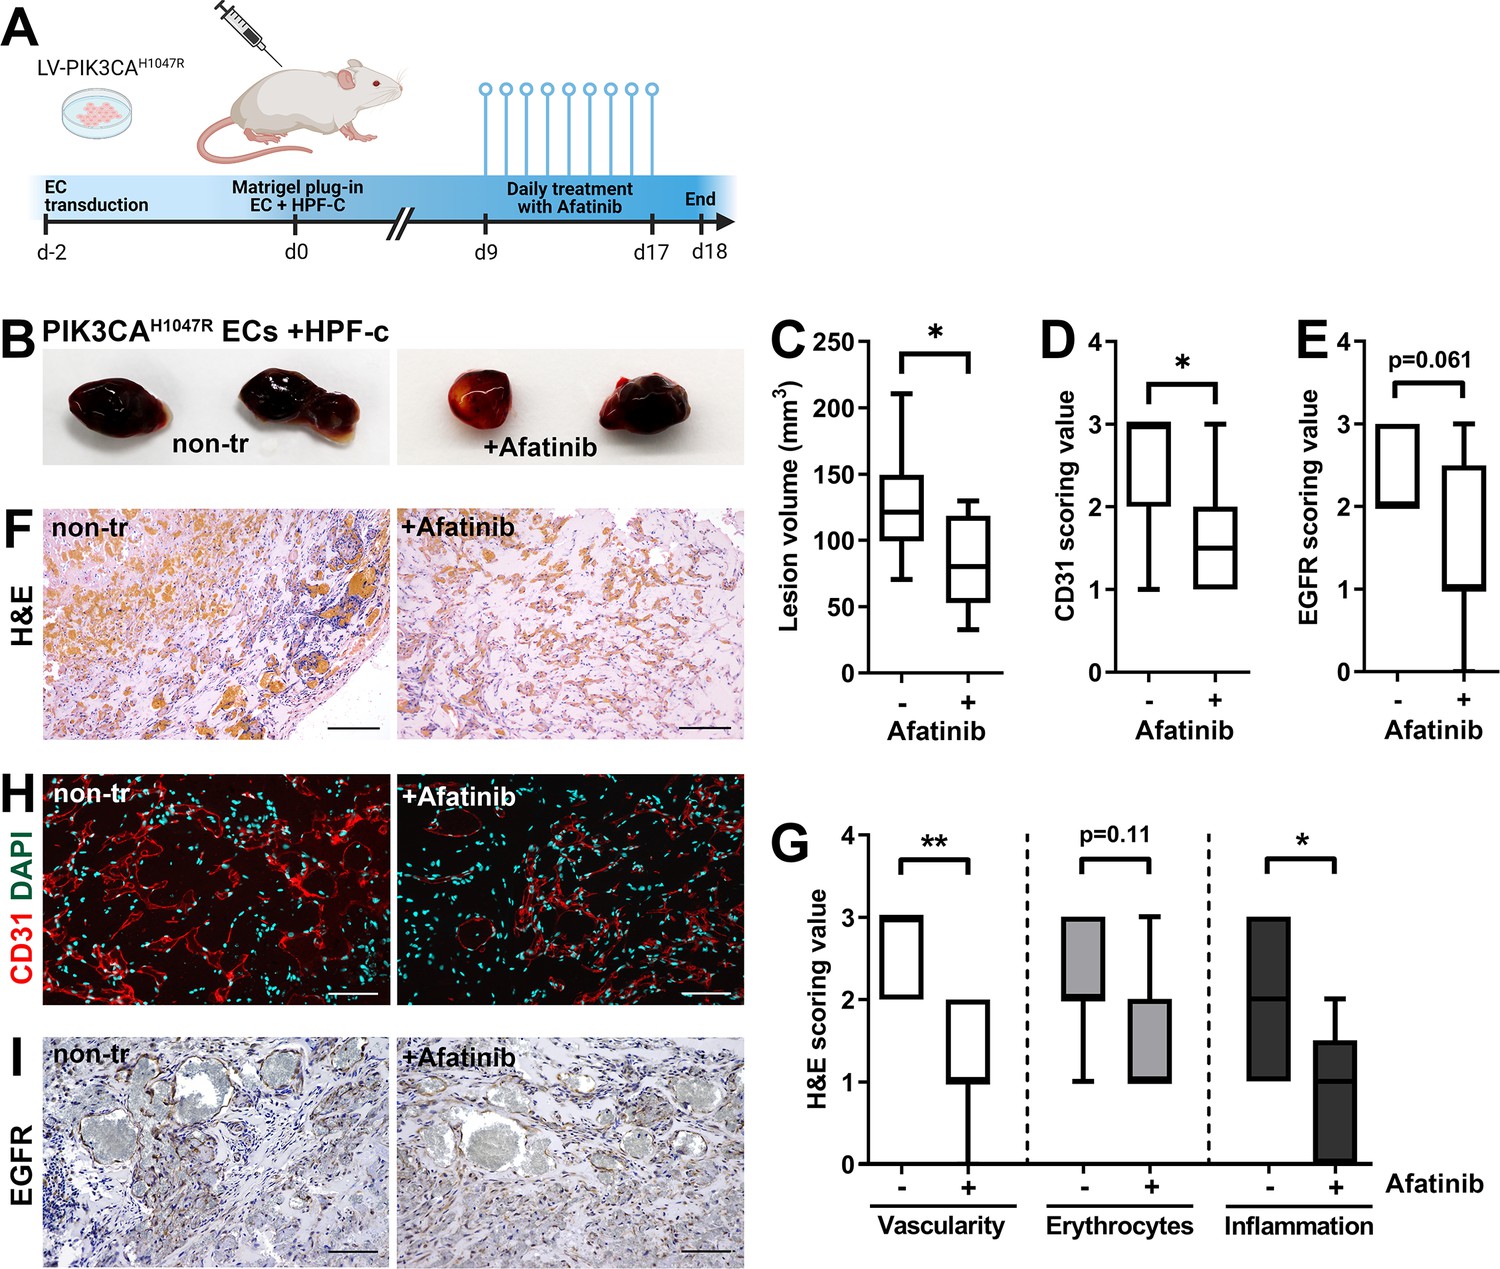
Afatinib reduces lesion size in matrigel plug-in assay.
Subcutaneous injection of matrigel with HUVECs transfected with PIK3CAH1047R expressing lentivirus vectors with primary fibroblasts was performed in athymic Nude-Foxn1nu mice. After lesions reached 200 µm3 in size, afatinib treatment was started for 9 days (25 mg/kg, p.o., daily). (A) A timeline of the animal experiment is presented. (B) Representative images of dissected explants on day 18. (C) Lesion volume measured from dissected explants at d18 (n=7 untreated, n=9 afatinib treated). (D) Scoring for vascularization done for sections stained for CD31 (H, n=7 untreated, n=9 afatinib treated). (E) Scoring for epidermal growth factor receptor (EGFR) expression (I); n=6 untreated, n=9 afatinib treated. (F,H) Explant sections stained with hematoxylin and eosin (H&E; F) or endothelial cell (EC) marker CD31 (red) and DAPI (nuclei, blue; H). Scale bars, 200 µm, H&E; 100 µm, CD31. (G) Scoring for vascularization, erythrocytes, and inflammatory cells done on H&E-stained sections. (I) Explant sections stained with EGFR. Scale bars, 100 µm. Statistical analysis was performed using (C) two-tailed unpaired t-test with Welch’s correction or (D, E) two-tailed Mann-Whitney U test. *p<0.05, and “”p<0.01.
Figure 8
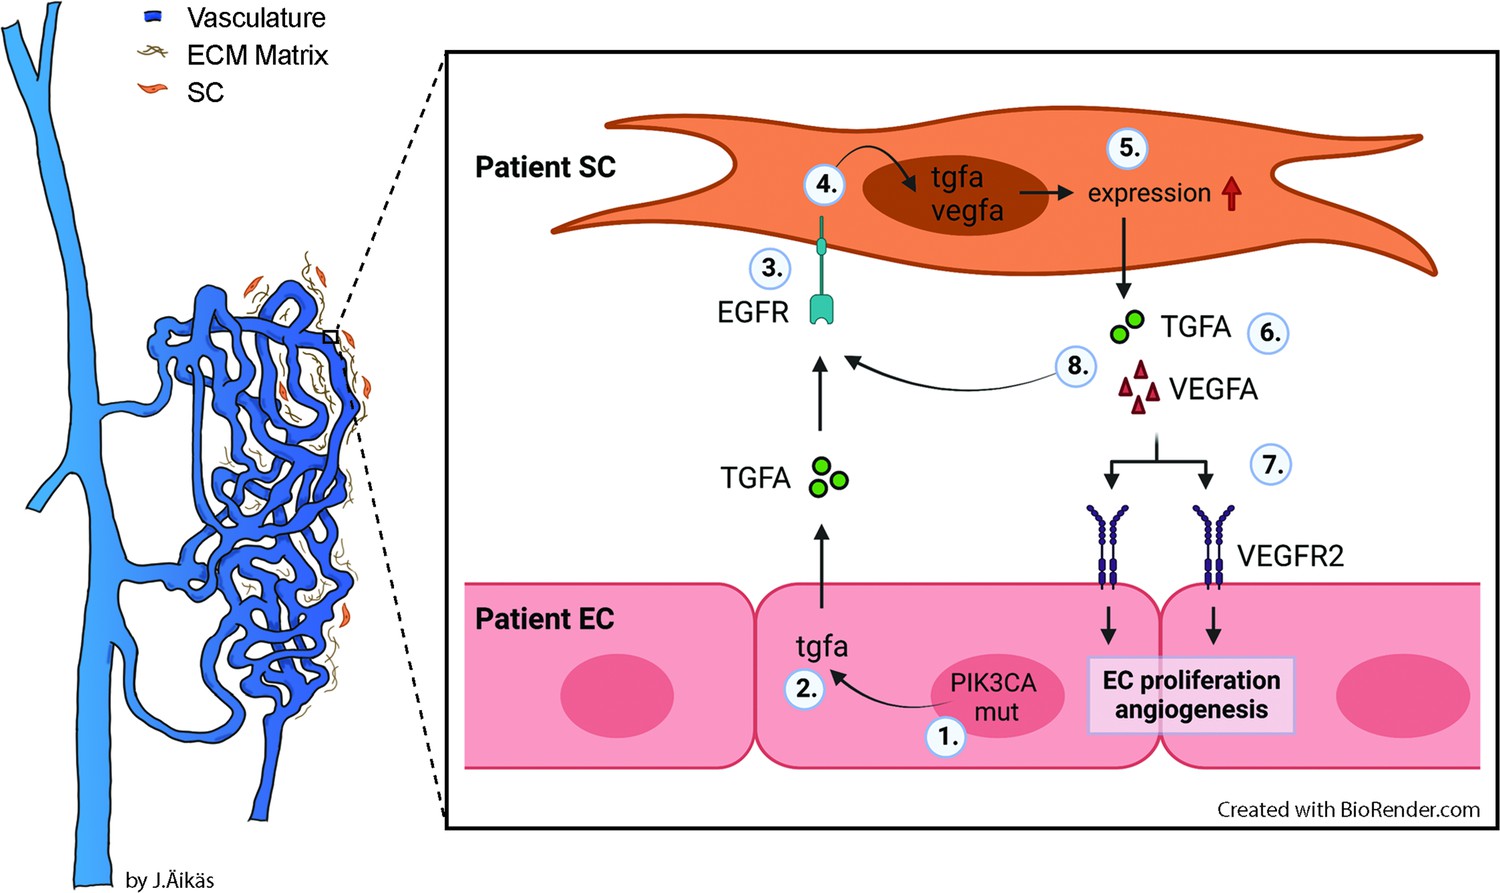
Proposed model for the paracrine signaling of TGFA/VEGF-A in the vascular lesion.
Schematic illustration showing the general structure of venous malformation or angiomatosis of soft tissue. Pathological vasculature in the lesion (dark blue) is surrounded by a disorganized extracellular matrix (ECM) and intervascular stromal cells (SCs, orange). High magnification from the area close to the vessel wall demonstrates the proposed model for crosstalk between endothelial cells (ECs) and SCs. A mutation in phosphatidylinositol-4,5-biphosphate 3-kinase catalytic subunit alpha (PIK3CA) gene (1) or other processes promote ECs to express the high level of transforming growth factor A (TGFA) (2). TGFA binds to epithelial growth factor receptor (EGFR) on the surface of adjacent SCs (3). Activated EGFR-downstream signaling (4) promotes elevated expression of vascular endothelial growth factor (VEGF)-A in SCs and increases the expression of TGFA (5). VEGF-A secreted from SCs (6) binds to VEGF-receptor-2 (VEGFR2) on the surface of ECs (7) and together with TGFA activates angiogenic EC phenotype. TGFA secreted from the SCs (8), can further activate EGFR and its downstream signaling.
Tables
Table 1
Demographics of patients with AST patients.
| Patient | Gender | Age | Pathological diagnosis | # of lesions | Tissue* | Location | Somatic mutation(Fractional abundance §) |
|---|---|---|---|---|---|---|---|
| 1 †, ‡ | F | 11 | AST | 1 | im | calf | ND |
| 2 †,‡ | M | 34 | AST | 1 | im | shoulder | PI3KCA p.E542K (WTL: 10.25; EC: 50.65; SC: none) |
| 3 †,† | M | 16 | AST | 1 | im | calf | PI3KCA p.H1047R (WTL: 18.80; EC: 44.00; SC: none) |
| 4 †, ‡ | F | 16 | AST | 1 | sc | shin | PI3KCA p.H1047L (WTL: 8.30; EC: 48.95; SC: none) |
| 5† | F | 17 | AST | 1 | im | back | ND |
| 6 | M | 34 | AST | 1 | im | thigh | ND |
| 7 | M | 17 | AST | 1 | im | thigh | PI3KCA p.E542K (WTL: 7.32) |
| 8 | F | 31 | AST | 1 | im | thigh | PI3KCA p.H1047R (WTL: 5.07) |
| 9 | F | 22 | AST | 1 | im | thigh | PI3KCA p.H1047R (WTL: 13.10) |
| 10 | F | 13 | AST | 1 | im, sc | foot | PI3KCA p.E545K (WTL: 11.65) |
| 11 | M | 19 | AST | 1 | im | thigh | PI3KCA p.H1047R (WTL: 8.89) |
| 12 | M | 13 | AST | 1 | im, sc | ankle | PI3KCA p.H1047R (WTL: 12.60) |
| 13 | F | 23 | AST | 1 | im | calf | PIK3CA p.Y644H ¶ |
| 14 | F | 41 | AST | 1 | sc | shin | ND |
| 15 | F | 25 | AST | 1 | im | foot | PI3KCA p.E545K (WTL: 8.93) |
| 16 | F | 16 | AST | 1 | im, sc | ankle | PI3KCA p.H1047R (WTL: 5.98) |
| 17 | F | 46 | AST | 1 | im, sc | back | PI3KCA p.E542K (WTL: 9.83) |
| 18 | F | 18 | AST | 1 | im, sc | ankle | PI3KCA p.E545K (WTL: 11.35) |
| 19 | F | 13 | AST | 1 | im | calf | ND |
| 20 | F | 24 | AST | 1 | im, sm | thigh | PI3KCA p.E542K (WTL: 5.64) |
-
*
Tissue: im, intramuscular; sc, subcutaneous; sm, synovial membrane.
-
†
ECs and SCs isolated for cell experiments.
-
‡
used in RNA-seq experiment.
-
§
Fractional abundance of the mutation in WTL, whole tissue lysate; EC, endothelial cells; SC, intervascular stromal cells; ND, not detected.
-
¶
mutation detected by whole-exome sequencing.
Table 2
Demographics of patients with VM.
| Patient | Gender | Age | Pathological diagnosis | # of lesions | Tissue* | Location | Somatic mutation(Fractional abundance in whole tissue lysate) § | |
|---|---|---|---|---|---|---|---|---|
| 21 | M | 34 | VM | 1 | im | thigh | TEK p.Y1108X ¶ | |
| 22 ,†, ‡ | F | 77 | VM | 6 | sc | neck, fossa cubitalis, chest, hip, big toe | TEK p.L914F (5.63) | |
| 23 | M | 40 | VM | 2 | im | chest, back | ND | |
| 24 | F | 69 | VM | 3 | im, sc | forearm **, hand | TEK p.L914F (10.01) | |
| 25 | M | 24 | VM | 2 | sc | ankle, sole | PI3KCA p.H1047L (3.83) | |
| 26 | M | 14 | VM | 1 | sc | lip | TEK p.L914F (16.31) | |
| 27 | F | 39 | VM | 1 | im | chest | ND | |
| 28 | M | 28 | VM | 1 | sc | clavicle | TEK p.L914F (5.95) | |
| 29 | M | 46 | VM | 1 | sc | shin | ND | |
| 30 | M | 31 | VM | 1 | sc | knee | TEK p.L914F (10.60) | |
| 31 | F | 21 | VM | 1 | im, sc, sm | knee | ND | |
| 32 | M | 16 | VM | 1 | im, sc, sm | thigh, knee | ND | |
| 33 | M | 9 | VM | 1 | sc, sm | knee | ND | |
| 34 | F | 35 | VM | 1 | im, sc | blade | TEK p.L914F (12.10) | |
| 35 | F | 16 | VM | 1 | sc | ankle | PI3KCA p.E545K (4.34) | |
| 36 | M | 21 | VM/AST | 1 | im | upper arm | PI3KCA p.H1047R (3.91) | |
| 37 | F | 41 | VM/AST | 1 | sc | ankle | KRAS p.Q61R ¶ | |
| 38 | F | 25 | VM/AST | 1 | sc | calf, leg | PI3KCA p.H1047L (5.23) | |
-
*
Tissue: im, intramuscular; sc, subcutaneous; sm, synovial membrane.
-
†
ECs and SCs isolated for cell experiments.
-
‡
used in RNA-seq experiment.
-
§
ND, not detected.
-
¶
mutation detected by whole-exome sequencing.
-
**
The patient had multiple lesions but only a lesion located in the forearm was operated.
Table 3
Selected cell signaling pathways regulated in patient-derived ECs.
| GO | Term | Genes* |
|---|---|---|
| GO:0038127 | ERBB signaling pathway | PRKCE,TNRC6C,PDE1A,AREG, RPS27A,TGFA,KITLG,ERBB2, PTK2B,DGKD,PRKAR2B,NRG1, RPS6KA5,PRKACB |
| GO:0043122 | regulation of I-kappaB kinase/ NF-kappaB signaling | GREM1,LURAP1,BIRC3,TNFAIP3, S100A4,MALT1,LITAF,PRKCE, LPAR1,C18orf32,ZFAND6,RPS27A, PLK2,TLR4,F2RL1,CASP1,S100A13 |
| GO:0008277 | regulation of G-protein coupled receptor protein signaling pathway | RGS4,RGS9,DYNLT1,RGS11,CXCL8,RGS10,RGS20,RGS5,RAMP2,RGS7, PLCB1,ADRBK2 |
| GO:0043410 | positive regulation of MAPK cascade | PAK1,MAP4K2,SEMA4C,TGFA, GADD45G,KSR2,ERBB2,NENF, PLCB1,TPD52L1,GLIPR2,ICAM1, CD74,PRKCE,LPAR1,PDCD10,INSR, IGF1R,GADD45A,RPS27A,PTK2B, KITLG,HGF,F2RL1,TLR4,PIK3CG, ZEB2,EPGN |
| GO:0046328 | regulation of JNK cascade | PAK1,MAP4K2,GADD45A,IGF1R, GADD45G,TNXB,PTK2B,CBS,SFRP1,PLCB1,F2RL1,TLR4,TPD52L1,ZEB2 |
| GO:0007219 | Notch signaling pathway | HEY2,NOTCH1,TNRC6C,RBX1, TMEM100,LFNG,RPS27A,E2F1, DTX3,NOTCH2,MESP1,DNER, FOXC1,SNAI2,HDAC9 |
-
*
ErbB pathway receptors and ligands are marked in bold.
Table 4
Taqman assays used in qRT-PCR analysis.
| Gene | Description | Assay ID |
|---|---|---|
| GAPDH | Glyceraldehyde-3-phosphate dehydrogenase | 4352934E |
| B2M | Beta-2-microglobulin | Hs00187842_m1 |
| TGFA | Transforming growth factor A [assay 1] | Hs00608187_m1 |
| TGFA | Transforming growth factor A [assay 2] | Hs00177401_m1 |
| TGFA | Transforming growth factor A [assay 3] | HsaCEP0053322 |
| ERBB1 | Protein tyrosine kinase ERBB1, epidermal growth factor receptor | Hs01076090_m1 |
| AREG | Amphiregulin | Hs00950669_m1 |
| NRG1 | Neuregulin 1 | Hs00247620_m1 |
| EPGN | Epithelial mitogen, epigen | Hs02385424_m1 |
| VEGF-A | Vascular endothelial growth factor A | Hs00900055_m1 |
| PIK3CA | Phosphatidylinositol-4,5-Bisphosphate 3-Kinase Catalytic Subunit-α | HsaCEP0050716 |
Appendix 1—key resources table
| Reagent type (species) or resource | Designation | Source or reference | Identifiers | Additional information |
|---|---|---|---|---|
| Strain, strain background (Mus musculus, female) | Hsd: Athymic Nude-Foxn1nu | Envigo | Autosomal recessive mutation on nu locus on chromosome 11; T-cell deficient; accepts xenograft transplantation. | |
| Cell line (Homo sapiens) | HUVEC | This paper | Umbilical cord endothelial cells isolated in house; see materials and methods section | |
| Cell line (Homo sapiens) | HSaVEC | PromoCell | # C-12231 | Saphenous vein endothelial cells |
| Cell line (Homo sapiens) | HPF-c | PromoCell | # C-12360 | Pulmonary fibroblast |
| Transfected construct (Homo sapiens) | LV-PIK3CA | This paper | PIK3CAwt | Lentiviral construct to transfect and express PIK3CA wild-type; produced using Addgene plasmid #116771 |
| Transfected construct (Homo sapiens) | LV-PIK3CA-H1047R | This paper | PIK3CAH1047R | Lentiviral construct to transfect and express PIK3CA with oncogenic point mutation on p.H1047R; produced using Addgene plasmid #116500 |
| Biological sample (Homo sapiens) | Patients’ AST/VM tissue | This paper | Patients’ lesion | Tissue material collected during surgery; see materials and methods section |
| Biological sample (Homo sapiens) | Endothelial cells from patients’ AST/VM | This paper | Patient EC (CD31+) | Freshly isolated from AST/VM tissue; see materials and methods section |
| Biological sample (Homo sapiens) | Stromal cells from patients’ AST/VM | This paper | Patient SC (CD31-/ Vimentin+) | Freshly isolated from AST/VM tissue; see materials and methods section |
| Recombinant DNA reagent | pHAGE-PIK3CA | Addgene | # 116771 | Plasmid encoding PIK3CA wild-type |
| Recombinant DNA reagent | pHAGE-PIK3CA-H1047R | Addgene | # 116500 | Plasmid encoding PIK3CA with oncogenic point mutation on p.H1047R |
| Sequence-based reagent | siRNA: nontargeting control #1 | Thermo Fisher Scientific | # 4390844 | Silencer Select siRNA |
| Sequence-based reagent | siRNA: nontargeting control #2 | Thermo Fisher Scientific | # 4390847 | Silencer Select siRNA |
| Sequence-based reagent | siRNA: targeting to human TGFA | Thermo Fisher Scientific | Assay ID: s14053 | Silencer select siRNA |
| Sequence-based reagent | PrimePCR ddPCR mutation detection assays for PIK3CA c.3140A>G (p.H1047R) | Bio-Rad | Assay IDs: dHsaMDM5225715851 (mut) and dHsaMDW5225715853 (wt) | |
| Sequence-based reagent | PrimePCR ddPCR mutation detection assays for PIK3CA c.3140A>T (p.H1047L) | Bio-Rad | Assay IDs: dHsaMDM2916088171 (mut) and dHsaMDW2916088173 (wt) | |
| sequence-based reagent | PrimePCR ddPCR mutation detection assays for PIK3CA c.1633G>A (p.E545K) | Bio-Rad | Assay IDs: dHsaMDM9869636521 (mut) and dHsaMDW9869636523 (wt) | |
| sequence-based reagent | PrimePCR ddPCR mutation detection assays for PIK3CA c.1624G>A (p.E542K) | Bio-Rad | Assay IDs: dHsaMDM3010833491 (mut) and dHsaMDW3010833493 (wt) | |
| sequence-based reagent | Custom-design Taqman SNP Genotyping assays for TEK c.2740C>T (p.L914F) | Thermo Fisher Scientific | # 4331349 | fwd 5’-CTTCCCTCCAGGCTACTT-3’, rev 5’-AATGCTGGGTCCGTCT-3’, reporter 1 (HEX) 5’-CTTGCGAAGGAAGTCCAGAAGGTTTC-3’, and reporter 2 (FAM) 5’- CTTGCGAAAGAAGTCCAGAAGGTTTC-3’ |
| peptide, recombinant protein | rhTGFA | Sigma-Aldrich | # GF313 | |
| commercial assay or kit | Human CD31 microbead kit | Miltenyi Biotec | # 130-091-935 | |
| commercial assay or kit | RNeasy Mini Kit | Qiagen | # 74106 | |
| commercial assay or kit | Human Quantikine TGFA ELISA | R&D Systems | # DTGA00 | |
| commercial assay or kit | Human Quantikine VEGF ELISA | R&D Systems | # DVE00 | |
| chemical compound, drug | Afatinib | MedChem Express | # HY-10261 | |
| software, algorithm | SproutAngio | https://github.com/mbbio/SproutAngio (Beter et al., 2023) | Open access tool for quantitation |
Additional files
-
Supplementary file 1
NGS experiments.
- https://cdn.elifesciences.org/articles/82543/elife-82543-supp1-v2.xlsx
-
Supplementary file 2
gBlock gene fragments.
- https://cdn.elifesciences.org/articles/82543/elife-82543-supp2-v2.docx
-
MDAR checklist
- https://cdn.elifesciences.org/articles/82543/elife-82543-mdarchecklist1-v2.docx
Download links
A two-part list of links to download the article, or parts of the article, in various formats.
Downloads (link to download the article as PDF)
Open citations (links to open the citations from this article in various online reference manager services)
Cite this article (links to download the citations from this article in formats compatible with various reference manager tools)
ErbB signaling is a potential therapeutic target for vascular lesions with fibrous component
eLife 12:e82543.
https://doi.org/10.7554/eLife.82543


