Timeline of changes in spike conformational dynamics in emergent SARS-CoV-2 variants reveal progressive stabilization of trimer stalk with altered NTD dynamics
- Department of Chemistry, Pennsylvania State University, United States
- Division of Biology and Biological Engineering, California Institute of Technology, United States
- Department of Biochemistry and Molecular Biology, Pennsylvania State University, United States
- The Huck Institutes of the Life Sciences, Pennsylvania State University, United States
Figures
Figure 1
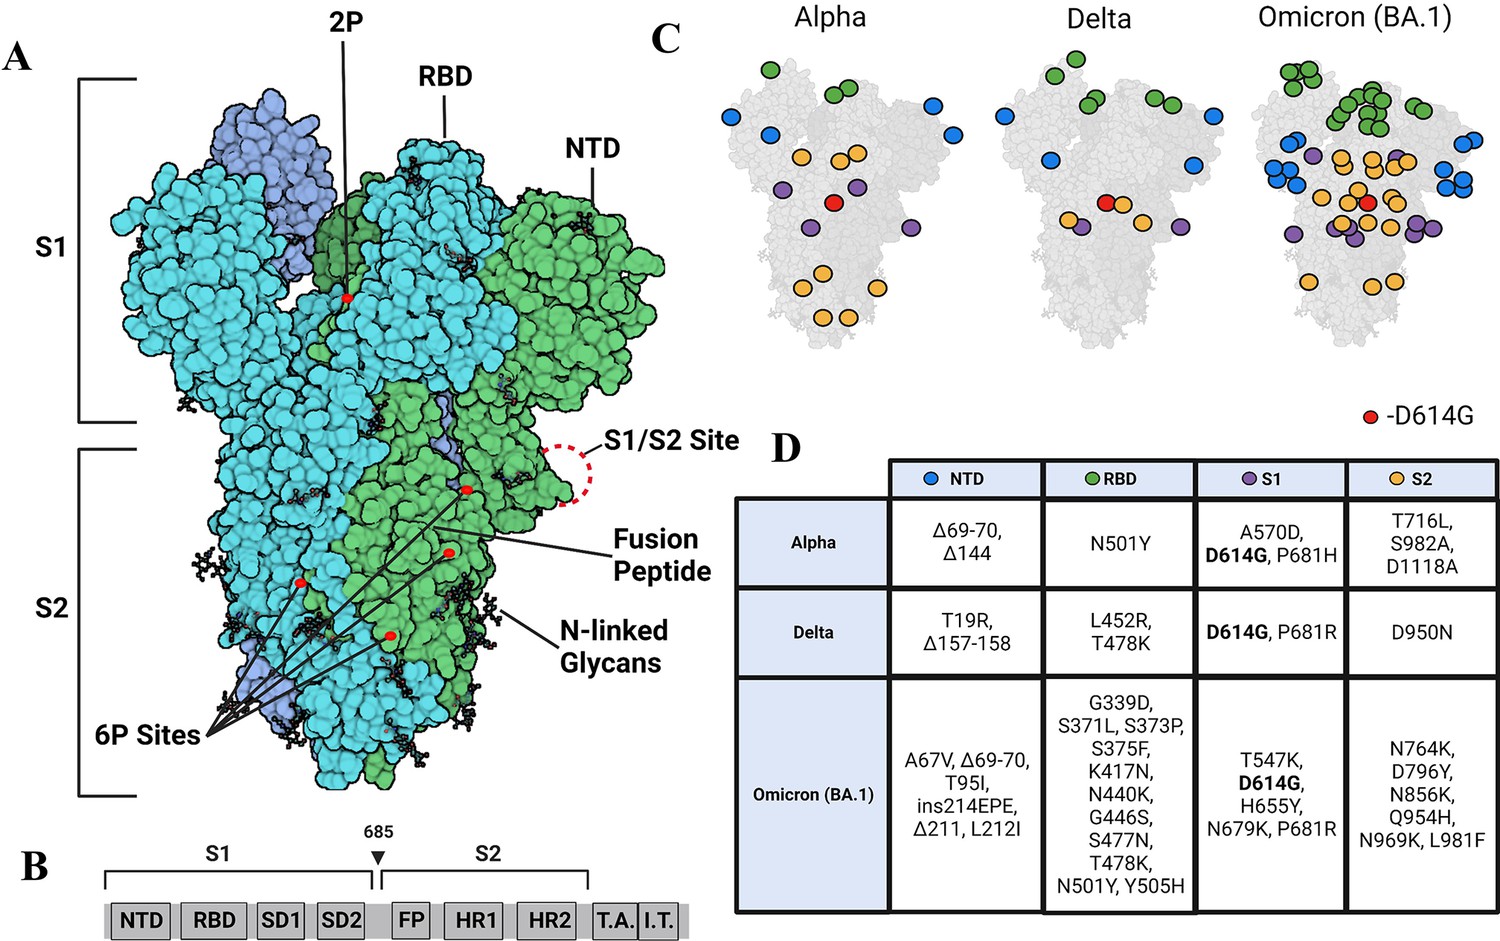
Strimer modifications and variant mutations.
(A) The Spike (S) protein trimer (PDB:6VSB) (protomers in dark blue, teal, and green) with receptor-binding domain (RBD), N-terminal domain (NTD), S1/S2 site, fusion peptide, 2P substitutions (985-986), additional 6P substitutions (817, 892, 899, 942), and glycans. (Image created in https://Biorender.com) (B) Sequence organization for SARS-CoV-2 S (NTD = N-terminal domain, RBD – receptor binding domain, SD1=subdomain 1, SD2=subdomain 2, FP = fusion peptide, HR1=heptad repeat 1, HR2=heptad repeat 2, T.A.=transmembrane domain, I.T.=intracellular domain). The brackets define the recombinant soluble S used in this study. Furin cleavage site (685) is indicated by arrowhead (C) Mutations in Alpha, Delta, and Omicron BA.1 S mapped onto the S structure. Mutations in the NTD, RBD, S1, and S2 domains are represented as blue, green, purple, and yellow dots, respectively, wherever a mutation can be visualized. (D) Mutations specific to Alpha, Delta, and Omicron BA.1 S variants.
-
Figure 1—source data 1
Mutations in S variants.
- https://cdn.elifesciences.org/articles/82584/elife-82584-fig1-data1-v2.xlsx
Figure 2 with 7 supplements
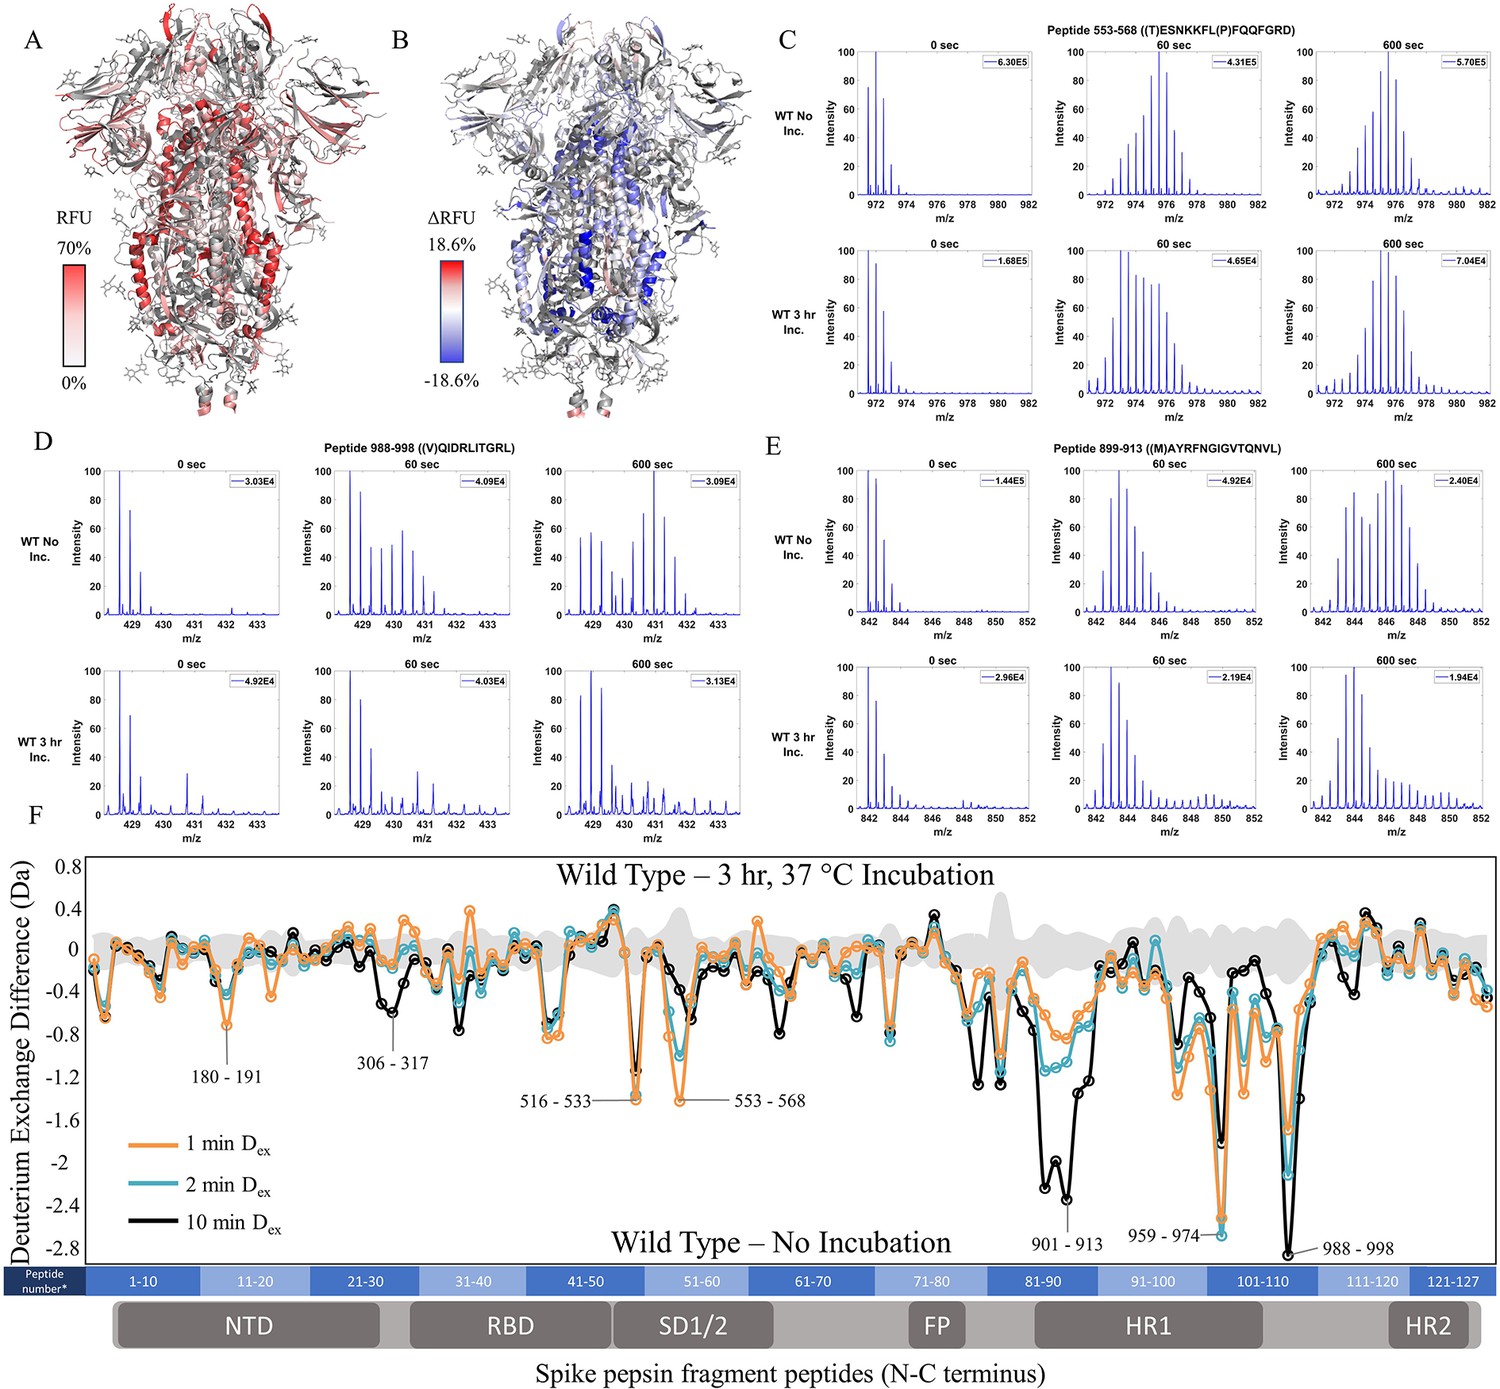
Prefusion conformation for wild-type (WT) spike (S) protein favored by 3 hr incubation at 37℃.
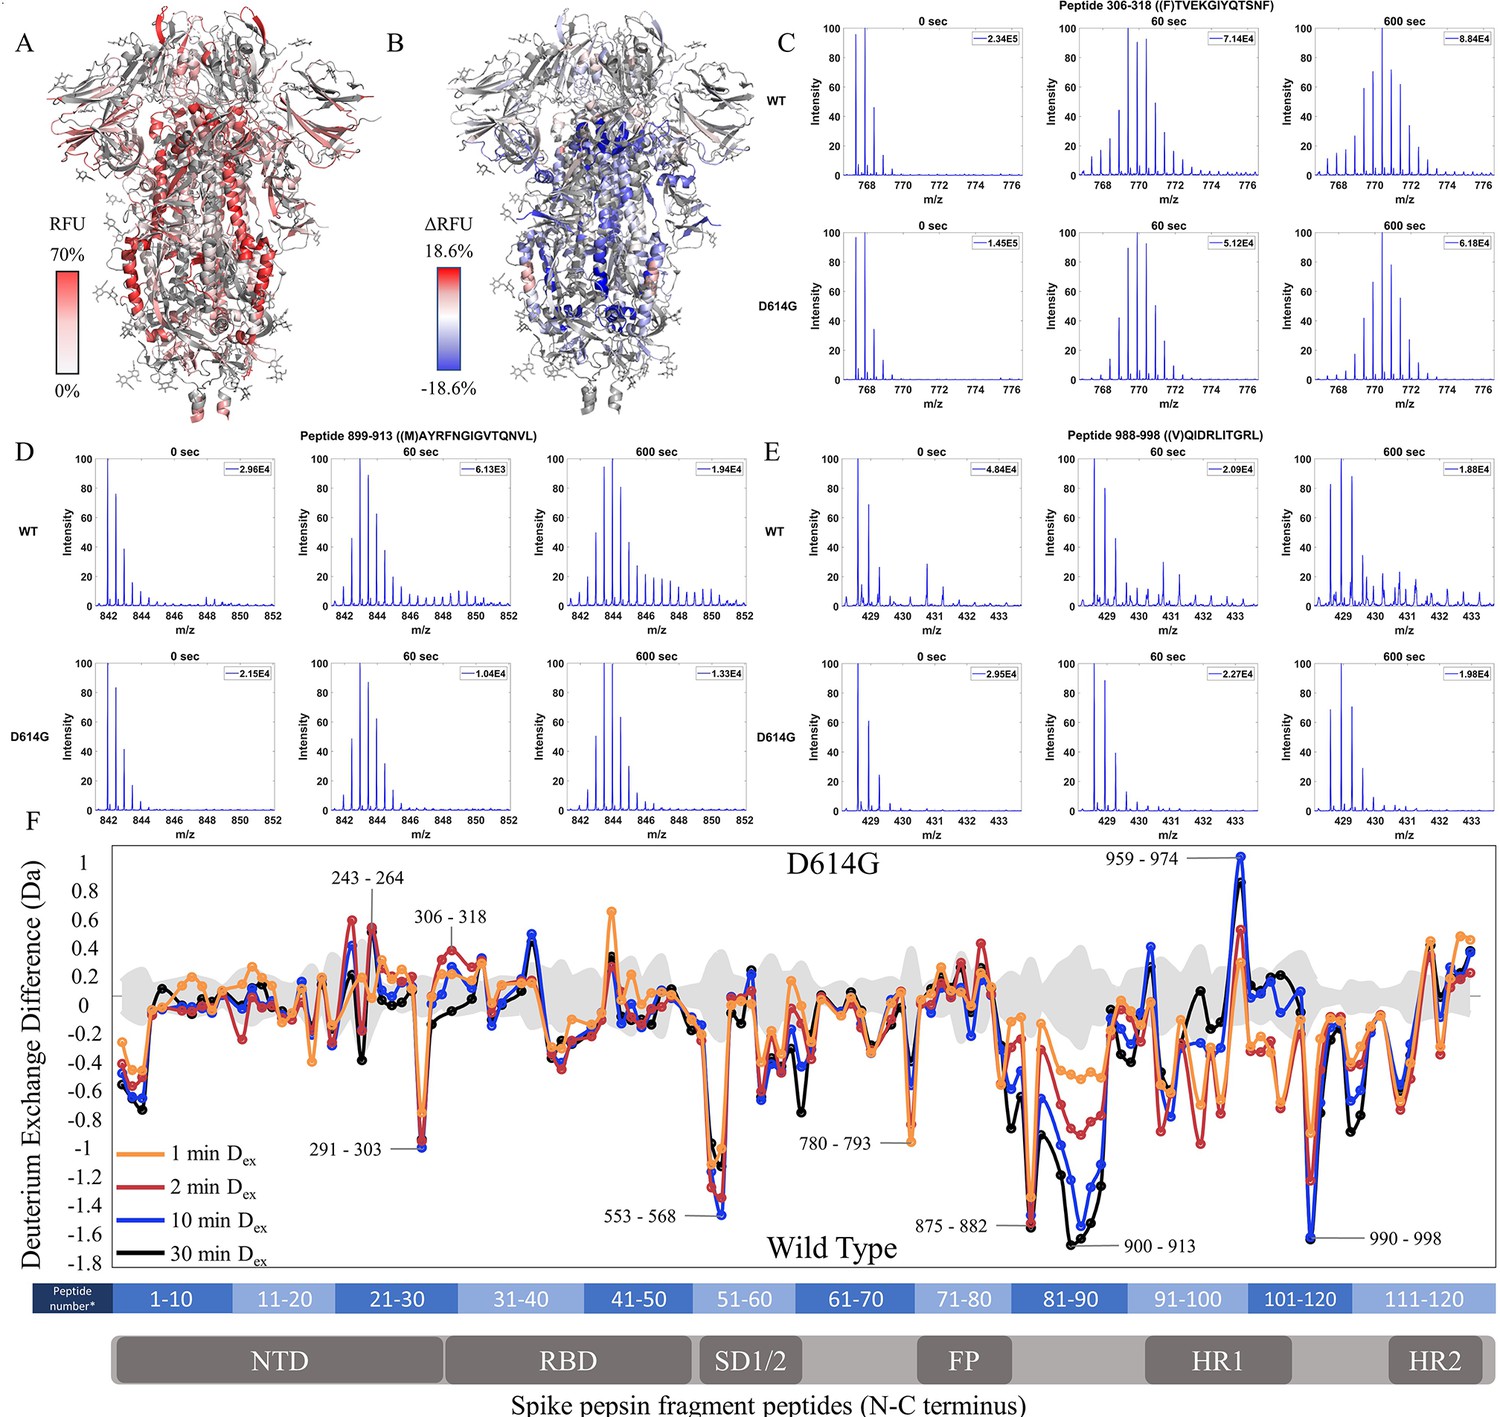
(A) Relative fractional uptake (Dex = 10 min) for unincubated WT S mapped onto an S trimer structure with three ‘down’ RBDs (PDB ID: 6VXX) (coverage of WT S constructs shown in Figure 2—figure supplements 1–2, differences in deuterium exchange for WT 2P and 6P constructs shown in Figure 2—figure supplement 3). Deuterium exchange heat map gradient of white (0%) -red (70%) as mapped on S structure (PDB ID: 6VXX). (B) Differences in deuterium exchange (Δ RFU) (Dex = 10 min) for WT S after a 3 hr incubation at 37℃ minus unincubated WT S were mapped onto the S structure (PDB ID: 6VXX). Shades of blue correspond to negative differences in deuterium exchange and shades of red correspond to a positive difference in deuterium exchange. (C–E) Stacked mass spectra for WT S peptides 553–568, 899–913, and 988–998 with undeuterated reference spectra, 1 min and 10 min exchange (left to right). For each peptide, the top row shows spectra for unincubated WT S and the bottom row shows spectra for WT S incubated for 3 hr at 37°C. Absolute intensities are indicated at the top right of each spectrum. (F) Differences in deuterium exchange (deuterons) mapped at peptide resolution from N to C terminus for WT S incubated for 3 hr at 37°C minus unincubated WT S are shown in difference plots for 1-, 2-, and 10 min exchange. Select peptides showing significant differences in exchange are annotated. Significance was determined by hybrid significance testing (p<0.01, Figure 2—figure supplement 4). Differences are tabulated in Figure 2—source data 1 with corresponding peptide numbers* shown on the x-axis of the difference plot.
-
Figure 2—source data 1
Deuterium uptake differences for Incubated WT S minus unincubated WT S.
- https://cdn.elifesciences.org/articles/82584/elife-82584-fig2-data1-v2.xlsx
-
Figure 2—source data 2
Deuterium uptake differences for WT 6P S minus WT 2P S.
- https://cdn.elifesciences.org/articles/82584/elife-82584-fig2-data2-v2.xlsx
-
Figure 2—source data 3
Source data for the volcano plot; Figure 2, Figure 2—figure supplement 2.
- https://cdn.elifesciences.org/articles/82584/elife-82584-fig2-data3-v2.xlsx
-
Figure 2—source data 4
Source data for the volcano plot; Figure 2, Figure 2—figure supplement 4.
- https://cdn.elifesciences.org/articles/82584/elife-82584-fig2-data4-v2.xlsx
Figure 2—figure supplement 1
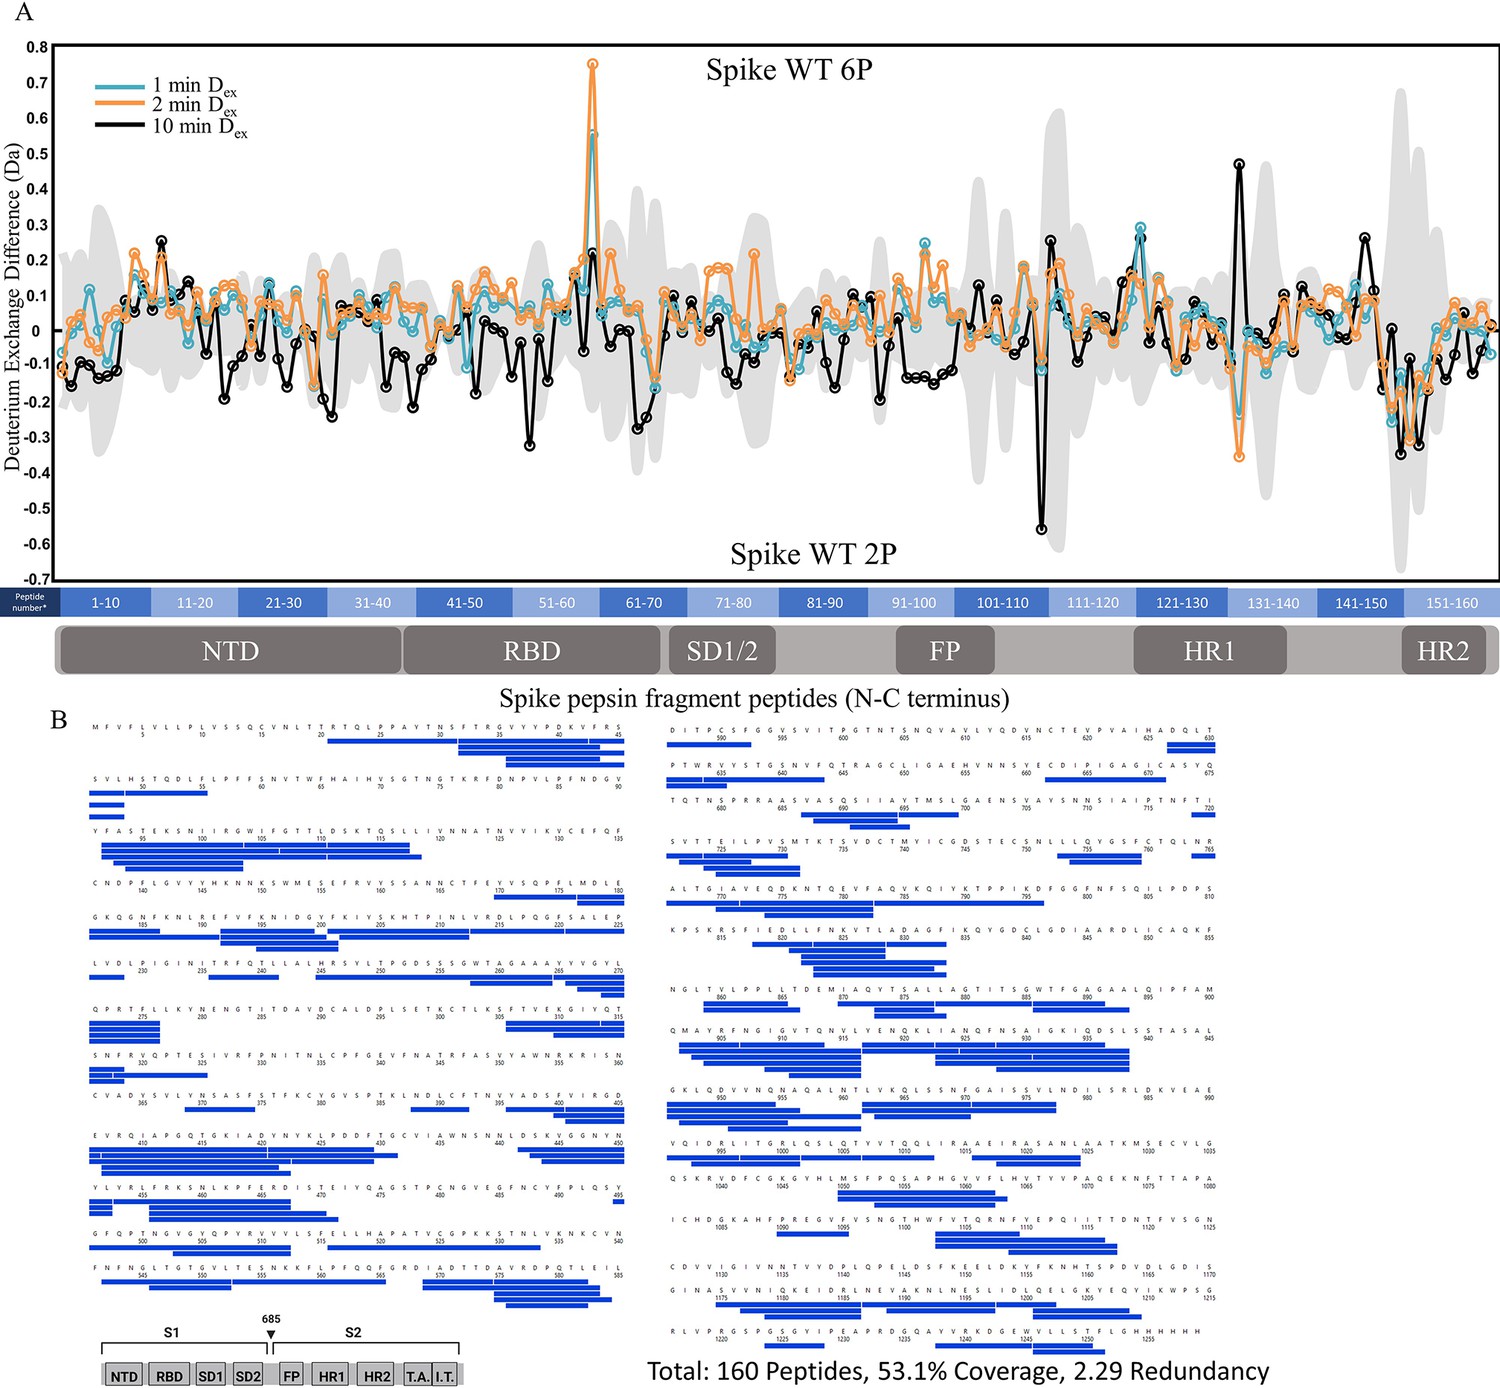
Comparative HDXMS of wild-type (WT) spike (S) protein 2P and 6P.
(A) Difference plot of WT 6P S minus WT 2P S for peptides N to C terminus. Differences for 1, 2, and 10 min exchange are shown in blue, orange, and black, respectively. The gray trace denotes standard errors of deuterium exchange for each peptide. (B) Coverage map of WT 2P S compared to 6P S using the WT 2P sequence showing 160 peptides spanning 53.1% of the S. The domain organization of S is indicated.
Figure 2—figure supplement 2
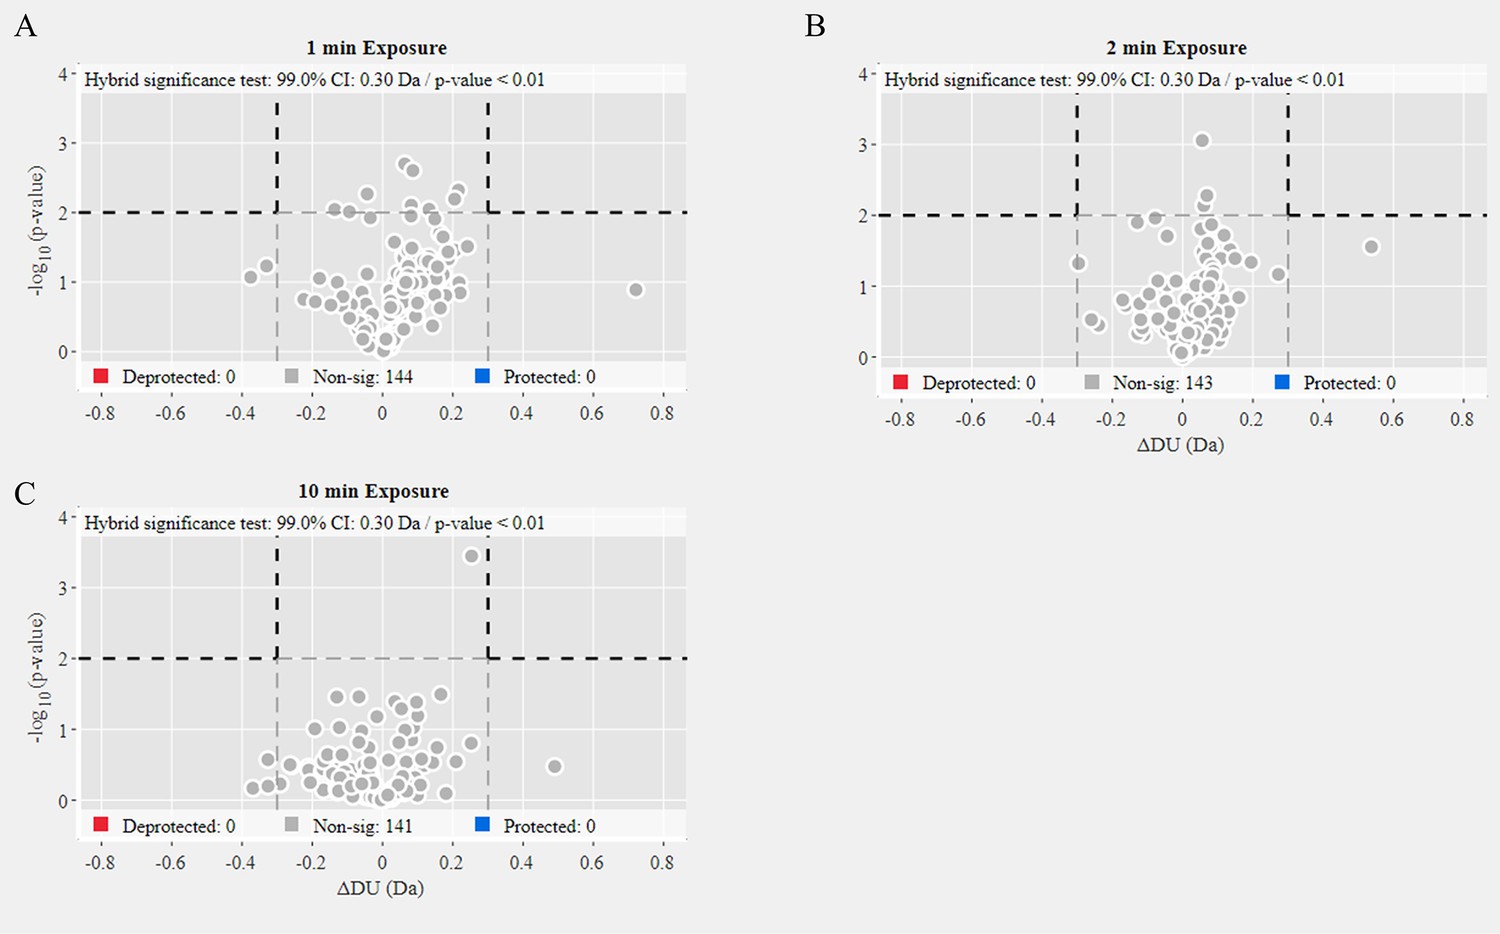
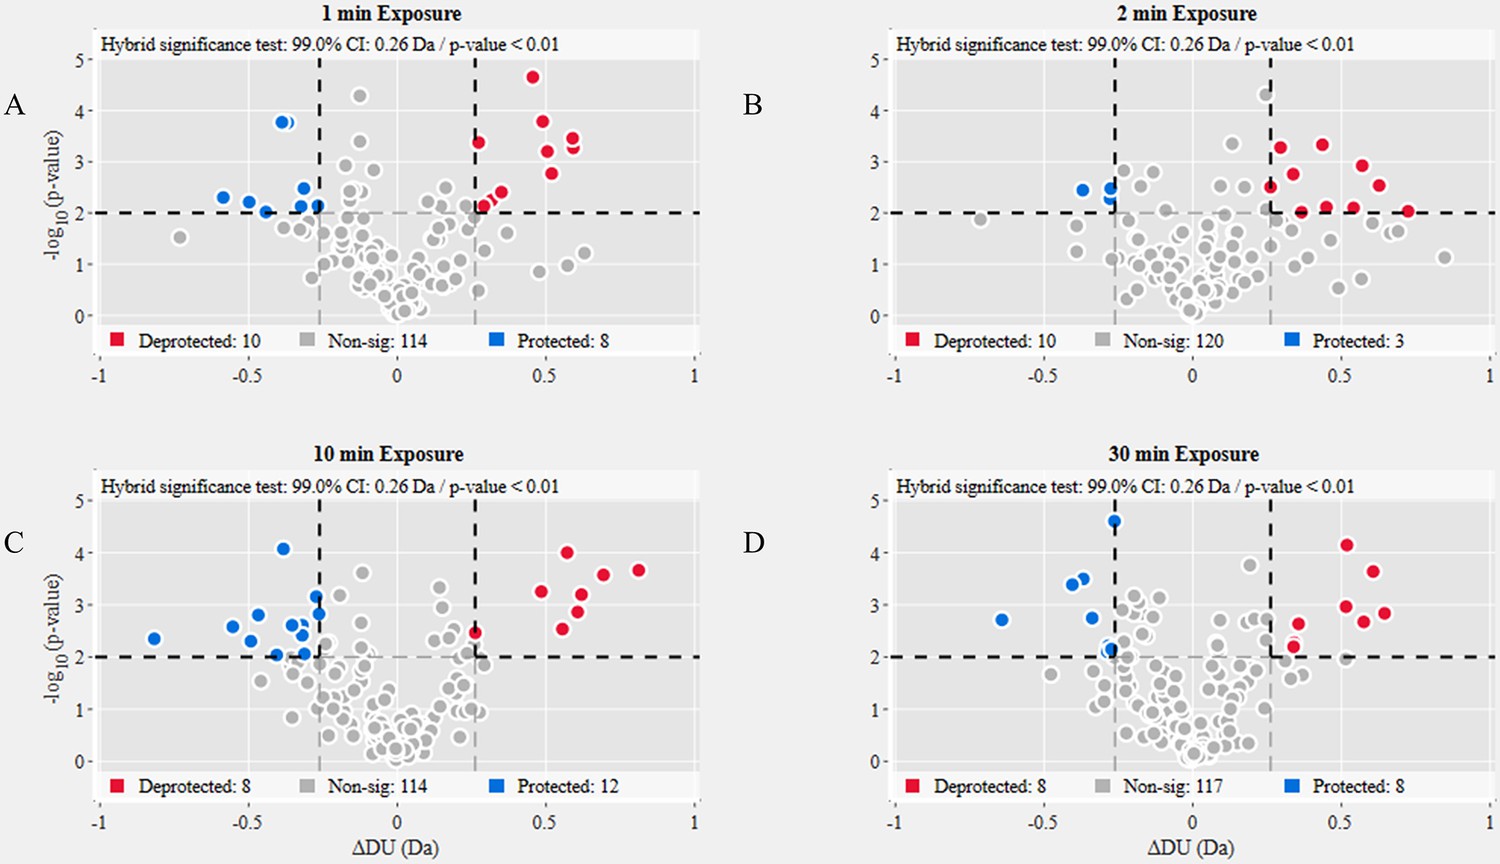
Volcano plot analysis of wild-type (WT) 2P versus 6P S.
Volcano plots for 1 min (A), 2 min (B), and 10 min (C) exchange (Figure 2—source data 3). Significantly protected (blue) or deprotected (red) peptides were identified using a hybrid significance test and a p-value <0.01.
Figure 2—figure supplement 3
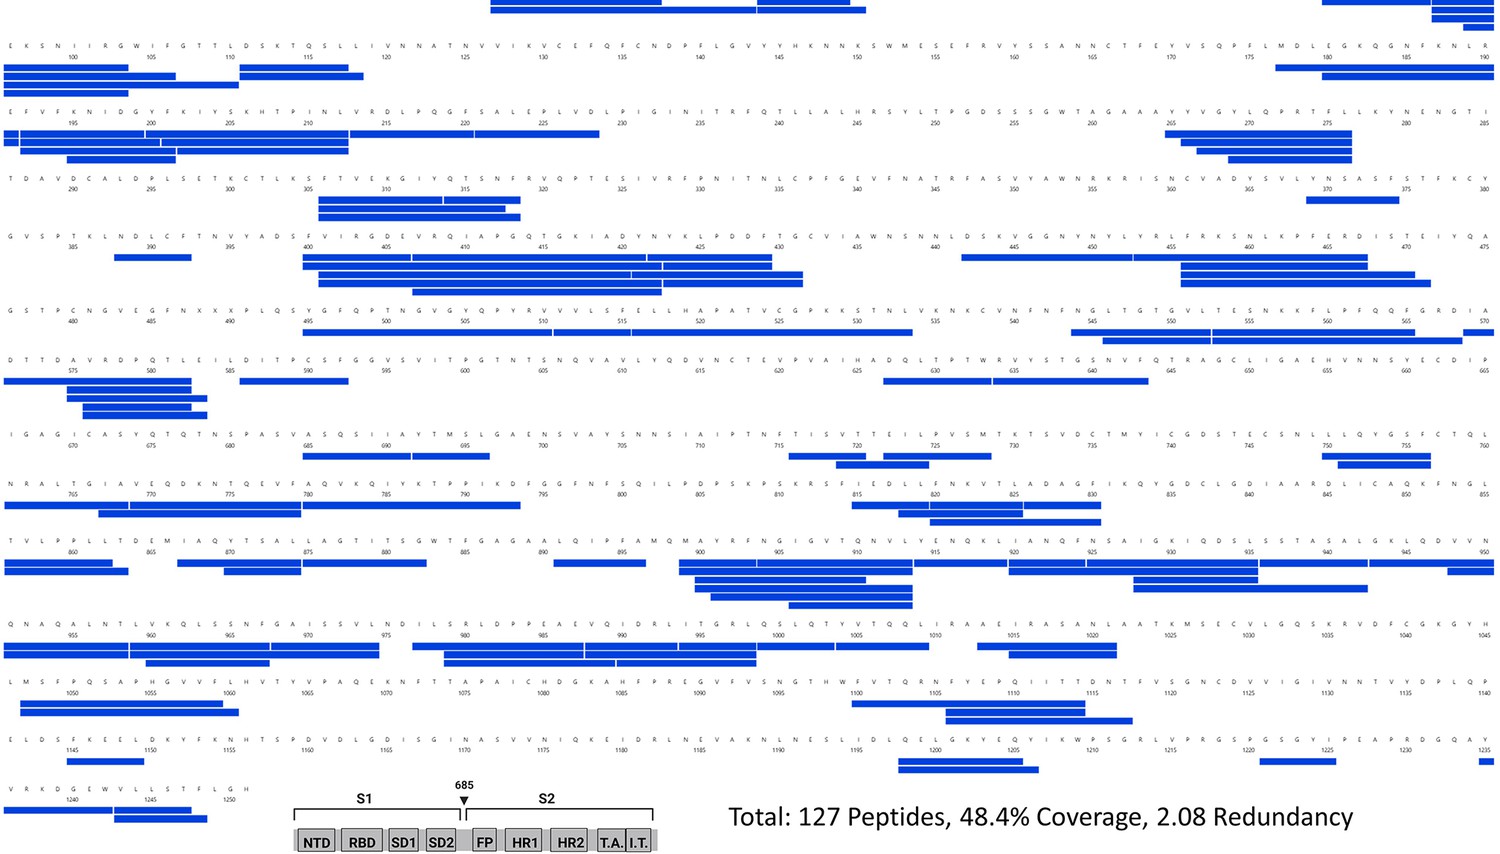
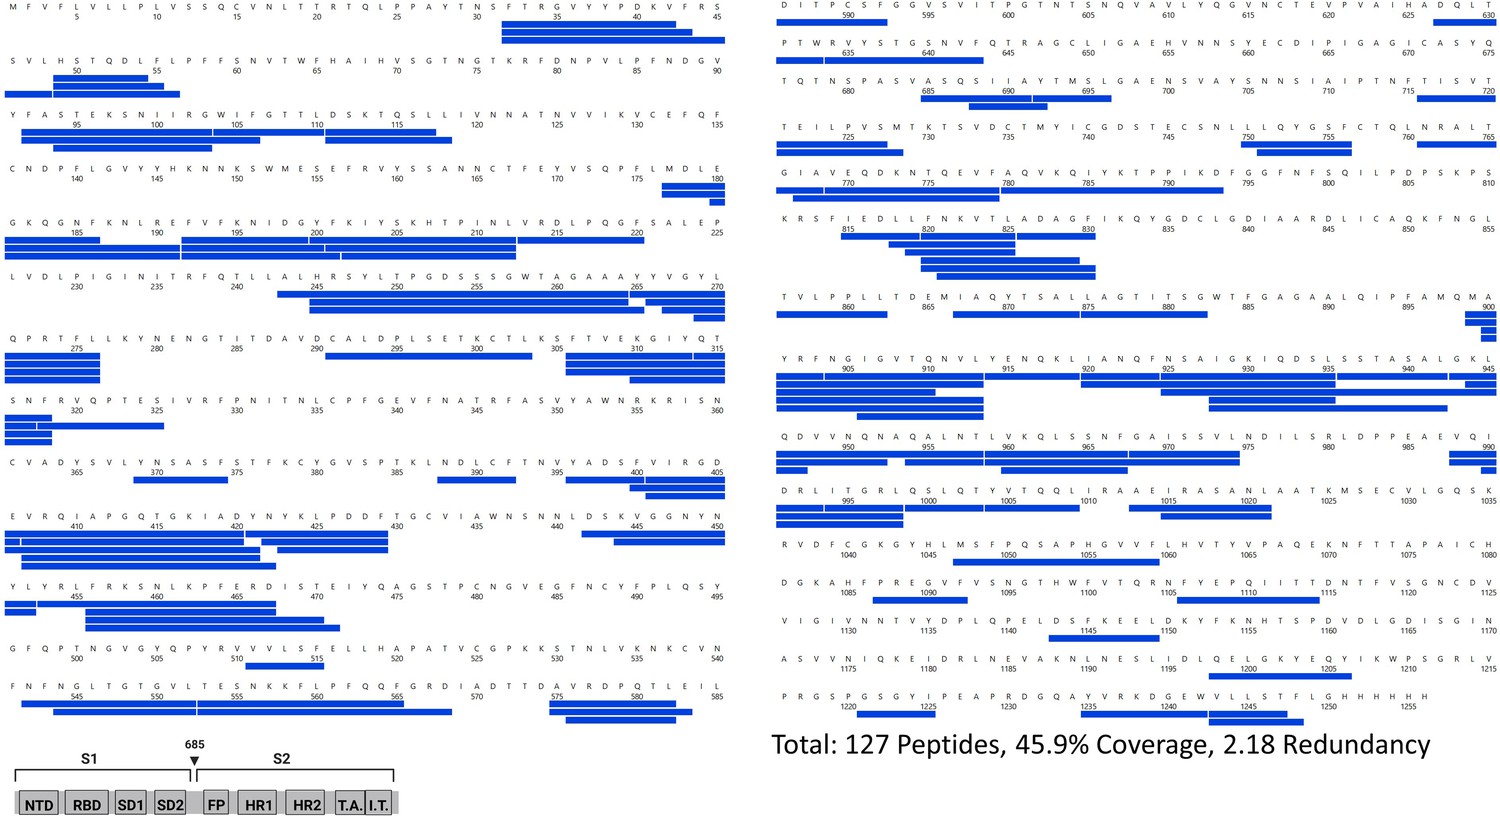
Primary sequence coverage map of pepsin fragment peptides for wild-type (WT) spike (S) protein incubated at 37℃ versus unincubated WT S.
Coverage map of WT S incubated at 37℃ compared to unincubated WT S using the WT 2P sequence showing 127 peptides spanning 48.4% of the S. The domain organization of S is shown.
Figure 2—figure supplement 4
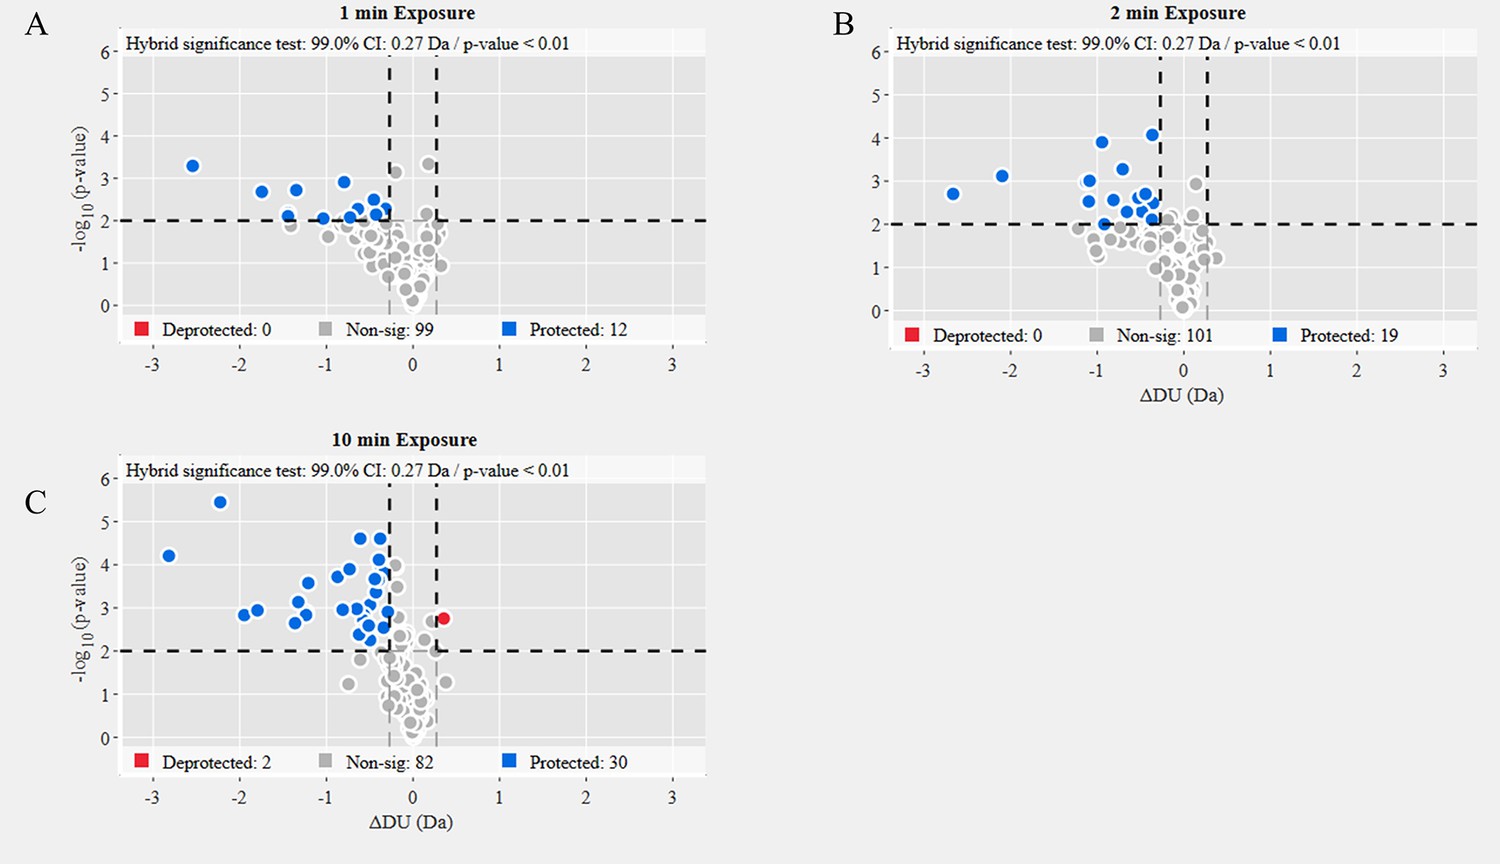
Volcano plot analysis of wild-type (WT) spike (S) protein 37℃ versus WT S unincubated.
Volcano plots for 1 min (A), 2 min (B), and 10 min (C) exchange (Figure 2—source data 4). Significantly protected (blue) or deprotected (red) peptides were identified using a hybrid significance test and a p-value <0.01.
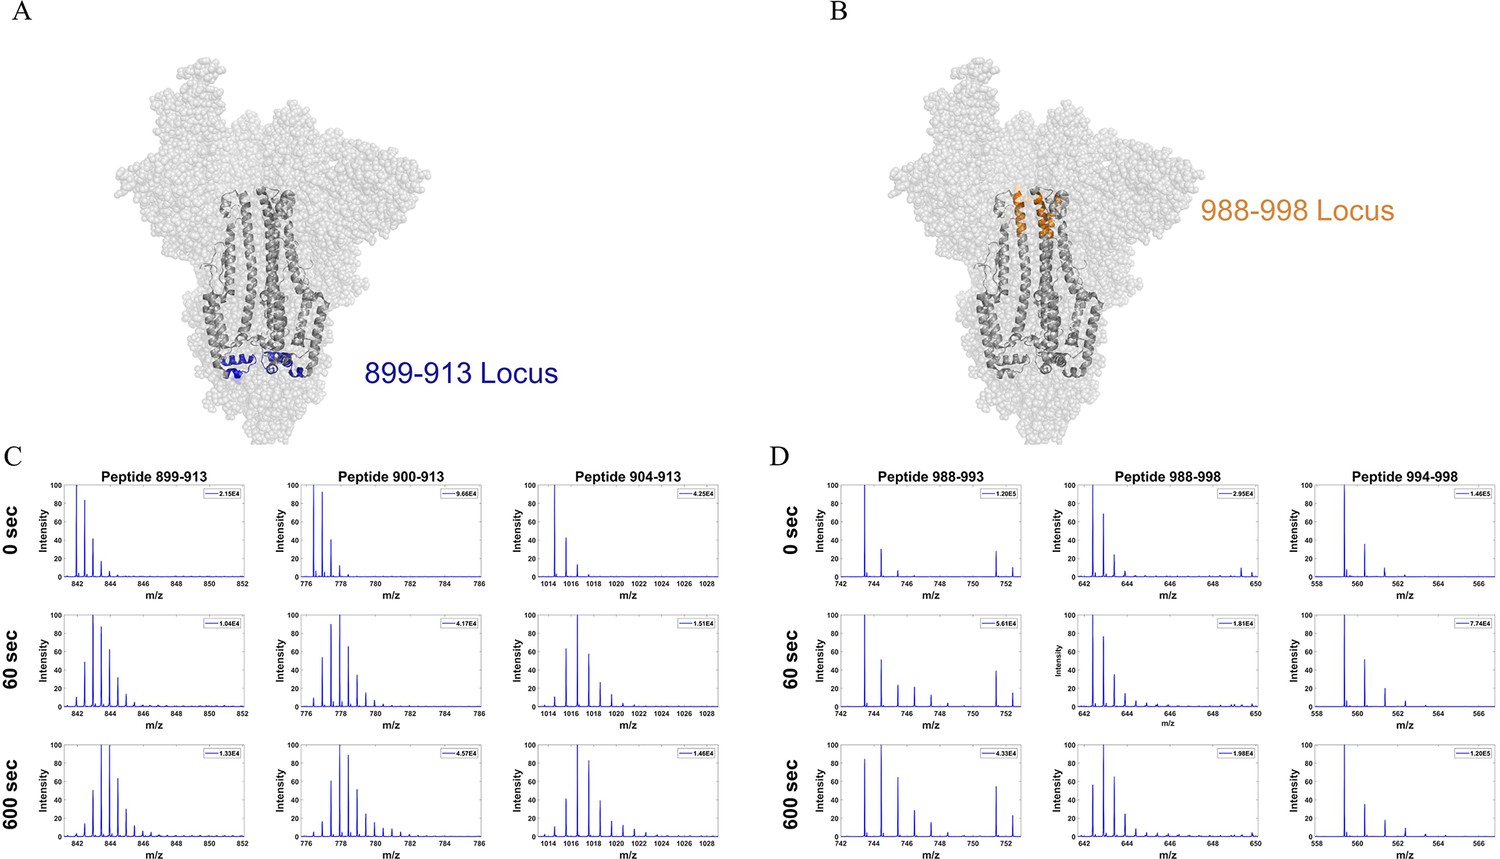
Figure 2—figure supplement 5
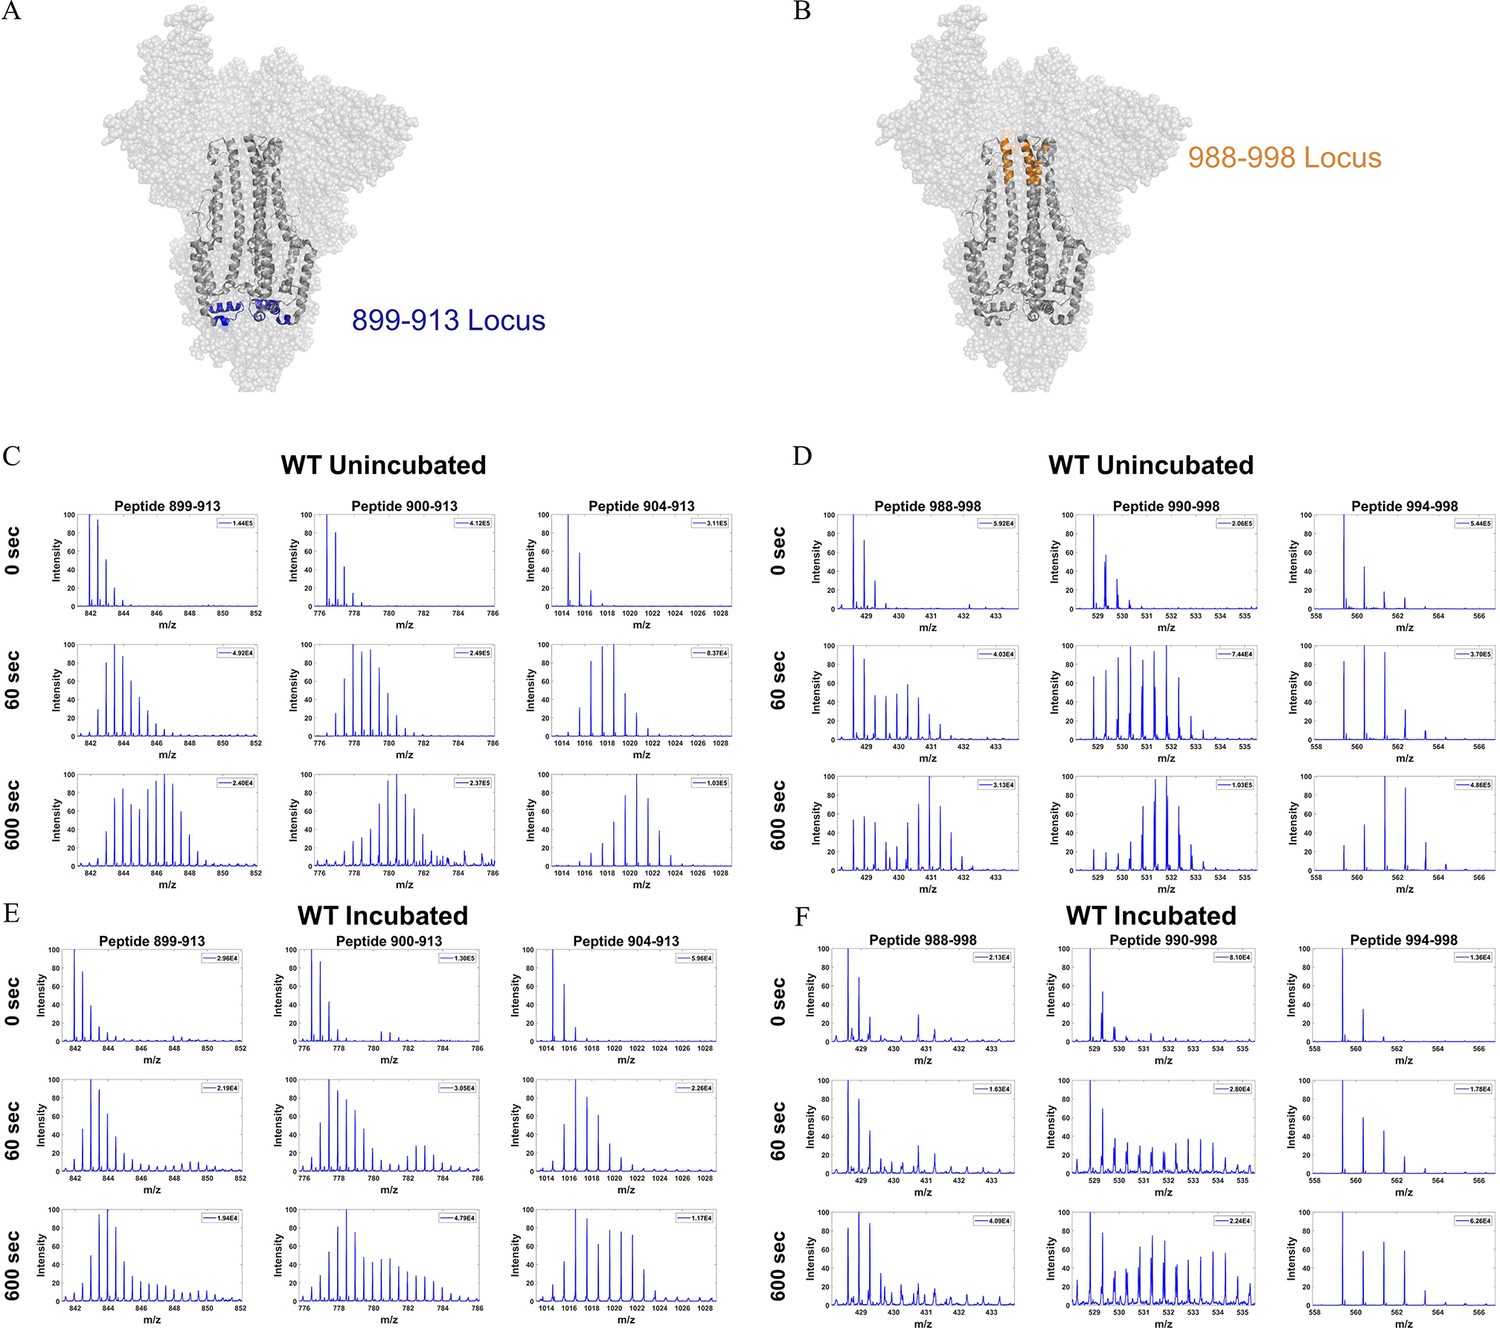
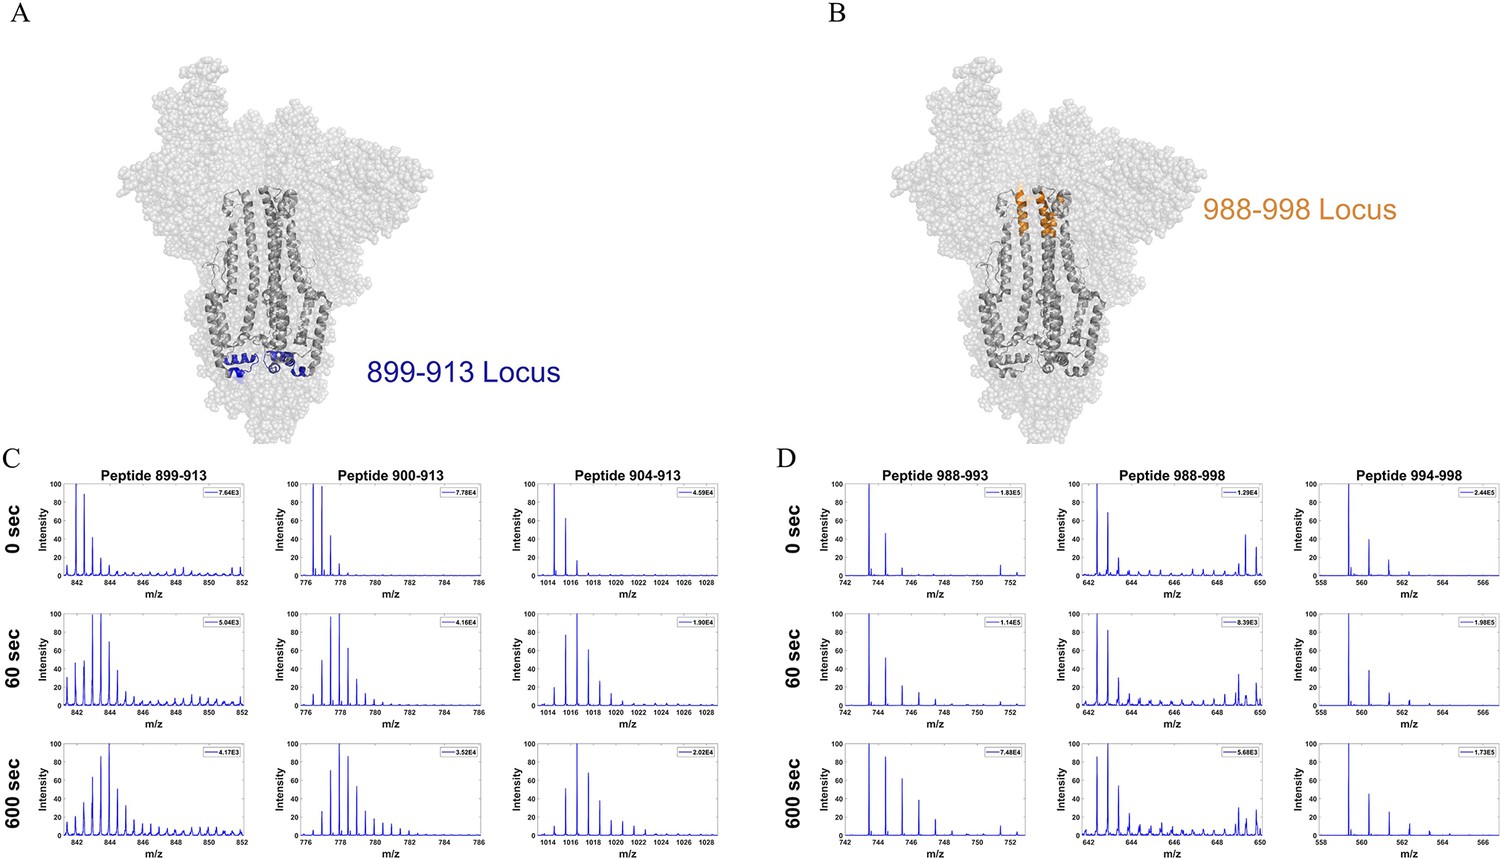
Deuterium exchanged spectral envelopes for overlapping peptides from two stalk loci in wild-type (WT) spike (S) protein.
(A) Peptide locus 899–913 (blue) mapped onto the WT S structure (PDB ID: 7TGX). (B) Peptide locus 988–998 (orange) mapped onto WT S structure (PDB ID: 7TGX). (C) Spectra from three overlapping peptides in the 899–913 locus of unincubated WT S. Reference state as well as spectra for 1 and 10 min exchange are shown from top to bottom for each peptide. (D) Spectra from three overlapping peptides in the 988–998 locus of unincubated WT S. Reference state as well as spectra for 1 and 10 min exchange are shown from top to bottom for each peptide. (E) Spectra from three overlapping peptides in the 899–913 locus of incubated WT S. Reference state as well as spectra for 1 and 10 min exchange (only the first replicate) are shown from top to bottom for each peptide. (F) Spectra from three overlapping peptides in the 988–998 locus of incubated WT S. Reference state as well as spectra for 1 and 10 min exchange (only the first replicate) are shown from top to bottom for each peptide. Absolute intensities are indicated at the top right of each spectrum.
Figure 2—figure supplement 6
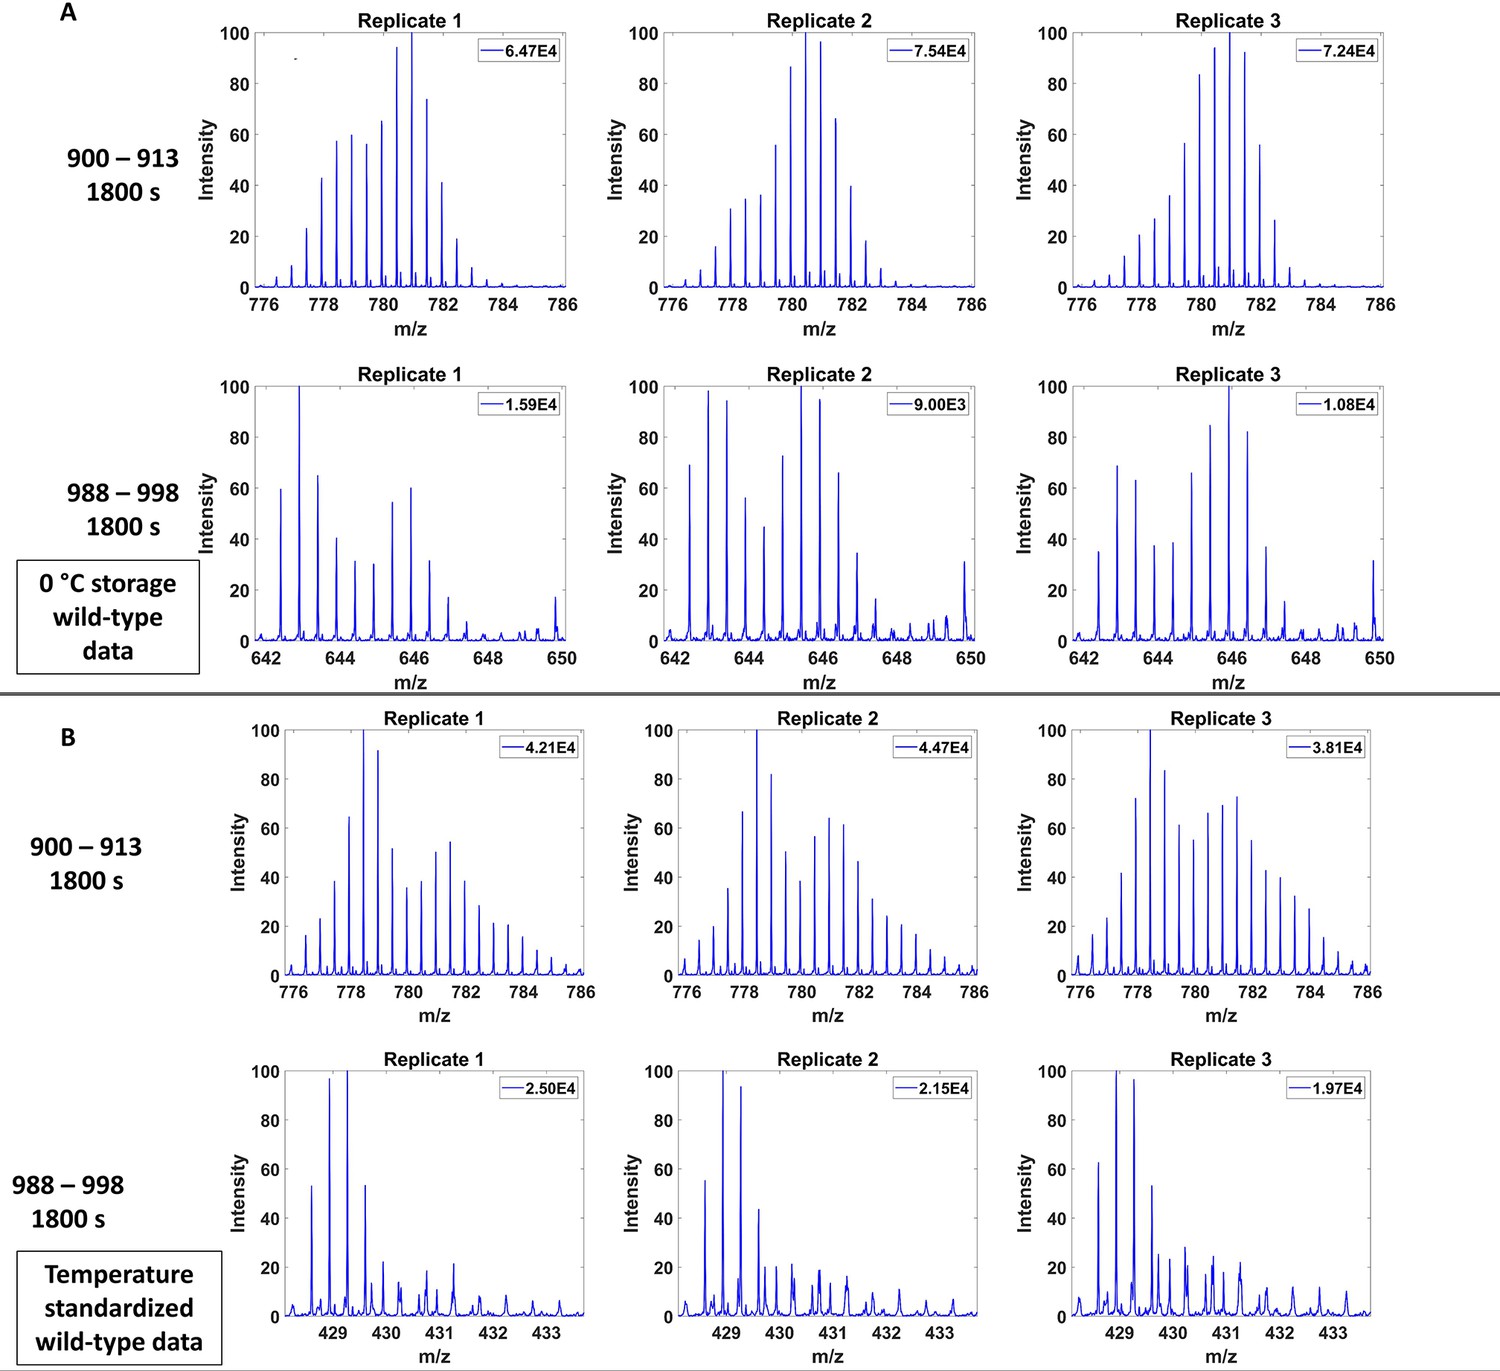
Effect of ~0℃ storage in the course of automated hydrogen deuterium exchange mass spectrometry (HDXMS) on wild-type (WT) trimer peptides.
(A) Effect of 0°C storage during automated HDXMS analysis on peptides 900–913 (top) and 988–998 (bottom). Spectra shown for 1800s exchange and three replicates are shown with a 4 hr storage at 0℃ storage between each replicate. (B) Spectra shown for 1800s exchange and peptides 900–913 (top) and 988–998 (bottom) for samples that were not stored at 0℃ between replicates. Absolute intensity shown in top right of each spectra.
Figure 2—figure supplement 7
Effect of ~0℃ storage in the course of automated hydrogen deuterium exchange mass spectrometry (HDXMS) on deuterium exchange at variant spike (S) protein trimer locus peptides.
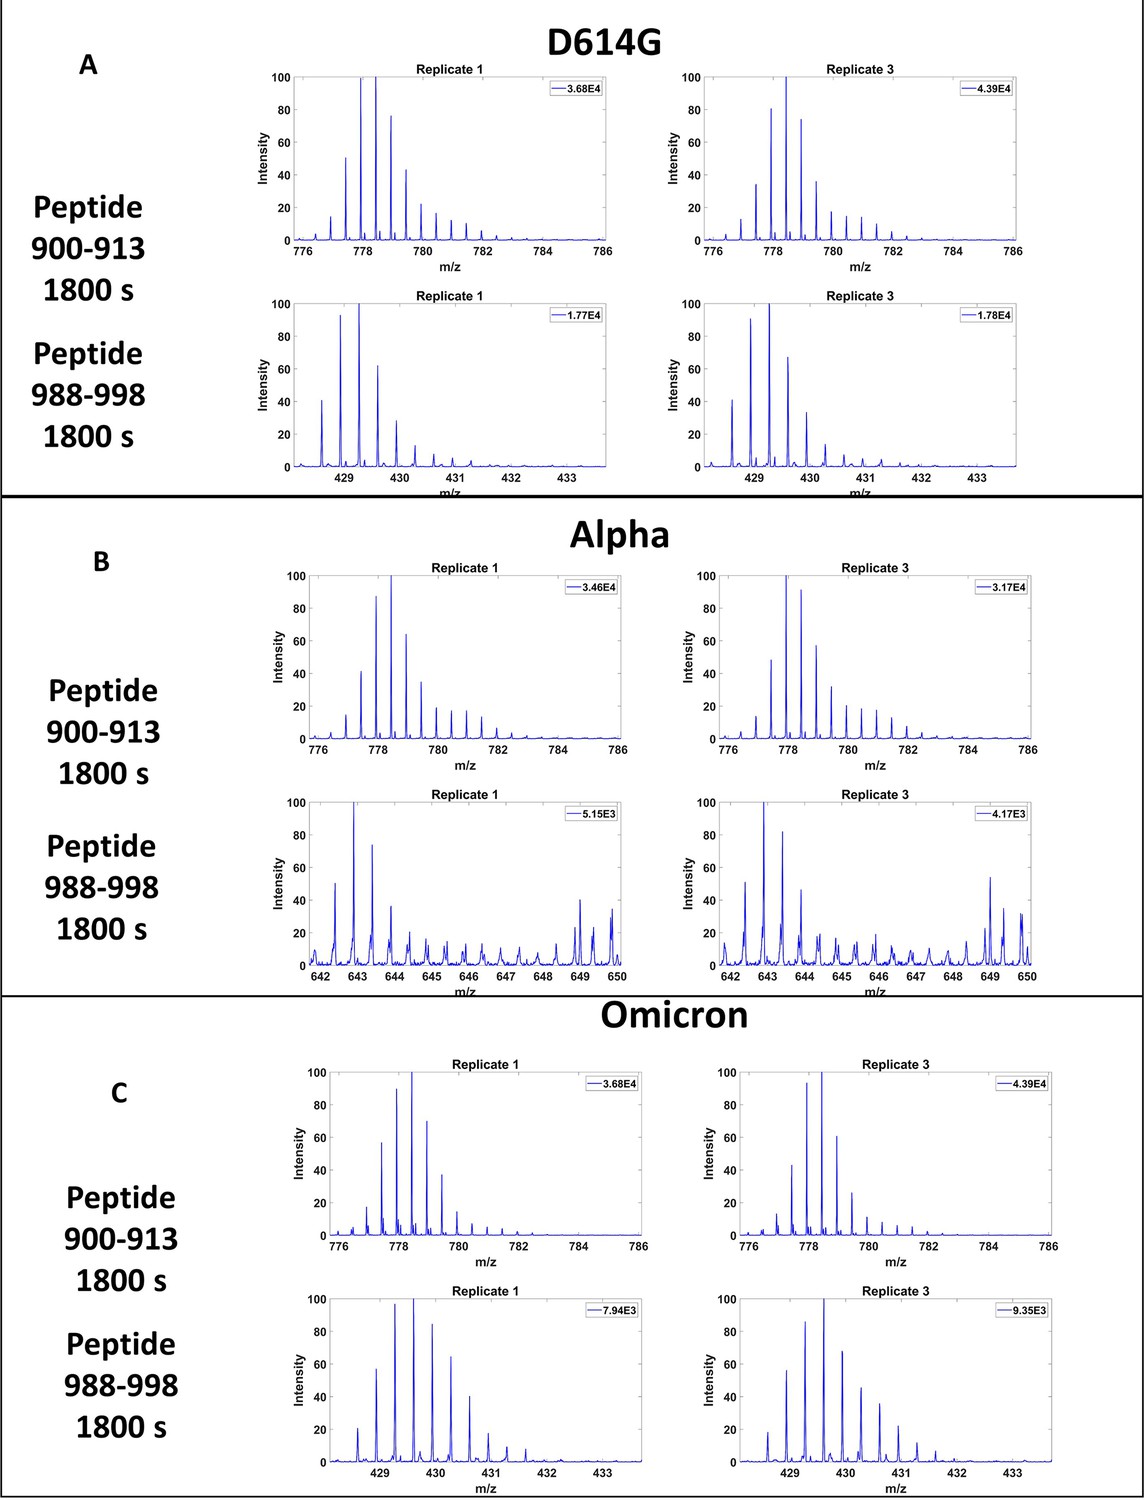
Effect of 0℃ storage in between technical replicates during automated HDXMS analysis on peptides 900–913 (top) and 988–998 (bottom) at 1800s of deuterium exchange for (A) D614G, (B) Alpha, (C) Omicron. Spectra shown for the first and third replicates with 8 hr storage at 0℃ between replicates. Data for delta were collected over multiple days and, therefore, did not undergo 0℃ storage in between replicates.
Figure 3 with 6 supplements
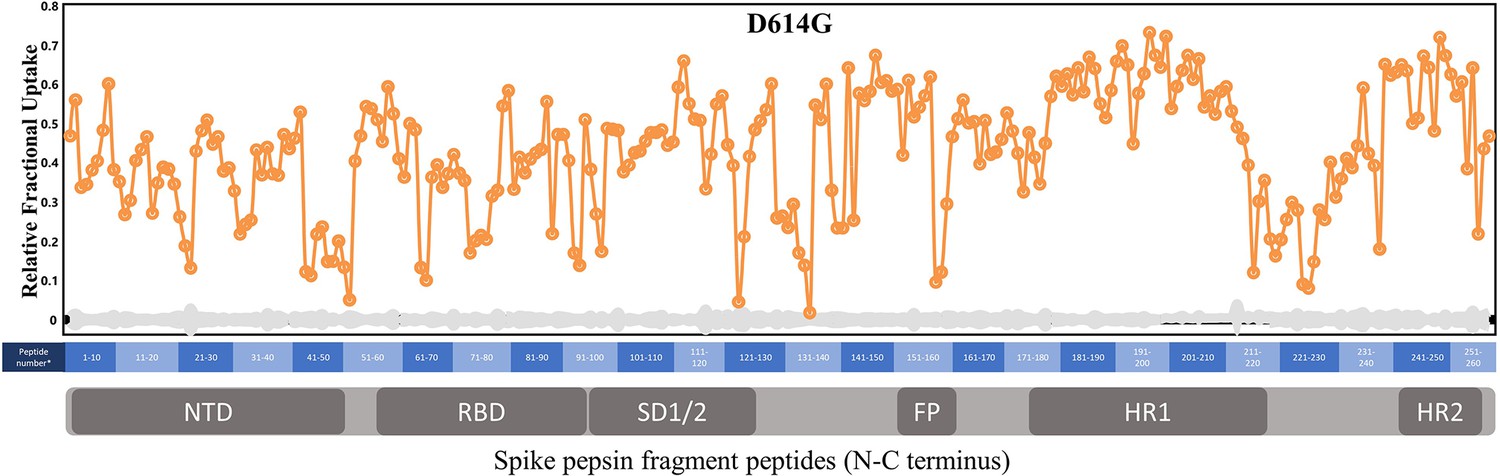
The D614G mutation imparts stabilization to spike (S) protein trimer stalk.
(A) Relative fractional uptake (Dex = 10 min) for D614G S mapped onto an S structure (PDB ID: 6VXX) (coverage maps shown in Figure 3—figure supplement 1, differences in deuterium exchange for D614G S incubated at 37℃ minus D614G S without incubation is shown in Figure 3—figure supplement 4). Deuterium exchange heat map gradient of white (0%) -red (70%) as mapped on S structure (PDB ID: 6VXX). (B) Differences in deuterium exchange (Δ RFU) (Dex = 10 min) for D614G S minus wild-type (WT) S were mapped onto an S structure (PDB ID: 6VXX). Shades of blue correspond to negative differences in deuterium exchange and shades of red correspond to a positive difference in deuterium exchange. (C–E) Stacked mass spectra for peptides 245–265, 900–913, and 988–998 with undeuterated reference spectra, 1 min and 10 min exchange (left to right). For each peptide, the top row contains spectra for WT S and the bottom row contains spectra for D614G S. Absolute intensities are indicated at the top right of each spectrum. (F) Differences in deuterium exchange (deuterons) mapped at peptide resolution from N to C terminus for D614G minus WT S are shown in difference plots for 1-, 2-, 10-, and 30 min exchange. Select peptides showing significant differences in exchange are annotated. Significance was determined by hybrid significance testing (p<0.01, Figure 3—figure supplement 3). Back exchange for D614G is estimated in Figure 3—figure supplement 6. Differences are tabulated in Figure 3—source data 1 with corresponding peptide numbers* shown on the x-axis of the difference plot.
-
Figure 3—source data 1
Deuterium uptake differences for Incubated D614G S minus WT S.
- https://cdn.elifesciences.org/articles/82584/elife-82584-fig3-data1-v2.xlsx
-
Figure 3—source data 2
Deuterium uptake differences for Incubated D614G S minus unincubated D614G S.
- https://cdn.elifesciences.org/articles/82584/elife-82584-fig3-data2-v2.xlsx
-
Figure 3—source data 3
Source data for the volcano plot; Figure 3, Figure 3—figure supplement 2.
- https://cdn.elifesciences.org/articles/82584/elife-82584-fig3-data3-v2.xlsx
Figure 3—figure supplement 1
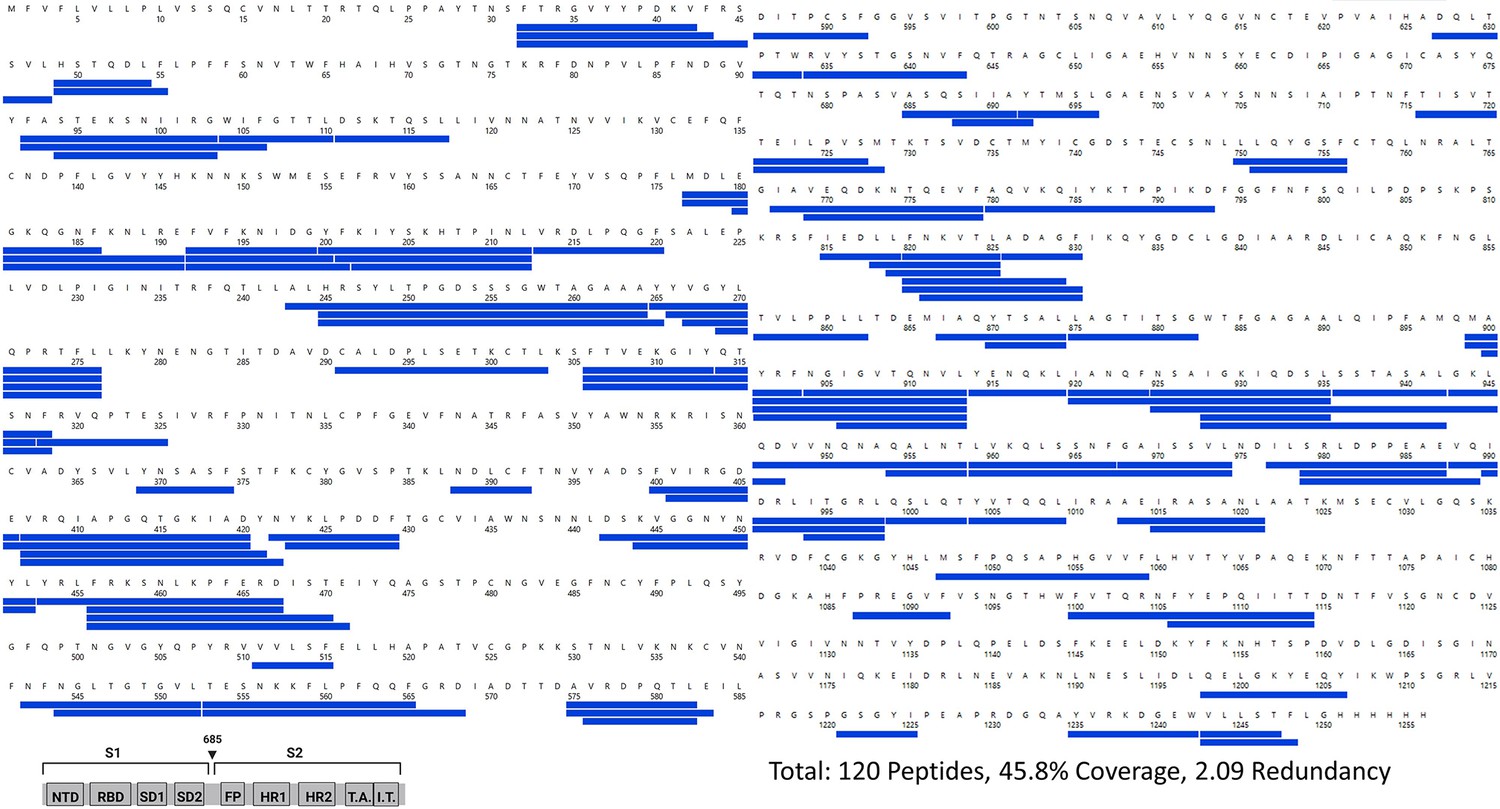
Primary sequence coverage map of pepsin fragment peptides for D614G S versus wild-type (WT) spike (S) protein.
Coverage map of D614G S compared to WT S using the WT 2P sequence showing 120 peptides spanning 45.8% of the S. The domain organization of S is indicated.
Figure 3—figure supplement 2
Volcano plot analysis of D614G S versus wild-type (WT) spike (S) protein.
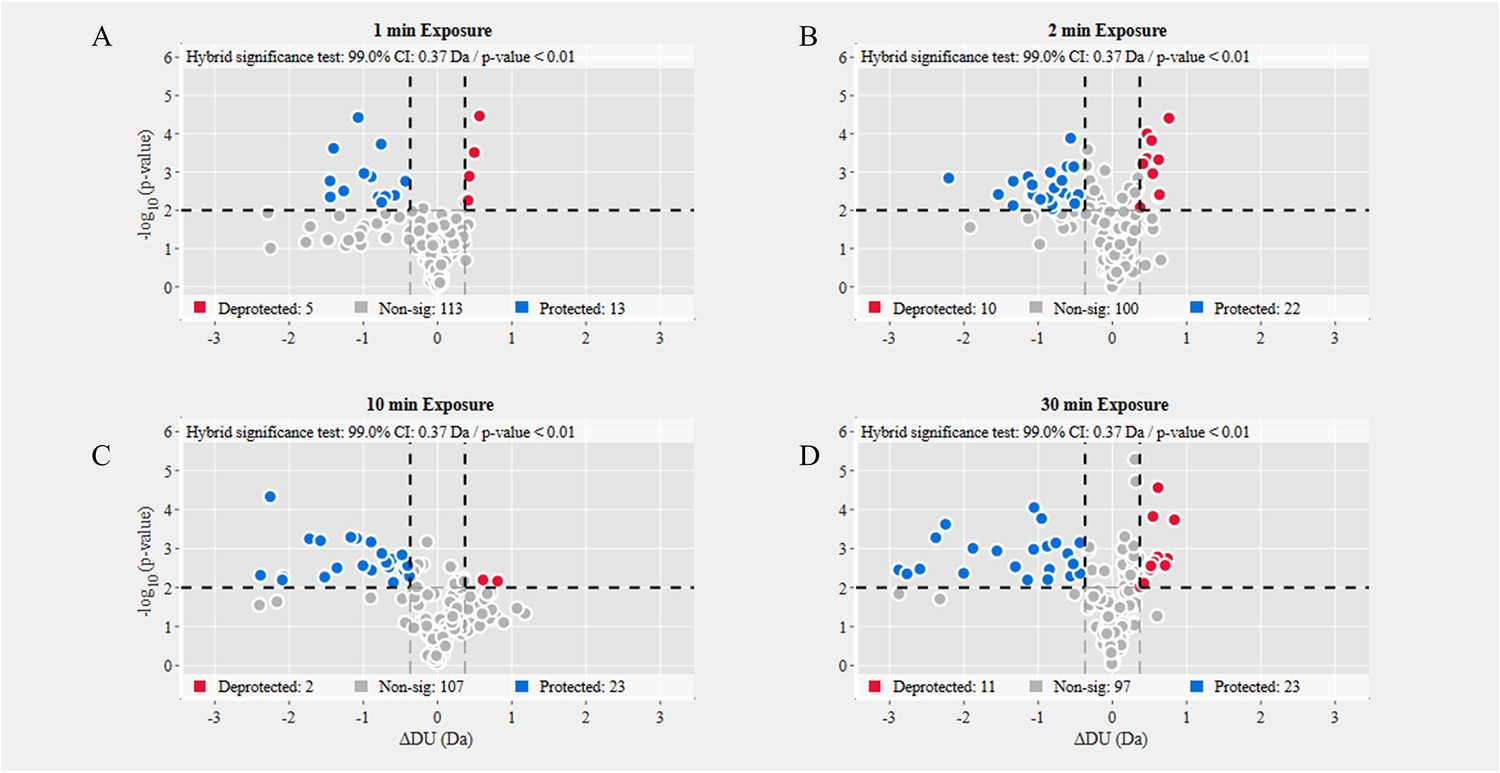
Volcano plots for 1 min (A), 2 min (B), 10 min (C), and 30 min (D) exchange (Figure 3—source data 3). Significantly protected (blue) or deprotected (red) peptides were identified using a hybrid significance test and a p-value <0.01.
Figure 3—figure supplement 3
Mass spectra of overlapping peptides from two stalk loci in D614G S.
(A) Peptide locus 899–913 (blue) mapped onto the WT S structure (PDB ID: 7TGX). (B) Peptide locus 988-998 (orange) mapped onto wild-type (WT) spike (S) protein structure (PDB ID: 7TGX). (C) Spectra from three overlapping peptides in the 899-913 locus of D614G S. Reference state as well as spectra for 1 and 10 min exchange are shown from top to bottom for each peptide. (D) Spectra from three overlapping peptides in the 988–998 locus of D614G S. Reference state as well as spectra for 1 and 10 min exchange are shown from top to bottom for each peptide. Absolute intensities are indicated at the top right of each spectrum.
Figure 3—figure supplement 4
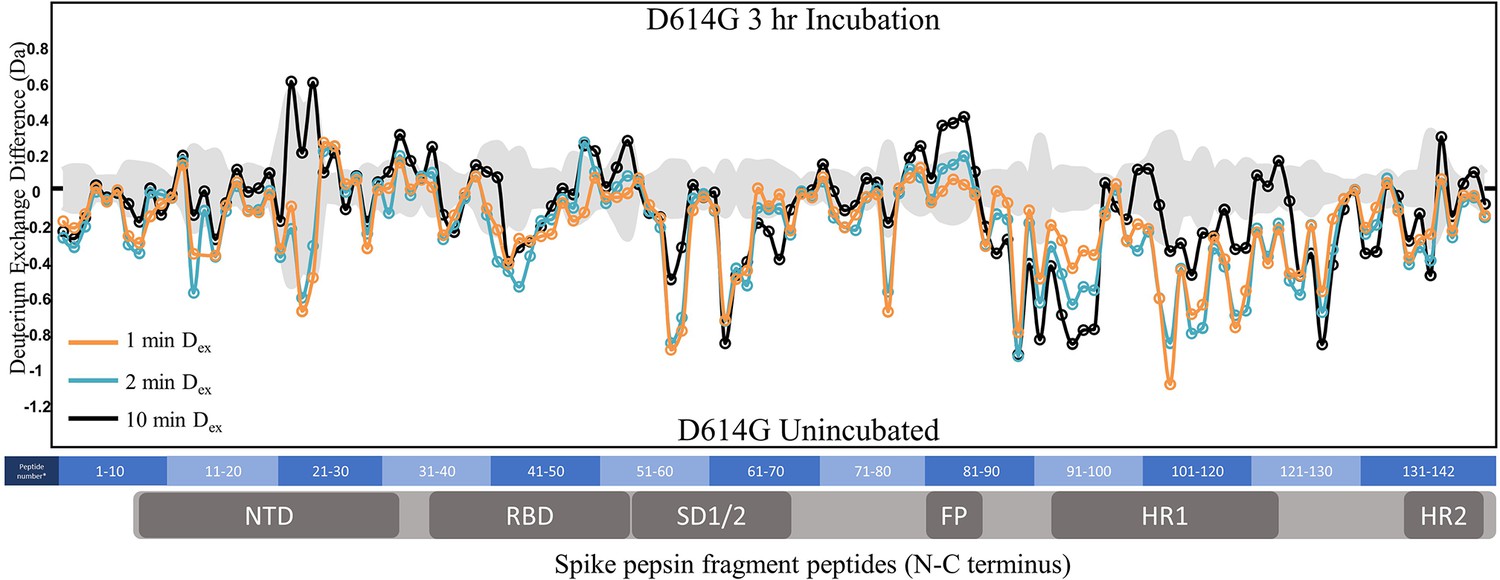
Hydrogen deuterium exchange mass spectrometry (HDXMS) analysis of incubation effects on D614G S.
Difference plot of D614G S incubated for 3 hr at 37℃ minus D614G S with no incubation for peptides N to C terminus. Differences for 1, 2, and 10 min exchange are shown in blue, orange, and black, respectively. The gray trace denotes standard errors of deuterium exchange for each peptide. Differences are tabulated in Figure 3—source data 2 with corresponding numbers shown on the x-axis of the difference plot.
Figure 3—figure supplement 5
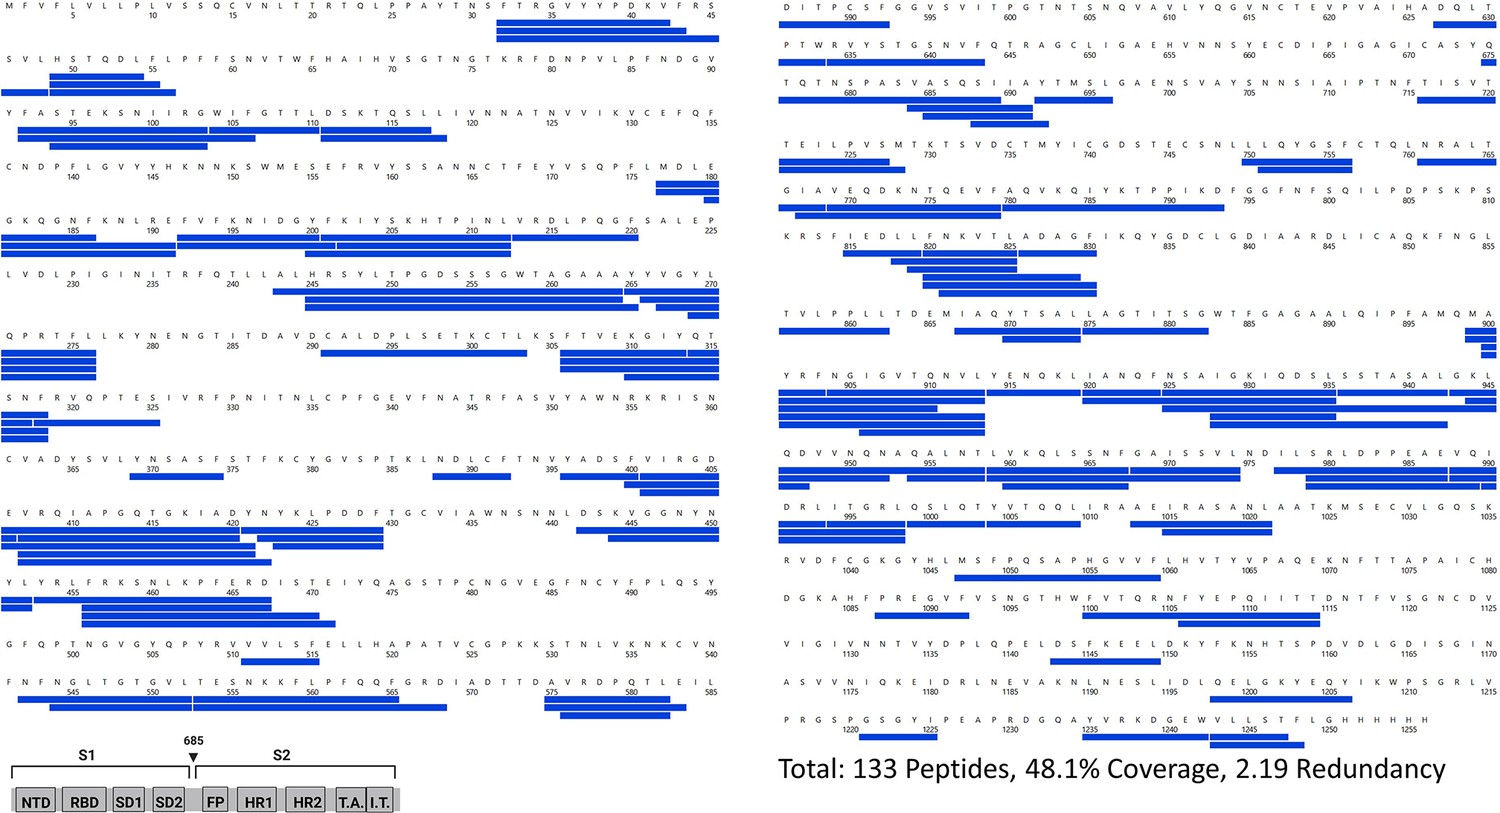
Primary sequence coverage of pepsin fragment peptides for D614G S incubated at 37℃ versus unincubated D614G S.
Coverage map of D614G S incubated at 37℃ compared to unincubated D614G S using the D614G 2P sequence showing 133 peptides spanning 48.1% of the spike (S) protein. The domain organization of S is indicated.
Figure 3—figure supplement 6
Deuterium back exchange measurements for pepsin fragment peptides from D614G S.
Deuterium exchange in peptides after long deuteration (Dex = 24 h) is displayed as an RFU plot. The highest exchanging peptides (943-958 and 957-967) were used to calculate an average back exchange estimate of 20%.
Figure 4 with 3 supplements
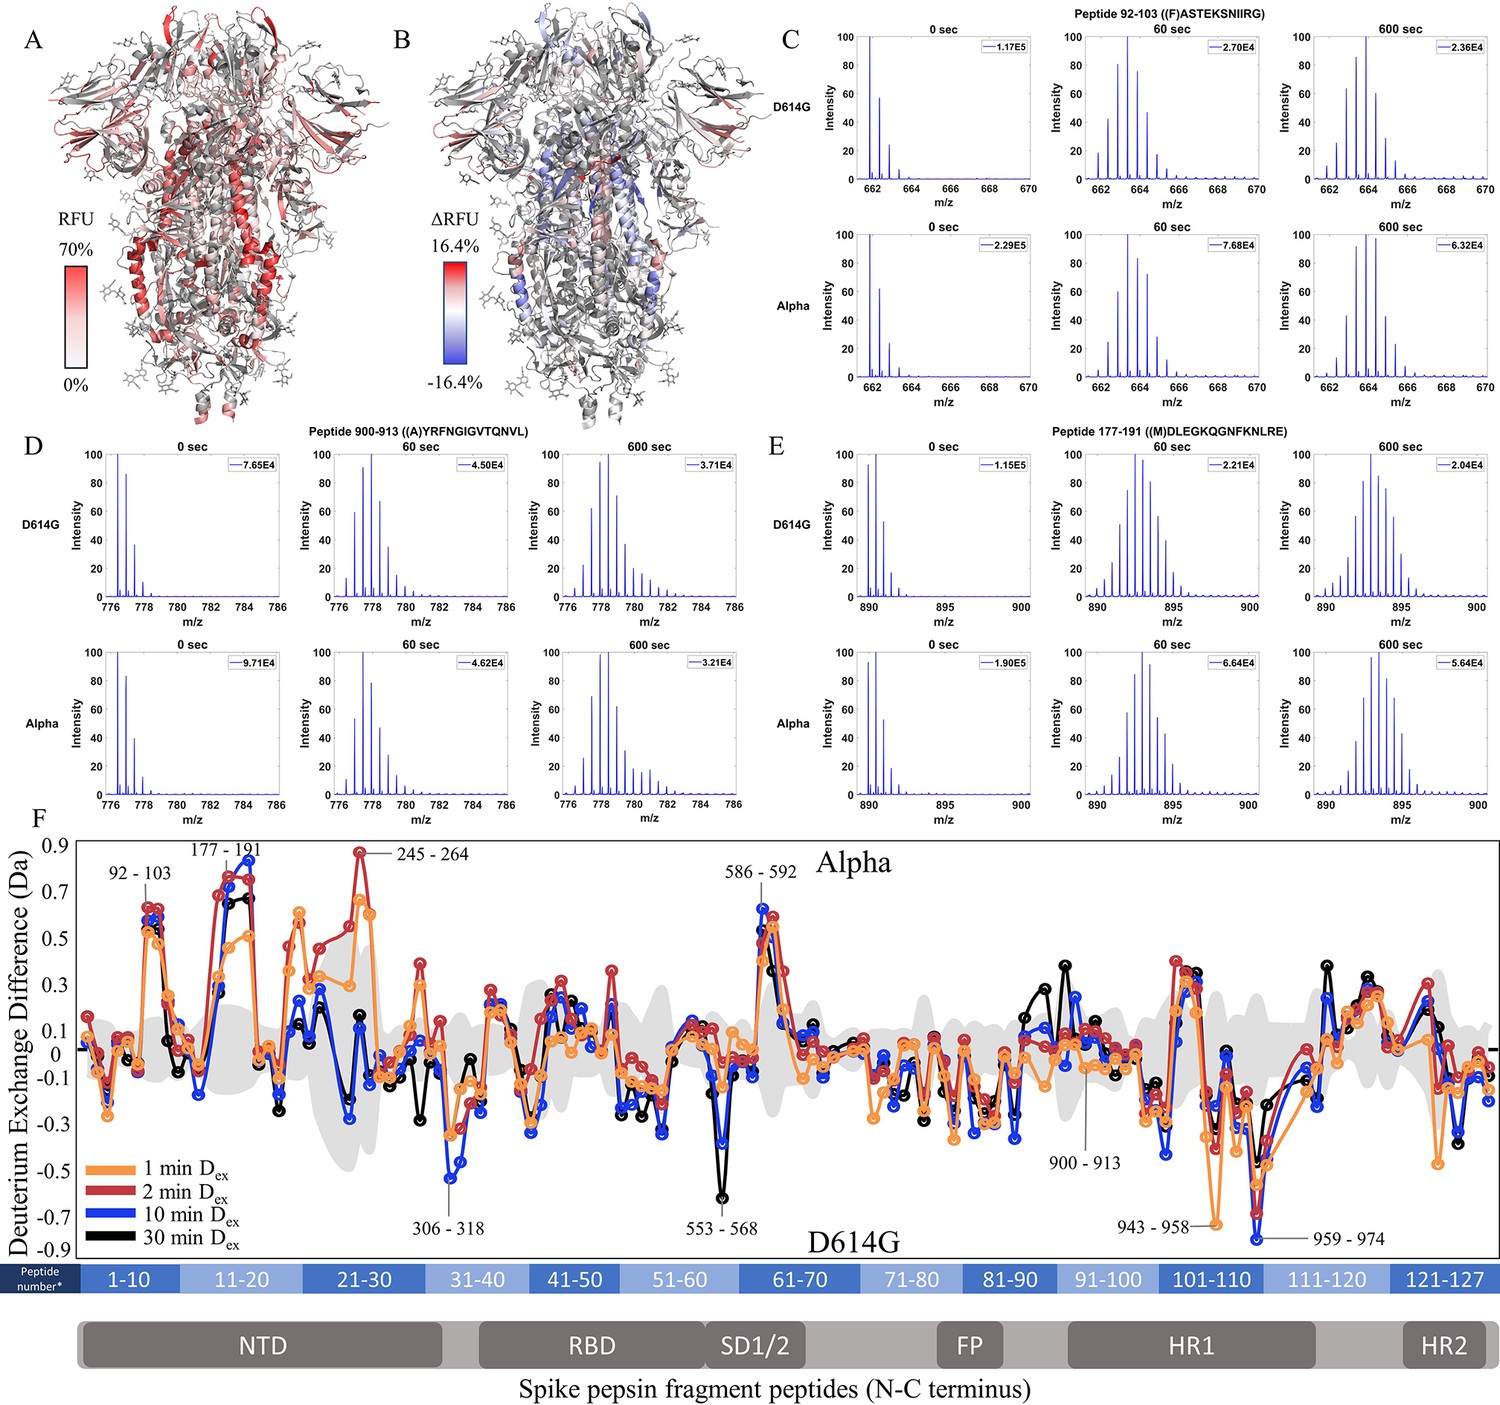
Increased N-terminal domain (NTD) dynamics in Alpha S.
(A) Relative fractional uptake (Dex = 10 min) for Alpha S mapped onto an spike (S) protein structure with three down RBDs (PDB ID: 6VXX) coverage map is shown in Figure 4—figure supplement 1). Deuterium exchange heat map (gradient of white (0%) -red (70%) as mapped on S structure (PDB ID: 6VXX). (B) Differences in deuterium exchange (Δ RFU) (Dex = 10 min) for Alpha S minus D614G S were mapped onto an S structure (PDB ID: 6VXX). Shades of blue correspond to negative differences in deuterium exchange and shades of red correspond to a positive difference in deuterium exchange. (C–E) Stacked mass spectra for peptides 92–103, 177–191, and 900–913 with the undeuterated mass spectral envelope as a reference, 1 min and 10 min exchange (left to right). For each peptide, the top row contains spectra for D614G S and the bottom row contains spectra for Alpha S. Absolute intensities are indicated at the top right of each spectrum. (F) Differences in deuterium exchange (deuterons) mapped at peptide resolution from N to C terminus for Alpha S minus D614G S are shown in difference plots for 1-, 2-, 10-, and 30 min exchange. Select peptides showing significant differences in exchange are annotated. Significance was determined by hybrid significance testing (p<0.01, Figure 4—figure supplement 2). Differences are tabulated in Figure 4—source data 1 with corresponding peptide numbers* shown on the x-axis of the difference plot.
-
Figure 4—source data 1
Deuterium uptake differences for Alpha S minus D614G S.
- https://cdn.elifesciences.org/articles/82584/elife-82584-fig4-data1-v2.xlsx
-
Figure 4—source data 2
Source data for the volcano plot; Figure 4, Figure 4—figure supplement 2.
- https://cdn.elifesciences.org/articles/82584/elife-82584-fig4-data2-v2.xlsx
Figure 4—figure supplement 1
Primary sequence coverage map of pepsin fragment peptides for Alpha S versus D614G S.
Coverage map of Alpha S compared to D614G S using the D614G 2P sequence showing 127 peptides spanning 45.9% of the spike (S) protein. The domain organization of S is indicated.
Figure 4—figure supplement 2
Volcano plot analysis of Alpha S versus D614G S.
Volcano plots for 1 min (A), 2 min (B), 10 min (C), and 30 min (D) exchange (Figure 4—source data 2). Significantly protected (blue) or deprotected (red) peptides were identified using a hybrid significance test and a p-value <0.01.
Figure 4—figure supplement 3
Mass spectral envelopes for overlapping peptides from two stalk loci in Alpha S.
(A) Peptide locus 899–913 (blue) mapped onto the wild-type (WT) spike (S) protein structure (PDB ID: 7TGX). (B) Peptide locus 988–998 (orange) mapped onto WT S structure (PDB ID: 7TGX). (C) Spectra from three overlapping peptides in the 899–913 locus of Alpha S. Reference state as well as spectra for 1 and 10 min exchange are shown from top to bottom for each peptide. (D) Spectra from three overlapping peptides in the 988–998 locus of Alpha S. Reference state as well as spectra for 1 and 10 min exchange are shown from top to bottom for each peptide. Absolute intensities are indicated at the top right of each spectrum.
Figure 5 with 3 supplements
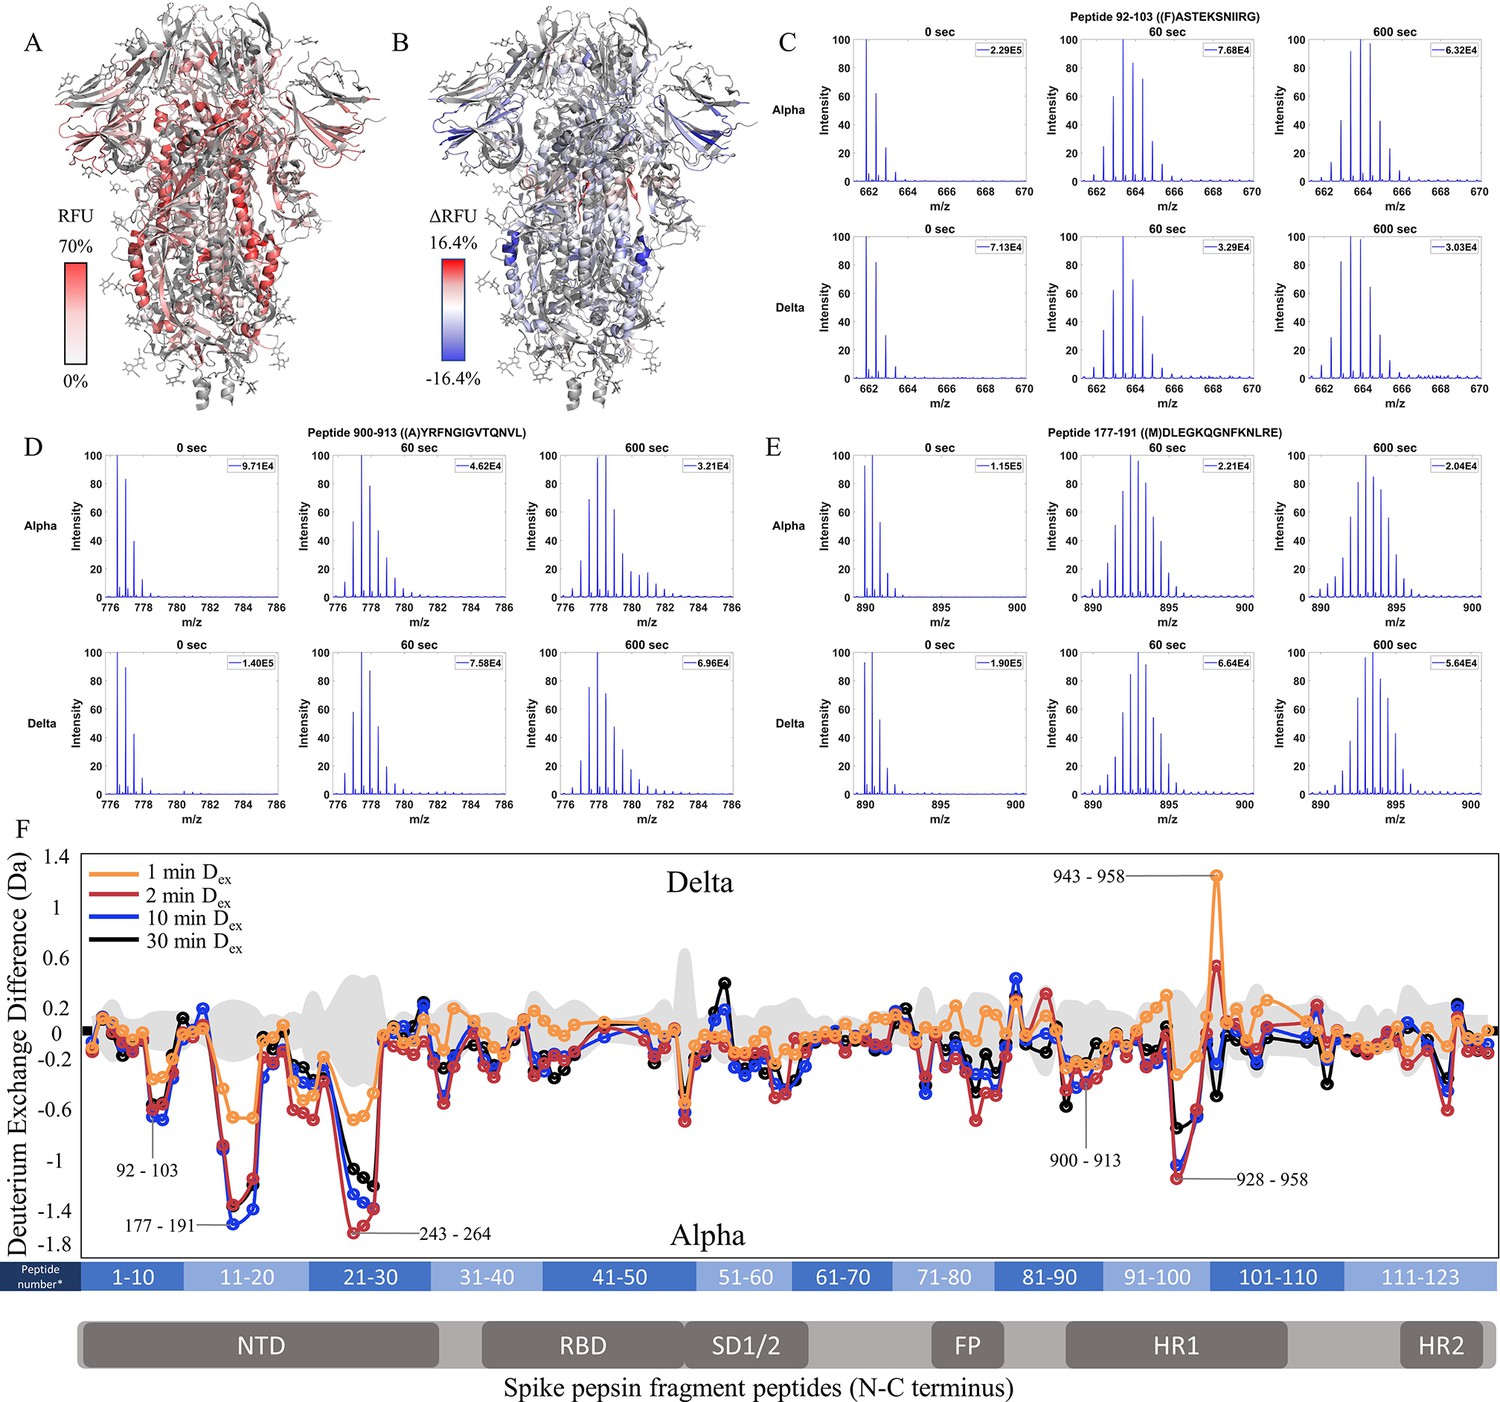
Increased stability at trimer stalk and decreased N-terminal domain (NTD) dynamics in Delta S.
(A) Relative fractional uptake (Dex = 10 min) for Delta S mapped onto a wild-type (WT) spike (S) protein structure with three down receptor-binding domain s (RBDs) (PDB ID: 6VXX) coverage maps shown in Figure 5—figure supplement 1). Deuterium exchange heat map (gradient of white (0%) -red (70%) as mapped on S structure (PDB ID: 6VXX). (B) Differences in deuterium exchange (ΔRFU) (Dex = 10 min) for Delta S minus Alpha S were mapped onto a WT S structure (PDB ID: 6VXX). Shades of blue correspond to negative differences in deuterium exchange and shades of red correspond to positive differences in deuterium exchange. (C–E) Stacked mass spectra for peptides 92–103, 177–191, and 900–913 with undeuterated reference spectra, 1 min and 10 min exchange (left to right). For each peptide, the top row contains spectra for Alpha S and the bottom row contains spectra for Delta S. Absolute intensities are indicated at the top right of each spectrum. (F) Differences in deuterium exchange (deuterons) mapped at peptide resolution from N to C terminus for Delta S minus Alpha S are shown in difference plots for 1-, 2-, 10-, and 30 min exchange. Select peptides showing significant differences in exchange are annotated. Significance was determined by hybrid significance testing (p<0.01, Figure 5—figure supplement 2). Differences are tabulated in Figure 5—source data 1 with corresponding peptide numbers* shown on the x-axis of the difference plot.
-
Figure 5—source data 1
Deuterium uptake differences for Delta S minus Alpha S.
- https://cdn.elifesciences.org/articles/82584/elife-82584-fig5-data1-v2.xlsx
-
Figure 5—source data 2
Source data for the volcano plot; Figure 5, Figure 5—figure supplement 2.
- https://cdn.elifesciences.org/articles/82584/elife-82584-fig5-data2-v2.xlsx
Figure 5—figure supplement 1
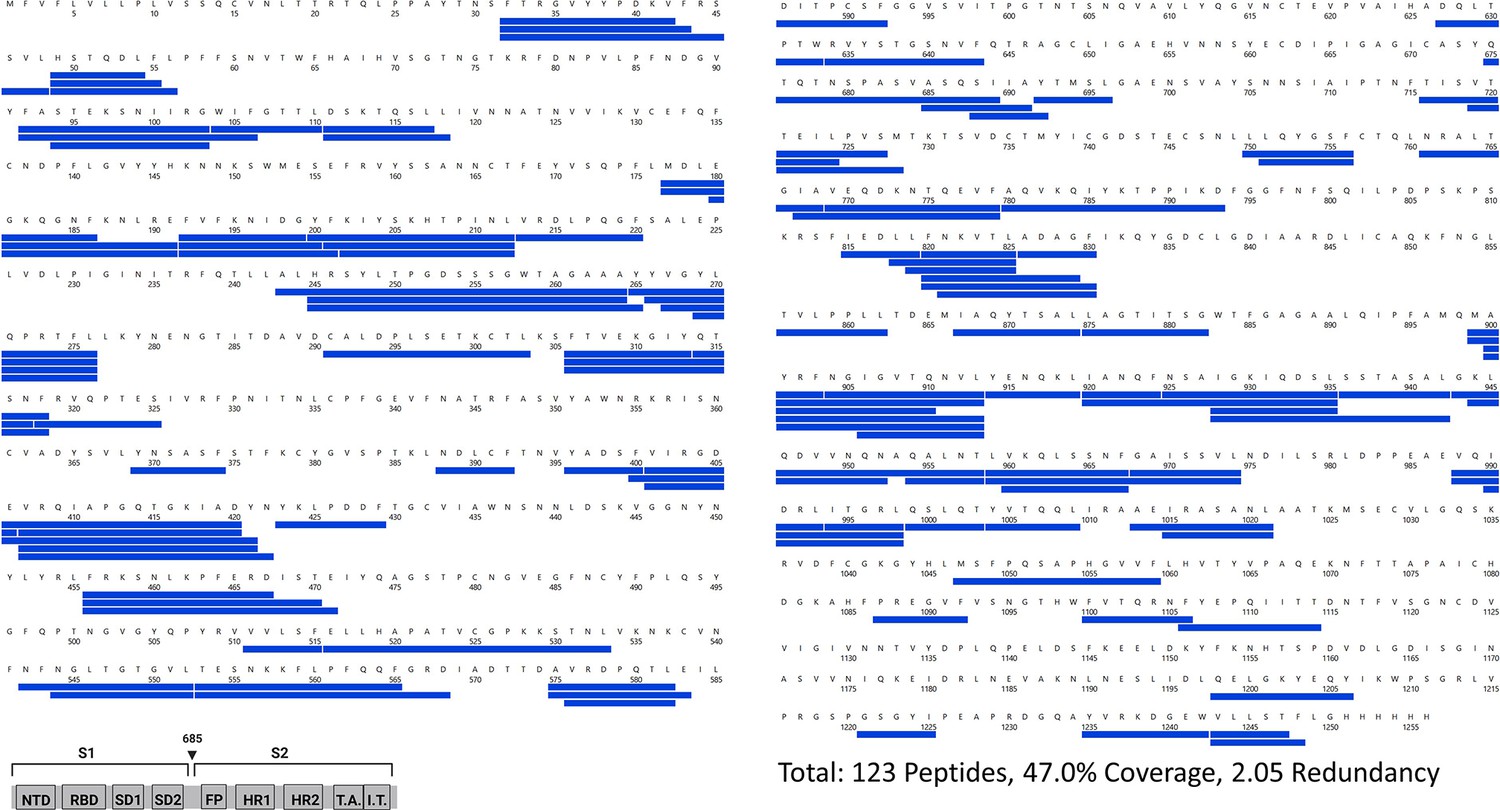
Primary sequence coverage map of pepsin fragment peptides for Delta S versus Alpha S.
Coverage map of Delta S compared to Alpha S using the D614G 2P sequence showing 123 peptides spanning 47.0% of the spike (S) protein. The domain organization of S is indicated.
Figure 5—figure supplement 2
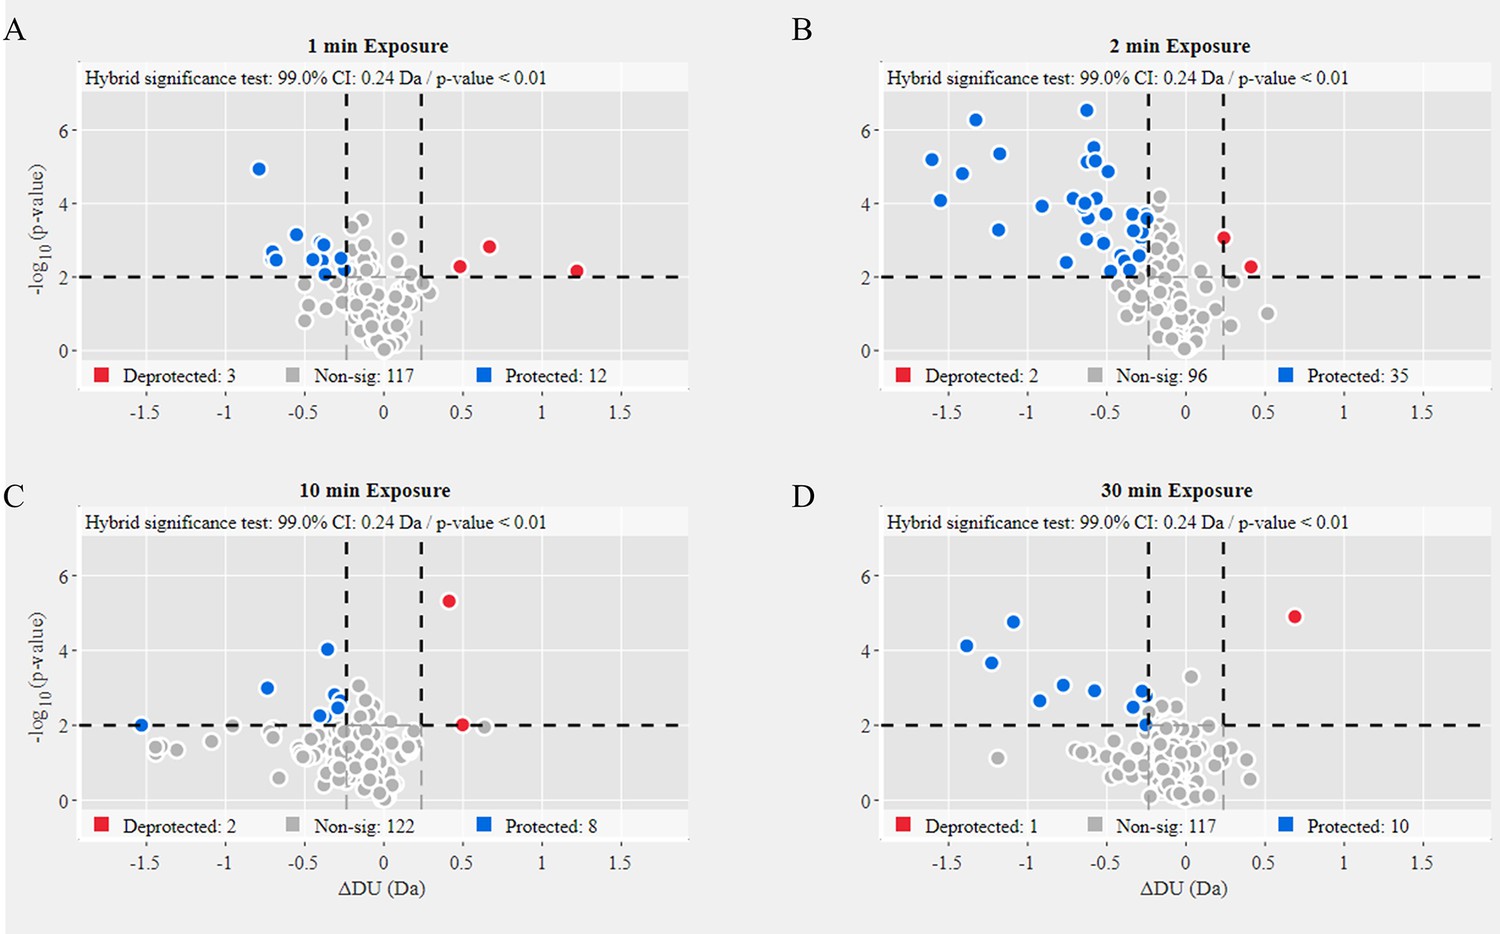
Volcano plot analysis of Delta variant S versus Alpha variant S.
Volcano plots for 1 min (A), 2 min (B), 10 min (C), and 30 min (D) exchange (Figure 5—source data 2). Significantly protected (blue) or deprotected (red) peptides were identified using a hybrid significance test and a p-value <0.01.
Figure 5—figure supplement 3
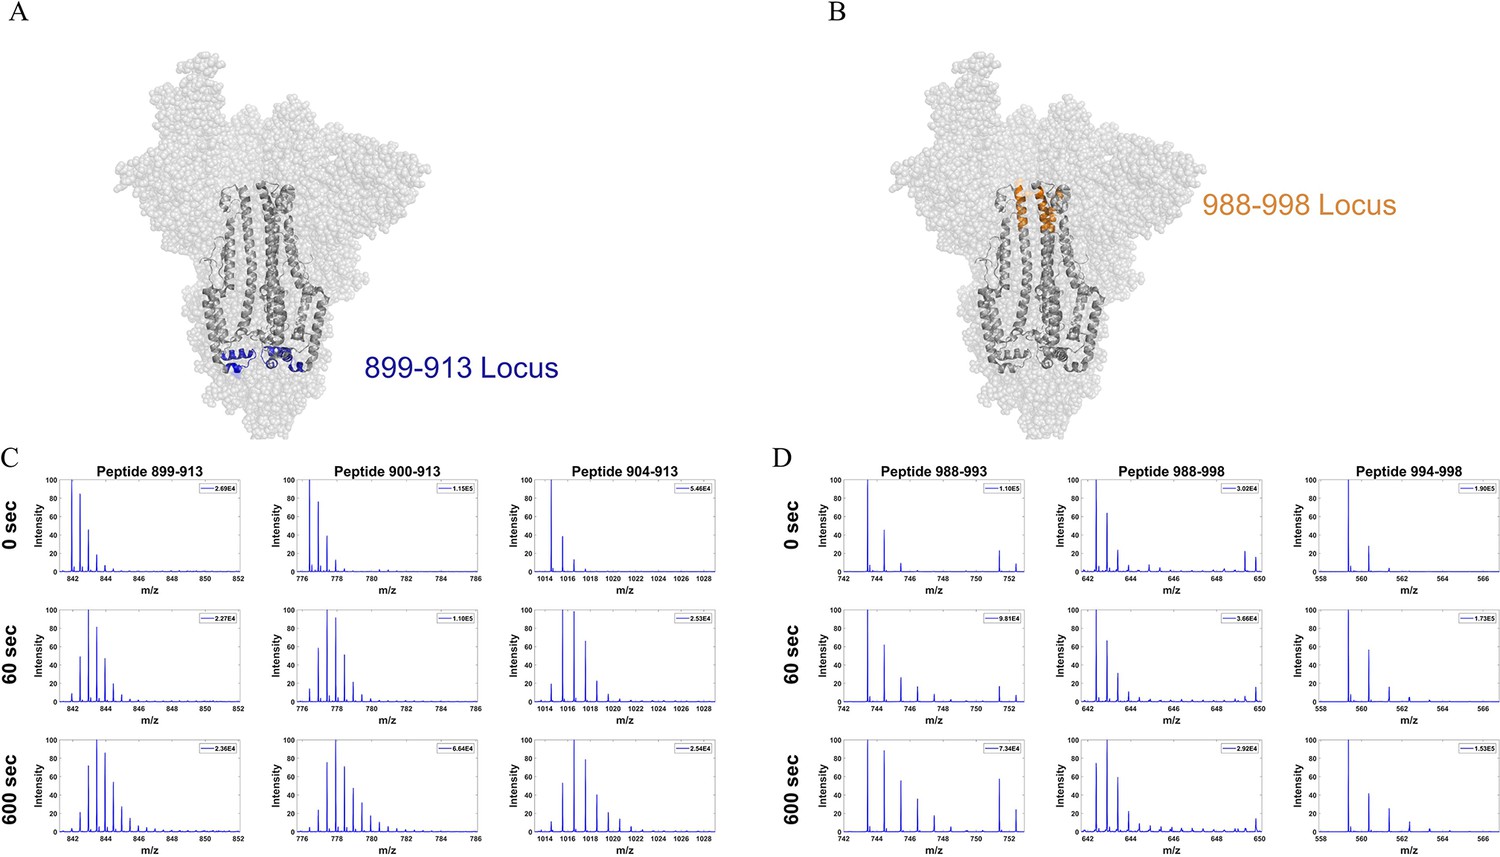
Mass spectra from overlapping peptides from two stalk loci in Delta S.
(A) Peptide locus 899–913 (blue) mapped onto the wild-type (WT) spike (S) protein structure (PDB ID: 7TGX). (B) Peptide locus 988–998 (orange) mapped onto WT S structure (PDB ID: 7TGX). (C) Spectra from three overlapping peptides in the 899–913 locus of Delta S. Reference state as well as spectra for 1 and 10 min exchange are shown from top to bottom for each peptide. (D) Spectra from three overlapping peptides in the 988–998 locus of Delta S. Reference state as well as spectra for 1 and 10 min exchange are shown from top to bottom for each peptide. Absolute intensities are indicated at the top right of each spectrum.
Figure 6 with 3 supplements
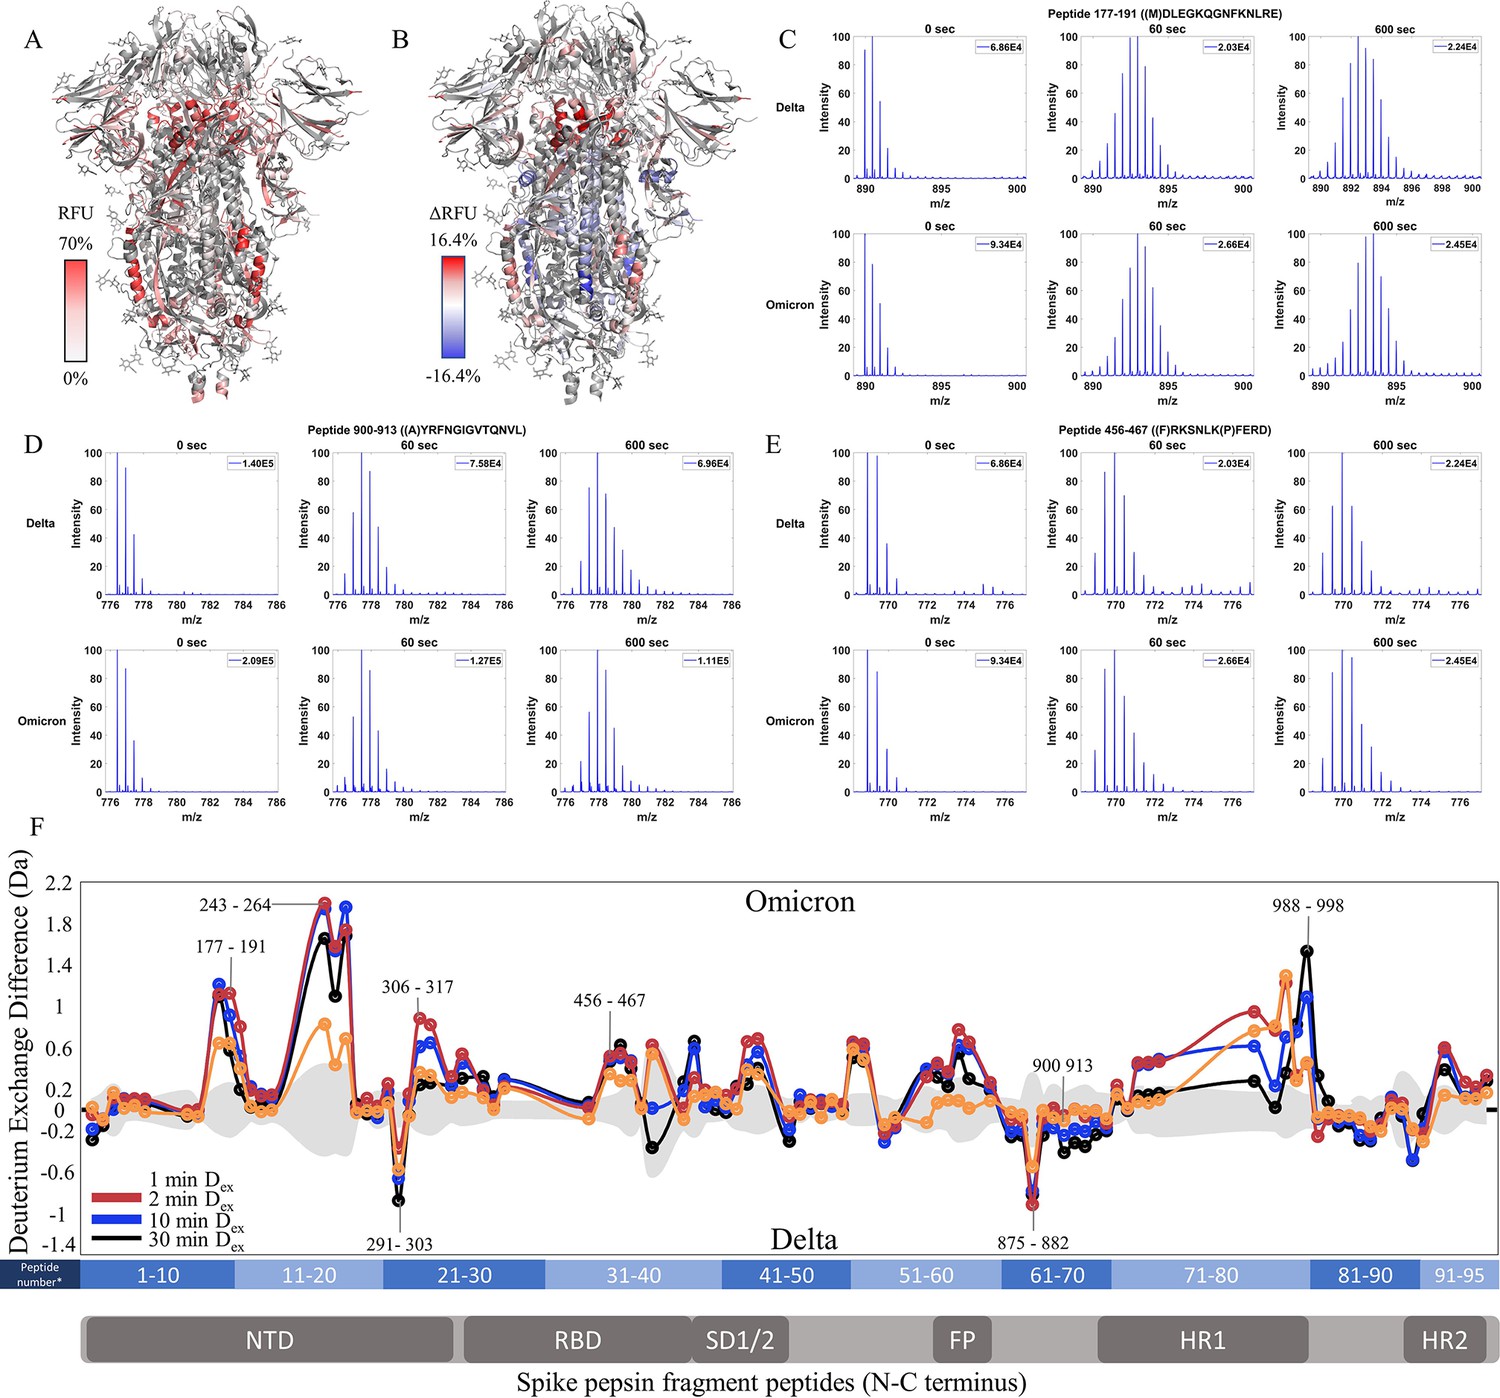
Enhanced trimer stability and N-terminal domain (NTD) dynamics in Omicron BA.1 S.
(A) Relative fractional uptake (Dex = 10 min) for Omicron BA.1 S mapped onto a wild-type (WT) spike (S) structure with three down receptor-binding domains (RBDs) (PDB ID: 6VXX) coverage maps shown in Figure 6—figure supplement 1). Deuterium exchange heat map (gradient of white (0%) -red (70%) as mapped on WT S structure (PDB ID: 6VXX). (B) Differences in deuterium exchange (ΔRFU) (Dex = 10 min) for Omicron BA.1 S minus Delta S were mapped onto a WT S structure (PDB ID: 6VXX). Shades of blue correspond to negative differences in deuterium exchange and shades of red correspond to a positive difference in deuterium exchange. (C–E) Stacked mass spectra for peptides 92–103, 177–191, and 900–913 with undeuterated reference spectra, 1 min, and 10 min exchange (left to right). For each peptide, the top row contains spectra for Delta S and the bottom row contains spectra for Omicron BA.1 S. Absolute intensities are indicated at the top right of each spectrum. (F) Differences in deuterium exchange (deuterons) mapped at peptide resolution from N to C terminus for Omicron BA.1 S minus Delta S are shown in difference plots for 1-, 2-, 10-, and 30 min exchange. Select peptides showing significant differences in exchange are annotated. Significance was determined by hybrid significance testing (p<0.01, Figure 6—figure supplement 2). Differences are tabulated in Figure 6—source data 1 with corresponding peptide numbers* shown on the x-axis of the difference plot.
-
Figure 6—source data 1
Deuterium uptake differences for Omicron BA.1 S minus Delta S.
- https://cdn.elifesciences.org/articles/82584/elife-82584-fig6-data1-v2.xlsx
-
Figure 6—source data 2
Source data for the volcano plot; Figure 6, Figure 6—figure supplement 2.
- https://cdn.elifesciences.org/articles/82584/elife-82584-fig6-data2-v2.xlsx
Figure 6—figure supplement 1
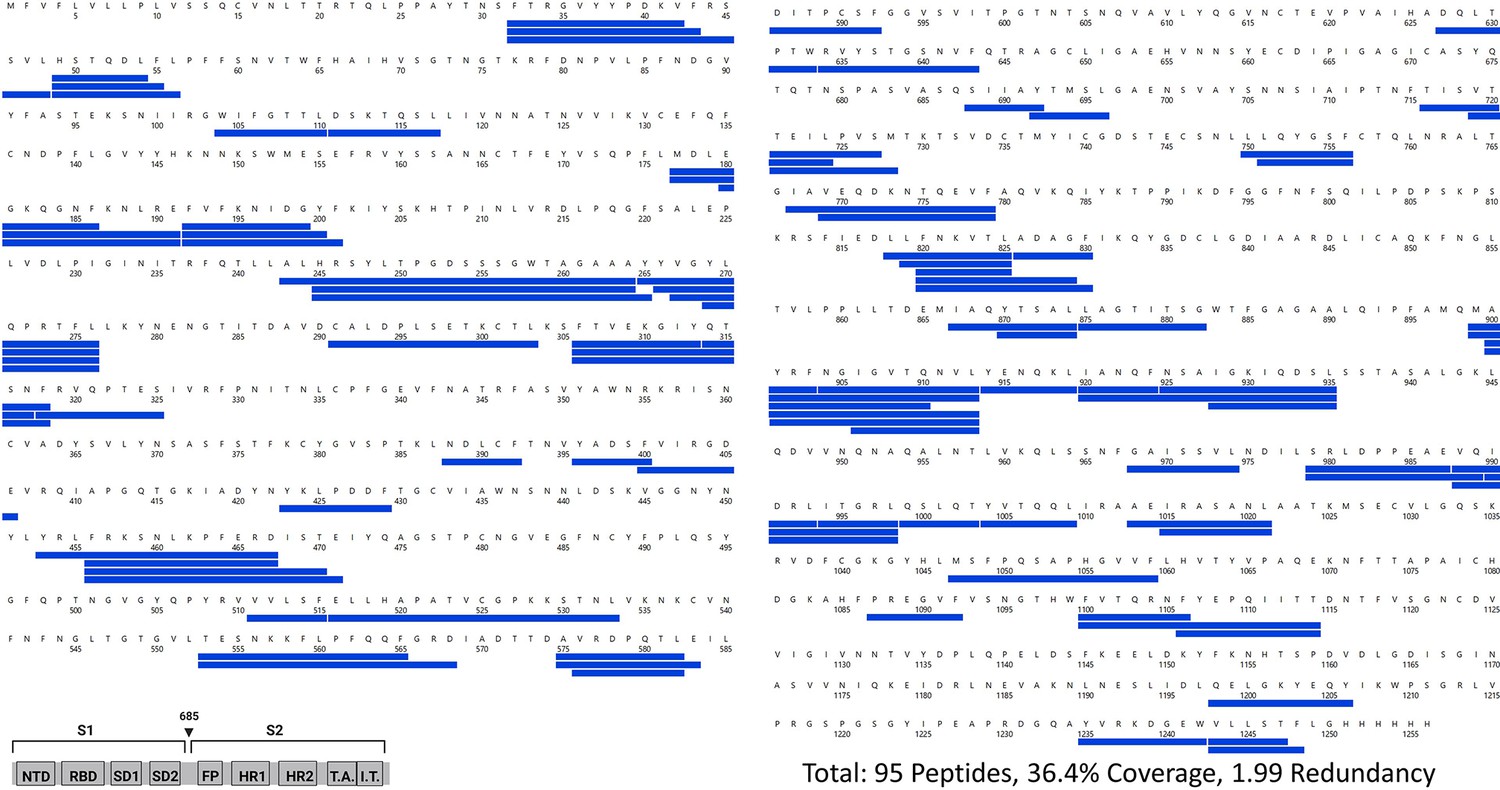
Primary sequence coverage map of pepsin fragment peptides for Omicron S versus Delta S.
Coverage map of Omicron S compared to Delta S using the D614G 2P sequence showing 95 peptides spanning 36.4% of the spike (S) protein. The domain organization of S is indicated.
Figure 6—figure supplement 2
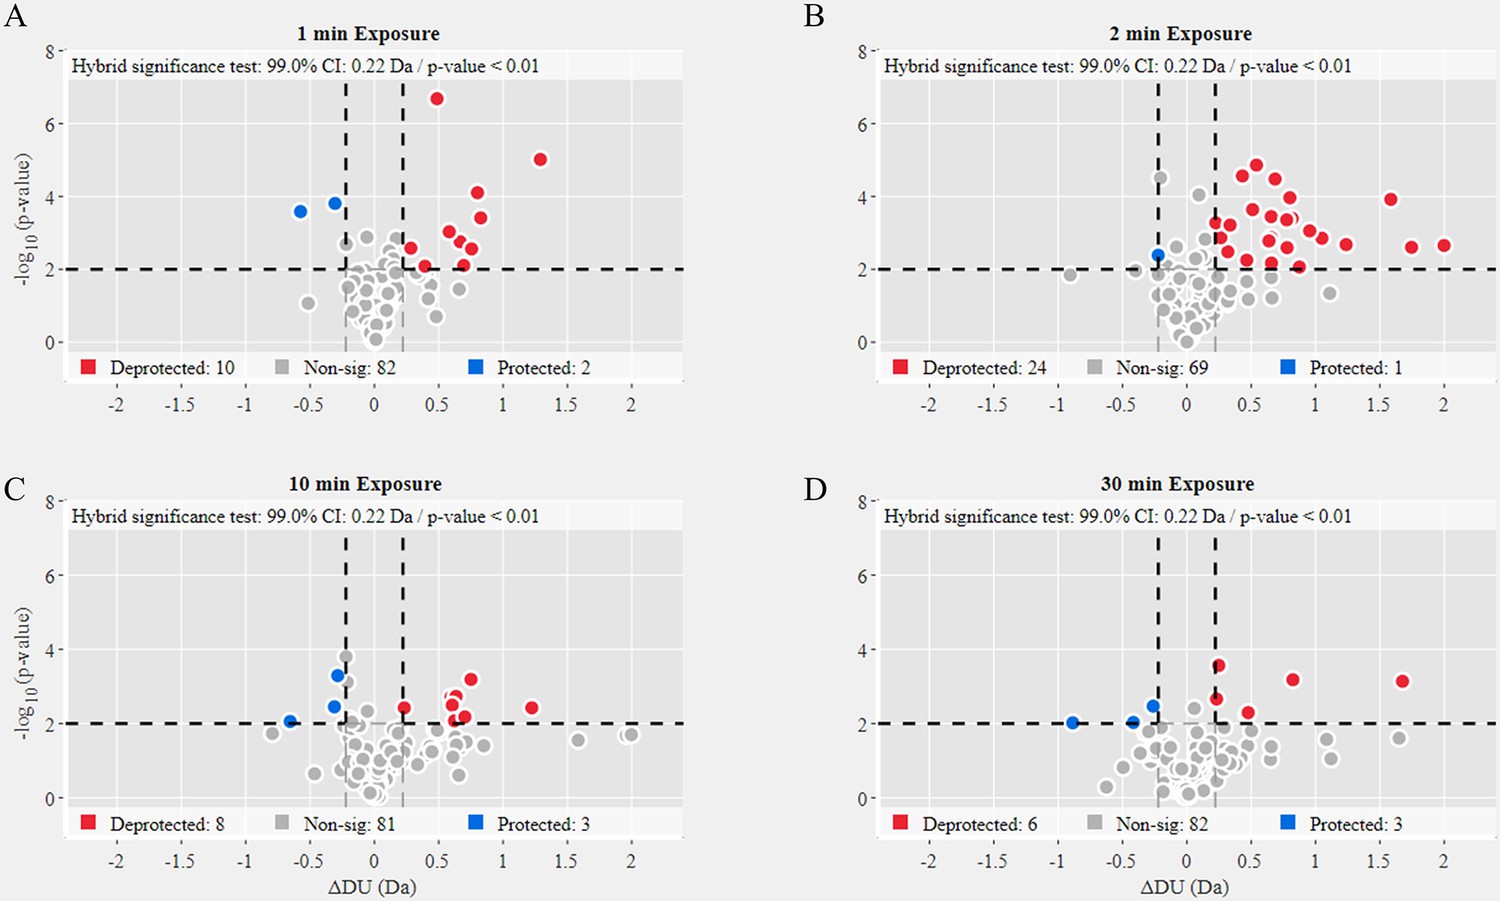
Volcano plot analysis of Omicron variant S versus Delta variant S.
Volcano plots for 1 min (A), 2 min (B), 10 min (C), and 30 min (D) exchange (Figure 6—source data 2). Significantly protected (blue) or deprotected (red) peptides were identified using a hybrid significance test and a p-value <0.01.
Figure 6—figure supplement 3
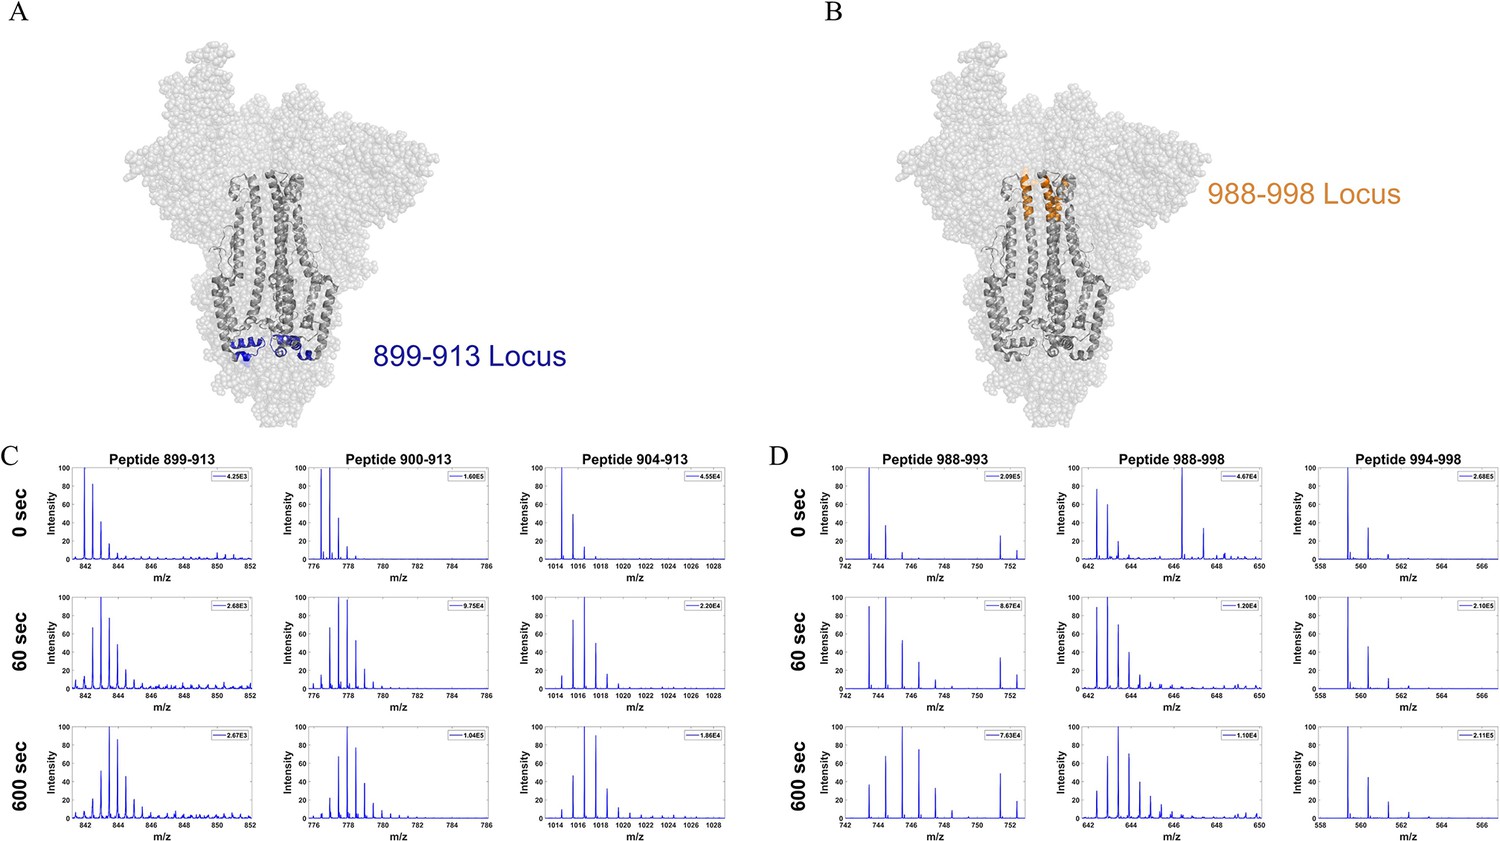
Mass spectral envelopes from overlapping peptides from two stalk loci in Omicron S.
(A) Peptide locus 899–913 (blue) mapped onto the wild-type (WT) spike (S) structure (PDB ID: 7TGX). (B) Peptide locus 988–998 (orange) mapped onto WT S structure (PDB ID: 7TGX). (C) Spectra from three overlapping peptides in the 899–913 locus of Omicron BA.1 S. Reference state as well as spectra for 1 and 10 min exchange are shown from top to bottom for each peptide. (D) Spectra from three overlapping peptides in the 988–998 locus of Omicron BA.1 S. Reference state as well as spectra for 1 and 10 min exchange are shown from top to bottom for each peptide. Absolute intensities are indicated at the top right of each spectrum.
Figure 7 with 3 supplements
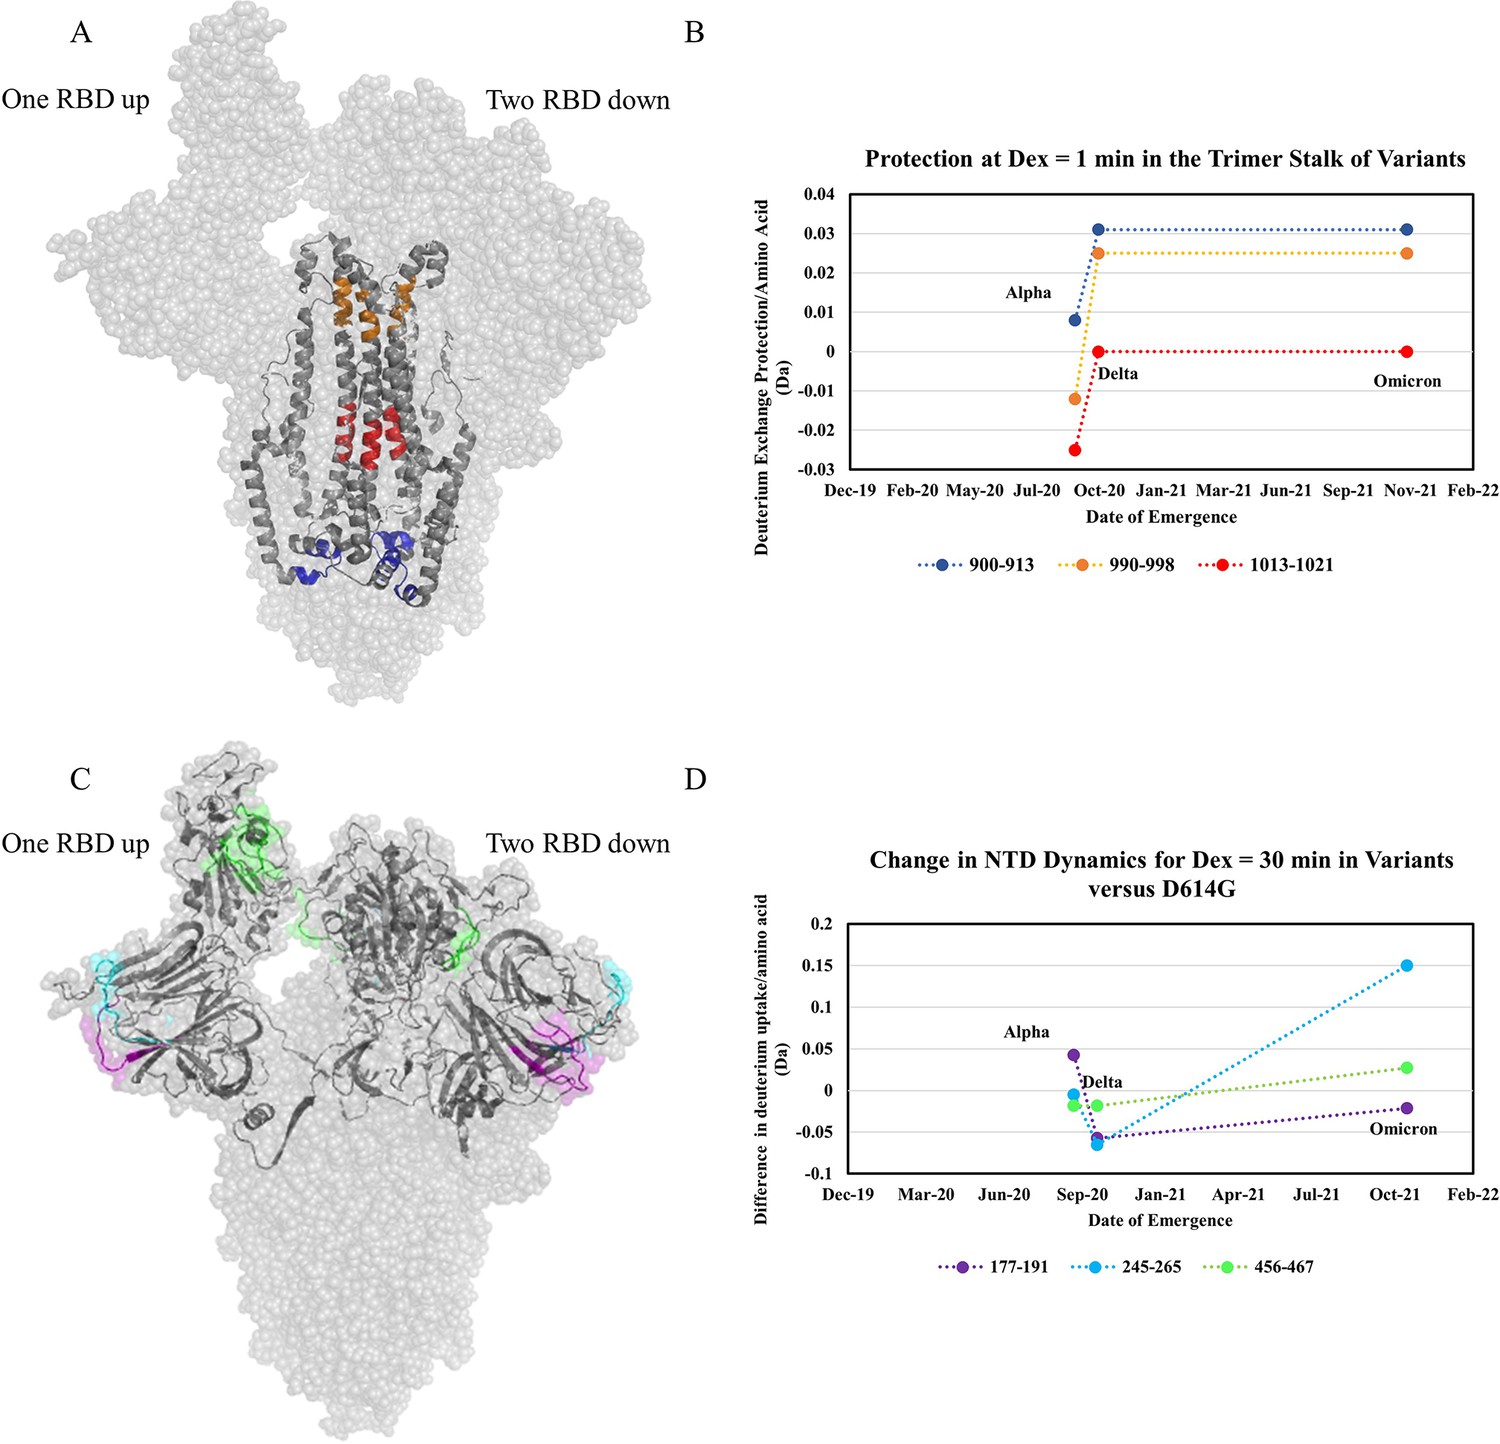
Increased trimer stability and altered N-terminal domain (NTD) dynamics correlate with the timeline of emergence.
(A) Trimer stalk peptides 900–913 (blue), 990–998 (orange), and 1013–1021 (red) mapped onto a wild-type (WT) spike (S) protein structure (PDB ID: 7TGX) (helical wheel analysis of stalk peptides shown in Figure 7—figure supplement 1). (B) Protection in trimer stalk peptides in S variants compared to D614G S plotted as protection per amino acid versus date of emergence at Dex = 1 min. (C) NTD and RBD peptides showing increased dynamics in the timeline of variant emergence mapped onto a 1 RBD ‘up’ WT S structure (PDB ID: 7TGX). Peptides 177–191, 245–265, and 456–467 are shown in purple, cyan, and green, respectively. (D) Changes in deuterium uptake for NTD and receptor-binding domain (RBD) peptides in variant S compared to D614G S at Dex = 30 min are plotted as a change in deuterium uptake versus date of emergence (additional plots in Figure 7—figure supplement 2). Uptake plots for representative peptides in all variants are shown in Figure 7—figure supplement 3.
Figure 7—figure supplement 1
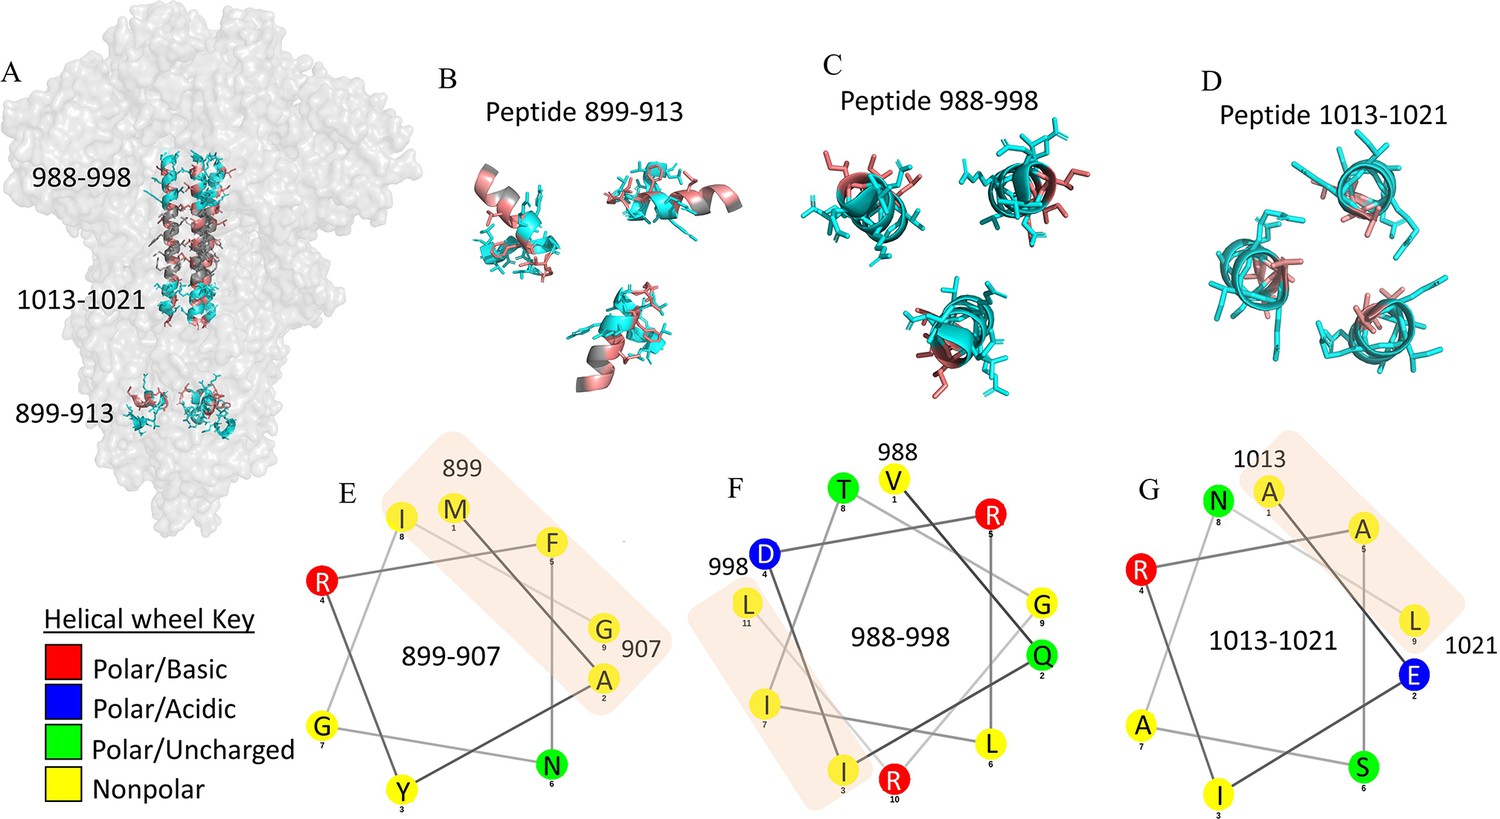
Hydrophobic interactions maintain trimer core at stalk region.
Hydrophobic interactions maintain trimer core at the stalk region (A) Structure of the spike (S) protein trimer highlighting stalk region in salmon (PDB ID: 6VXX). Selected hydrogen deuterium exchange mass spectrometry (HDXMS) analysis peptides at the top, middle and bottom of the trimer stalk are colored cyan. (B, C, D) Cross-sectional view of peptides in the S trimer stalk are colored cyan. Hydrophobic residues are colored salmon. (E, F, G) Helical wheel representation of peptides classifying residues based on polarity. Hydrophobic patches are shown by orange rectangle.
Figure 7—figure supplement 2
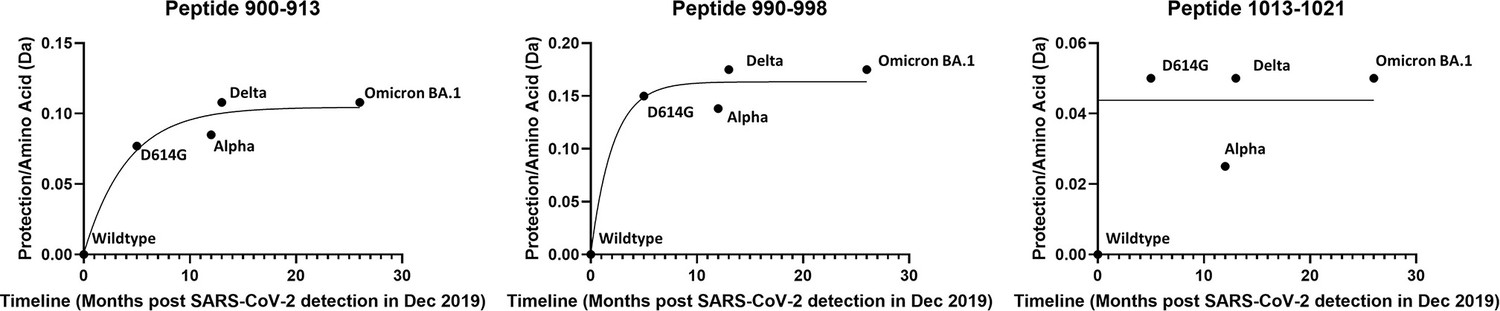
Plot of protection in spike (S) protein trimer stalk peptides as function of timeline of emergence.
Protection for each peptide was determined by subtracting deuterium uptake for each variant from wild-type (WT) and normalizing to the number of exchangeable amino acids. Protection is plotted against months after the first identification of SARS-CoV-2 in Dec. 2019 and curves fit to a one phase association (Graphpad Prism 3.0, San Diego CA).
Figure 7—figure supplement 3
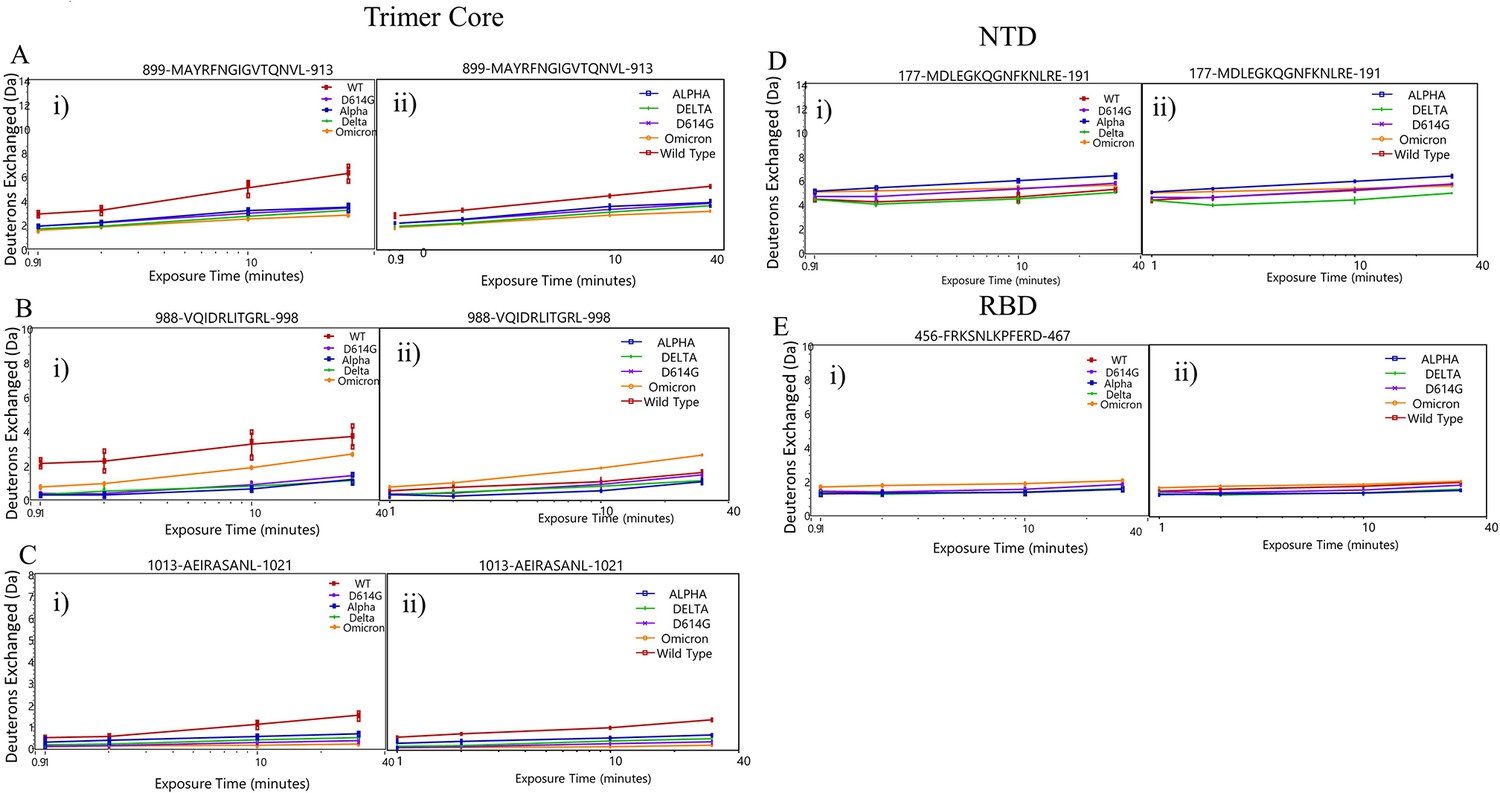
Deuterium uptake plots comparing all spike (S) protein variants.
Uptake plots showing incubated wild-type (WT) (red), D614G (purple), Alpha (blue), Delta (green), and Omicron BA.1 (orange) for peptides 899–913 (A), 988–998 (B), 1013–1021 (C), 177–191 (D), 456–467 (E).
Additional files
-
Supplementary file 1
Glycosylation profile of SARS-CoV-2 S variants.
N-linked glycans were identified by mass spectrometry. The number of glycans identified at each site and an example glycan are reported.
- https://cdn.elifesciences.org/articles/82584/elife-82584-supp1-v2.docx
-
Supplementary file 2
HDXMS analysis of mutated peptides.
Differences between variants and D614G S for mutated peptides reported in Da for Dex = 1, 2, 10, and 30 min exchange. Mutations sites are bolded and underlined.
- https://cdn.elifesciences.org/articles/82584/elife-82584-supp2-v2.docx
-
Supplementary file 3
Summary of HDXMS conditions.
Experimental conditions and coverage for HDXMS analysis of WT and variant S.
- https://cdn.elifesciences.org/articles/82584/elife-82584-supp3-v2.docx
-
MDAR checklist
- https://cdn.elifesciences.org/articles/82584/elife-82584-mdarchecklist1-v2.pdf
Download links
A two-part list of links to download the article, or parts of the article, in various formats.
Downloads (link to download the article as PDF)
Open citations (links to open the citations from this article in various online reference manager services)
Cite this article (links to download the citations from this article in formats compatible with various reference manager tools)
Timeline of changes in spike conformational dynamics in emergent SARS-CoV-2 variants reveal progressive stabilization of trimer stalk with altered NTD dynamics
eLife 12:e82584.
https://doi.org/10.7554/eLife.82584


