Two neuronal peptides encoded from a single transcript regulate mitochondrial complex III in Drosophila
- Department of Genetics, Blavatnick Institute, Harvard Medical School, United States
- Department of Molecular and Human Genetics, Baylor College of Medicine, United States
- Lawrence Berkeley National Laboratory, United States
- Jan and Dan Duncan Neurological Research Institute, Texas Children’s Hospital, United States
- Department of Neuroscience, Baylor College of Medicine, United States
- Howard Hughes Medical Institute, United States
Figures
Figure 1 with 1 supplement
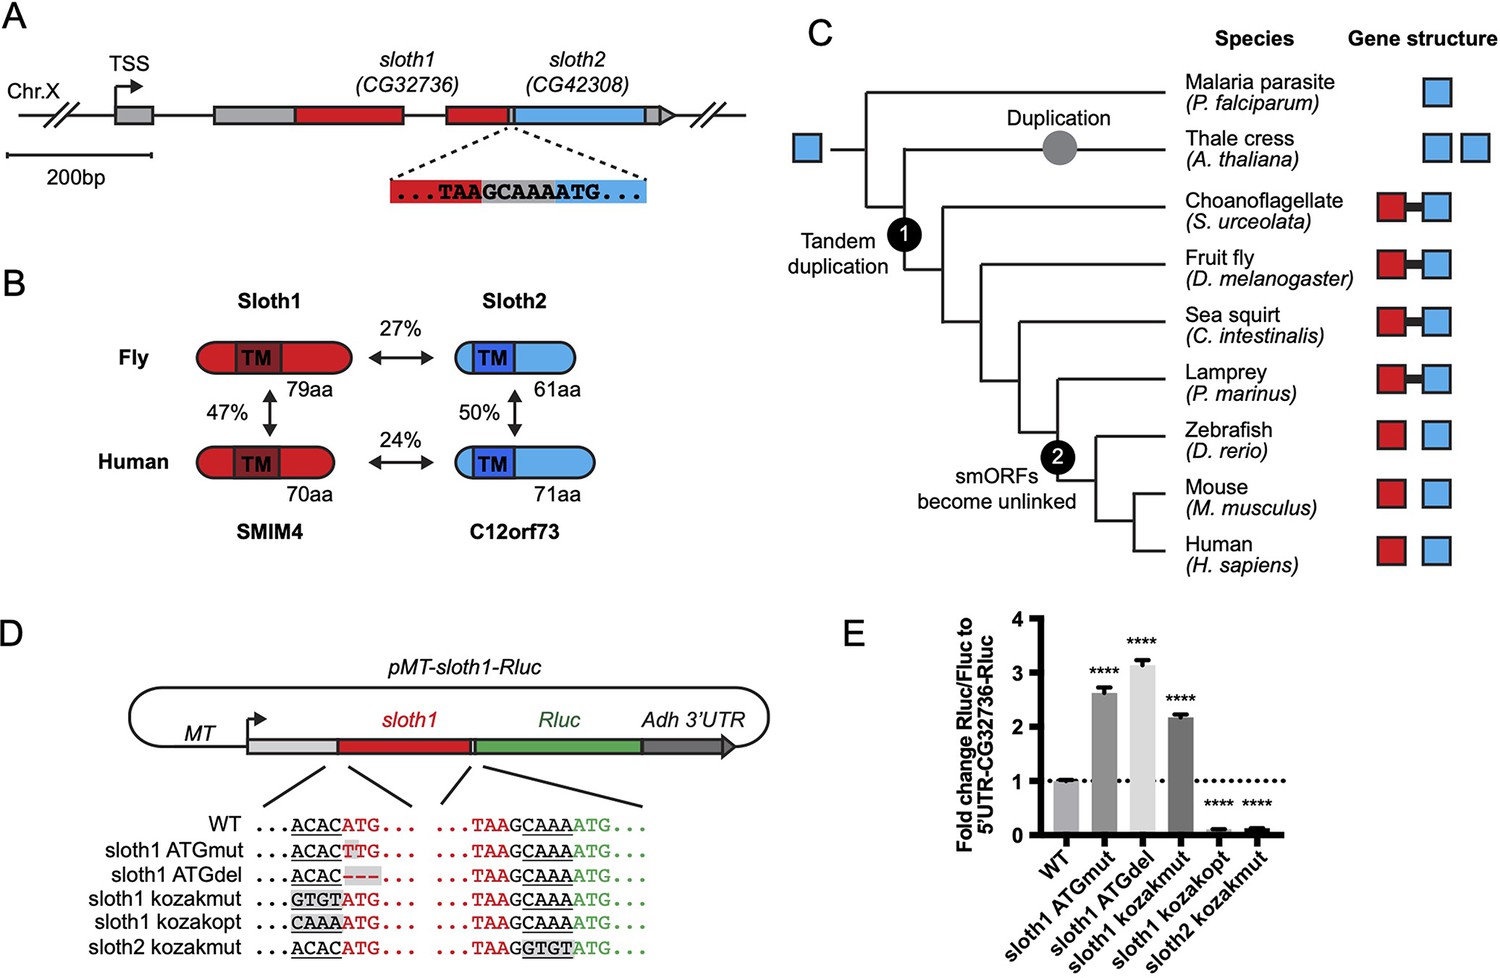
Bicistronic gene structure of the smORFs sloth1 and sloth2.
(A) Bicistronic gene model for sloth1 and sloth2. Zoom in shows intervening sequence (GCAAA) between sloth1 stop codon and sloth2 start codon. (B) Comparison of protein structure, amino acid length size, and amino acid percent identity between Drosophila and Human orthologs. Shaded rectangle indicates predicted transmembrane (TM) domain. (C) Phylogenetic tree of sloth1 and sloth2 orthologs in representative eukaryotic species. Linked gene structure (candidate bicistronic transcript or adjacent separate transcripts) is indicated by a black line connecting red and blue squares. (D) Plasmid reporter structure of pMT-sloth1-Rluc and derivatives. Kozak sequences upstream of start codon are underlined. Mutations indicated with shaded grey box. pMT = Metallothionein promoter. RLuc = Renilla Luciferase. (E) Quantification of RLuc luminescence/Firefly Luciferase, normalized to pMT-sloth1-Rluc, for each construct. Significance of mutant plasmid luminescence was calculated with a T-Test comparing to pMT-sloth1-Rluc. Error bars are mean with SEM. **** p≤0.0001. N=4 biological replicates.
Figure 1—figure supplement 1
Related to Figure 1.
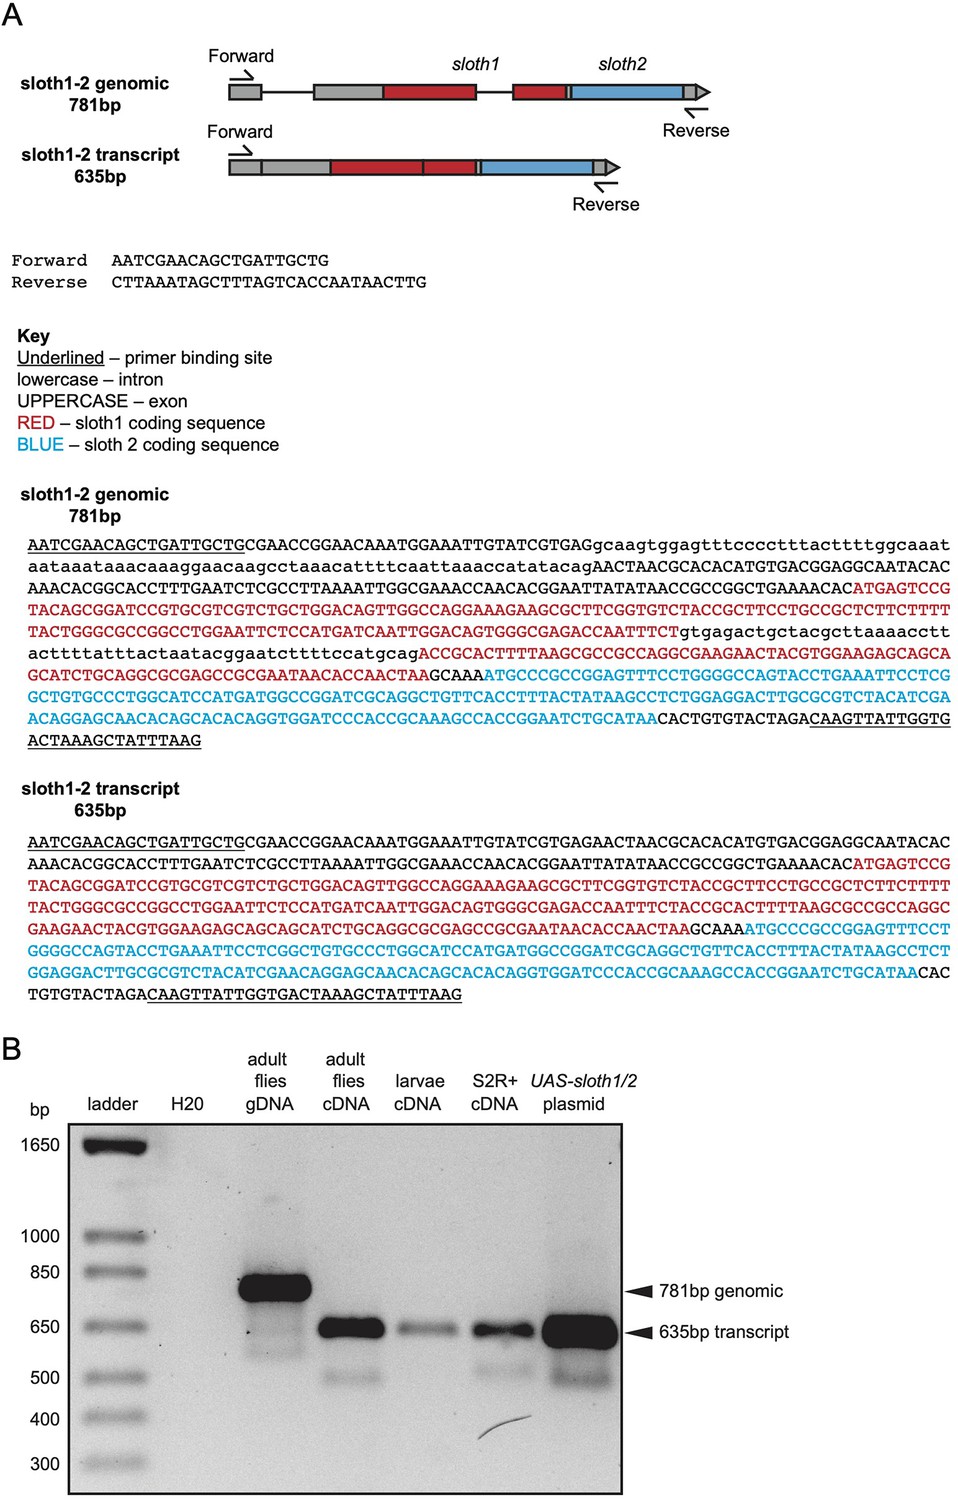
(A) Comparison of gene and transcript structure of the sloth1 and sloth2 open-reading frames. A common primer pair is used to distinguish genomic from cDNA (transcript) template by PCR. Sequence of sloth1-2 genomic and sloth1-2 transcript region provided. (B) DNA gel image of PCR fragments amplified from indicated template samples. Predicted spliced transcript containing both sloth1 and sloth2 open-reading frames is amplified from cDNA generated from adult flies, 3rd instar larvae, and S2R+ cells.
Figure 2 with 1 supplement
sloth1 and sloth2 loss of function analysis.
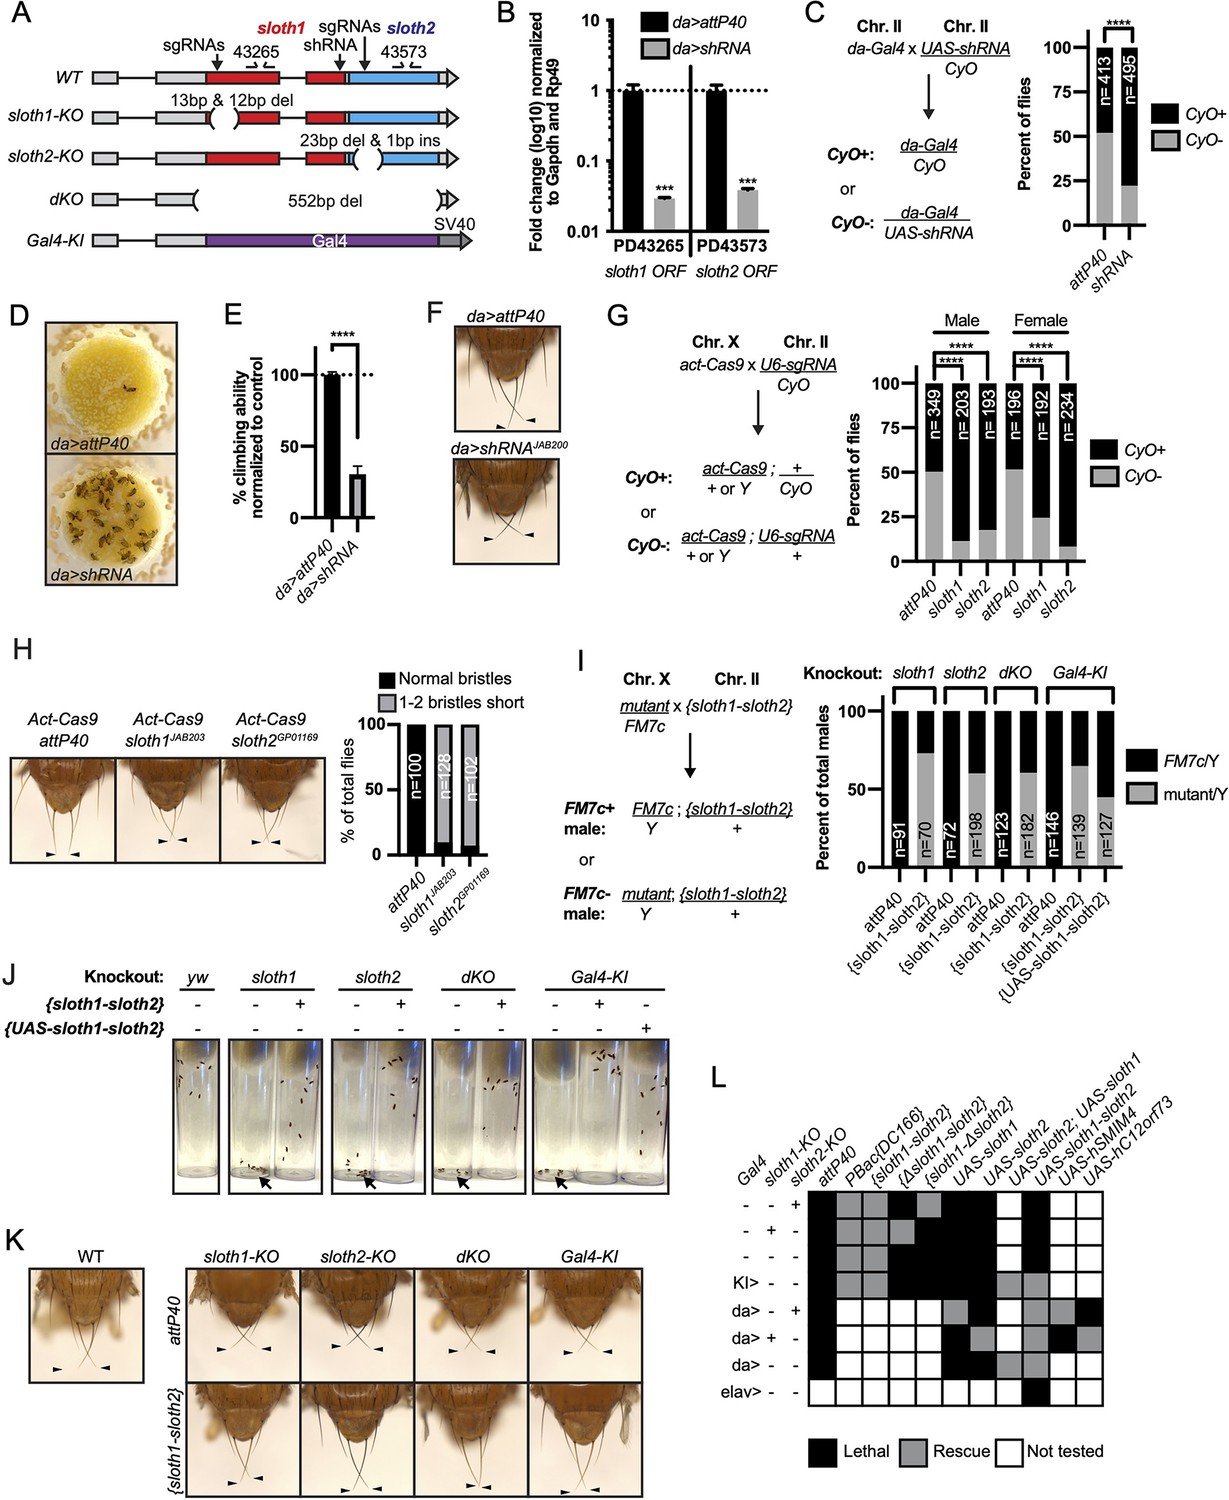
(A)sloth1-sloth2 transcript structure with shRNA and sgRNA target locations, primer binding sites, in/del locations, and knock-in Gal4 transgene. (B) qPCR quantification of RNAi knockdown of the sloth1-sloth2 transcript. Significance of fold change knockdown was calculated with a T-Test comparing to da>attP40 for PD43265 and PD43573. Error bars show mean with SEM. p-values *** p≤0.001. N=6. (C) Quantification of adult fly viability from sloth1-sloth2 RNAi knockdown. Fly cross schematic (left) and graph (right) with percentage of progeny with or without the CyO balancer. Ratios of balancer to non-balancer were analyzed by Chi square test, **** p≤0.0001. Sample size (N) indicated on graph. (D) Pictures of fly food vials, focused on the surface of the food. da>shRNA flies are frequently found stuck in the fly food. (E) Quantification of adult fly climbing ability after sloth1 and sloth2 RNAi. Significance calculated with a T-test, **** p≤0.0001. Error bars show mean with SD. N=3 biological replicates. (F) Stereo microscope images of adult fly thorax to visualize the scutellar bristles. RNAi knockdown by da-Gal4 crossed with either attP40 or UAS-shRNAJAB200. Arrowheads point to the two longest scutellar bristles. (G) Quantification of adult fly viability from sloth1-sloth2 somatic knockout. Fly cross schematic (left) and graph (right) with percentage of progeny with or without the CyO balancer. Ratios of balancer to non-balancer were analyzed by Chi square test, **** p≤0.0001. Sample size (N) indicated on graph. (H) (Left) Stereo microscope images of adult fly thorax to visualize the scutellar bristles. Somatic knockout performed by crossing Act-Cas9 to sgRNAs. (Right) Quantification of the frequency of adult flies with at least one short scutellar bristle after somatic KO of sloth1 or sloth2. Sample sizes indicated on graph. Arrowheads point to the two longest scutellar bristles. (I) Quantification of adult fly viability from sloth1-sloth2 hemizygous knockout in males and rescue with a genomic transgene or UAS-sloth1-sloth2 transgene. Fly cross schematic (left) and graph (right) with percentage of male progeny with or without the FM7c balancer. Sample size (N) indicated on graph. (J) Still images from video of adult flies inside plastic vials. Images are 5 s after vials were tapped. Adult flies climb upward immediately after tapping. All flies are males. Each vial contains 10 flies, except dKO, which contains five flies. (K) Stereo microscope images of adult male fly thorax to visualize the scutellar bristles. attP40 is used as a negative control. Arrowheads point to the two longest scutellar bristles. (L) Hemizygous mutant male genetic rescue experiments.
Figure 2—figure supplement 1

Related to Figure 2.
(A) Extended gene structure of sloth1 and sloth2 and genetic reagents. (B) Sequence analysis of KO, dKO, and Gal4-KI alleles. (C) (Left) Diagram of HDR knock-in of Gal4 into the sloth1-sloth2 locus. (Right) DNA gel confirming Gal4 knock-in by PCR primers that flank the homology arms. Expected DNA fragment size in parenthesis.
Figure 3
sloth1-sloth2 are expressed in neurons.
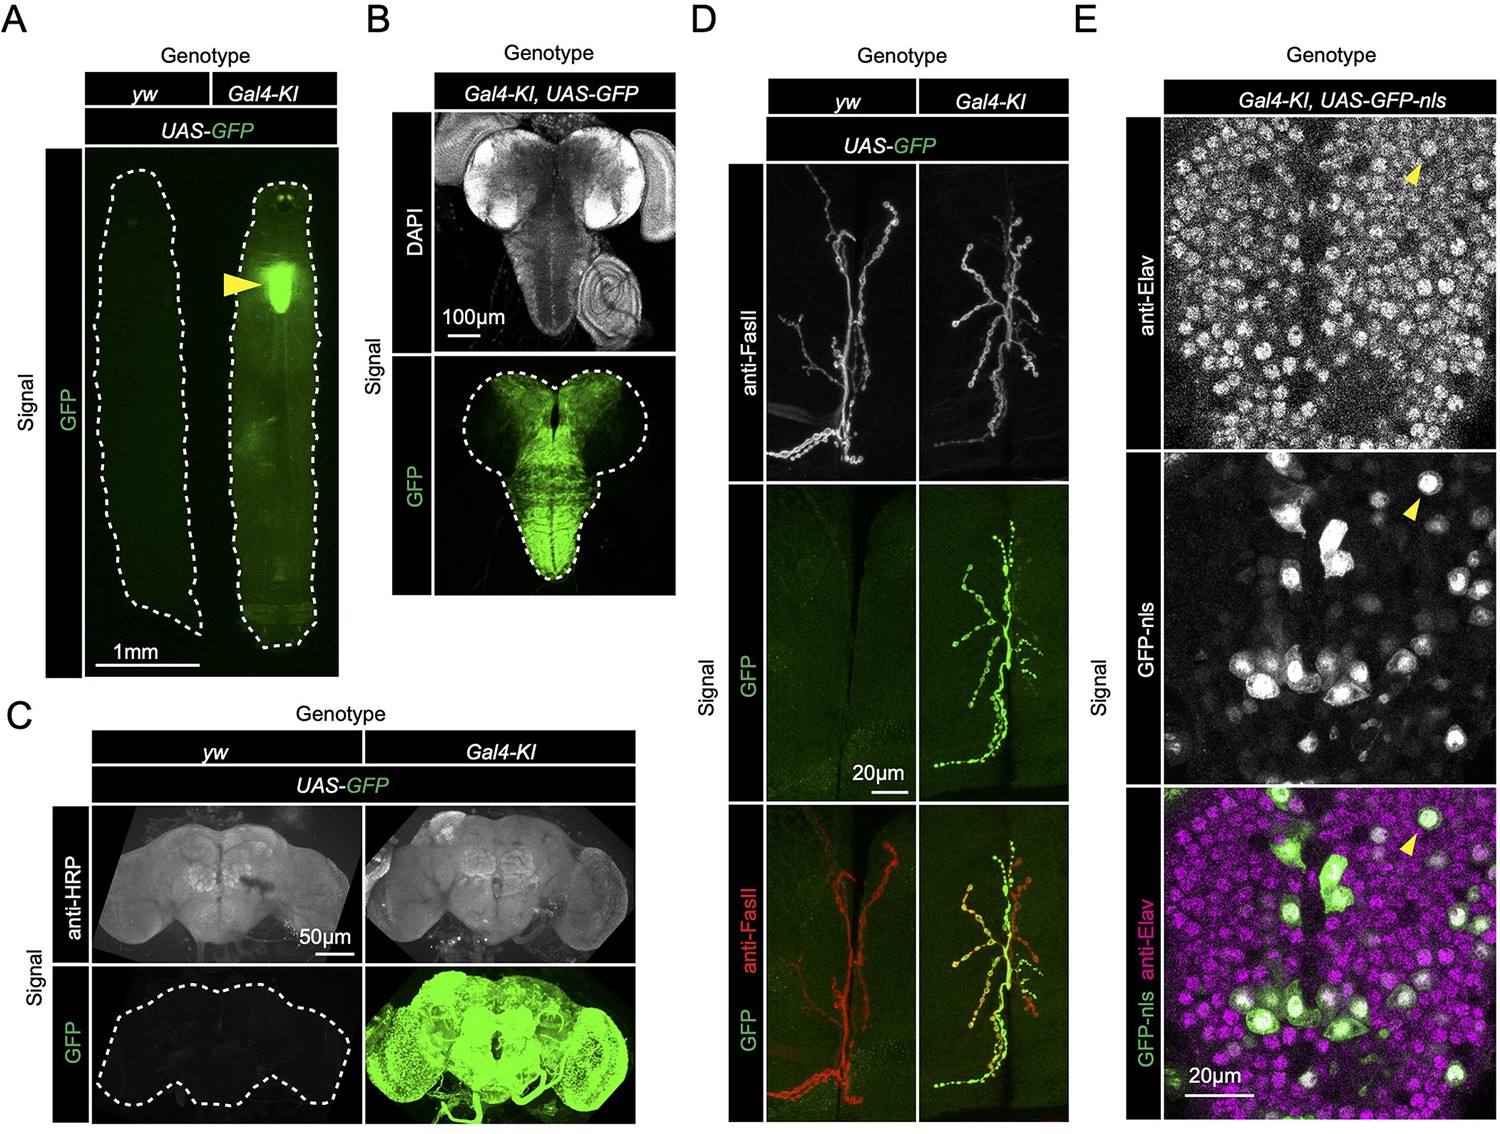
(A) Fluorescent stereo microscope images of 3rd instar larvae expressing GFP with indicated genotypes. (B) Fluorescent compound microscope image of 3rd instar larval brain expressing UAS-GFP. DAPI staining labels nuclei. (C) Confocal microscopy of adult brain with indicated genotypes. Anti-HRP staining labels neurons. (D) Confocal microscopy of the 3rd instar larval NMJ at muscle 6/7 segment A2 expressing UAS-GFP. Anti-FasII staining labels the entire NMJ. (E) Confocal microscopy of the 3rd instar larval ventral nerve cord (VNC) expressing Gal4-KI, UAS-GFP-nls. GFP-nls is localized to nuclei. Anti-Elav stains nuclei of neurons. Arrow indicates example nuclei that expresses UAS-GFP and is positive for Elav.
Figure 4 with 1 supplement
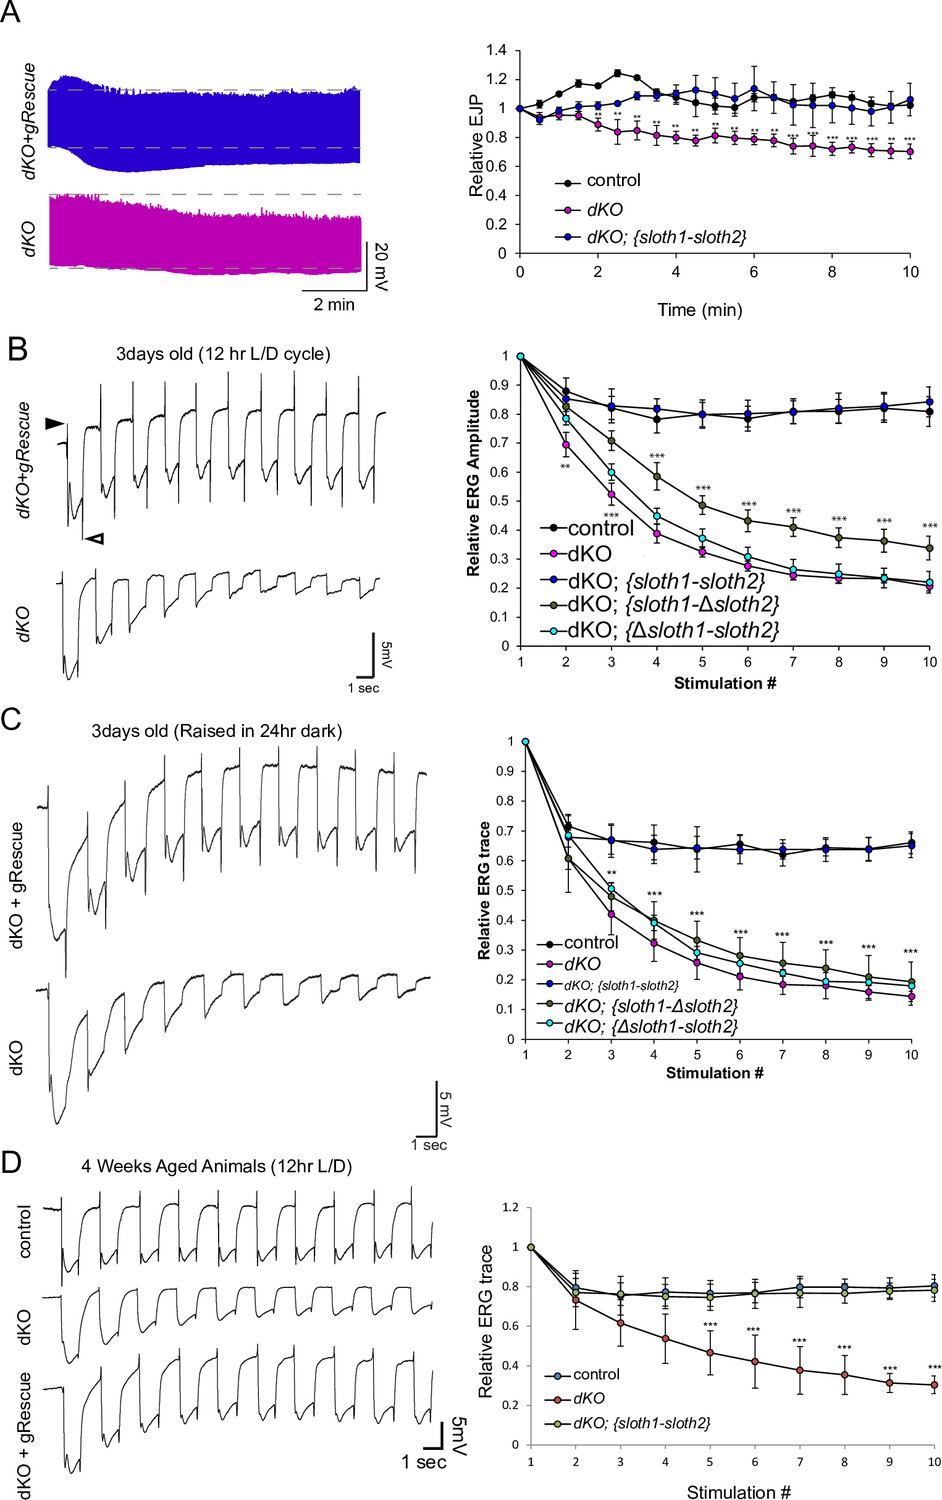
sloth1-sloth2 are important for neuronal function.
(A) Traces of electrical recordings from 3rd instar larval NMJ in control, dKO, and dKO + genomic rescue animals over 10 min under high-frequency stimulation (10 Hz). Graph on right is a quantification of the relative excitatory junction potential (EJP) for indicated genotypes. Error bars show mean with SD. N≥5 larvae per genotype. Significance for each genotype was calculated with a T-Test comparing to control flies. (B–D) Traces of electroretinogram (ERG) recordings from adult eye photoreceptors upon repetitive stimulation with light (left) and quantification of the relative ERG amplitude for indicated genotypes (right). Error bars show mean with SD. N≥6 larvae per genotype. ** p≤0.01, *** p≤0.001. Significance for each genotype was calculated with a T-Test comparing to control flies. (B) Recordings were taken from 1 to 3 days post-eclosion animals that were raised in a 12 hr light/dark cycle. ‘On’ and ‘Off’ transients indicated by closed and open arrowhead, respectively. (C) Recordings were taken from 1 to 3 days post-eclosion animals that were raised in a 24 hr dark. (D) Recordings were taken from four week aged animals that were raised in a 12 hr light/dark cycle.
Figure 4—figure supplement 1
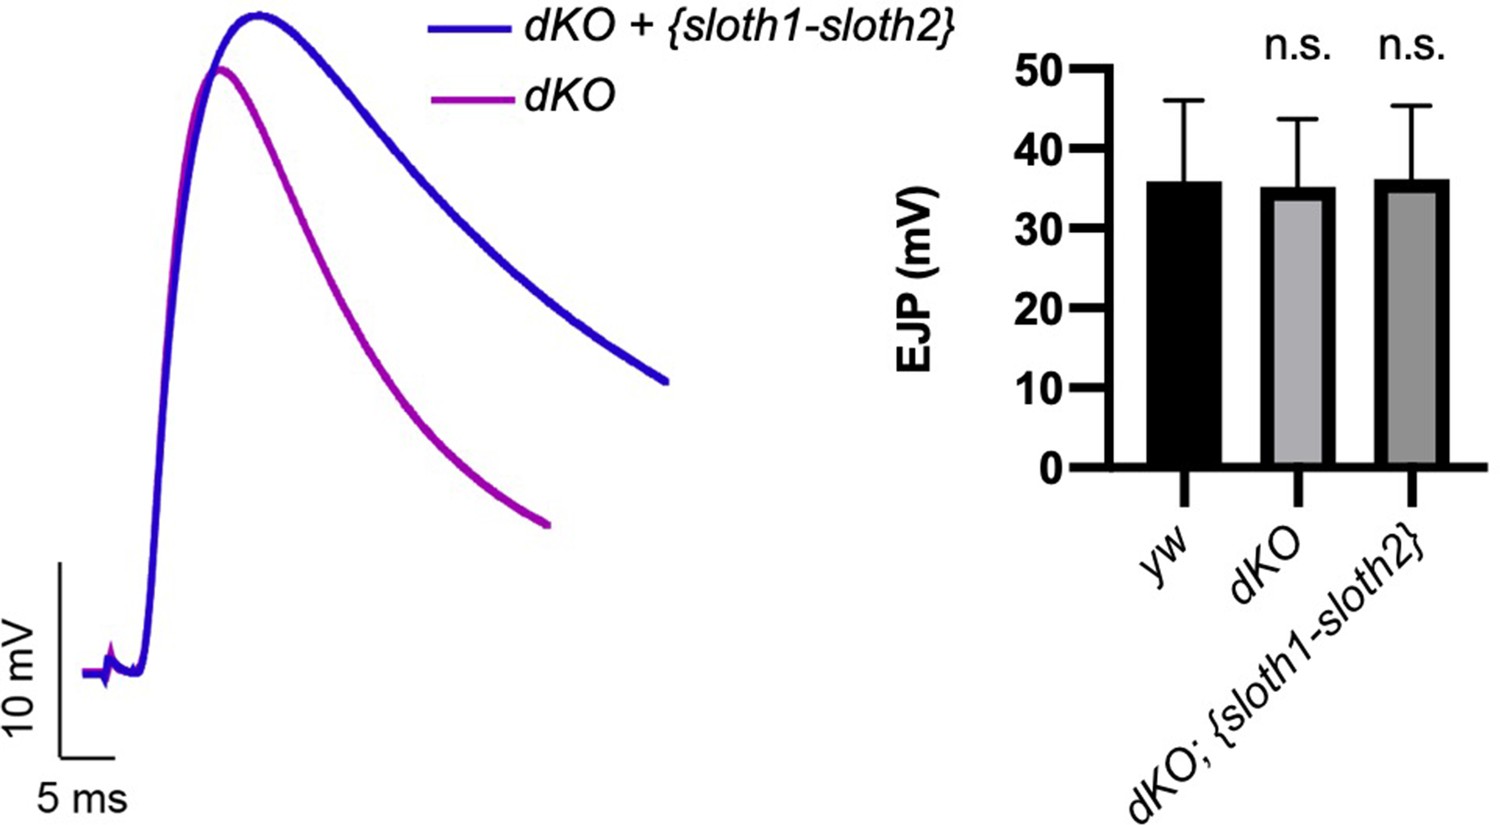
Related to Figure 4.
Traces of electrical recordings from 3rd instar larval NMJ in dKO, and dKO +genomic rescue animals. Graph on right is a quantification of the excitatory junction potential (EJP) for indicated genotypes. Significance was calculated with a T-Test compared to the yw control sample. Error bars show mean with SD. N≥5 larvae per genotype.
Figure 5 with 3 supplements
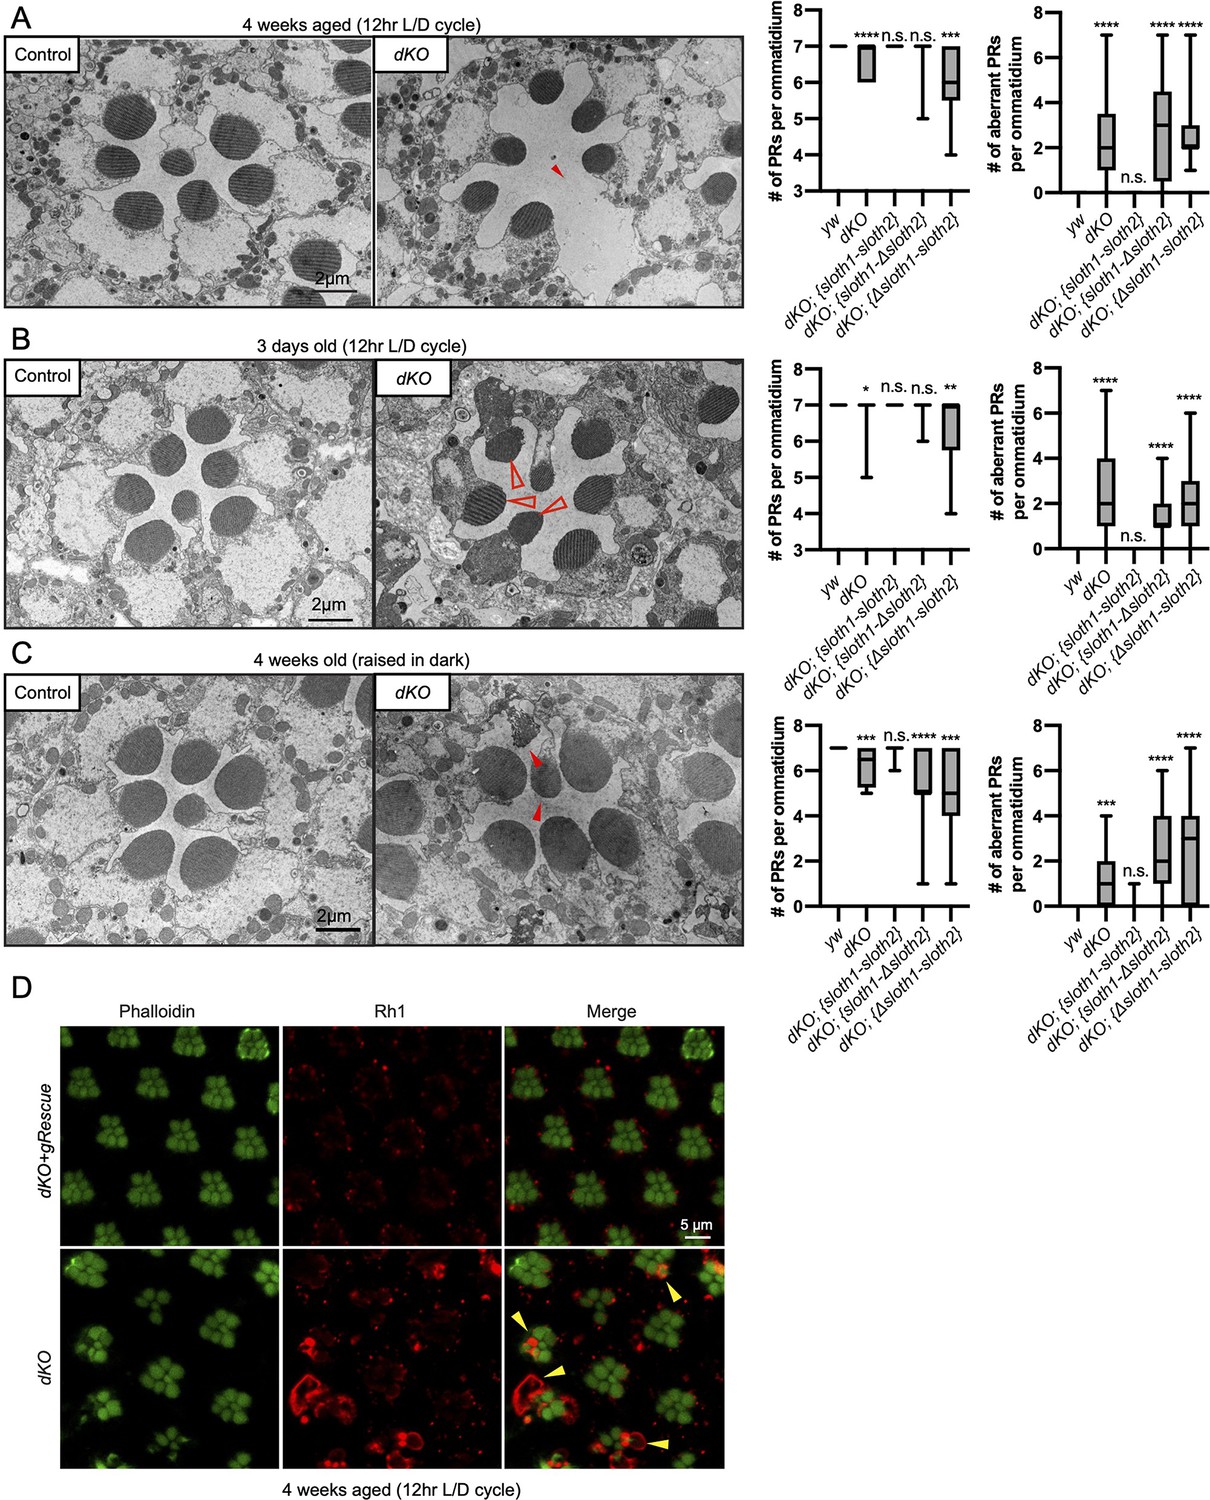
Loss of sloth1-sloth2 causes neurodegeneration.
(A–C) Transmission electron microscopy (TEM) images of sectioned adult eye photoreceptors (left) and quantification of photoreceptor number and aberrant photoreceptors (right). Scalebar is 2 µm. Filled red arrows indicate dead or dying photoreceptors. Open red arrows indicate unhealthy photoreceptors. Error bars show mean with SD. N≥8 ommatidium per genotype. (A) Four weeks old raised in a 12 hr light/dark cycle. (B) 3 days old raised in a 12 hr light/dark cycle. (C) Four weeks old raised in 24 hr dark. (D) Confocal microscopy of adult eye photoreceptors stained with phalloidin (green) and anti-Rh1 (red). Animals were 4 weeks old and raised in a 12 hr light/dark cycle. Arrowheads indicate photoreceptors with higher levels of Rh1.
Figure 5—figure supplement 1
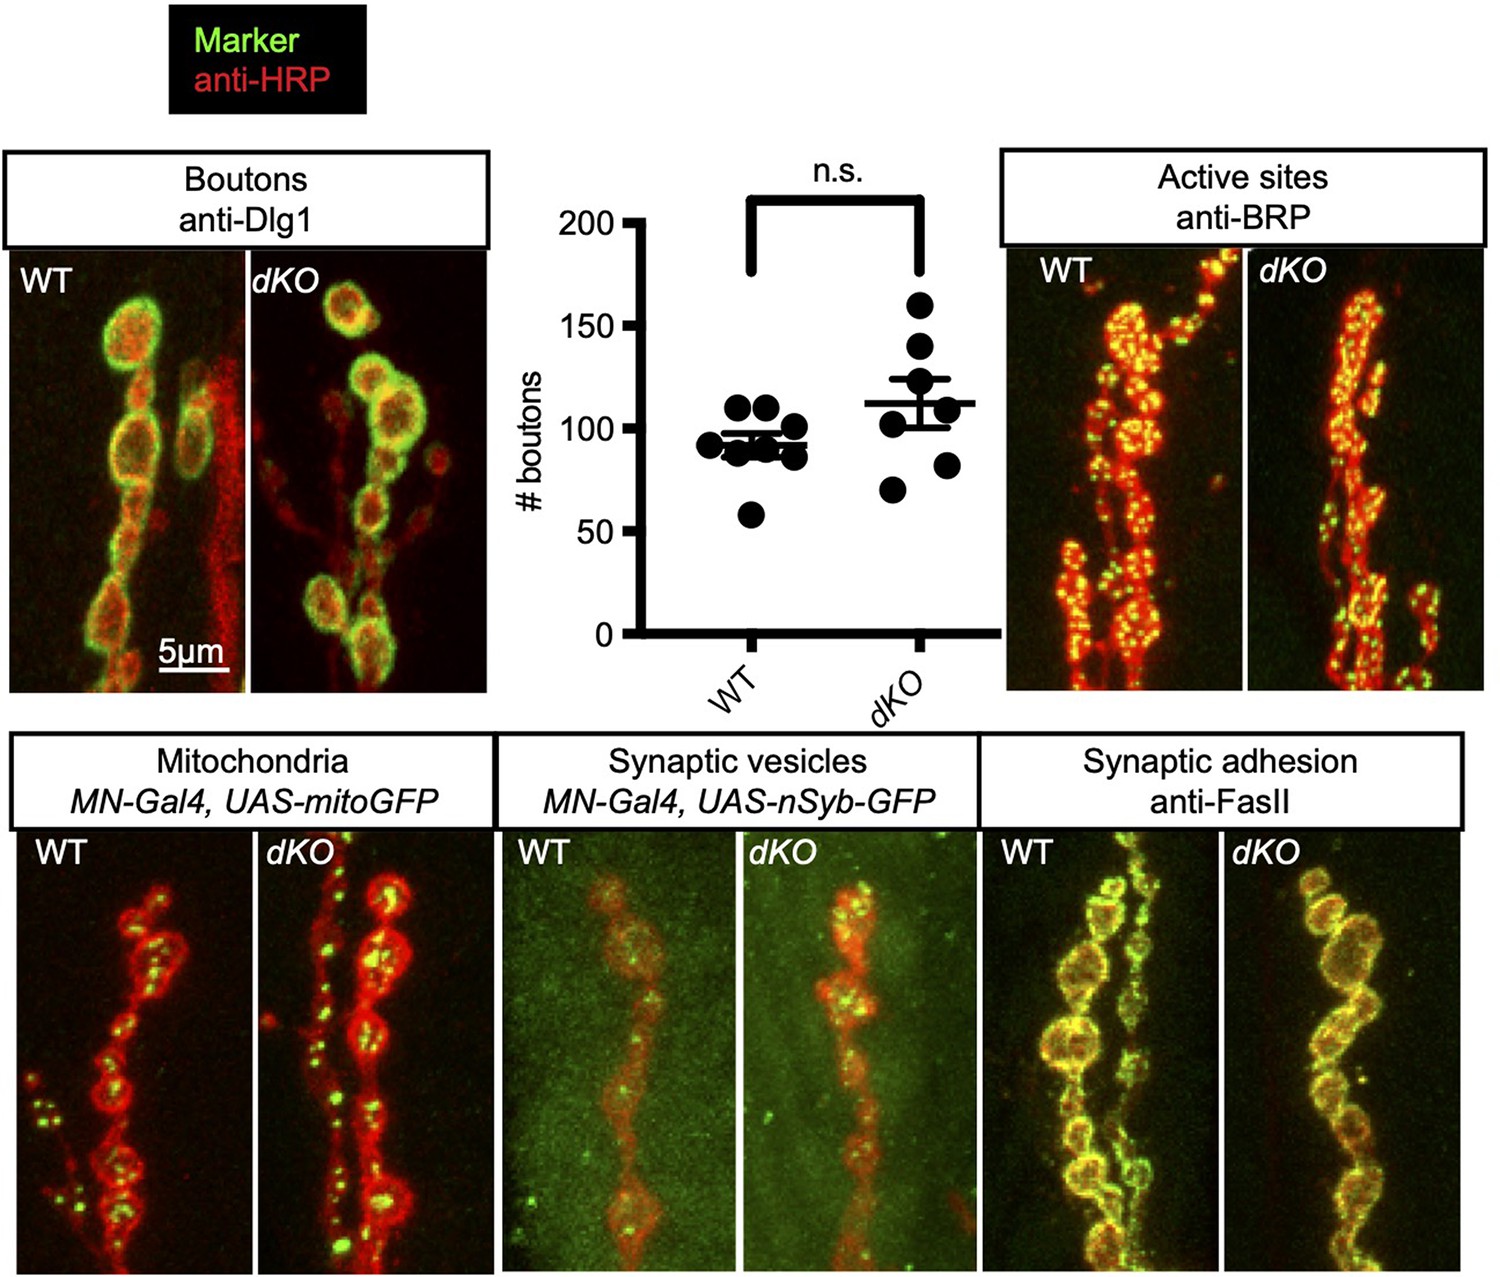
Related to Figure 5.
Confocal microscopy images of 3rd instar larval NMJ at muscle 6/7 segment A2. Antibodies or fluorescent proteins (green) mark synaptic components and anti-HRP (red) marks neurons. Comparison of wild-type to dKO. Graph shows quantification of synaptic bouton number by anti-Dlg1 staining. Significance of dKO bouton number was calculated with a T-test compared to WT. Error bars show mean with SD. N≥7 NMJs (each from a different animal).
Figure 5—figure supplement 2

Related to Figure 5.
(A–C) Transmission electron microscopy (TEM) images of sectioned adult eye photoreceptors from indicated genetic backgrounds with accompanying quantification of photoreceptor number and aberrant photoreceptors. Scalebar is 2 µm. Filled red arrows indicate dead or dying photoreceptors. Open red arrows indicate unhealthy photoreceptors. Error bars show mean with SD. (A) Animals were 4 weeks old and raised in a 12 hr light/dark cycle. (B) Animals were 1–3 days old and raised in a 12 hr light/dark cycle. (C) Animals were 4 weeks old and raised in the dark.
Figure 5—figure supplement 3
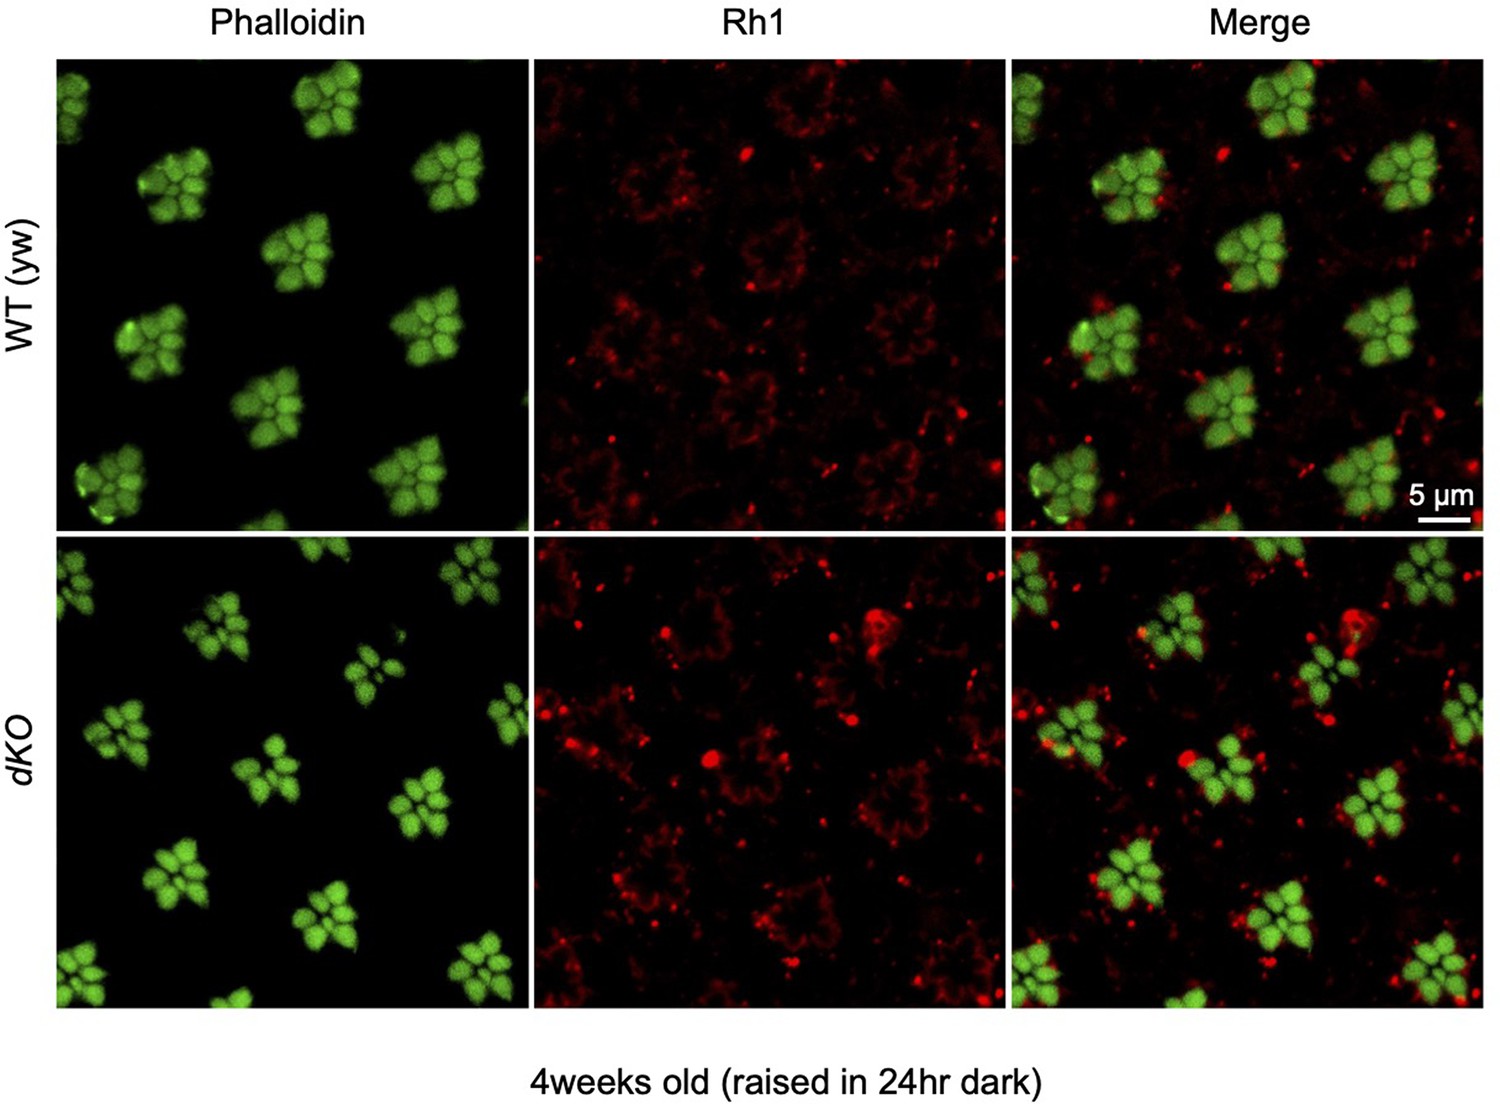
Related to Figure 5.
Confocal microscopy of adult eye photoreceptors stained with phalloidin (green) and anti-Rh1 (red). Animals were 4 weeks old and raised in the dark. Arrows indicate photoreceptors with higher levels of Rh1.
Figure 6 with 2 supplements
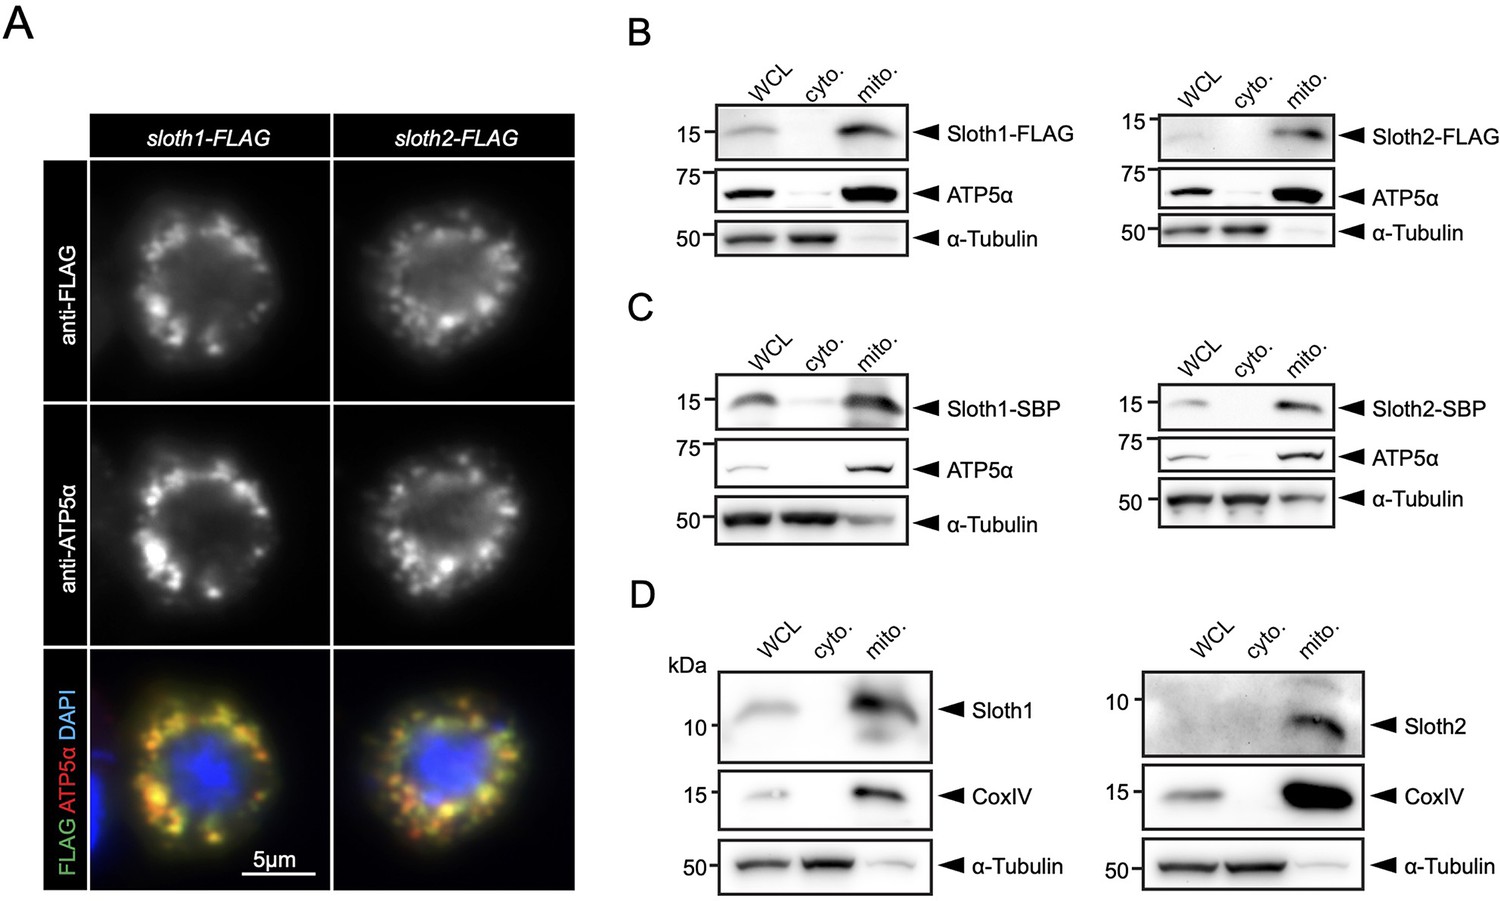
Sloth1 and Sloth2 localize to mitochondria.
(A) Confocal microscopy of S2R+ cells transfected with Sloth1-FLAG or Sloth2-FLAG and stained with anti-FLAG (green) and anti-ATP5alpha (red). DAPI (blue) stains nuclei. (B–D) SDS-PAGE and western blotting of S2R+ cellular fractions. WCL = Whole Cell Lysate, cyto.=cytoplasmic lysate, mito.=mitochondrial lysate. Mitochondrial control = ATP5alpha, cytoplasmic control = alpha-tubulin. Each lane loaded equal amounts of protein (15 µg/lane). Blots were stripped and reprobed after detection of each antigen. (B) Transfected Sloth1-FLAG or Sloth2-FLAG. (C) Stable cells expressing copper-inducible Sloth1-SBP or Sloth2-SBP. (D) Stable cells expressing copper-inducible Sloth1-SBP or Sloth2-SBP.
Figure 6—figure supplement 1

Related to Figure 6.
Confocal microscopy of 3rd instar larval brain with antibody staining. Anti-Sloth1 or Anti-Sloth2 (green), mitochondria labeled with anti-ATP5alpha (red), and nuclei labeled with DAPI (blue). Wild-type (yw) or sloth1/2 KO. (A) Zoom out of entire brain showing region imaged in panels B and C. Scale bar 100 µm. (B) Results using two independent anti-Sloth1 antibodies (#1 and #2). Scale bar 20 µm. (C) Results using two independent anti-Sloth2 antibodies (#1 and #2). Scale bar 20 µm.
Figure 6—figure supplement 2

Related to Figure 6.
SDS-PAGE and western blotting using anti-Sloth1 and anti-Sloth2 antibodies of cell and mitochondrial lysates. Two independent (#1 and #2) anti-Sloth1 and Anti-Sloth2 antibodies were tested. Arrowheads indicated expected band, asterisks indicate unrelated band(s). Tricine gels were used. (A) S2R+ whole cell lysates isolated from indicated genotypes. Rhodamine-Actin used as loading control. (B) S2R+ mitochondrial lysates isolated from indicated genotypes. Anti-ATP5alpha used as loading control. Mitochondrial control = ATP5alpha, cytoplasmic control = alpha-tubulin. (C) Mitochondrial fractions isolated from wild-type S2R+ cells. WCL = Whole Cell Lysate, cyto.=cytoplasmic lysate, mito.=mitochondrial lysate. Blots were stripped and reprobed after detection of each antigen. (D) Mitochondrial lysates isolated from 3rd instar larvae or adult thorax mitochondrial isolation of indicated genotypes. ‘da>’ indicates da-Gal4 crossed with attP40 (wild-type), RNAi (UAS-shRNA-sloth1/2), OE (UAS-sloth1/2 transcript).
Figure 7 with 2 supplements
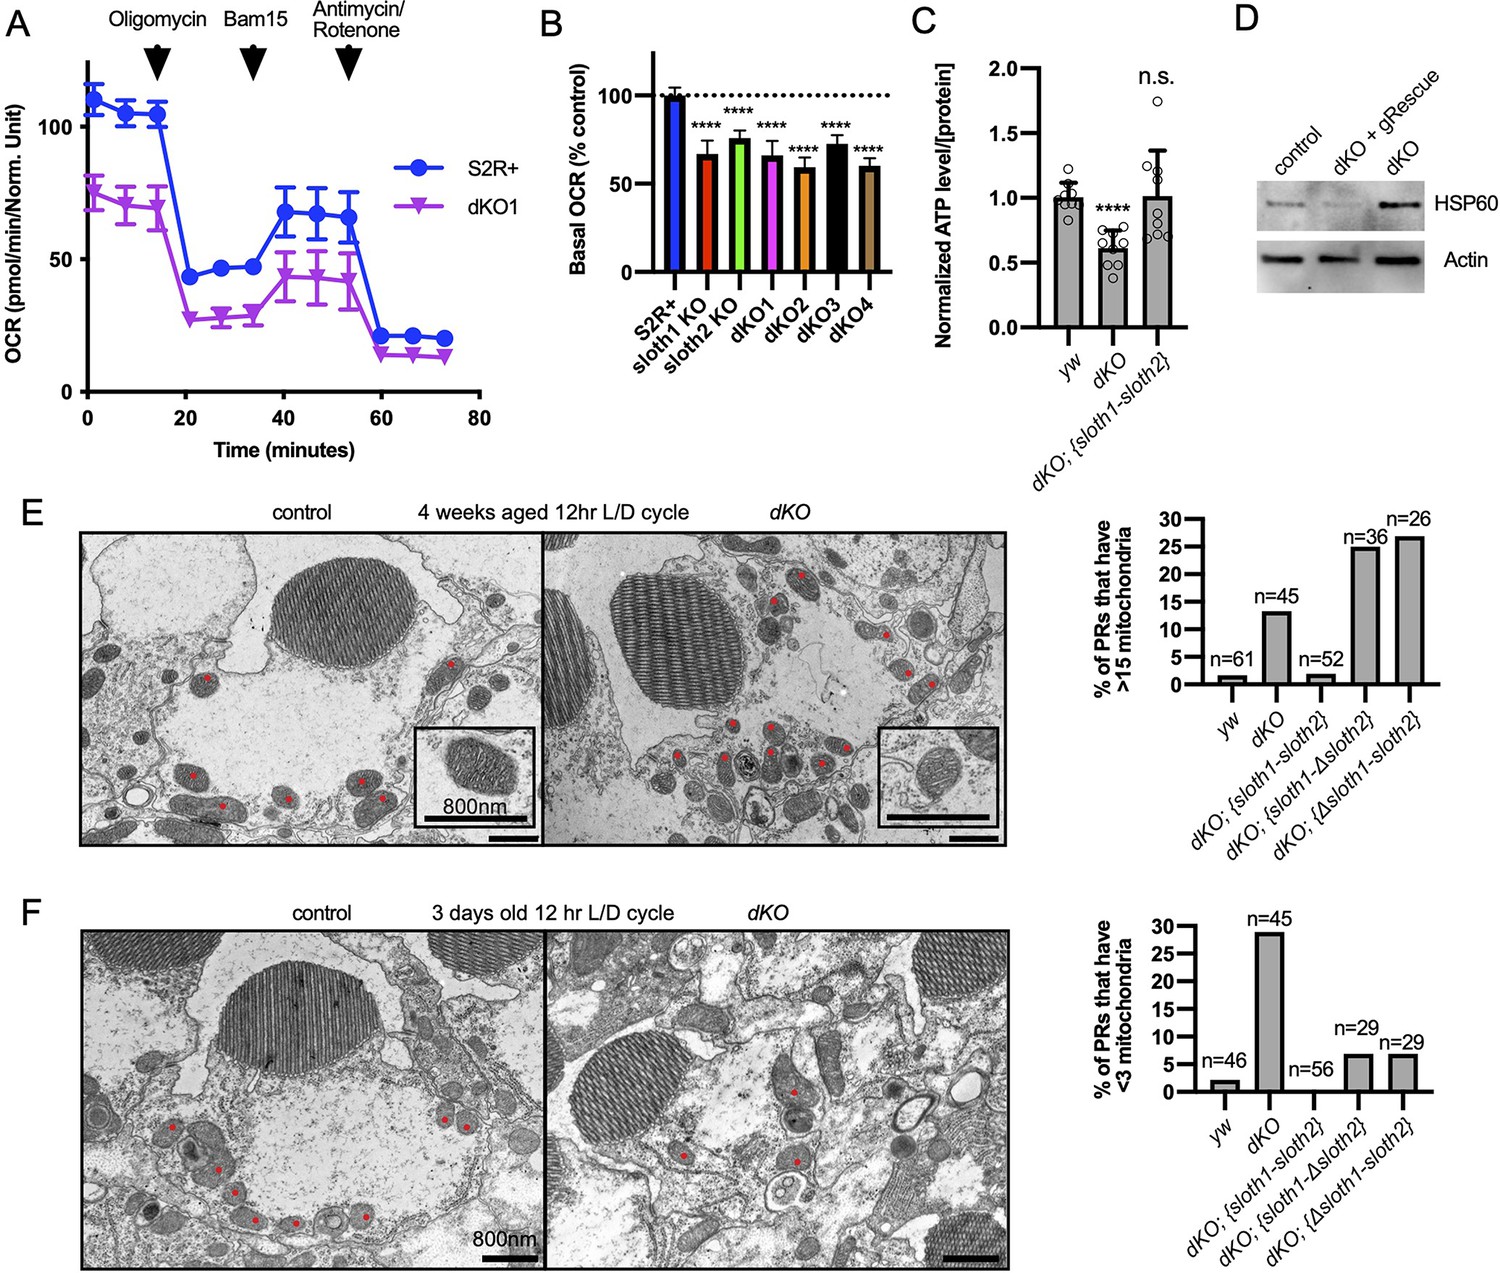
sloth1-sloth2 are important for mitochondrial function.
(A) Seahorse mitochondrial stress report for wildtype S2R+and dKO #1 cells. Error bars show mean with SD. N=6 for each genotype. (B) Quantification of basal OCR (timepoint 3) in panel A and including data from single KO and additional dKO cell lines. Significance of KO lines was calculated with a T-test compared to S2R+. Error bars show mean with SD. **** p≤0.0001. N=6 for each genotype. (C) Quantification of ATP levels in 3rd instar larvae. Error bars show mean with SEM. N=3 experiments. (D) Western blot from lysates of 3rd instar larval brains. (E–F) TEM images of sectioned adult photoreceptors (left) and quantification of mitochondria number (right). Mitochondria are indicated with red dots. Error bars show mean with SD. Sample size indicated on graph. (E) Adult flies are 4 weeks old and raised in a 12 hr light/dark cycle. (F) Adult flies are 3 days old and raised in a 12 hr light/dark cycle.
Figure 7—figure supplement 1
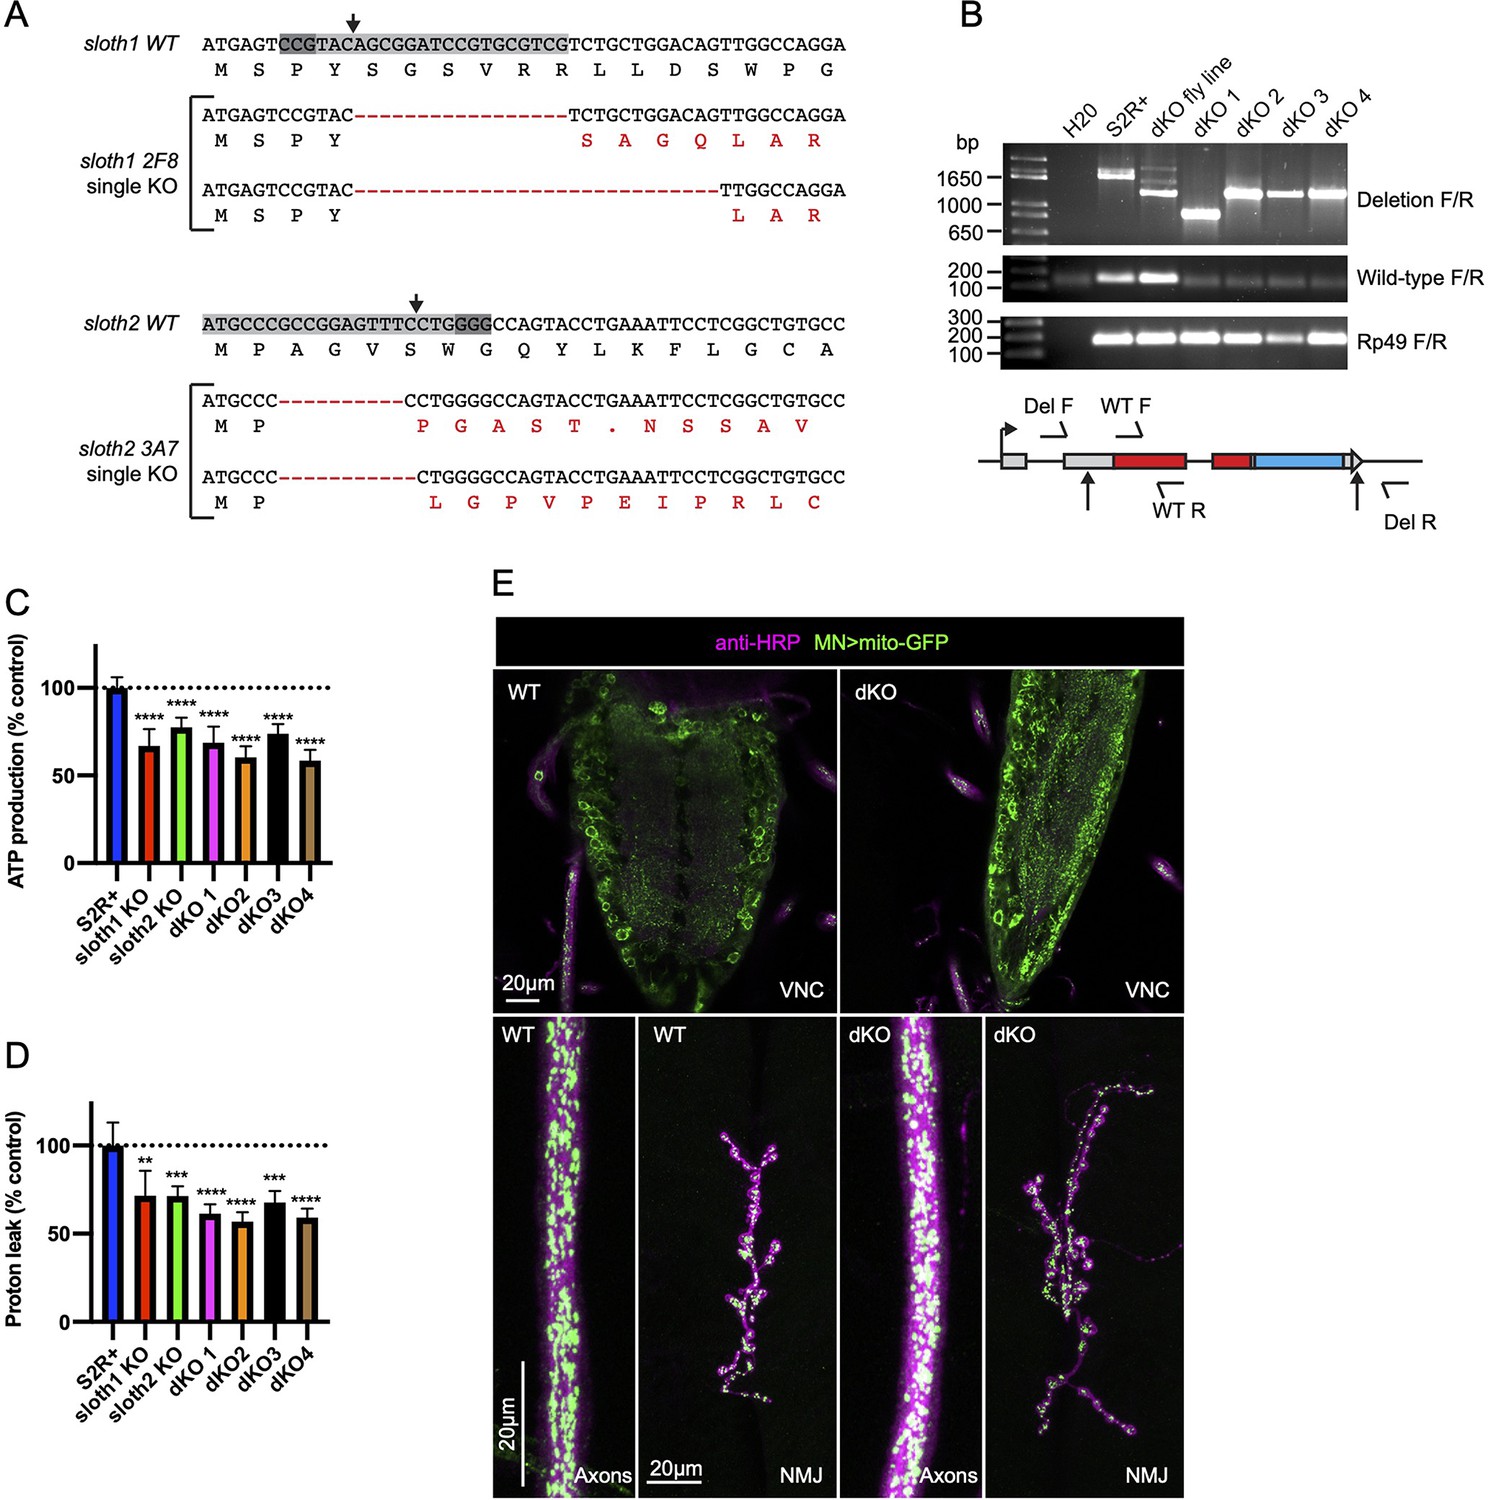
Related to Figure 7.
(A) Sequence analysis of single KO S2R+clones for sloth1 (clone 2F8) and sloth2 (clone 3A7). sgRNA and PAM site indicated by grey boxes. (B) PCR genotyping of four independently derived single cell dKO S2R+clones. (C–D) Seahorse mitochondrial stress test quantification of (C) ATP production and (D) Proton leak. Significance of KO lines was calculated with a T-test compared to S2R+. Error bars show mean with SD. ** p≤0.01, *** p≤0.001, **** p≤0.0001. N=6 for each genotype. (E) Confocal images of 3rd instar larval ventral nerve cord (VNC), axon bundles, and neuromuscular junction (NMJ). MN-Gal4 UAS-mitoGFP (MN>mitoGFP) (GFP) expresses mitochondrial-localized GFP in motor neurons. Neurons are stained with anti-HRP (magenta).
Figure 7—figure supplement 2

Related to Figure 7.
(A–B) TEM images of sectioned adult photoreceptors. (A) Adult flies are 4 weeks old and raised on a 12 hr light/dark cycle. Mitochondria are indicated with red dots. (B) Adult flies are 3 days old and raised in a 12 hr light/dark cycle.
Figure 8

Sloth1 and Sloth2 physically interact with complex III and regulate its assembly.
(A–B) Blue native PAGE gel of mitochondria isolated from (A) 10 adult thoraxes and (B) 10 whole 3rd instar larvae of indicated genotype. Bands corresponding to native respiratory complexes are indicated with arrowheads. (C–D) SDS-PAGE and western blotting of mitochondria isolated from (C) adult thorax and (D) whole 3rd instar larvae of indicated genotype. Each lane loaded equal amount of protein (15 µg). Blots were stripped and reprobed after detection of each antigen. (E–F) Western blots from co-immunoprecipitation experiments in transfected S2R+ cells using Sloth1-FLAG and Sloth2-FLAG as bait and either (E) RFeSP-HA or (F) CG10075-HA as prey. Blots were striped and reprobed after detection of each antigen. Arrowheads indicated expected band, asterisks indicate unknown bands.
Figure 9
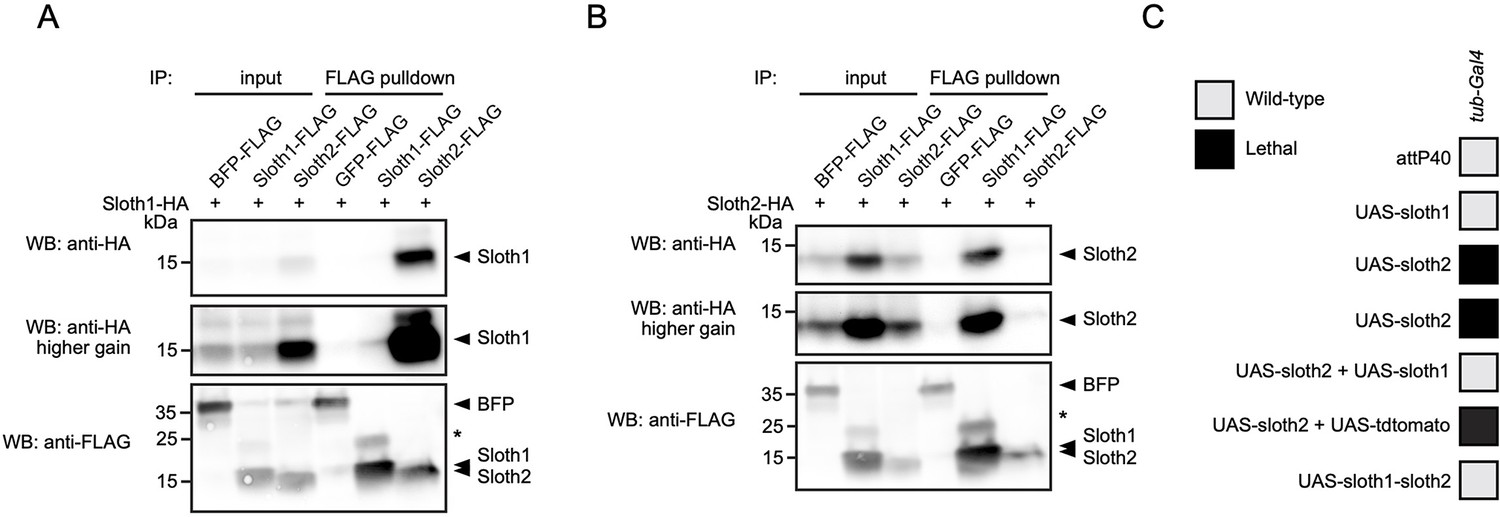
Sloth1 and Sloth2 act in a stoichiometric complex.
(A–B) Western blots from co-immunoprecipitation experiments in transfected S2R+ cells. (A–B) Immunoprecipitation using Sloth1-FLAG and Sloth2-FLAG as bait and either (A) Sloth1-HA or (B) Sloth2-HA as prey. Blots were striped and reprobed after detection of each antigen. Arrowheads indicated expected band, asterisks indicate unknown bands. (C) Developmental viability assay using tub-Gal4 to overexpress indicated transgenes throughout development. Crosses resulting in no viable adults are scored as lethal (black box).
Figure 10
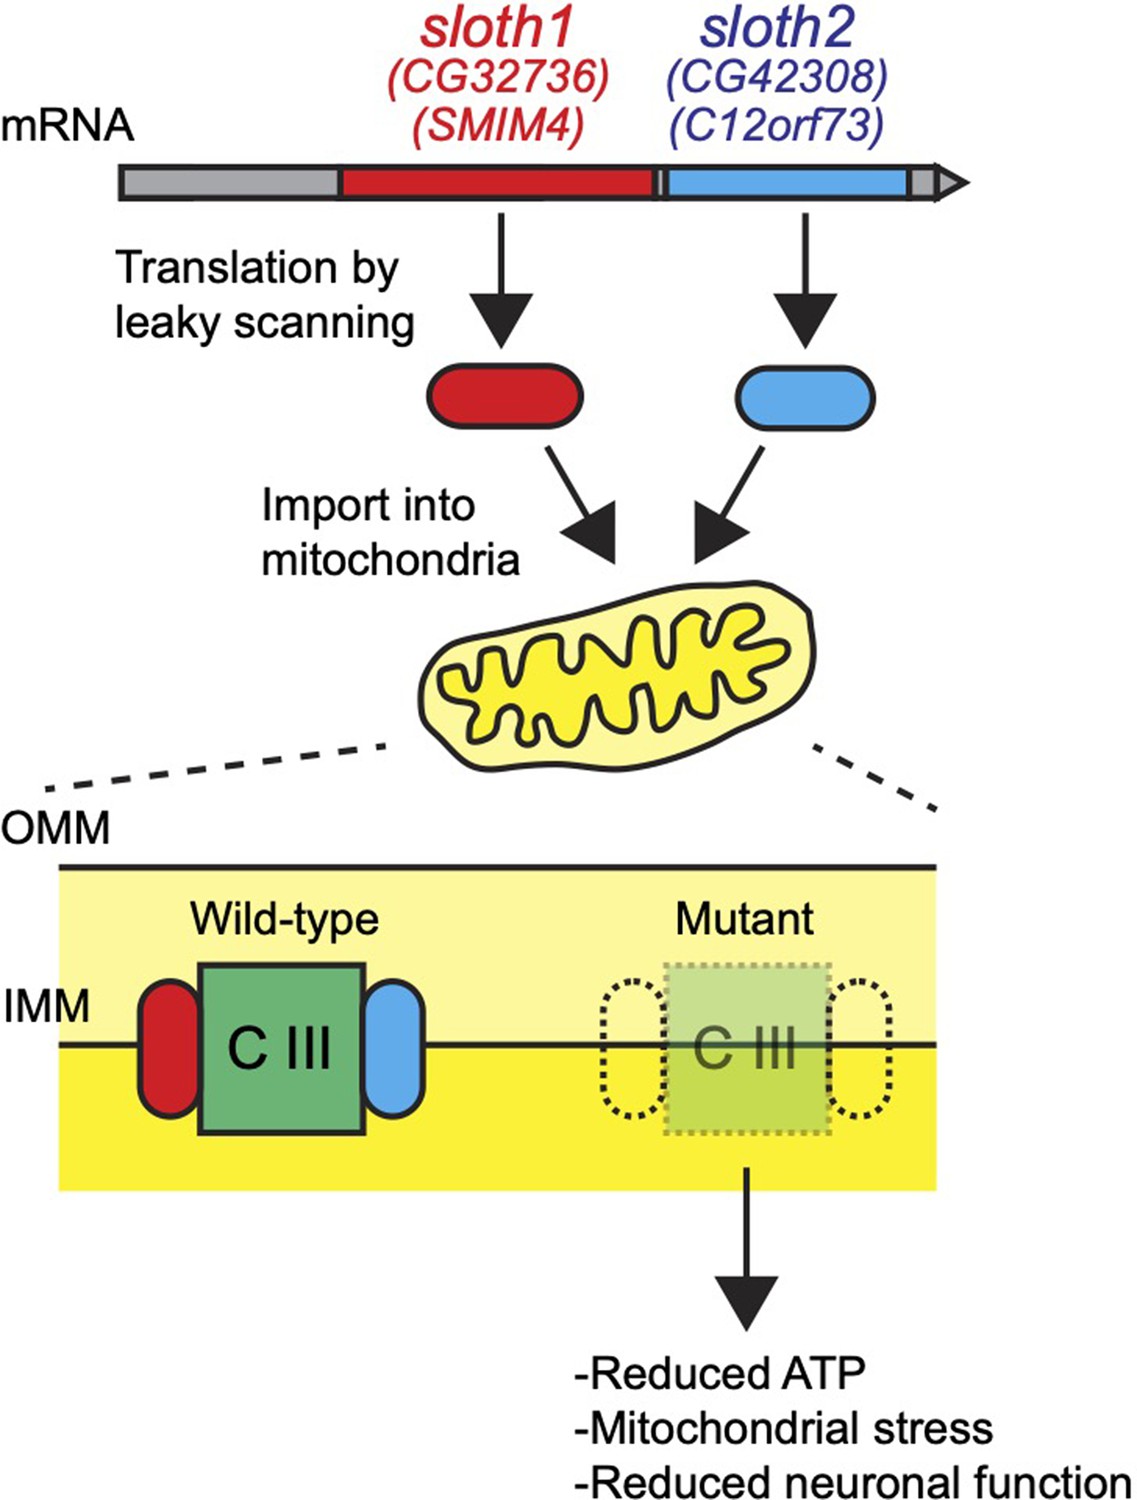
Model for Sloth1 and Sloth2 bicistronic translation and function in mitochondria.
Additional files
-
Supplementary file 1
Genomic sequence of sloth1-sloth2 homologs in D. melanogaster, S. urceolata, P. marinus, and C. intestinalis.
- https://cdn.elifesciences.org/articles/82709/elife-82709-supp1-v2.docx
-
Supplementary file 2
Oligo and dsDNA sequences.
- https://cdn.elifesciences.org/articles/82709/elife-82709-supp2-v2.xlsx
-
Supplementary file 3
Gateway cloning plasmid list.
- https://cdn.elifesciences.org/articles/82709/elife-82709-supp3-v2.xlsx
-
Supplementary file 4
Raw gel and western images.
- https://cdn.elifesciences.org/articles/82709/elife-82709-supp4-v2.zip
-
Transparent reporting form
- https://cdn.elifesciences.org/articles/82709/elife-82709-transrepform1-v2.pdf
Download links
A two-part list of links to download the article, or parts of the article, in various formats.
Downloads (link to download the article as PDF)
Open citations (links to open the citations from this article in various online reference manager services)
Cite this article (links to download the citations from this article in formats compatible with various reference manager tools)
Two neuronal peptides encoded from a single transcript regulate mitochondrial complex III in Drosophila
eLife 11:e82709.
https://doi.org/10.7554/eLife.82709


