Mesenchymal stem cell suppresses the efficacy of CAR-T toward killing lymphoma cells by modulating the microenvironment through stanniocalcin-1
- Department of Hematology, Tianjin First Central Hospital, School of Medicine, Nankai University, China
- State Key Laboratory of Medicinal Chemical Biology and College of Life Sciences, Nankai University, China
- Qilu Institute of Technology, China
- College of Biotechnology, Tianjin University of Science and Technology, China
Figures
Figure 1
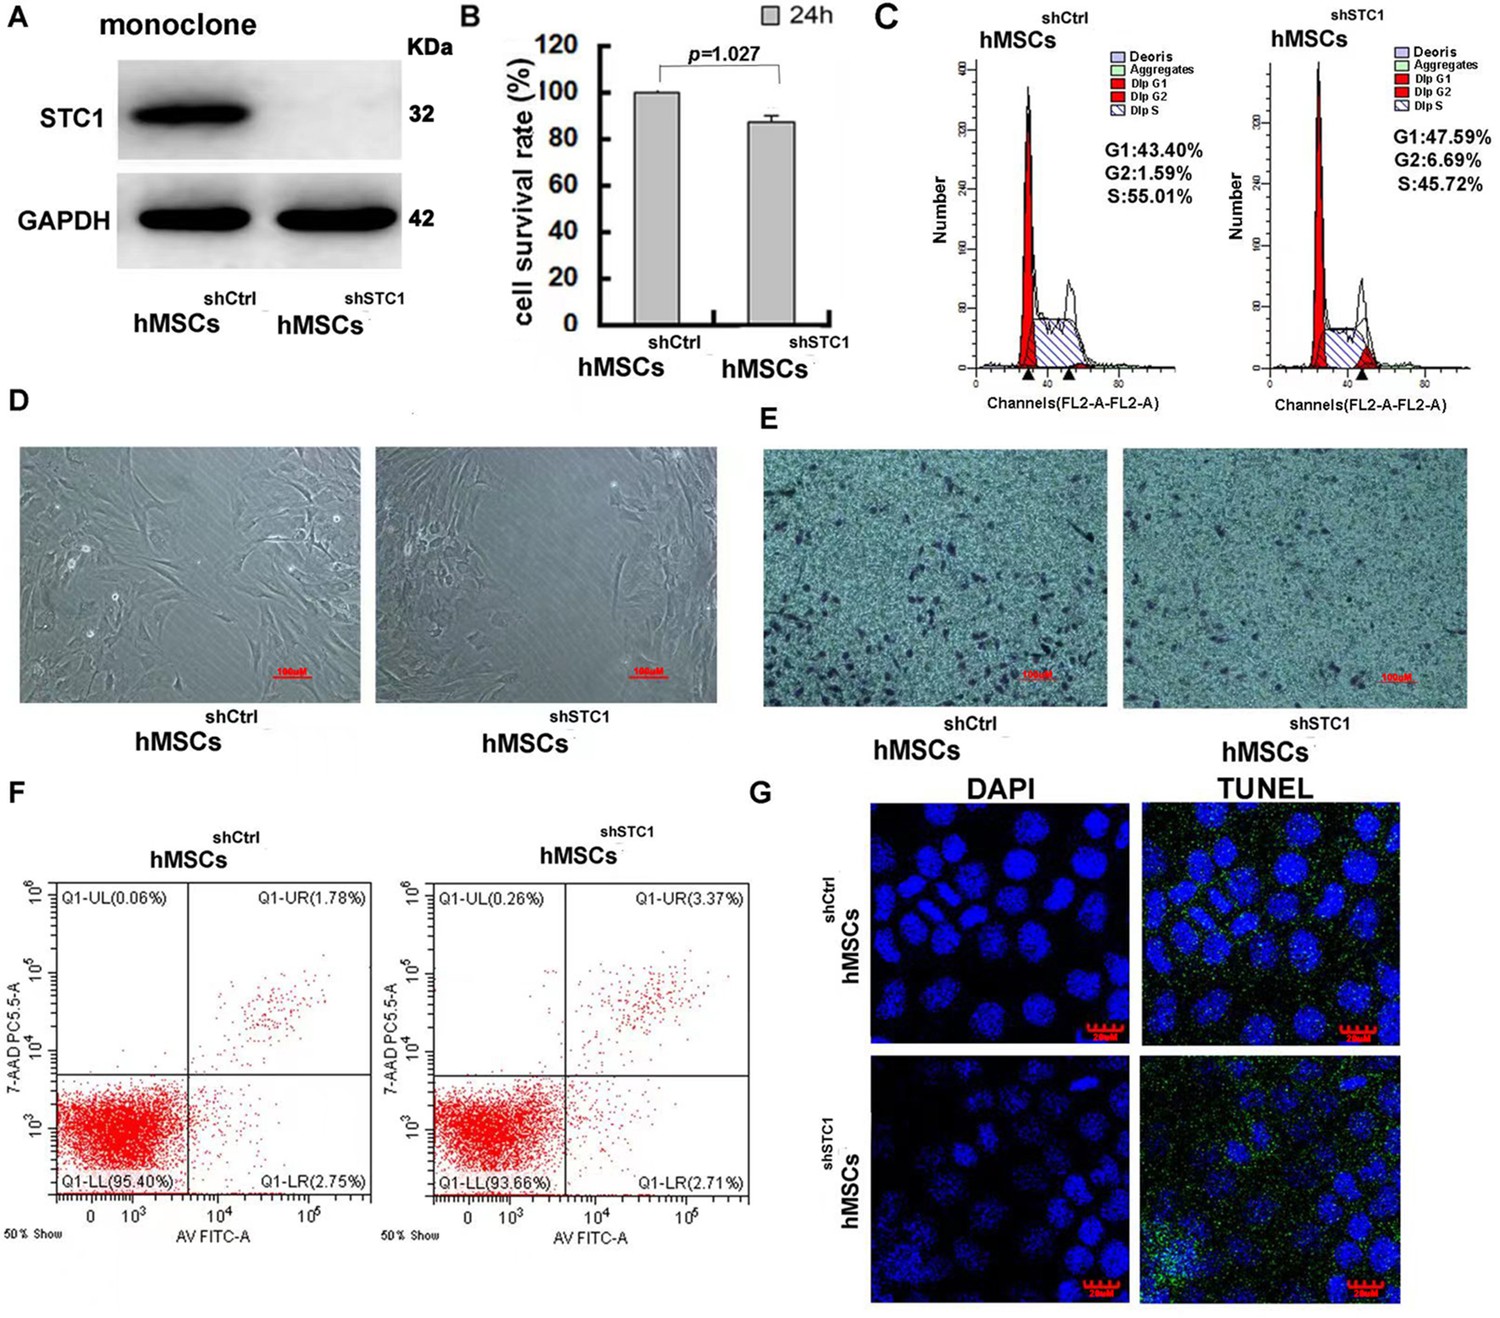
The impact of stanniocalcin-1 (STC1) knockdown on cell proliferation, migration, and apoptosis of hMSCs.
(A) Western blot analysis of STC1 protein expression in hMSCs. (B) Cell viability determined by MTT, measurements are shown as the mean ± SD from three independent experiments. (C) FACS analysis of cell cycle progression on hMSCs w/o STC1 knockdown. (D, E) Knockdown of STC1 suppressed cell migration as determined by wound healing and transwell chamber assays. (F) Apoptosis determination by the Alexa Fluor 488 annexin V and PI detection. (G) DNA fragmentation determination by transferase-mediated dUTP nick-end labeling (TUNEL) assay.
-
Figure 1—source data 1
Labeled original blots of Figure 1A.
- https://cdn.elifesciences.org/articles/82934/elife-82934-fig1-data1-v3.zip
-
Figure 1—source data 2
Unlabeled original blots of Figure 1A.
- https://cdn.elifesciences.org/articles/82934/elife-82934-fig1-data2-v3.zip
-
Figure 1—source data 3
Figure 1B in Excel file.
- https://cdn.elifesciences.org/articles/82934/elife-82934-fig1-data3-v3.xlsx
Figure 2

Analysis of cytotoxicity, T cell composition, and immune-suppressive markers.
The cell co-culture contained chimeric antigen receptor modified T cell (CAR-T) cells, Pfeiffer cells, M2 macrophages, and control or stanniocalcin-1 (STC1) knockdown hMSCs in a ratio of 1:3:1:1. After 24 hr (or 48 hr for cytotoxicity) incubation, the following analysis was conducted: (A) The impact of hMSC (w/o STC1) on the cytotoxicity of CAR-T toward Pfeiffer cells; (B) FACS analysis of CD4+ and CD8+ composition. (C) Quantitation of the FACS data on CD4+ and CD8+; (D) FACS analysis of Treg+ cells (CD4+CD127+CD25+); (E) Quantitation of Treg+ cells. (F) Western blot analysis of indoleamine 2,3-dioxygenase (IDO) and programmed cell death-ligand 1 (PD-L1) expression in the cell co-culture. Data in bar graphs are presented as the mean ± SD from three independent experiments (p values are as indicated, n=3).
-
Figure 2—source data 1
Figure 2A in Excel file.
- https://cdn.elifesciences.org/articles/82934/elife-82934-fig2-data1-v3.xlsx
-
Figure 2—source data 2
Figure 2C in Excel file.
- https://cdn.elifesciences.org/articles/82934/elife-82934-fig2-data2-v3.xlsx
-
Figure 2—source data 3
Figure 2E in Excel file.
- https://cdn.elifesciences.org/articles/82934/elife-82934-fig2-data3-v3.xlsx
-
Figure 2—source data 4
Labeled original blots of Figure 2F.
- https://cdn.elifesciences.org/articles/82934/elife-82934-fig2-data4-v3.zip
-
Figure 2—source data 5
Unlabeled original blots of Figure 2F.
- https://cdn.elifesciences.org/articles/82934/elife-82934-fig2-data5-v3.zip
Figure 3
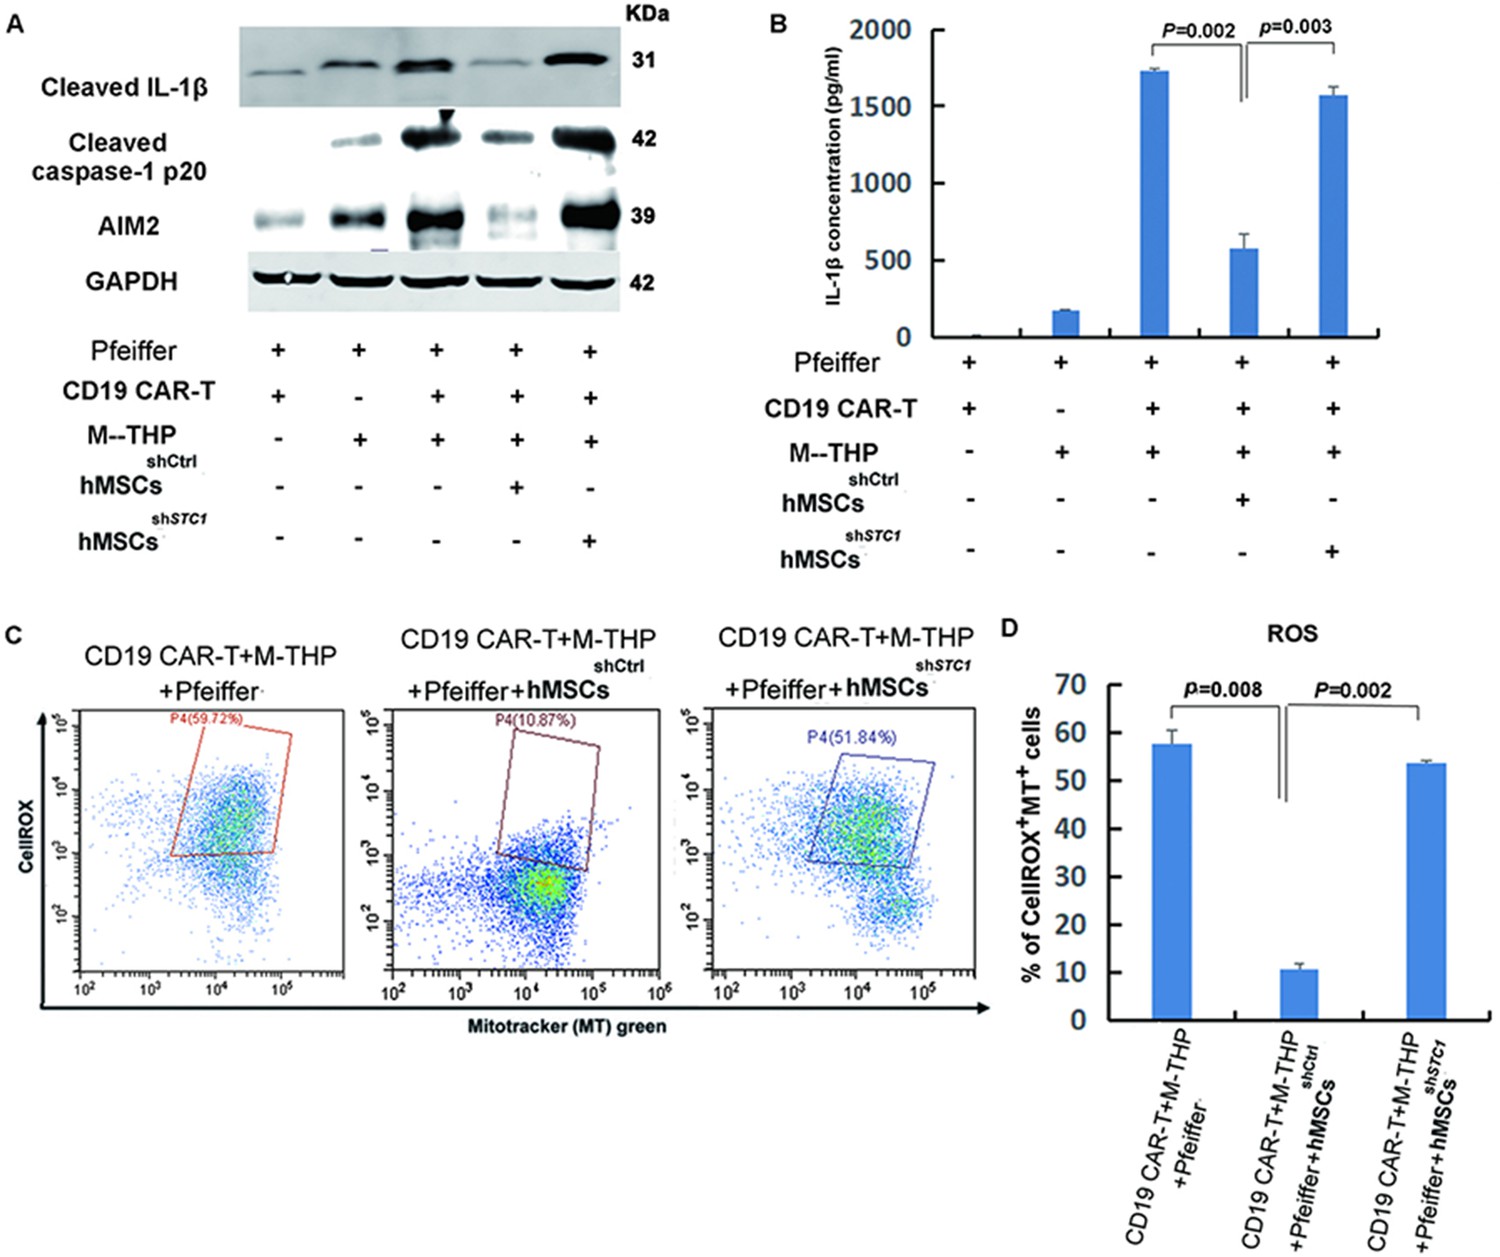
The impact of mesenchymal stem cells (MSCs) on the expression of key components involved in the formation of NLRP3 inflammasome and mitochondrial reactive oxygen species (ROS).
(A) The protein expression of IL-1β, caspase-1, and AIM2 in cell lysates was analyzed by Western blot. (B) Quantitation of IL-1β secretion in the supernatants by ELISA. (C) FACS analysis of ROS level and mitochondria mass with fluorescent dye CellROX Deep Red and MitoTracker Green. (D) Quantitation of mitochondria-specific ROS level based on the percentage of cells that were both positive for CellROX and MitoTracker. All samples were collected 24 hr post the co-culture of different cells. For the measurements of IL-β, results are shown as the mean ± SD from three independent experiments (p values are as indicated, n=3).
-
Figure 3—source data 1
Labeled original blots of Figure 3A.
- https://cdn.elifesciences.org/articles/82934/elife-82934-fig3-data1-v3.zip
-
Figure 3—source data 2
Unlabeled original blots of Figure 3A.
- https://cdn.elifesciences.org/articles/82934/elife-82934-fig3-data2-v3.zip
-
Figure 3—source data 3
Figure 3B in Excel file.
- https://cdn.elifesciences.org/articles/82934/elife-82934-fig3-data3-v3.xlsx
-
Figure 3—source data 4
Figure 3D in Excel file.
- https://cdn.elifesciences.org/articles/82934/elife-82934-fig3-data4-v3.xlsx
Figure 4
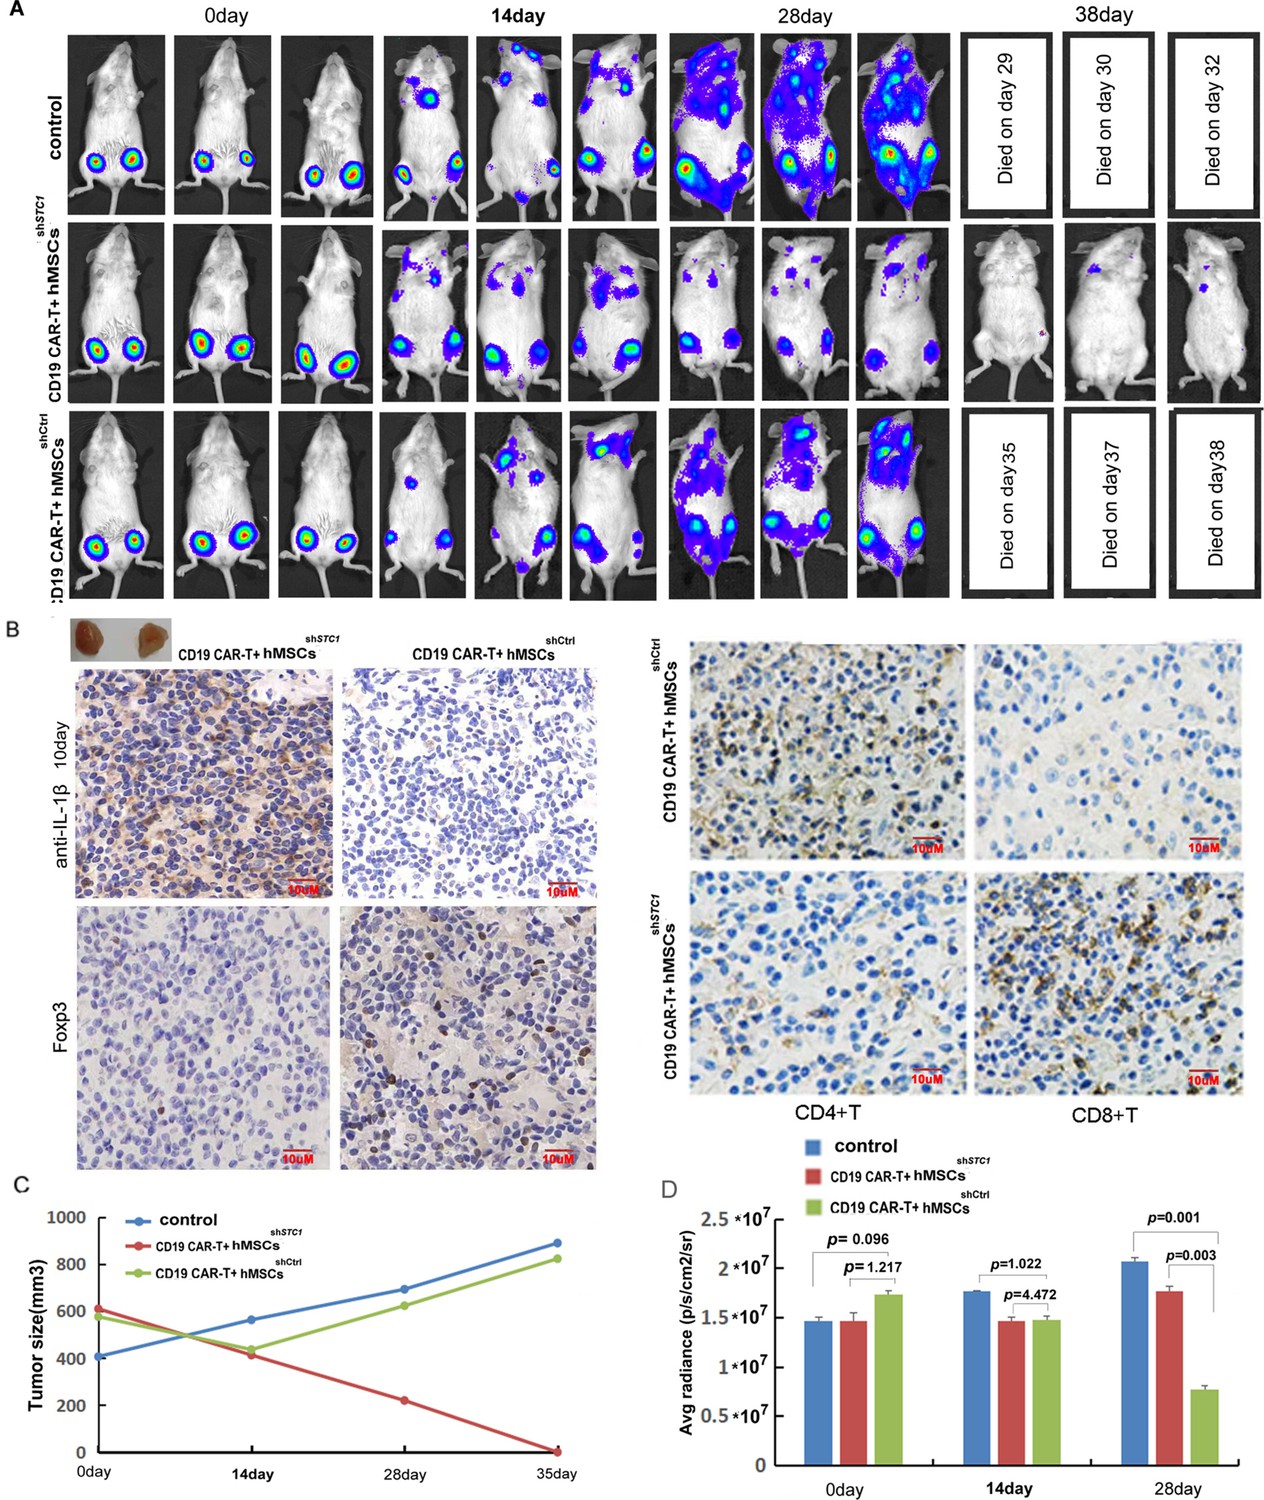
The inhibition of hMSC on chimeric antigen receptor modified T cell (CAR-T) therapy in xenograft mice relied on stanniocalcin-1.
(A) The formation and progression of tumor in three groups of mice monitored with bioluminescence imaging: the control group without any treatment, CAR-T/M-THP1/hMSCsshSTC1 group, and CAR-T/M-THP1/hMSCsshCtrl group. Day 0 was set when the engraftment was confirmed after injecting the Pfeiffer cells. (B) Immunohistochemical analysis of IL-1β, CD4+, CD8+, and Treg cells (using FOXP3 as the biomarker) in tumor tissue at day 10, positive cells display brown or brownish-yellow staining color. (C) The tumor size change with time. (D) The counted average radiance, presented as the mean ± SD (p values are as indicated, n=3).
-
Figure 4—source data 1
Figure 4C in Excel file.
- https://cdn.elifesciences.org/articles/82934/elife-82934-fig4-data1-v3.xlsx
-
Figure 4—source data 2
Figure 4D in Excel file.
- https://cdn.elifesciences.org/articles/82934/elife-82934-fig4-data2-v3.xlsx
Figure 5

Proposed signaling and interactions among hMSC, macrophage, chimeric antigen receptor modified T cell (CAR-T), and tumor cells.
When cancer cells were destroyed by CAR-T cells, the release of fragmented DNA and other stimulating factors activated the release of mitochondria reactive oxygen species (ROS) and the formation of NLPR3 inflammasome. Signals from activated macrophages and other extracellular molecules as well as oxidative stress may stimulate mesenchymal stem cell (MSC) to express and secrete stanniocalcin-1 (STC1). Then STC1 serves as a pleiotropic factor to suppress CAR-T cytotoxicity and other immune responses via direct or indirect pathways.
Additional files
Download links
A two-part list of links to download the article, or parts of the article, in various formats.
Downloads (link to download the article as PDF)
Open citations (links to open the citations from this article in various online reference manager services)
Cite this article (links to download the citations from this article in formats compatible with various reference manager tools)
Mesenchymal stem cell suppresses the efficacy of CAR-T toward killing lymphoma cells by modulating the microenvironment through stanniocalcin-1
eLife 12:e82934.
https://doi.org/10.7554/eLife.82934


