Silencing long-descending inter-enlargement propriospinal neurons improves hindlimb stepping after contusive spinal cord injuries
- Interdisciplinary Program in Translational Neuroscience, School of Interdisciplinary and Graduate Studies, University of Louisville, United States
- Department of Anatomical Sciences and Neurobiology, University of Louisville, United States
- Kentucky Spinal Cord Injury Research Center, University of Louisville, United States
- Speed School of Engineering, University of Louisville, United States
- Department of Neurological Surgery, University of Louisville, United States
Figures
Figure 1
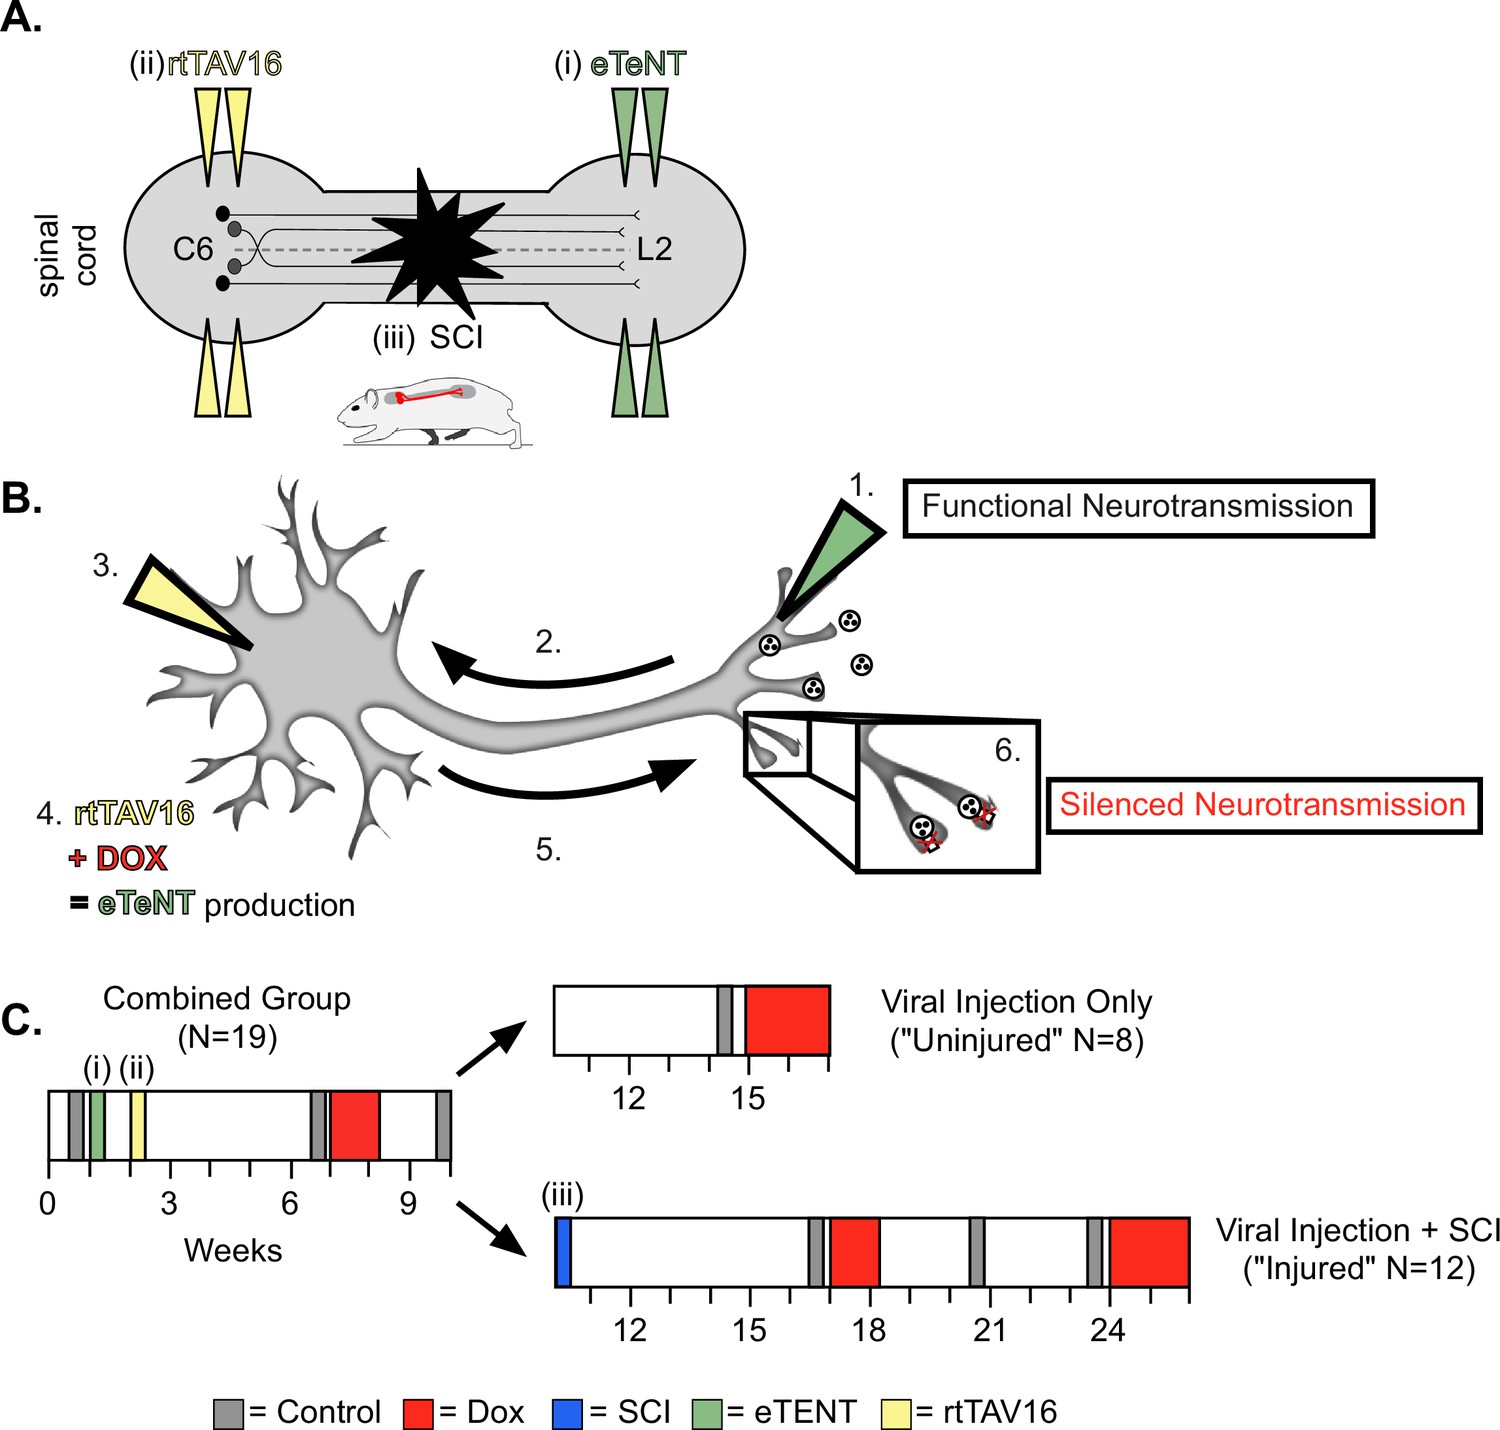
Experimental design and timeline.
(A) Bilateral injections of enhanced tetanus neurotoxin (eTeNT) (green) and tetracycline transactivator (rtTAV16) (yellow) were performed at L2 and C6 spinal cord levels, respectively, followed by a spinal cord injury (black star). Administration of doxycycline (Dox, B and C) induces eTeNT expression in doubly-infected neurons. (B) When each viral vector is injected into the location of anatomically defined cell terminals (1. EGFP.eTeNT, green), and neuronal cell bodies (3. AAV2, yellow) the EGFP.eTeNT is retrogradely transported (2.) and the neuron becomes doubly-infected. rtTAV16 is activated in the presence of doxycycline (Dox, red) and can bind to the TRE promotor, which induces eTeNT.EGFP expression (4.). It is anterogradely transported down to the cell bodies (5.), where it cleaves vesicle-associated membrane protein 2 (VAMP2) and prevents the release of vesicular contents into the synapse (6. silenced neurotransmission). (C) Before and after viral injections (i) and (ii), pre-injury behavioral assessments were taken at three control time points (gray boxes) and a single round of Dox administration (red box). In viral injection (uninjured) controls, and following spinal cord injury (SCI) (iii), behavioral assessments were repeated at control time points (gray boxes) and during Dox administration (red boxes).
Figure 2 with 2 supplements
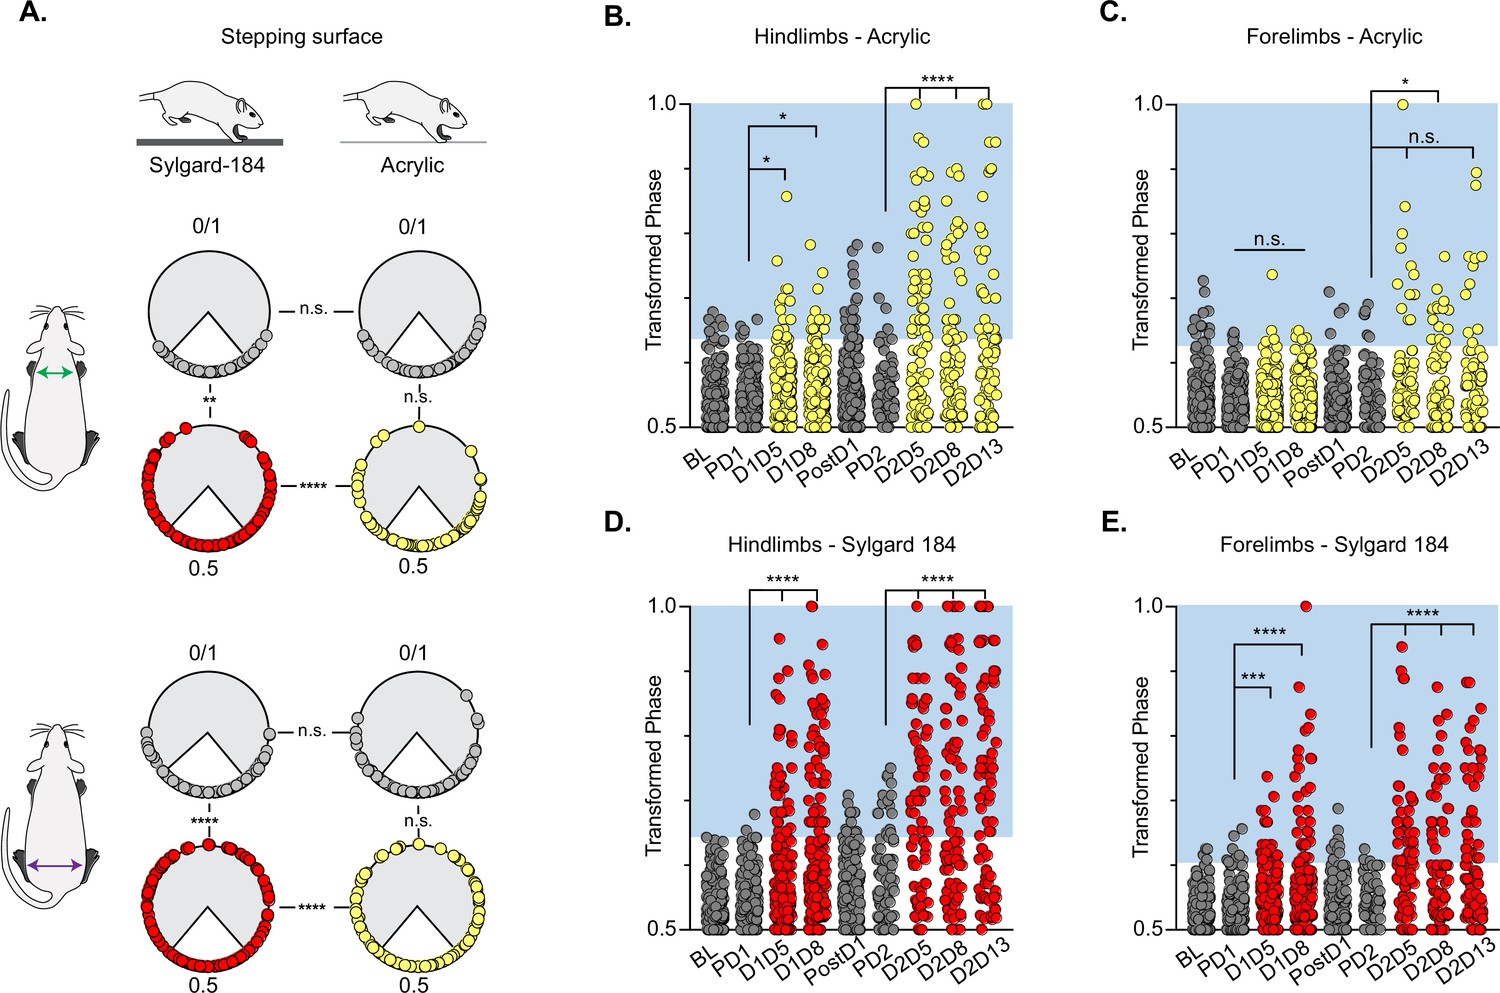
Silencing-induced perturbations for long descending propriospinal neurons (LDPNs) are not context-dependent.
For Control (e.g. PD1=pre Dox 1), doxycycline (Dox) (e.g. D1D5=Dox 1 day 5), and post-Dox (PostD1) time points, all individual hindlimb and forelimb steps are graphed using circular phase plots (A) assessed using Watson’s Non-Parametric U2 circular statistics (Table 1). All control steps are indicated by gray circles. Acrylic (low coefficient of friction, CoF) Dox steps are indicated by yellow circles and Sylgard (high CoF) Dox steps are indicated by red circles. Hindlimb and forelimb phase relationships were transformed and graphed linearly for each time point (B–E). No significance was seen between the time points on the acrylic surface for the first Dox administration, but was significantly altered during the subsequent Dox administration (B, right column and B, C: PD1 hindlimbs n=3/238 [1.26%] vs D1D5 hindlimbs n=12/218 [5.50%]; *p<0.05, z=2.49; PD1 hindlimbs n=3/238 [1.26%] vs D1D8 hindlimbs n=11/218 [5.05%]; *p<0.05, z=2.29; PD2 hindlimbs n=4/82 [4.88%] vs D2D5 hindlimbs n=38/82 [46.34%]; ****p<0.001, z=6.91; PD2 hindlimbs n=4/82 [4.88%] vs D2D8 hindlimbs n=25/88 [28.41%]; ****p<0.001, z=4.39). Hindlimb stepping was significantly altered during all Dox time points on the Sylgard surface (B, left column and d, E: PD1 hindlimbs n=2/189 [1.05%] vs D1D5 hindlimbs n=37/177 [20.90%]; ****p<0.001, z=6.15; PD1 hindlimbs n=2/189 [1.05%] vs D1D8 hindlimbs n=51/171 [29.82%]; ****p<0.001, z=7.69; PD2 hindlimbs n=13/81 [16.04%] vs D2D5 hindlimbs n=44/76 [57.89%]; ****p<0.001, z=4.45; PD2 hindlimbs n=13/81 [16.04%] vs D2D8 hindlimbs n=38/80 [47.50%]; ****p<0.001, z=4.29; PD2 hindlimbs n=13/81 [16.04%] vs D2D13 hindlimbs n=48/83 [57.83%]; ****p<0.001, z=5.53). Forelimb phase relationships are shown in (C, E) for each time point, with less severe coordination disruptions on acrylic (C, PD1 forelimbs n=5/238 [2.10%] vs D1D5 forelimbs n=7/218 [3.21%]; n.s., z=0.73; PD1 forelimbs n=5/238 [2.10%] vs D1D8 forelimbs n=7/218 [3.21%]; n.s., z=0.73; PD2 forelimbs n=6/82 [7.32%] vs D2D5 forelimbs n=14/82 [17.07%]; n.s., z=1.93; PD2 forelimbs n=6/82 [7.32%] vs D2D8 forelimbs n=17/88 [19.32%]; *p<0.005, z=2.35) and dramatic coordination disruptions on Sylgard (e, PD1 forelimbs n=8/189 [4.23%] vs D1D5 forelimbs n=23/177 [12.99%]; ***p<0.005, z=3.01; PD1 forelimbs n=8/189 [4.23%] vs D1D8 forelimbs n=33/171 [19.30%]; ***p<0.001, z=4.49; PD2 forelimbs n=3/81 [3.70%] vs D2D5 forelimbs n=34/76 [44.74%]; ****p<0.001, z=6.75; PD2 forelimbs n=3/81 [3.70%] vs D2D8 forelimbs n=24/80 [30.00%]; ****p<0.001, z=4.75).
-
Figure 2—source data 1
File contains the raw data for Figure 2 and Figure 2—figure supplements 1 and 2.
These files contain interlimb phase data for the pre-injury control time point with the animals walking on acrylic and sylgard surfaces, plus pre-injury DoxON (silenced) with the animals walking on acrylic and sylgard surfaces. Raw data for Figure 2—figure supplement 2A-F can be found associated with Shepard et al., 2021.
- https://cdn.elifesciences.org/articles/82944/elife-82944-fig2-data1-v2.xlsx
Figure 2—figure supplement 1
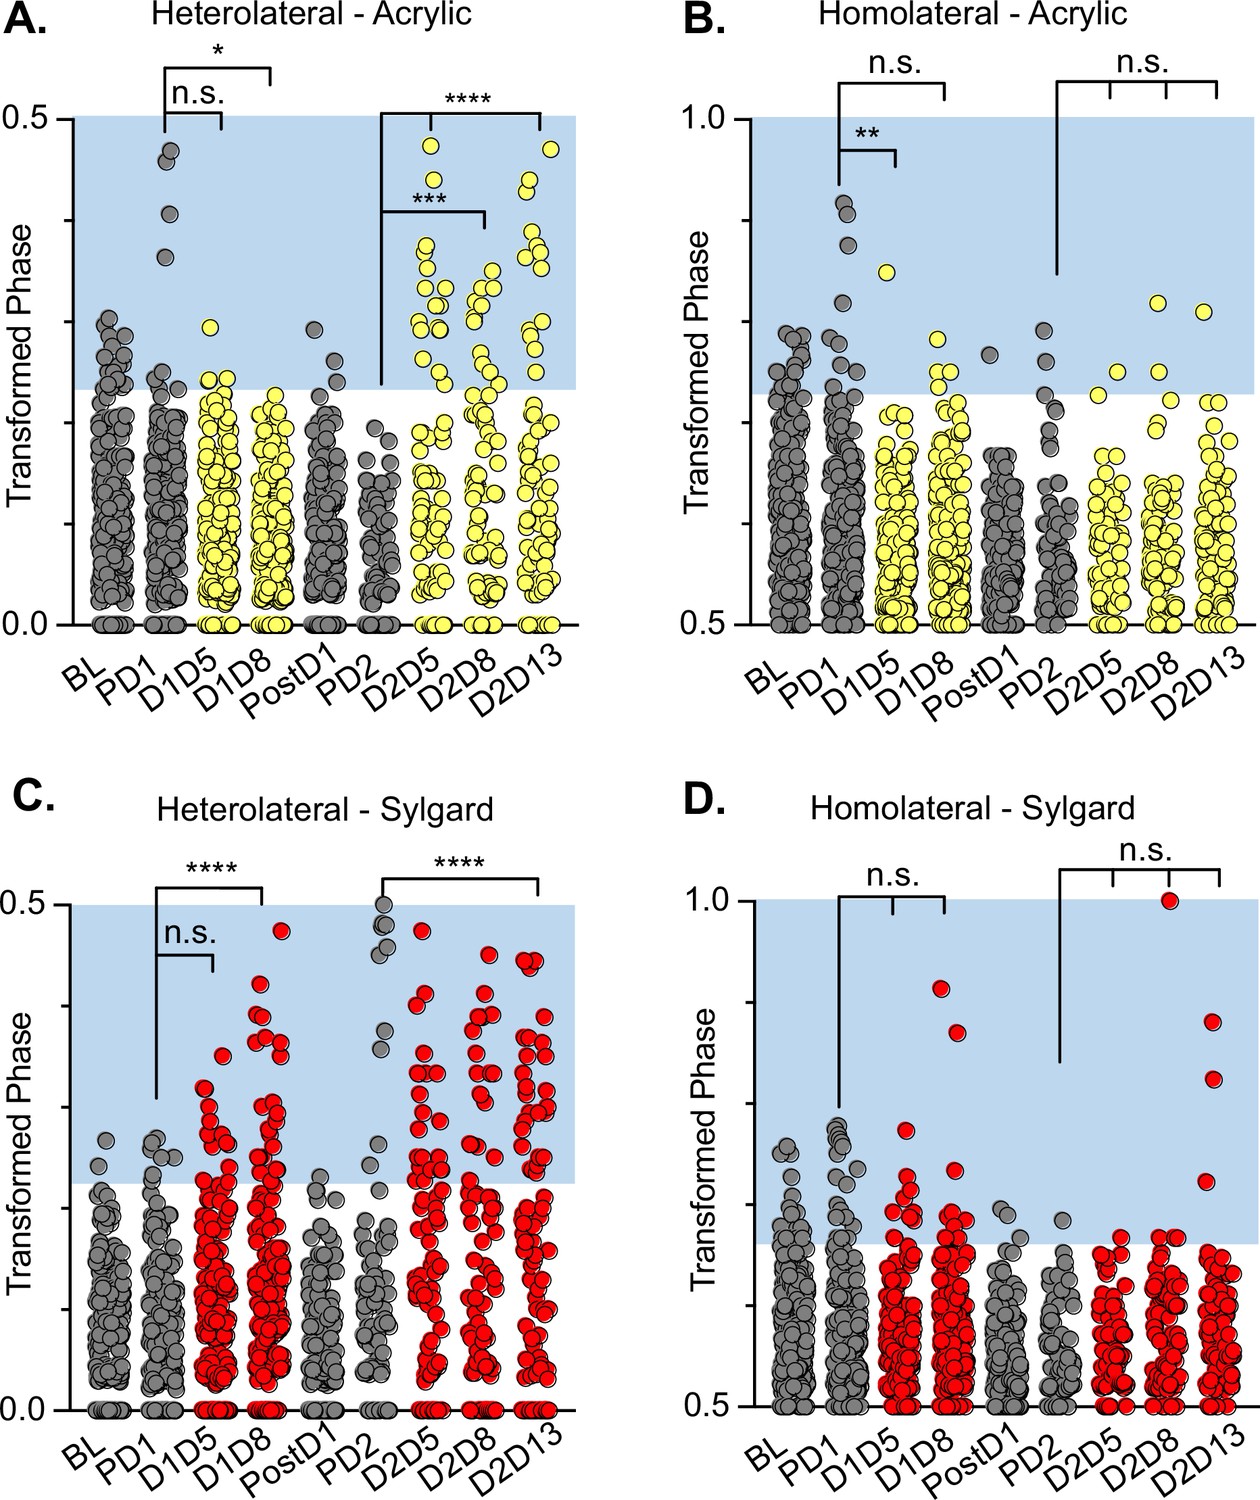
Heterolateral demonstrates context-dependence, while homolateral limb pair relationships are context-independent during long descending propriospinal neuron (LDPN) silencing.
Graphs demonstrate linear representation of heterolateral and homolateral limb pairs. All control steps are indicated by gray circles. Acrylic (low coefficient of friction, CoF) Dox steps are indicated by yellow circles and Sylgard (high CoF) doxycycline (Dox) steps are indicated by red circles. Hindlimb and forelimb phase relationships were transformed and graphed linearly for each time point (A–D). All statistics shown directly reference the Pre-Dox time point immediately prior (i.e. PD1 to D1D8, PD2 to D2D5, etc.). Significance was seen for the heterolateral limb pair during D1D8 and all Dox 2 time points on the acrylic surface (A; PD1 n=8/238 [3.36%] vs D1D5 n=4/218 [1.83%], p=0.309, z=1.02; PD1 n=8/238 [3.36%] vs D1D8 n=1/218 [0.46%], *p<0.05, z=2.23; PD2 n=1/82 [1.21%] vs D2D5 n=17/82 [20.73%]; ****p<0.001, z=4; PD2 n=1/82 [1.21%] vs D2D8 n=11/88 [13%], ***p<0.005, z=2.87; PD2 n=1/82 [1.21%] vs D2D13 n=13/85 [15.30%], ****p<0.001, z=3.28) and during D1D8, D2D5, and D2D13 on the Sylgard surface (C, PD1 n=7/189 [3.70%] vs D1D5 n=12/177 [6.78%], p=0.185, z=1.33; PD1 n=7/189 [3.70%] vs D1D8 n=22/171 [12.87%], ****p=0.001, z=3.19; PD2 n=10/81 [12.35%] vs D2D5 n=21/76 [27.63%], *p<0.05, z=2.4; PD2 n=10/81 [12.35%] vs D2D8 n=18/80 [22.50%], p=0.089, z=1.7; PD2 n=10/81 [12.35%] vs D2D13 n=27/83 [32.53%], ***p<0.005, z=3.09). The homolateral limb pair showed a significant difference at the D1D5 time point on the acrylic surface (B, PD1 n=11/238 [4.62%] vs D1D5 n=1/218 [0.45%], **p<0.01, z=2.77; PD1 n=11/238 [3.36%] vs D1D8 n=4/218 [1.83%], p=0.096, z=1.67; PD2 n=3/82 [4%] vs D2D5 n=2/82 [2.43%], p=0.65, z=.45; PD2 n=3/82 [4%] vs D2D8 n=3/88 [3%], p=0.93, z=0.088; PD2 n=3/82 [4%] vs D2D13 n=1/85 [1.17%], p=0.294, z=1.05). However, it is important to note that the abnormal steps were reduced during Dox, resulting in significance. No significance was seen on the Sylgard surface at any time point for the homolateral limb pair (D, PD1 n=16/189 [8.46%] vs D1D5 n=8/177 [4.51%], p=0.128, z=1.52; PD1 n=16/189 [8.46%] vs D1D8 n=7/171 [4.09%], p=0.09, z=1.67; PD2 n=1/81 [1.23%] vs D2D5 n=1/76 [27.63%], p=0.964, z=.045; PD2 n=1/81 [1.23%] vs D2D8 n=1/80 [1.25%], p=0.993, z=0.009; PD2 n=1/81 [1.23%] vs D2D13 n=3/83 [32.53%], p=0.323, z=0.99).
Figure 2—figure supplement 2

Relationships between limb pairs are maintained during long ascending propriospinal neuron (LAPN) and long descending propriospinal neuron (LDPN) silencing.
Control relationships between limb pair coordination are shown for hindlimb-hindlimb vs heterolateral hindlimb-forelimb (A, G), homolateral hindlimb-forelimb (B, H), and the hindlimb-forelimb pairs (C, I). For all individual steps the heterolateral and homolateral limb pairs are graphed using circular phase plots and are assessed using Watson’s Non-Parametric U2 circular statistics. Control acrylic steps are indicated by light gray circles and control Sylgard steps are indicated by dark gray circles. Values are clustered, likely due to the overwhelming presence of alternating gait at control time points. The relationships for the previously described limb pairs are demonstrated for LAPN silencing (D–F) and LDPN silencing (J–L). Doxycycline (Dox) acrylic steps are indicated by yellow circles and Dox Sylgard steps are indicated by red circles. During LAPN silencing, acrylic steps remain clustered, also likely due to the large concentration of alternating steps. The patterns are similar for the limb pairs during LAPN silencing on the Sylgard surface and during LDPN silencing on both surfaces indicating that the LDPN silenced phenotype is not context-dependent.
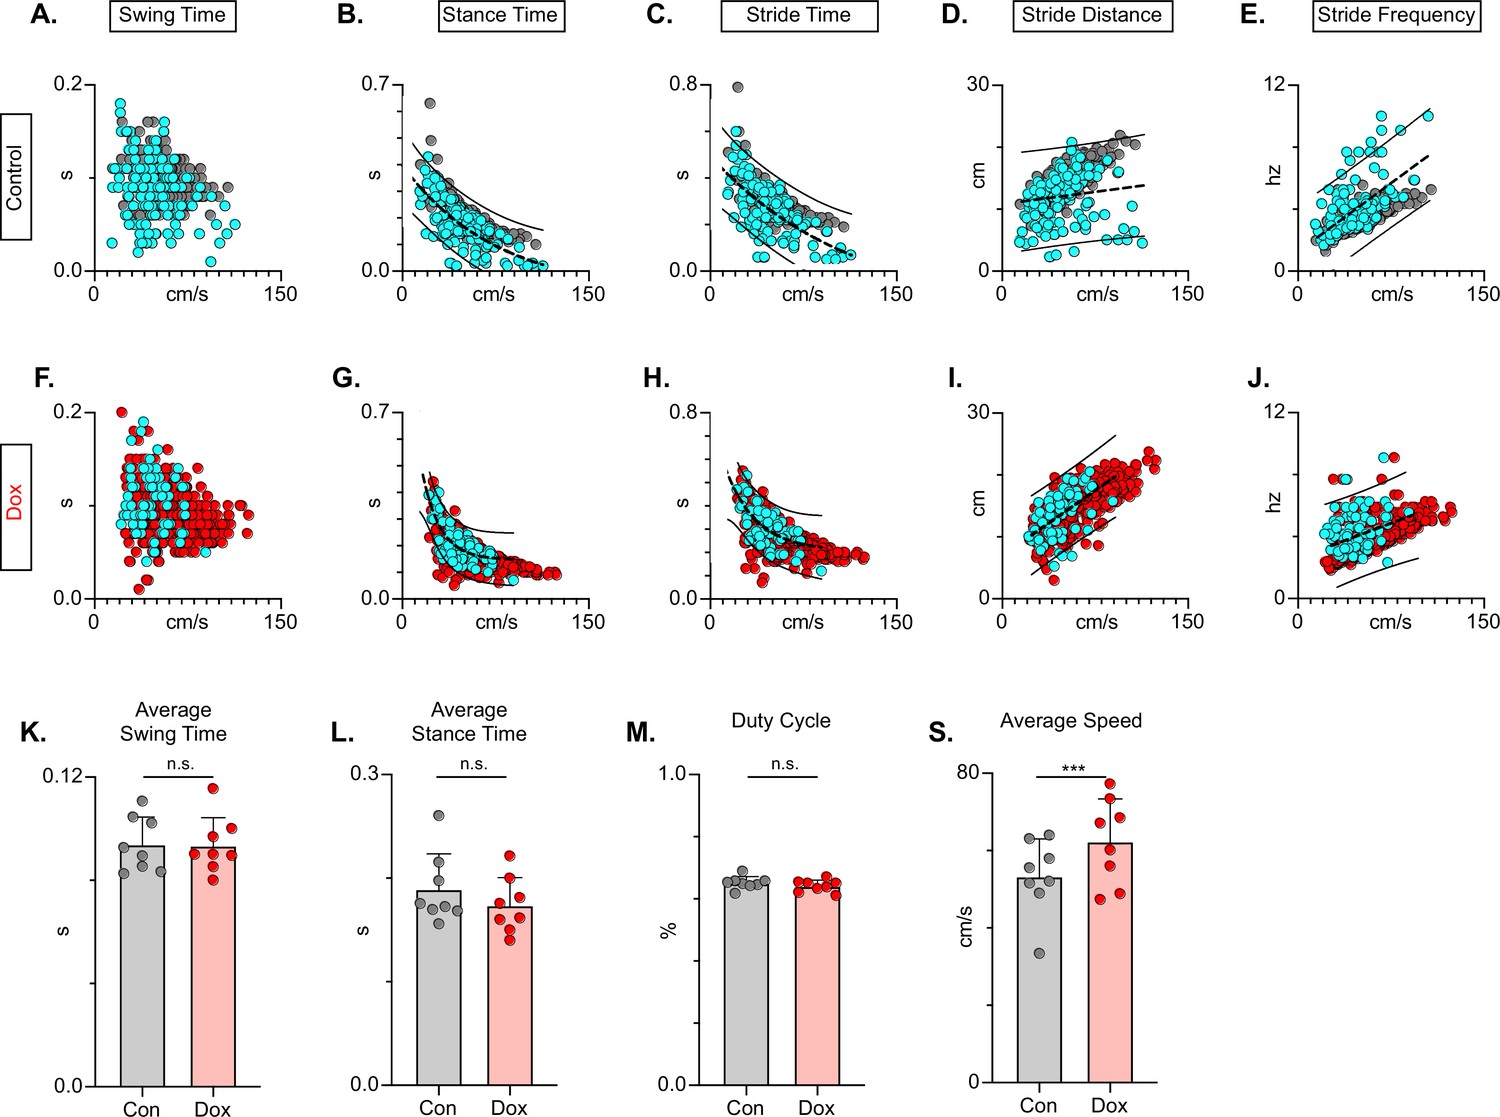
Figure 3
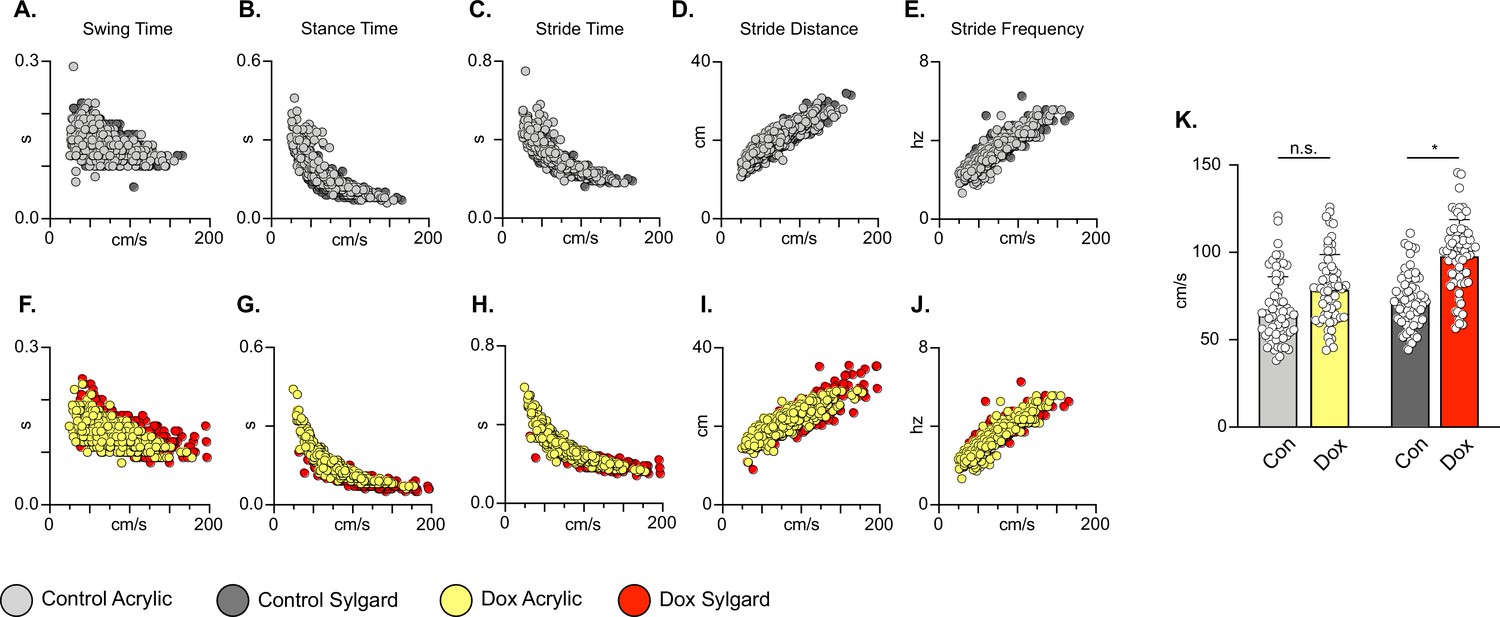
Silencing long descending propriospinal neurons (LDPNs) does not affect key features of locomotion.
Spatiotemporal measures (swing time, stance time, stride time, stride distance) were plotted against speed for Control (A–E) and doxycycline (Dox) (F–J) time points. Lines of best fit are not displayed on graphs for clarity. Stance time and stride time display similar decay relationships during silencing of both pathways, regardless of surface (acrylic stance time: Control R2=0.809 vs Dox R2=0.896; Sylgard stance time: Control R2=0.764 vs Dox R2=0.811; LDPN Sylgard stride time: Control R2=0.840 vs Dox R2=0.842), while linear relationships are indicated for stride distance (D, I; acrylic stride distance: Control R2=0.799 vs Dox R2=0.745; Sylgard stride distance: Control R2=0.780 vs Dox R2=0.719) and stride frequency (E, J; acrylic stride frequency: Control R2=0.864 vs Dox R2=0.879; Sylgard stride frequency: Control R2=0.793 vs Dox R2=0.788). The average instantaneous speed was increased by Dox, regardless of walking surface (K; Average speed acrylic Control 67.09±18.97 vs Dox: 78.89±19.82, n.s.; Mixed-Model ANOVA; Average speed Sylgard Control 73.15±15.05 vs Dox: 98.13±20.63, ****p<0.05, Mixed-Model ANOVA).
-
Figure 3—source data 1
File contains the raw data for Figure 3 showing the spatiotemporal characteristics of speed-dependent change in swing time, stance time, stride time, stride distance, and stride frequency for animals stepping on the acrylic and sylgard surfaces with and without Dox.
- https://cdn.elifesciences.org/articles/82944/elife-82944-fig3-data1-v2.xlsx
Figure 4
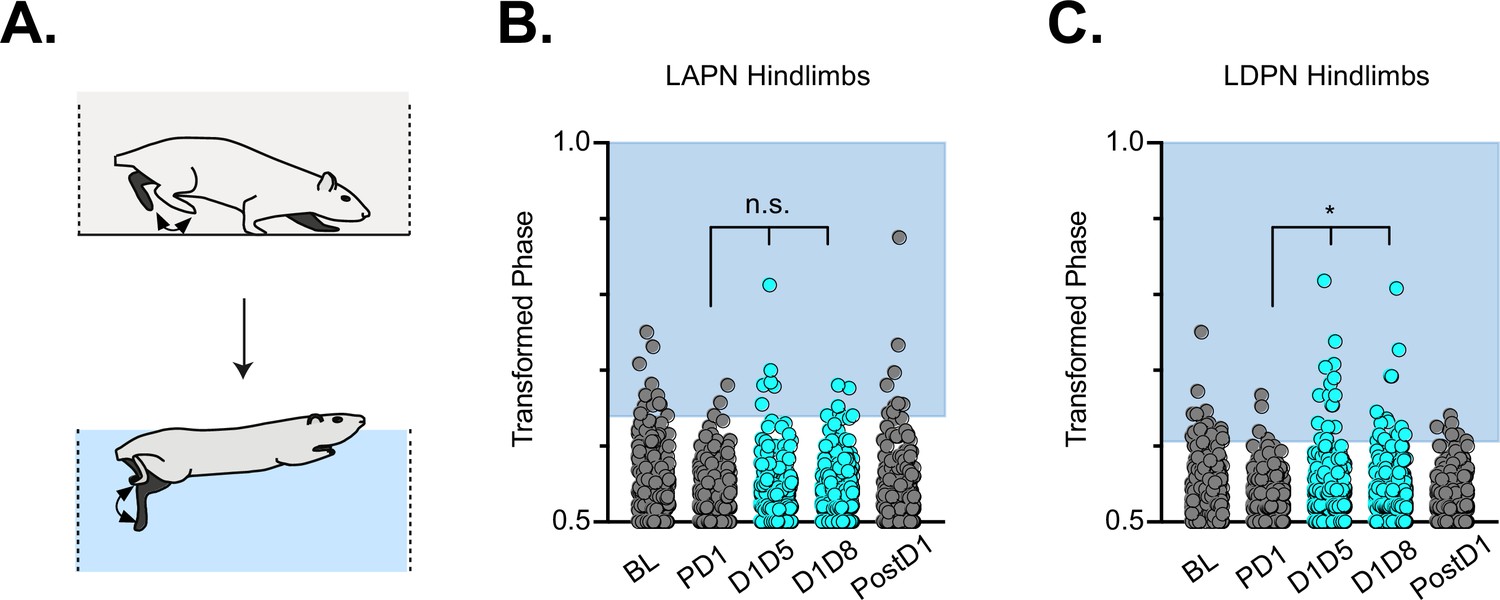
Hindlimb coordination during swimming is largely maintained during long ascending propriospinal neuron (LAPN) and long descending propriospinal neuron (LDPN) silencing.
Similar to hindlimb coordination during overground locomotion, phase can be calculated for the R & L hindlimbs during a swimming task (A) Hindlimb alternation was maintained during silencing of LAPNs (B, PD1 hindlimbs n=4/294 [1.36%] vs D1D5 hindlimbs n=8/302 [2.65%]; n.s., z=1.13; PD1 hindlimbs n=4/294 [1.36%] vs D1D8 hindlimbs n=8/278 [2.88%]; n.s., z=1.25). However, silencing the LDPNs resulted in a small but statistically significant increase in the number of swim cycles with abnormal R-L phase (C, PD1 hindlimbs n=9/408 [2.21%] vs D1D5 hindlimbs n=23/416 [5.53%]; *p<0.05, z=2.5; PD1 hindlimbs n=9/408 [2.21%] vs D1D8 hindlimbs n=24/468 [5.13%]; *p<0.05, z=2.33).
-
Figure 4—source data 1
File contains the raw data for Figure 4 showing the hindlimb-hindlimb (HL-HL) phase during swimming with the long ascending propriospinal neurons (LAPNs) silenced (from Shepard et al., 2021) or with the long descending propriospinal neurons (LDPNs) silenced (DOXON).
- https://cdn.elifesciences.org/articles/82944/elife-82944-fig4-data1-v2.xlsx
Figure 5
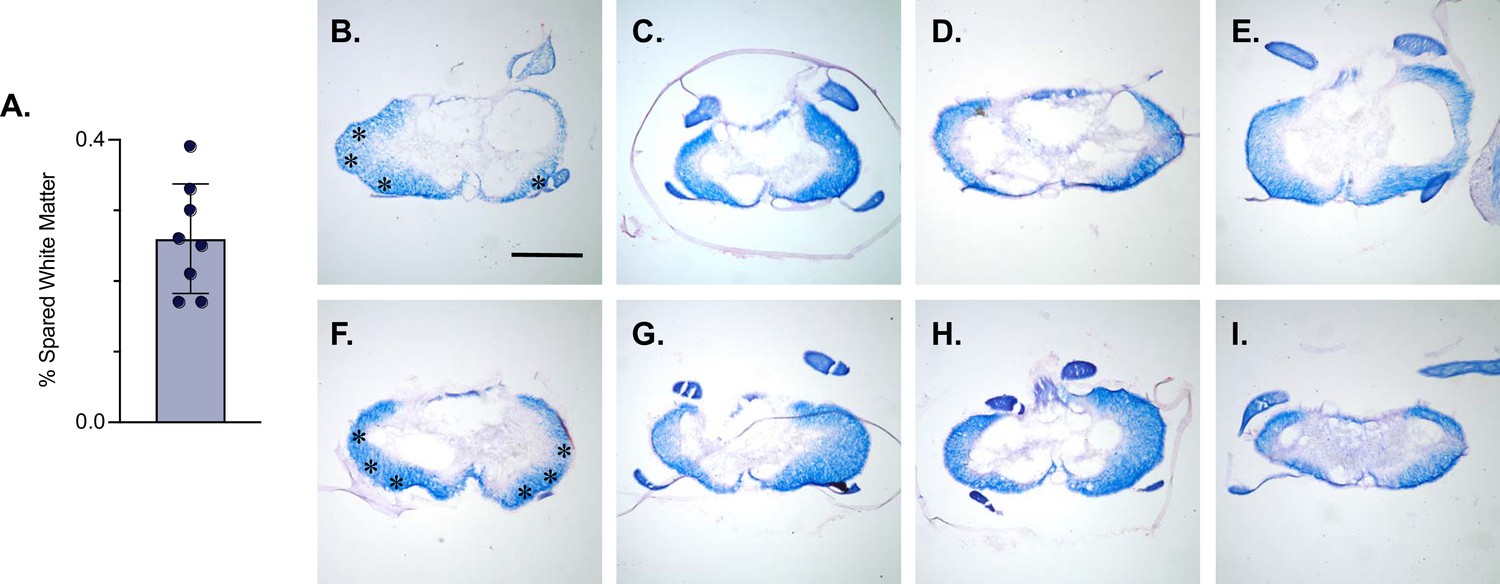
White matter sparing is present at the injury epicenter.
Spared white matter percentage at the injury epicenter ranges from 17–39% (A). White matter damage at the spinal cord injury epicenter as confirmed by histology (B–I). Individual images represent the injury epicenter of each animal used in the main dataset (n=8; average white matter percentage: 26%, SD 7.76%). Asterix in (B) and (F) indicate regions where spared LAPN axons would exist. Scale bar = 1 mm.
-
Figure 5—source data 1
File contains the raw data for Figure 5 showing the percent spared white matter at the injury epicenter derived from eriochrome cyanin stained section.
The section(s) with the smallest amount of spared white matter represents the injury epicenter.
- https://cdn.elifesciences.org/articles/82944/elife-82944-fig5-data1-v2.xlsx
Figure 6
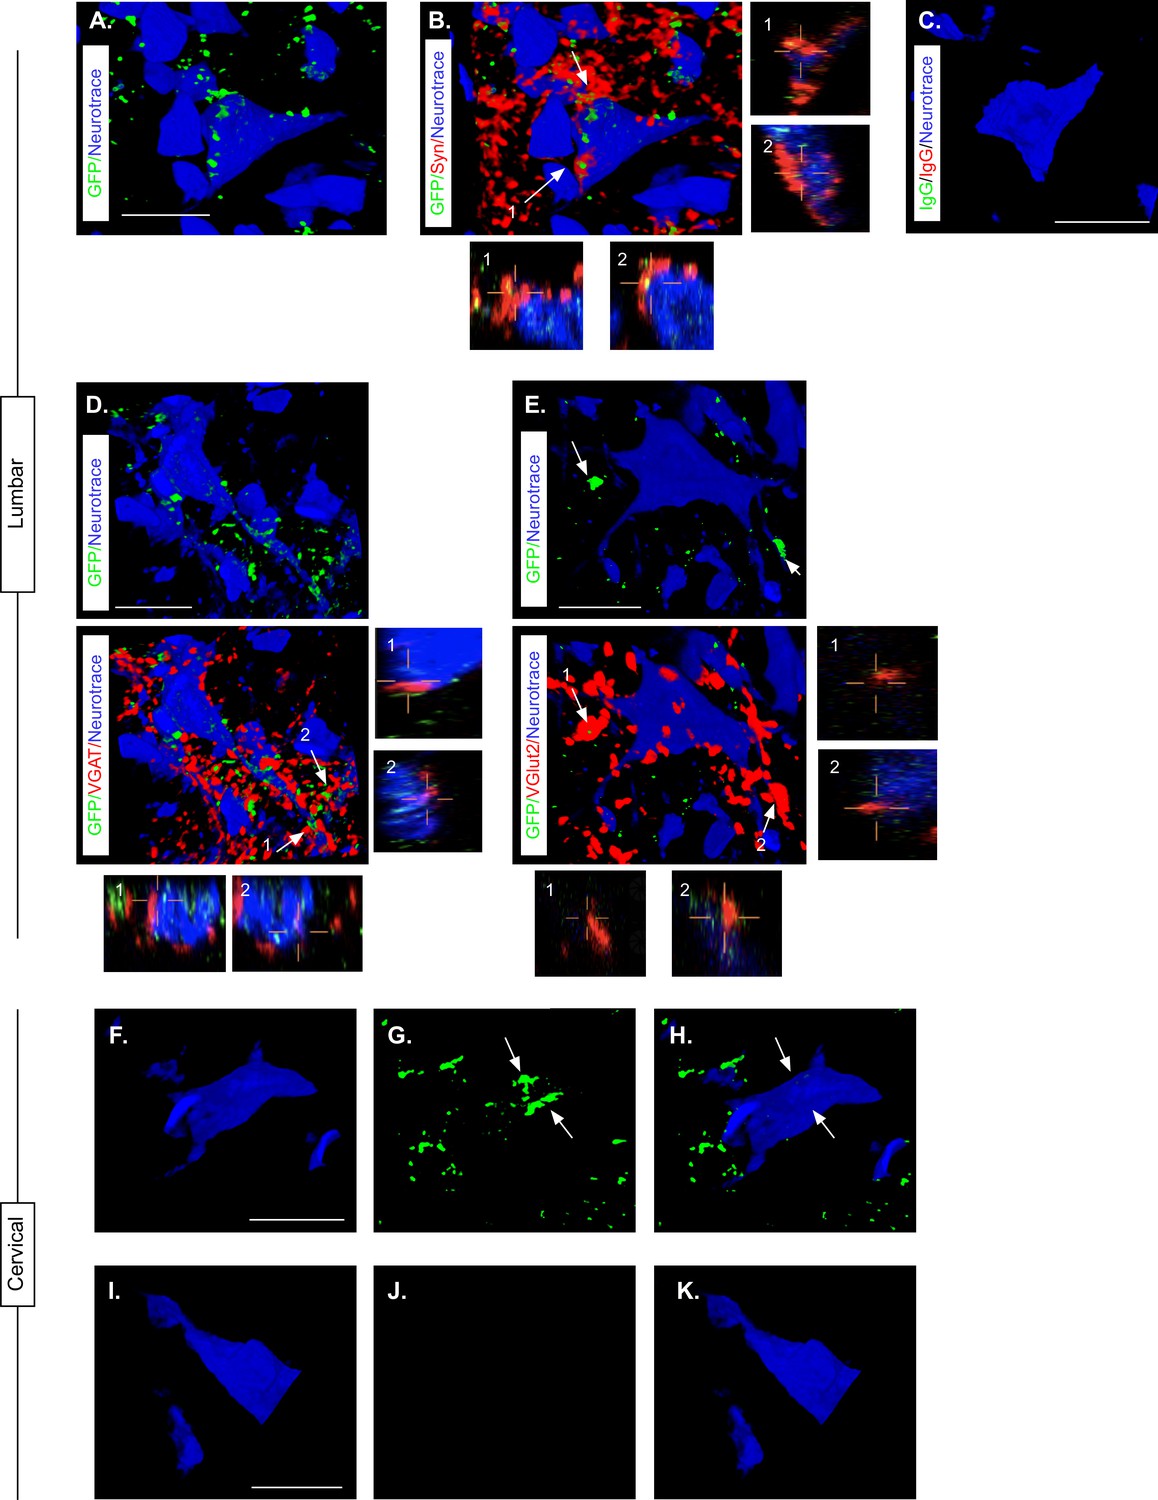
Presence of eTeNT-EGFP in putatively silenced long descending propriospinal neurons (LDPNs) across the level of injury.
High magnification, volume-rendered images demonstrating eTeNT.EGFP putatively positive fibers (green) surrounding fluorescent Nissl-stained neuronal cell bodies (Neurotrace - blue) and synaptophysin-labeled putative synapses (red) in lumbar spinal cord segments of interest (A, B, 100 x magnification, L1-L2 spinal cord). White arrows indicate areas of colocalization, which are further marked by numbers and xz, yz planes. Isotype control reveals minimal immunoreactivity (C, IgG controls for eTeNT.EGFP shown). eTeNT.EGFP (green) signal co-localizes with neuronal cell bodies/processes (blue) and with inhibitory neurotransmitter marker vesicular GABA transporter (D, VGAT, red), and excitatory neurotransmitter vesicular glutamate transporter 2 (E, VGlut2, red). eTeNT.EGFP putative cell bodies (green) in the cervical spinal cord colocalized with fluorescent nissl stained neurons (Neurotrace - blue) (F-H, C6-C7 spinal cord). Minimal presence of eTeNT.EGFP signal in isotype controls (I-K, C6-C7 spinal cord). Scale bars = 20 µm.
Figure 7
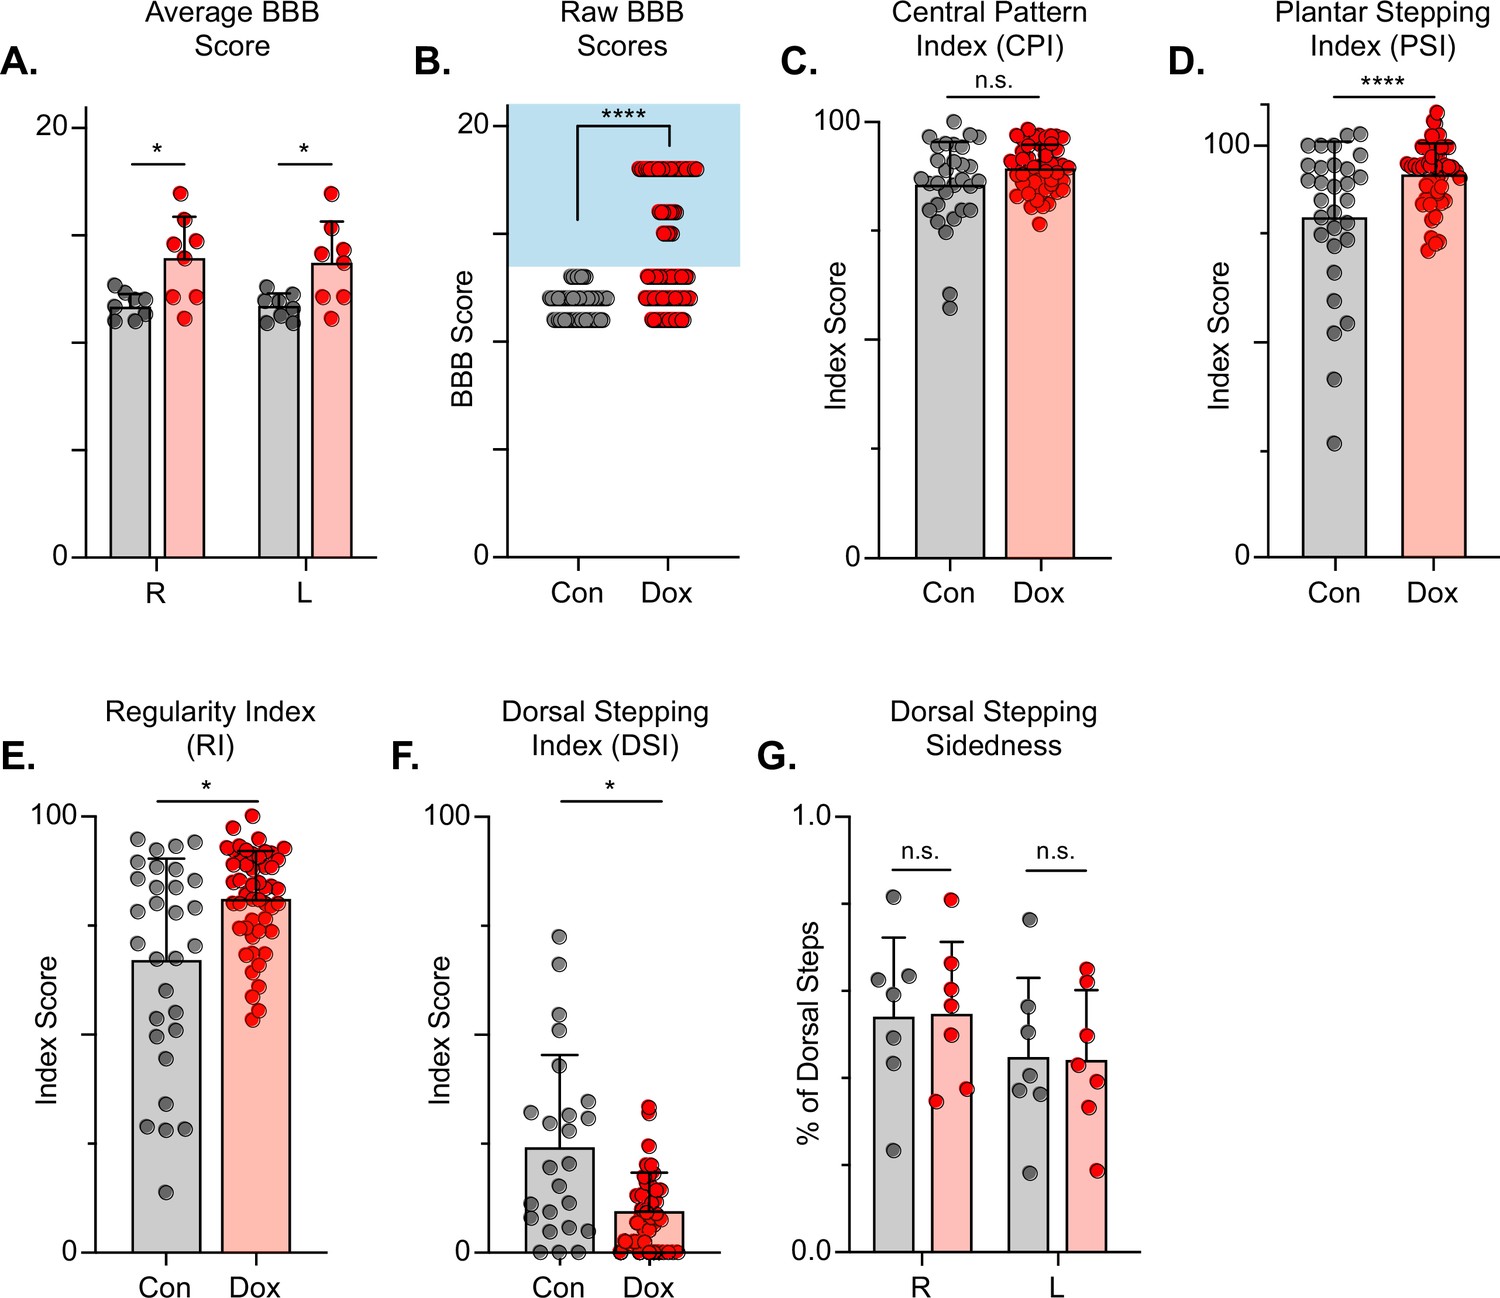
Silencing long descending propriospinal neurons (LDPNs) post-spinal cord injury (SCI) restores some coordination indices and improves gross locomotor outcomes.
Average Basso, Beattie, Bresnahan (BBB) scores for Control and doxycycline (Dox) time points are shown for each hindlimb (A, group average ± SD; Control Left to Dox Left, *p=0.021; Control Right to Dox Right, n.s. p=0.019; mixed model ANOVA, Bonferroni post hoc). No significant difference was found between right and left BBB scores so they were combined for average and raw scores (mixed model ANOVA, Bonferroni post hoc; statistics not shown on graph). Right and left hindlimb raw BBB scores are shown in (B). (Control: n=0/48 [0.0%] vs Dox: n=28/80 [35.0%]; ****p<0.001, z=4.64; Binomial Proportion Test; circles = individual left or right BBB scores; shaded region = values beyond control variability). Average coordinated pattern index (CPI) scores were not different (C, Control CPI: 84.47±8.61 vs Dox CPI: 88.28±3.07, t=1.66, df = 7, n.s. p=0.141; paired t-test). Average plantar stepping index (PSI) scores were significantly different (D, Control PSI: 79.32±15.97 vs Dox PSI: 91.71±6.45, t=3.22, df = 7, *p=0.015; paired t-test). Average regularity index (RI) scores were significantly different (E, Control RI: 60.92±3.61 vs Dox RI: 78.81±8.97, t=7.69, df = 7, ****p>0.001; paired t-test). as was the average dorsal stepping index (DSI) scores (F, Control DSI: 24.31±18.49 vs Dox DSI: 9.64±6.66, t=3.33, df = 7, *p=0.013; paired t-test). Data are shown with individual animal scores from each Control and Dox time point to show variability (gray circles and red circles for Control and Dox, respectively). Dorsal stepping index accounts for total dorsal steps for both left and right hindlimbs. The total dorsal steps were separated based on sidedness: right hindlimb (RHL) and left hindlimb (LHL) (G, Control right: 0.546±0.183 vs Dox right: 0.553±0.162, df = 6, n.s. p=0.942; Control left: 0.454±0.183 vs Dox left: 0.447±0.162, df = 6, n.s. p=0.942; mixed model ANOVA). The right hindlimb showed more dorsal steps overall; however, it maintained that percentage during Dox. No significant differences were seen in sidedness (mixed model ANOVA, statistics not shown on graph).
-
Figure 7—source data 1
File contains the raw data for Figure 7 showing the gross motor scores including the Basso, Beattie, Bresnahan (BBB) Open Field Locomotor Scale scores and subscores, the Central Pattern, Regularity, Plantar Stepping, Dorsal Stepping, and Dorsal Sidedness indices.
- https://cdn.elifesciences.org/articles/82944/elife-82944-fig7-data1-v2.xlsx
Figure 8
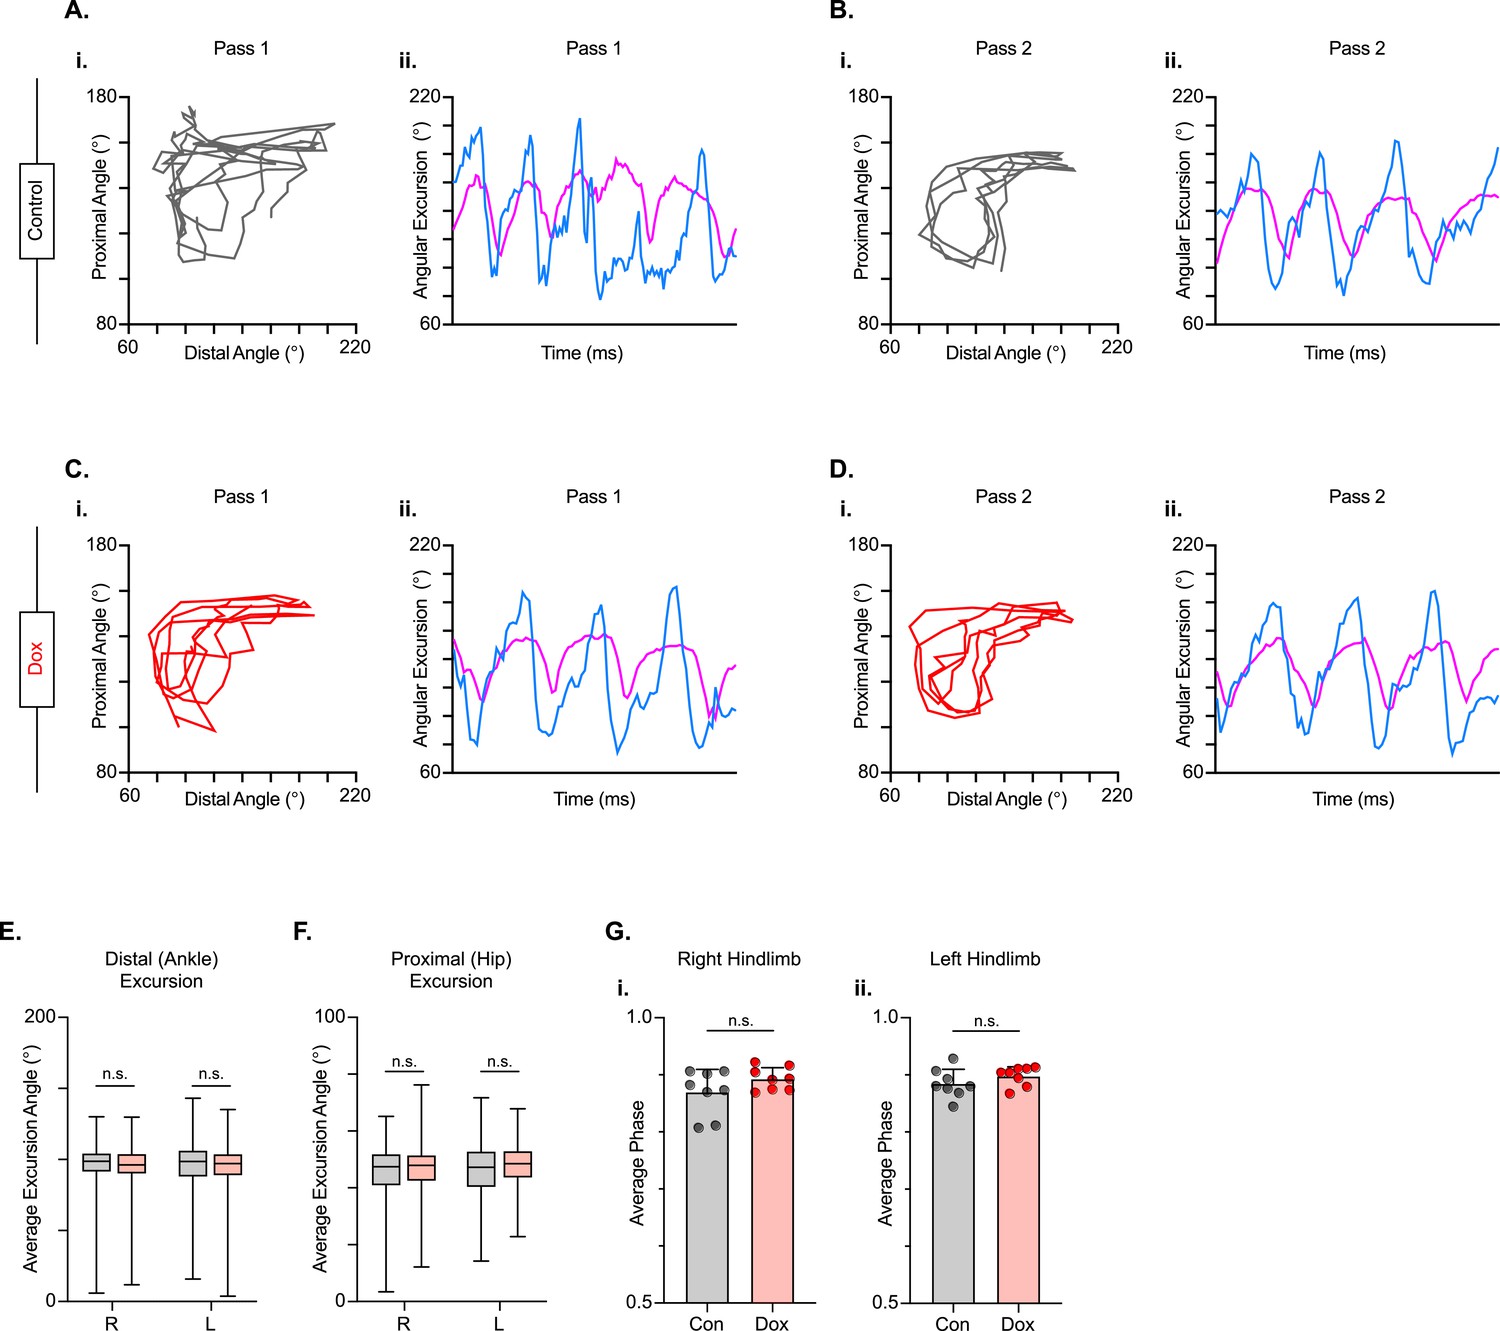
Long descending propriospinal neuron (LDPN) silencing has no effect on intralimb coordination after spinal cord injury.
Angle-angle plots and excursion traces are shown using our three-segment, two-angle model of the hindlimb which incorporates the hip-knee into the proximal angle and the knee-ankle into the distal angle. Shown are the proximal (purple) and distal (blue) angles during control (A, B) and doxycycline (Dox) (C, D) time points. Distal angle excursion (E, Control right average: 90.90 vs Dox right average: 93.45, df = 7, n.s., R.M. ANOVA; Control left average: 91.49 vs Dox left average: 93.81, df = 7, n.s., R.M. ANOVA) and proximal angle excursion (H, Control right average: 42.67 vs Dox right average: 45.93, df = 7, n.s., R.M. ANOVA; Control left average: 45.08 vs Dox left average: 47.45, df = 7, n.s., R.M. ANOVA; middle bar indicates group average with extension bars indicating the range of raw data) were unchanged as a result of silencing. Intralimb phase values relating the peak of one angle to the peak of the other are converted from a scale of 0–1 to 0.5–1.0 to be viewed linearly (G). The average intralimb coordination values for the right and left hindlimbs are plotted for Control and Dox time points (Control right: 0.87±0.04 vs Dox right: 0.89±0.02, t=2.44, df = 7, n.s. p=0.045, paired t-test; Control left: 0.88±0.03 vs Dox left: 0.90±0.02; t=1.16, df = 7, n.s. p=0.286, paired t-test; circles = individual step cycles; shaded region = values beyond control variability). No significant differences in intralimb coordination were found.
-
Figure 8—source data 1
File contains the raw data for Figure 8 showing the kinematic measures of hip-ankle-toe (HAT), iliac crest-hip-ankle (IHA), the excursion of each, and the phase difference for these two angles.
- https://cdn.elifesciences.org/articles/82944/elife-82944-fig8-data1-v2.xlsx
Figure 9 with 1 supplement
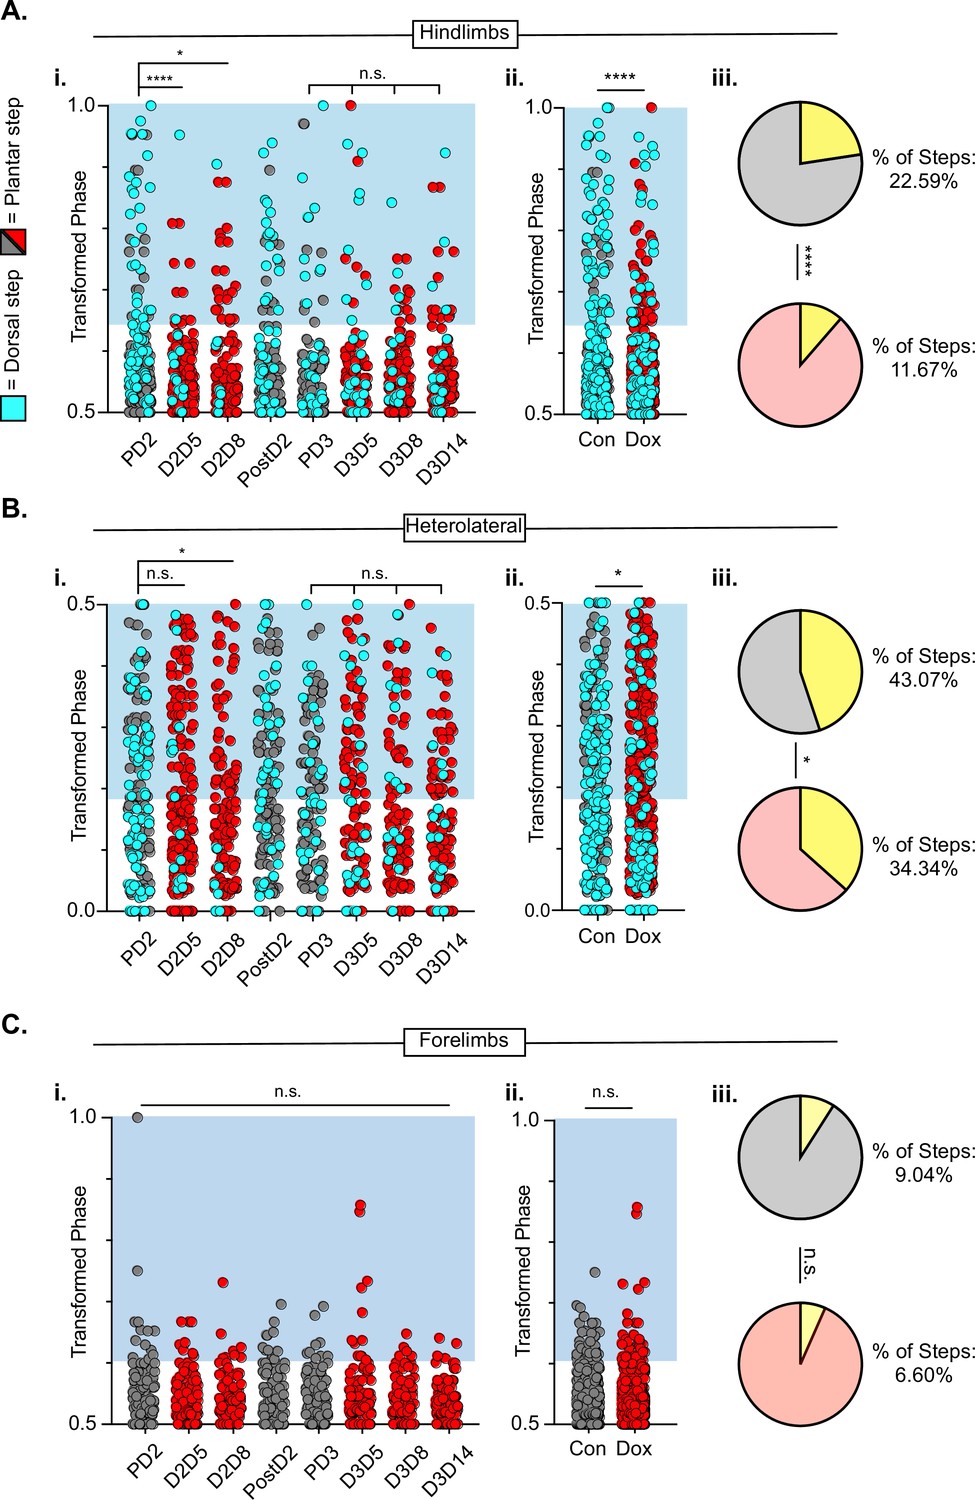
Hindlimb-hindlimb and hindlimb-forelimb coupling relationships are marginally improved while forelimb-forelimb coupling is unchanged during post-spinal cord injury (SCI_ long descending propriospinal neuron LDPN) silencing.
Transformed phase values for hindlimbs at each post-injury time point are separated in Ai and are collapsed into Control and Dox in Aii. # steps beyond control variability: PD2 hindlimbs n=33/114 [28.94%] vs D2D5 hindlimbs n=8/107 [7.48%]; ****p<0.001, z=4.10; PD2 hindlimbs n=33/114 [28.94%] vs D2D8 hindlimbs n=17/108 [15.74%]; *p<0.05, z=2.35; PD3 hindlimbs n=18/107 [16.82%] vs D3D5 hindlimbs n=13/108 [12.03%]; n.s., z=0.97; PD3 hindlimbs n=18/107 [16.82%] vs D3D8 hindlimbs n=12/100 [12%]; n.s., z=1.04; PD3 hindlimbs n=18/107 [16.82%] vs D3D13 hindlimbs n=12/107 [11.21%]; n.s., z=1.18. Control hindlimbs with dorsal steps: n=75/332 [22.59 %] vs Dox hindlimbs with dorsal steps: n=62/530 [11.70 %]; ****p<0.001, z=4.23, B.P. test. Transformed phase values are also shown for the heterolateral hindlimb-forelimb pairs are shown in (Bi), Dorsal steps were similarly collapsed into Control and doxycycline (Dox) in Bii. # steps beyond control variability: PD2 heterolateral n=47/114 [41.23%] vs D2D5 heterolateral n=42/107 [39.25%]; n.s., z=0.3; PD2 heterolateral n=47/114 [41.23%] vs D2D8 heterolateral n=28/108 [25.92%]; p<0.05, z=2.41; PD3 heterolateral n=44/107 [41.12%] vs D3D5 heterolateral n=49/108 [45.37%]; n.s., z=0.47; PD3 heterolateral n=44/107 [41.12%] vs D3D8 heterolateral n=37/100 [37%]; n.s., z=0.72; PD3 heterolateral n=44/107 [41.12%] vs D3D13 heterolateral n=36/107 [33.64%]; n.s., z=1.13, B.P. tests. Control heterolateral limbs with dorsal steps: n=143/332 [43.07 %] vs Dox heterolateral limbs with dorsal steps: n=192/530 [36.16 %]; *p<0.05., z=2.01, B.P. tests. Plantar steps are indicated by gray circles (Control) and red circles (Dox), while dorsal steps are indicated by teal circles for both Control and Dox datasets. The blue boxes indicate values outside of normal variability for the specified uninjured limb pair mean. The percentage of abnormal steps found above normal variability is calculated for their respective limb pairs (Aiii, Biii; statistics as shown above, B.P test). Forelimb-forelimb coupling data is represented in Ci-Ciii. No dorsal steps are seen for forelimb coupling, therefore, all steps represented for forelimb graphs are plantar. Transformed phase values are shown for the forelimb-forelimb pair in (Ci) with all time points collapsed in (Cii). # steps beyond control variability: PD2 forelimb n=12/114 [10.52%] vs D2D5 forelimb n=9/107 [8.41%]; n.s., z=0.54; PD2 forelimb n=12/114 [10.52%] vs D2D8 forelimb n=7/108 [6.48%]; n.s., z=1.08; PD3 forelimb n=8/107 [7.47%] vs D3D5 forelimb n=11/108 [10.19%]; n.s., z=0.7; PD3 forelimb n=8/107 [7.47%] vs D3D8 forelimb n=5/100 [5%]; n.s., z=0.73; PD3 forelimb n=8/107 [7.47%] vs D3D13 forelimb n=3/107 [2.80%]; n.s., z=1.55, B.P. tests. Control forelimb steps: n=30/332 [9.04%] vs Dox forelimb steps: n=35/530 [6.60%]; n.s., z=1.32, B.P. tests.
-
Figure 9—source data 1
File contains the raw data for Figure 9 showing the phase differences for hindlimbs, heterolateral limb pairs, and the forelimbs, including the percentage of dorsal steps.
- https://cdn.elifesciences.org/articles/82944/elife-82944-fig9-data1-v2.xlsx
Figure 9—figure supplement 1
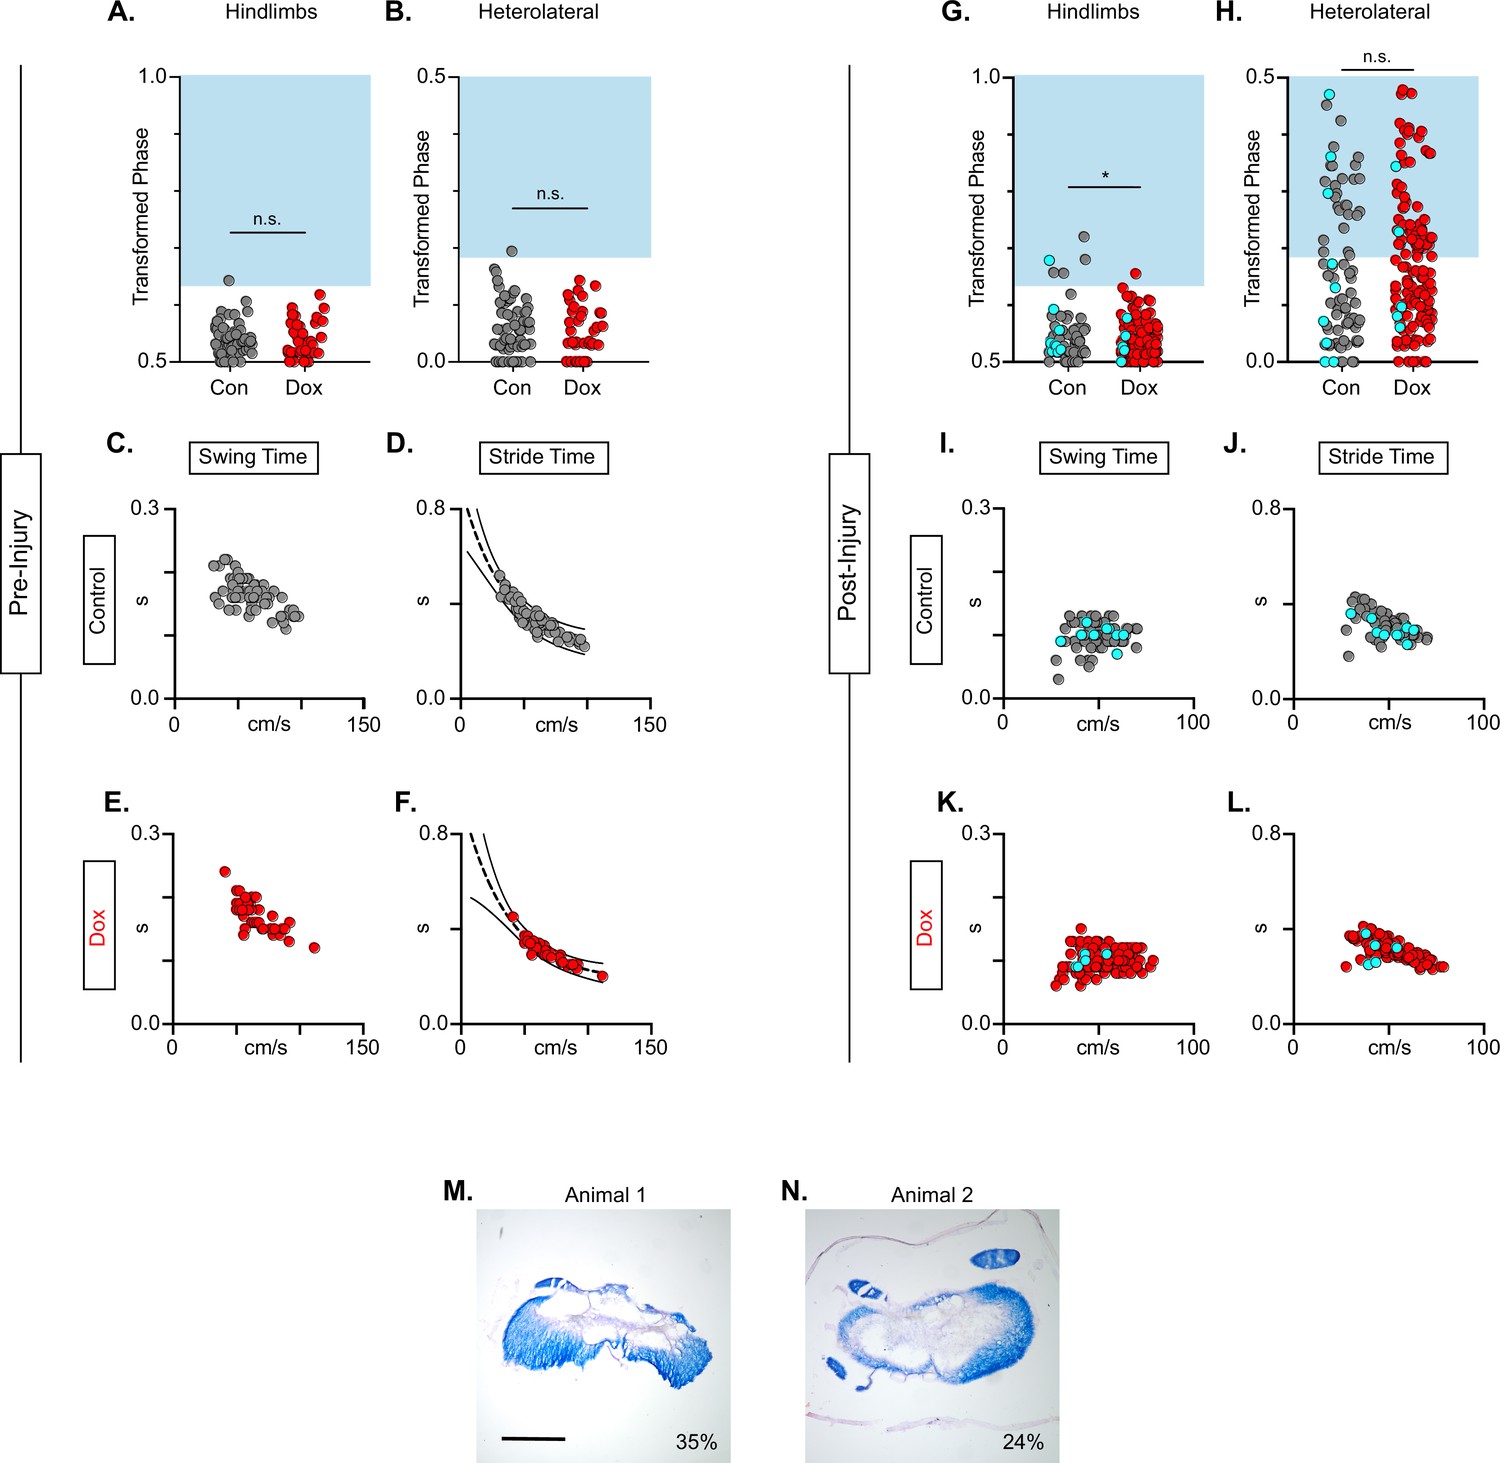
Animals excluded based on lack of behavioral outcomes pre-injury show no improvements in hindlimb coupling post-injury.
n=2 animals were excluded from post-injury group data based on lack of behavioral phenotype at any time point during pre-injury silencing. No disruptions were seen in hindlimb-hindlimb (A, Control hindlimbs: n=1/67 [1.49 %] vs Dox hindlimbs: n=0/38 [0.00 %]; n.s., z=0.76) or heterolateral hindlimb-forelimb (B; Control heterolateral: n=1/67 [1.49 %] vs Dox heterolateral: n=0/38 [0.00 %]; n.s., z=0.76). No changes were seen in relationships between swing time (C–E) or stride time (D–F) to speed prior to injury. All other spatiotemporal measures were graphed and relationships were maintained (data not shown). After spinal cord injury (SCI), improvements were not seen in hindlimb-hindlimb phase (G; Control hindlimbs: n=1/131 [0.76 %] vs Dox hindlimbs: n=5/79 [6.33 %]; *p<0.05, z=2.35) and similar disruptions in heterolateral hindlimb-forelimb (H; Control heterolateral: n=28/79 [35.44%] vs Dox heterolateral: n=58/131 [44.27%]; n.s., z=1.26) pairs were unchanged during silencing. Lack of improvement was seen in spatiotemporal measures during silencing (swing time: I, K; stride time: J, L). Control plantar steps = gray circles, doxycycline (Dox) plantar steps = red circles. All dorsal steps are shown as teal circles. An example of spared white matter for the removed animals is shown in (M, N) with 35% and 24% spared white matter percentages, respectively. Scale bar = 1 mm.
-
Figure 9—figure supplement 1—source data 1
File contains the raw data for Figure 9—figure supplement 1 which includes the phase data for the animals that were removed from the study because they did not show a DoxON silenced phenotype.
Data includes pre-injury (showing no phenotype) and post-injury showing only a small change in hindlimb (HL) phase during DoxON, but otherwise no locomotor phenotype.
- https://cdn.elifesciences.org/articles/82944/elife-82944-fig9-figsupp1-data1-v2.xlsx
Figure 10
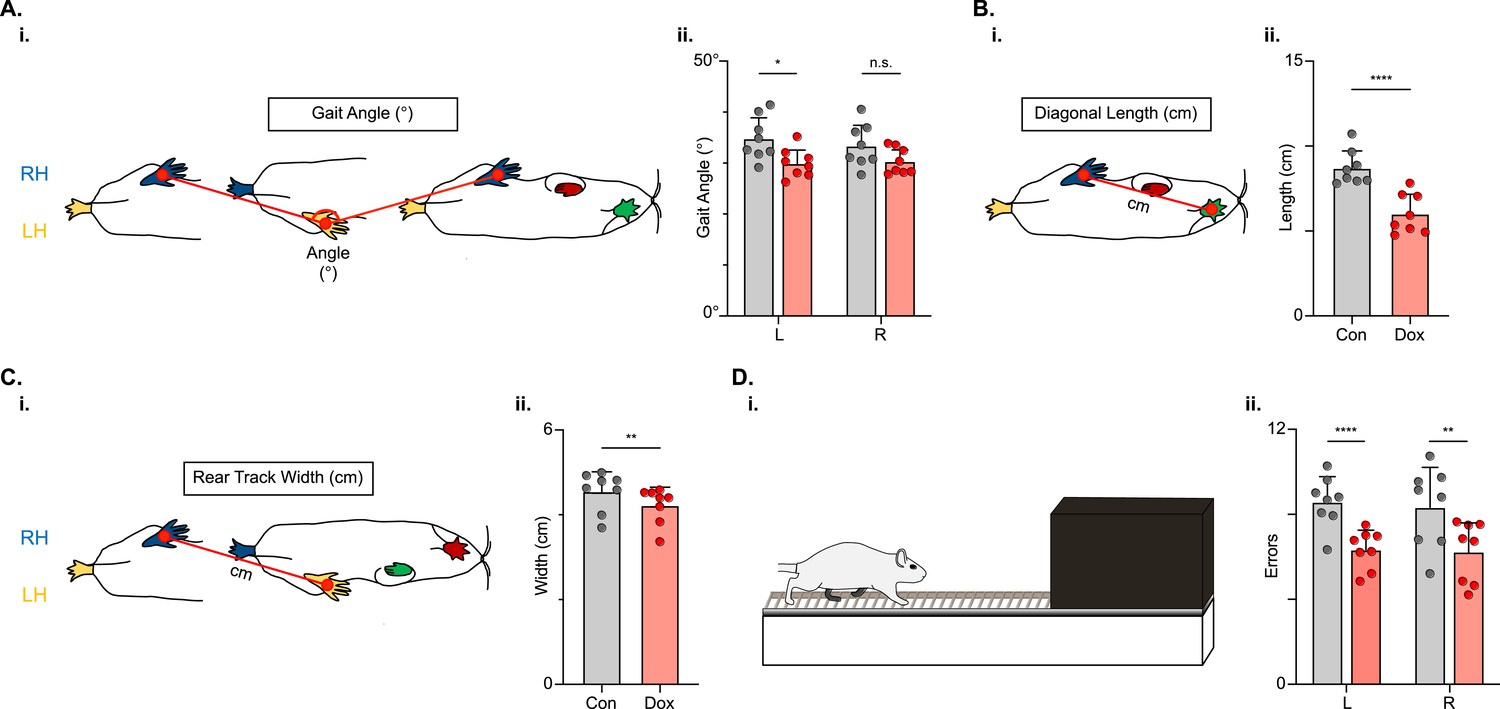
Indicators of postural stability were mildly improved during post-spinal cord injury (SCI) long descending propriospinal neuron (LDPN) silencing.
Throughout this figure, the right hindlimb (RH) will be shown in blue, the left hindlimb (LH) will be shown in yellow, the right forelimb (RF) will be shown in red, and the left forelimb (LF) will be shown in green. Control values are indicated by gray bars and Dox values are indicated by pink bars. Individual animal averages are shown for each postural stability variable are indicated by gray circles (Control) and red circles (doxycycline, Dox). An example of gait angle from a single set of initial paw contacts for the right hindlimb in reference to the left hindlimb is demonstrated in Ai. The average gait angle was calculated for both the left and right hindlimbs separately (Aii; Control left 34.81±4.26 vs Dox left 29.95±2.82, df = 7, *p<0.05; Control right 33.37±4.21 vs Dox right 30.35±2.54, df = 7, n.s.; RM ANOVA). An example of diagonal length, calculated from the initial contact of each hindlimb to its contralateral forelimb, is also shown between the right hindlimb and the left forelimb (Bi). Averages for Control and Dox are demonstrated in (Bii; Control diagonal length: 8.70±1.02 vs Dox diagonal length: 6.00±1.16, t=6.96, df = 7, ****p<0.001; paired t-test). Rear track width, calculated as the distance between each hindlimb’s initial contact, is exemplified in (Ci), with averages seen in (Cii; Control rear track width: 4.55±0.47 vs Dox rear track width: 4.22±0.42, t=3.99, df = 7, **p=0.005; paired t-test). Finally, the fixed-rung setup for ladder testing is shown in (Di). The black box indicates a dark box found at the end of the ladder, which is used as an incentive for rats to traverse the apparatus. The average footfalls were calculated for both the left and right hindlimbs separately (Dii; Control left 8.58±1.19 vs Dox left 6.34±0.92, df = 7, ****p<0.001; Control right 8.33±1.88 vs Dox right 6.24±1.43, df = 7, **p<0.01; RM ANOVA).
-
Figure 10—source data 1
File contains the raw data for Figure 10 showing the paw placement position and calculated gait angle, rear track width, and diagonal step length for post-injury animals with and without doxycycline (Dox).
Also provided is the raw data for the horizontal ladder assessment showing hindlimb foot slips on the ladder post-injury with and without Dox.
- https://cdn.elifesciences.org/articles/82944/elife-82944-fig10-data1-v2.xlsx
Figure 11
Long descending propriospinal neuron (LDPN) silencing restores key features of locomotion are restored following post-SCI.
Relationships between swing time, stance time, stride time, and stride distance are plotted against speed for Control (A-E) and doxycycline (Dox) (F-J) time points. Dorsal steps are indicated with teal circles for both Control and Dox, while plantar steps are indicated with either gray or red circles for Control and Dox, respectively. An exponential decay trendline is displayed for stance time and stride time graphs, while a linear trendline is displayed for stride frequency and stride distance (dotted line indicates trendline; Stance time: Control R2=0.476 vs Dox R2=0.638; Stride time: Control R2=0.406 vs Dox R2=0.556; Stride distance: Control R2=0.194 vs Dox R2=0.458; Stride Frequency: Control R2=0.259 vs Dox R2=0.495). 95% prediction intervals are shown for lines of best fit as solid lines. Average swing time (K, Control swing time 0.094±0.011 vs Dox swing time: 0.093±0.010, t=0.17, df = 7, n.s., paired t-test) and average stance time (L, Control stance time 0.189±0.034 vs Dox stance time: 0.174±0.027, t=1.94, df = 7, n.s., paired t-test) are indicated with circles representing individual animal averages. The average duty cycle (stance time/stride time M, Control duty cycle 0.651±0.020 vs Dox duty cycle: 0.641±0.019, t=1.83, df = 7, n.s., paired t-test) and average speed (S, Control speed 53.33±9.67 vs Dox speed: 62.31±11.05, t=4.177, df = 7, ***p<0.005, paired t-test) are plotted for Control (gray) and Dox (red) time points with averages indicated by bars. 1 SD is indicated by the bar above the average.
-
Figure 11—source data 1
File contains the raw data for Figure 11 showing the spatiotemporal components of stepping including swing, stance, and stride times vs speed, stride distance and frequency vs speed, plus the average swing and stance times, the duty cycle, and average speed.
These data are for post-injury with and without doxycycline (Dox).
- https://cdn.elifesciences.org/articles/82944/elife-82944-fig11-data1-v2.xlsx
Videos
Video 1
Example of stepping during Pre-Dox on the Acrylic walking surface.
Normal (1x) and one-quarter (.25x) speed.
Video 2
Example of stepping during Dox on the Acrylic walking surface.
Normal (1x) and one-quarter (.25x) speed.
Video 3
Example of stepping during Pre-Dox on the Sylgard walking surface.
Normal (1x) and one-quarter (.25x) speed.
Video 4
Example of stepping during Dox on the Sylgard walking surface.
Normal (1x) and one-quarter (.25x) speed.
Video 5
Example of post-injury stepping during Dox on the Sylgard walking surface.
Normal (1x) and one-quarter (.25x) speed.
Video 6
Example of post-injury stepping during Dox-off (control) on the Sylgard walking surface.
Normal (1x) and one-quarter (.25x) speed.
Tables
Table 1
Watson’s U2 circular statistics calculations for hindlimb and forelimb pairs during long descending propriospinal neuron (LDPN) silencing on sylgard and acrylic.
We performed Watson’s non-parametric two-sample U2 circular statistics to determine function uncoupling in the hindlimb pair and forelimb pair. The null hypothesis tested was that two samples were from two populations with the same direction. Silencing the LDPNs only affected the directionality of the data on the Sylgard surface (Critical value of Watson’s U2 (0.05,∞,∞)=0.1869; Zar, 1974 Appendix D, Table D.44).
| Behavioral context | Watson’s test | Left-right FL | Left-right HL |
|---|---|---|---|
| LDPN overground locomotion on Sylgard-coated surface | U2 | 1.9012 | 2.0597 |
| p-value | ****p<0.001 | ****p<0.001 | |
| LDPN overground locomotion on acrylic surface | U2 | 0.1549 | –0.5407 |
| p-value | n.s. | n.s. | |
| LDPN overground locomotion, Sylgard-coated vs acrylic (comparing control time points) | U2 | 0.1689 | 0.0599 |
| p-value | n.s. | n.s. | |
| LDPN overground locomotion, Sylgard coated vs acrylic (comparing DoxON time points) | U2 | 0.3649 | 0.7102 |
| p-value | ***p<0.005 | ****p<0.001 |
Additional files
Download links
A two-part list of links to download the article, or parts of the article, in various formats.
Downloads (link to download the article as PDF)
Open citations (links to open the citations from this article in various online reference manager services)
Cite this article (links to download the citations from this article in formats compatible with various reference manager tools)
Silencing long-descending inter-enlargement propriospinal neurons improves hindlimb stepping after contusive spinal cord injuries
eLife 12:e82944.
https://doi.org/10.7554/eLife.82944


