Svep1 is a binding ligand of Tie1 and affects specific aspects of facial lymphatic development in a Vegfc-independent manner
- Institute of Cardiovascular Organogenesis and Regeneration, Faculty of Medicine, WWU Münster, Germany
- Münster Imaging Network, Cells in Motion Interfaculty Centre, Faculty of Biology, WWU Münster, Germany
- Max Planck Institute for Heart and Lung Research, Department of Developmental Genetics, Germany
- Department of Cell Biology, National Cerebral and Cardiovascular Center Research Institute, Japan
- Münster Imaging Network, Cells in Motion Interfaculty Centre, WWU Münster, Germany
- Institute for Dental Research and Oral Musculoskeletal Biology, Center for Biochemistry, Faculty of Medicine and University Hospital Cologne, University of Cologne, Germany
Figures
Figure 1 with 3 supplements
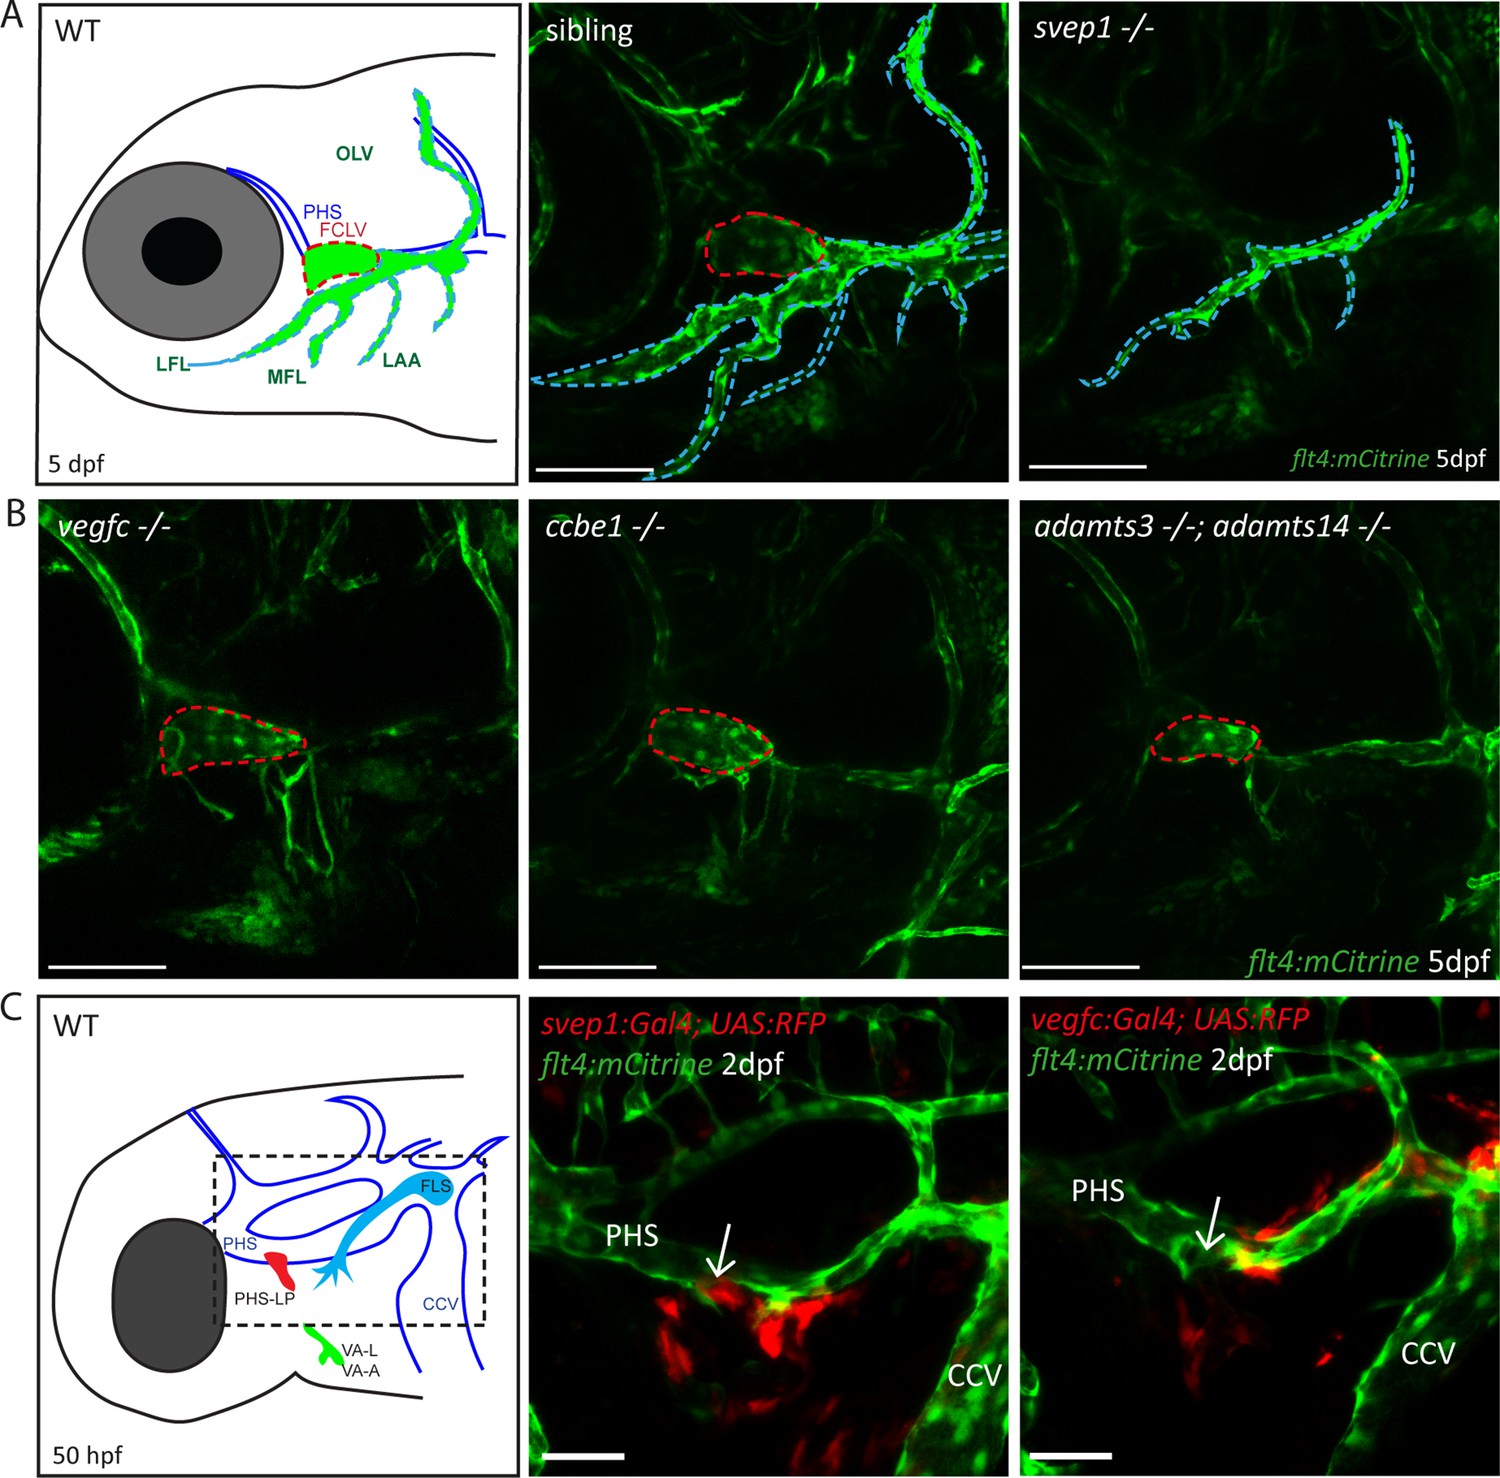
Svep1 is required for the development of the FCLV, in a Vegfc-independent manner.
(A) Schematic representation of facial lymphatic network at 5 dpf and maximum intensity projection of confocal images of flt4:mCitrine positive svep1 mutants (n = 10) and siblings (n = 6), highlighting facial lymphatic structures at 5 dpf. Scale bar = 100 µm. Note the absence of the FCLV (red dotted line) in svep1 mutants whereas other facial lymphatic structures are less strongly affected (OLV, LFL, MFL, and LAA marked by blue dotted lines). (B) Confocal images of flt4:mCitrine positive facial lymphatics in vegfc (n = 19), ccbe1 (n = 5), and adamts3;adamts14 (n = 2) mutants at 5 dpf. Scale bar = 100 µm. (C) Confocal images of svep1 and vegfc expression domains during sprouting from the PHS at 2 dpf, with schematic representation of different lymphatic progenitor populations. svep1 is expressed in close proximity to sprouting PHS-LPs, while vegfc expressing cells are more concentrated on the LECs arising from the CCV. Arrows point to sprouting PHS-LP. Scale bar = 50 µm. Expression patterns were confirmed in six embryos each (Figure 1—figure supplement 3). CCV, common cardinal vein; dpf, days post-fertilization; FCLV, facial collecting lymphatic vessel; FLS, facial lymphatic sprout; hpf, hours post-fertilization; LAA, lymphatic branchial arches; LEC, lymphatic endothelial cell; LFL, lateral facial lymphatic; MFL, medial facial lymphatic; OLV, otolithic lymphatic vessel; PHS, primary head sinus; PHS-LP, primary head sinus lymphatic progenitor; VA, ventral aorta; VA-A, ventral aorta angioblast; VA-L, ventral aorta lymphangioblast; WT, wildtype.
Figure 1—figure supplement 1
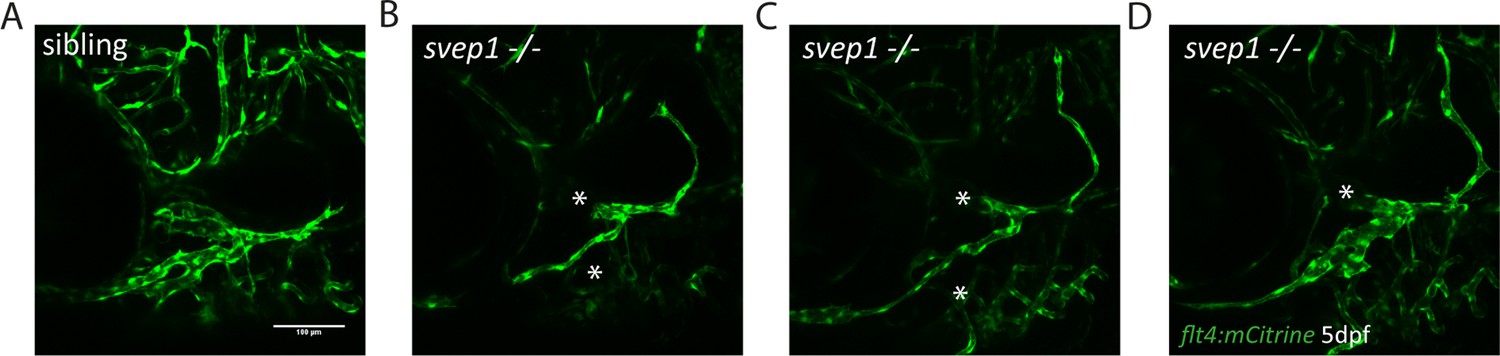
Facial lymphatic phenotype of svep1 mutant embryos.
(A–D) Confocal images of siblings and svep1 mutant embryos at 5 dpf, expressing the flt4:mCitrine transgene. Asterisk indicates reduced lymphatic vessels. Scale bar = 100 µm.
Figure 1—figure supplement 2
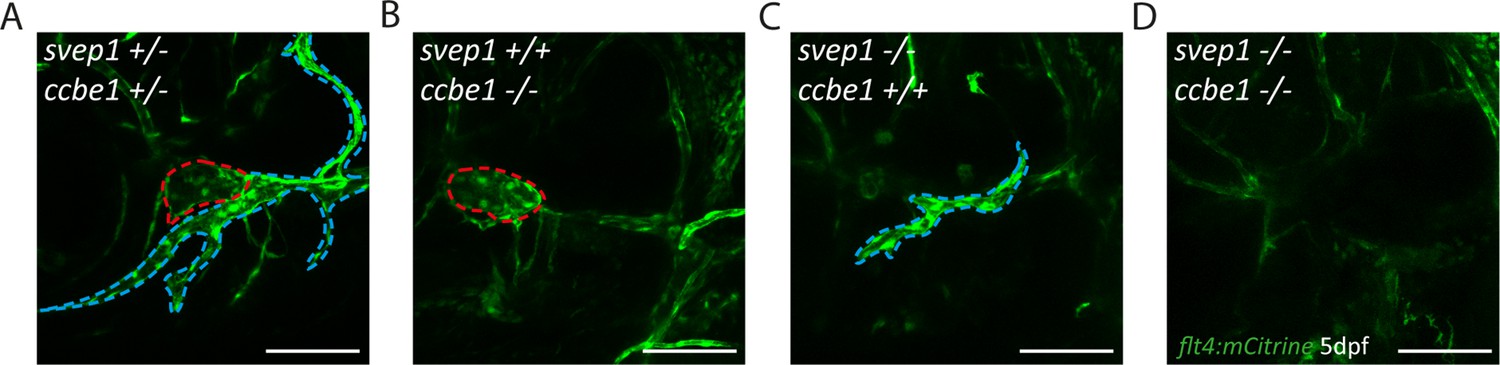
Combined loss of svep1 and ccbe1 leads to a loss of all facial lymphatic structures.
(A–D) Facial lymphatic phenotype of svep1; ccbe1 double mutants (n = 6) at 5 dpf expressing flt4:mCitrine. Note the complete lack of all lymphatic structures in double mutant embryo (D). OLV, LVL, MFL, marked by blue dotted lines. FCLV marked by red dotted lines. Scale bar = 100 µm.; FCLV, facial collecting lymphatic vessel; LFL, lateral facial lymphatic; MFL, medial facial lymphatic; OLV, otolithic lymphatic vessel.
Figure 1—figure supplement 3
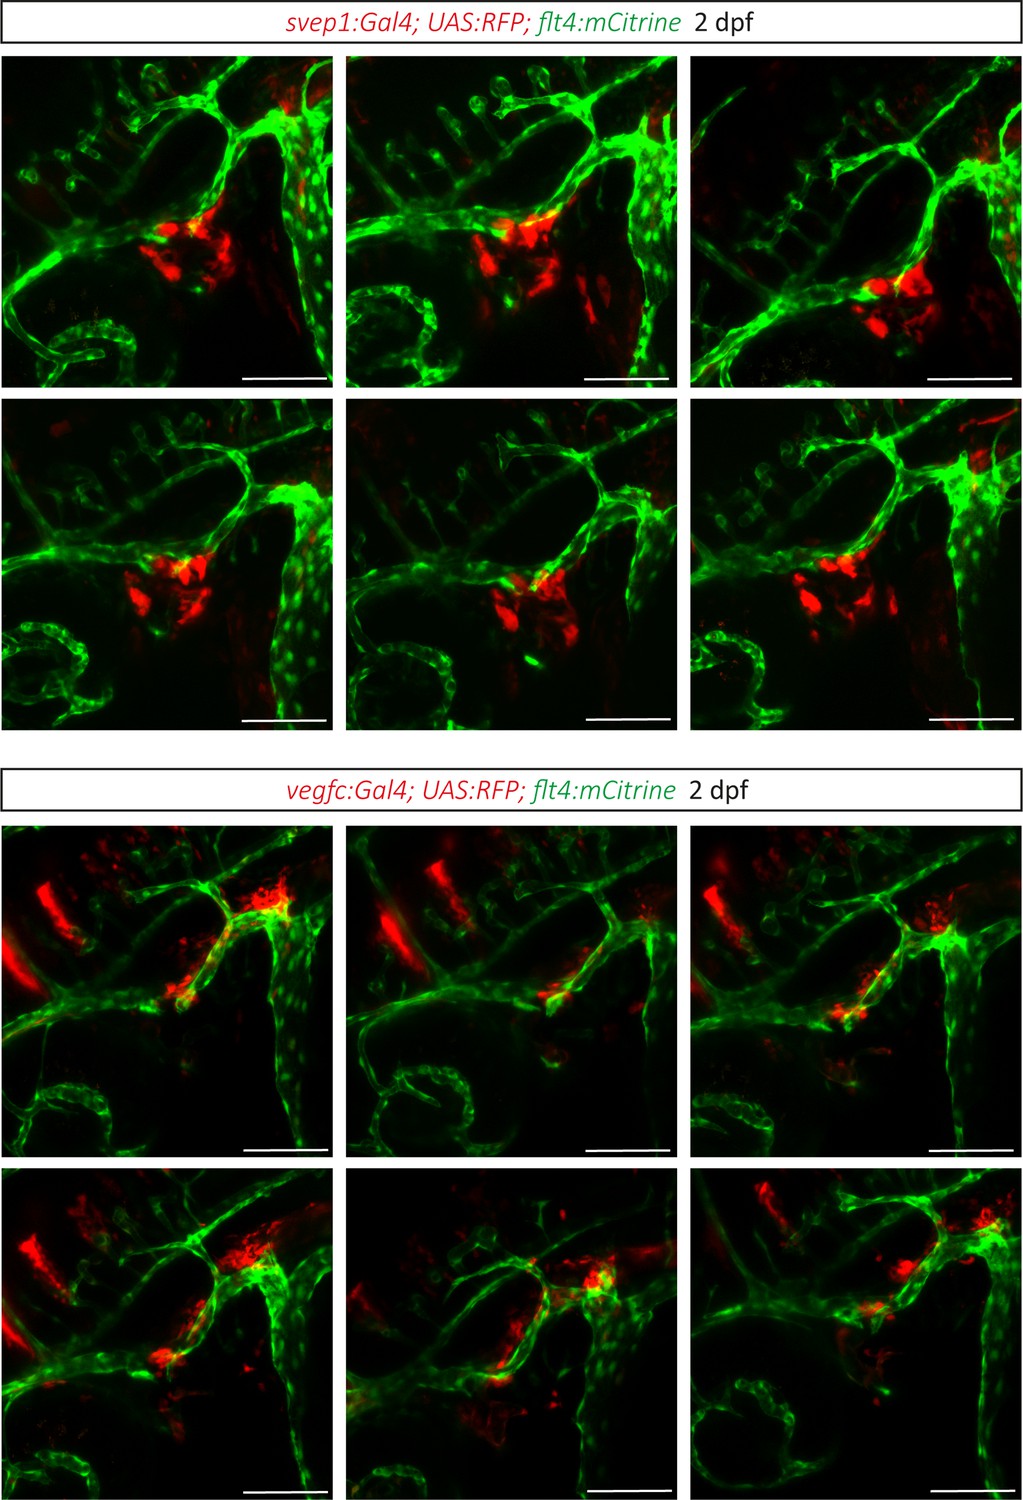
svep1 and vegfc expression.
Confocal images of svep1:Gal4; UAS:RFP; flt4:mCitrine and vegfc:Gal4; UAS:RFP; flt4:mCitrine transgenic embryos 2 dpf. Scale bar = 100 µm.
Figure 2

Svep1 is required for the sprouting of BLECs.
(A) Confocal images of sprouting BLECs, marked by flt4:mCitrine, at 3 dpf in svep1 mutants and siblings. Asterisks mark missing BLECs in svep1 mutants. Scale bar = 100 µm. (B) Quantification of BLECs at 3 dpf on each side of the embryo showed that svep1 mutants have significantly less BLECs on one or both sides of the brain hemispheres compared to siblings. For statistical analysis, no BLECs were counted as 0, BLECs being present on only one hemisphere as 1, whereas BLECs being detectable on both brain hemispheres were included as 2, for each embryo (svep1+/+: n = 10; svep1+/−: n = 12; svep1−/−: n = 12). Mann–Whitney test was applied for statistical analysis. Values are presented as means ± standard deviation (SD), ****p < 0.0001, ns = not significant. Scale bar = 100 µm. (C) Confocal images of svep1:Gal4; UAS:RFP, showing svep1 expression immediately adjacent to BLECs, marked by arrowheads, at 3 dpf. Scale bar = 100 µm. (D) Magnification and reduced stack numbers of boxed area in (C). Arrowhead marks BLEC. Scale bar = 50 µm. BLEC, brain lymphatic endothelial cell; dpf, days post-fertilization; MsV, mesencephalic vein; PHS, primary head sinus;.
Figure 3 with 1 supplement

tie1 mutants phenocopy the loss of svep1, while tie2 is dispensable for lymphangiogenesis.
(A) Facial lymphatics at 3 dpf in flt4:mCitrine positive tie1, svep1 and tie2 mutants and sibling embryos (lateral view). Arrowheads point to FCLV and asterisks indicate the absence of FCLV. Scale bar = 100 µm. (B) flt4:mCitrine; flt1:tdTomato positive dorsal head vasculature in tie1, svep1, and tie2 mutants and in siblings at 3 dpf (dorsal view). In svep1 and tie1 mutants (but not in tie2 mutants) the presence of BLECs is strongly reduced. Arrowheads point to BLECs and asterisks indicate areas lacking BLECs. Scale bar = 100 µm. (C) Confocal images of PL cells, indicated by arrowheads, at 2 dpf in flt4:mCitrine; flt1:tdTomato positive tie1, svep1, and tie2 mutants and siblings, showing reduced PL numbers in svep1 and tie1 mutants. Asterisks indicate missing PLs. Scale bar = 100 µm. (D) Quantification of the presence of BLECs in tie1 mutants compared to siblings. (tie1+/+: n = 6; tie1+/−: n = 16; tie1−/−: n = 10) Mann–Whitney test was applied for statistical analysis. ***p = 0.001, ns = not significant. (E) Quantification of PL cell numbers in tie1 (tie1+/+: n = 9; tie1+/−: n = 23; tie1−/−: n = 14), svep1 (svep1+/+: n = 16; svep1+/−: n = 31; svep1−/−: n = 19), and tie2 (tie2+/+: n = 17; tie2+/−: n = 27; tie2−/−: n = 16) mutants compared to siblings. Mann–Whitney test was applied for statistical analysis. Values are presented as means ± standard deviation (SD), ****p < 0.0001, ns = not significant; BLEC, brain lymphatic endothelial cell; dpf, days post-fertilization; FCLV, facial collecting lymphatic vessel; PL, parachordal lymphangioblast.
Figure 3—figure supplement 1
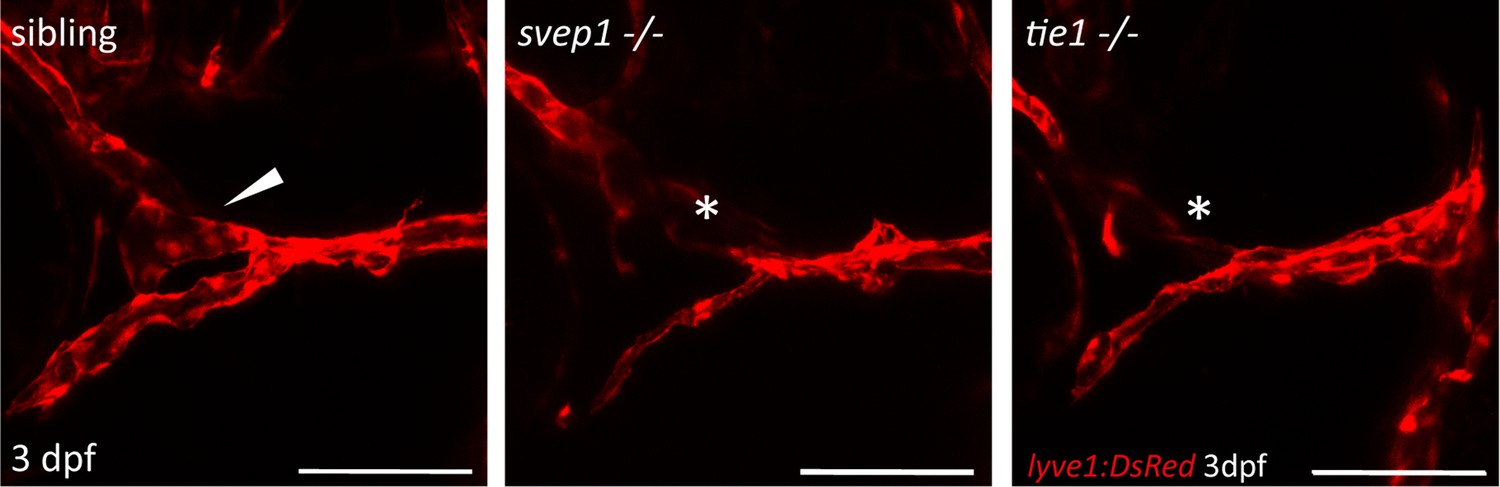
Facials lymphatics of svep1 and tie1 mutant embryos.
Confocal images of lyve1:DsRed transgenic svep1 (n = 9) and tie1 mutant (n = 6) embryos and siblings (n = 19) at 3 dpf. Scale bar = 100 µm. Arrowhead indicates FCLV in siblings and asterisk marks loss of FCLV in svep1 and tie1 mutants. dpf, days post-fertilization; FCLV, facial collecting lymphatic vessel.
Figure 4 with 5 supplements
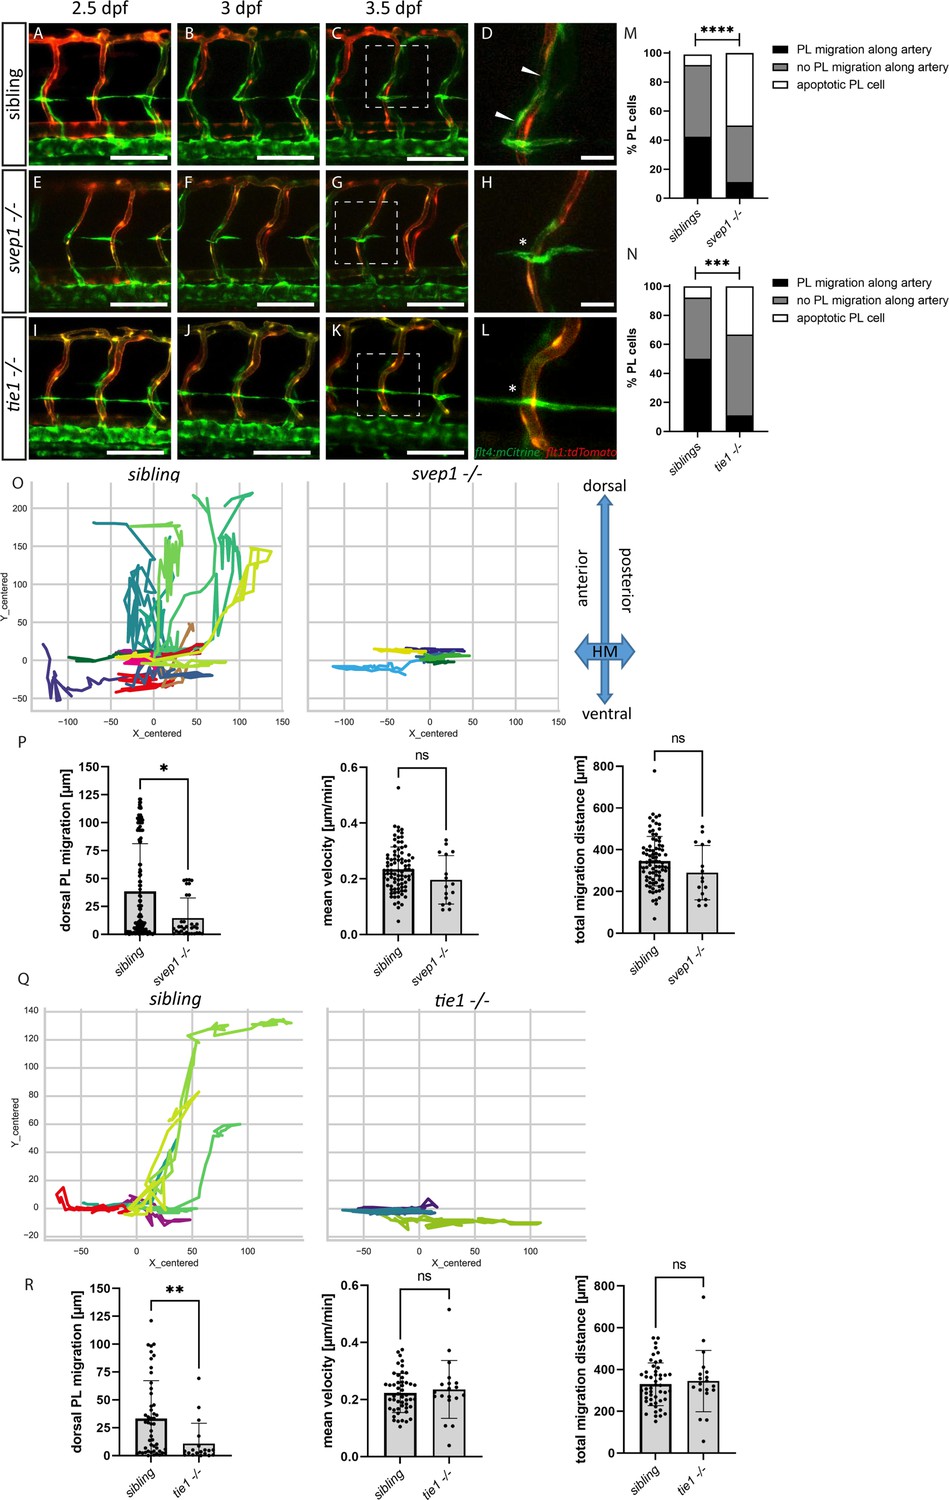
PL cell migration along arteries is severely affected in svep1 and tie1 mutants.
(A–L) Still frames from confocal time-lapse imaging of embryos in a flt4:mCitrine; flt1:tdTomato transgenic background. (A–D) PL migration (indicated by arrowheads) of sibling embryo along aISV from 2.5 to 3.5 dpf. (E–H) Failed PL migration (indicated by asterisk) of svep1 mutants and (I–L) tie1 mutants along artery from 2.5 to 3.5 dpf. (M, N) Classification of PL migration along arteries. Statistical analysis was performed using Mann–Whitney test comparing the % of PL migration along arteries in each sibling and mutant embryo (sibling: n = 96 PLs in 18 embryos; svep1−/−: n = 36 PLs in 15 embryos; siblings: n = 52 PLs in 14 embryos; tie1−/−: n = 28 PLs in 10 embryos); ****p < 0.0001, ***p = 0.0003. (O, Q) Representative cell tracking routes (tracks centred to origin) of single PL cells marked by different colours in siblings (n = 17 PLs in 4 embryos; n = 7 in 2 embryos), tie1−/− (n = 5 PLs in 2 embryos) and svep1−/− (n = 6 PLs in 3 embryos). (P, R) Quantification of dorsal and ventral PL migration (delta Y migration distance), mean velocity and total migration distance in svep1 and tie1 mutants compared to sibling embryos excluding apoptotic PLs quantified in (M, N) revealed decreased migration in dorsal and ventral direction in svep1 (*p = 0.0148) as well as tie1 mutants (**p = 0.0023). ns = not significant; aISV, arterial intersegmental vessel; dpf, days post fertilization; HM, horizontal myoseptum; PL, parachordal lymphangioblast. Scale bar = 100 µm (D, H, L = 25 µm).
Figure 4—figure supplement 1
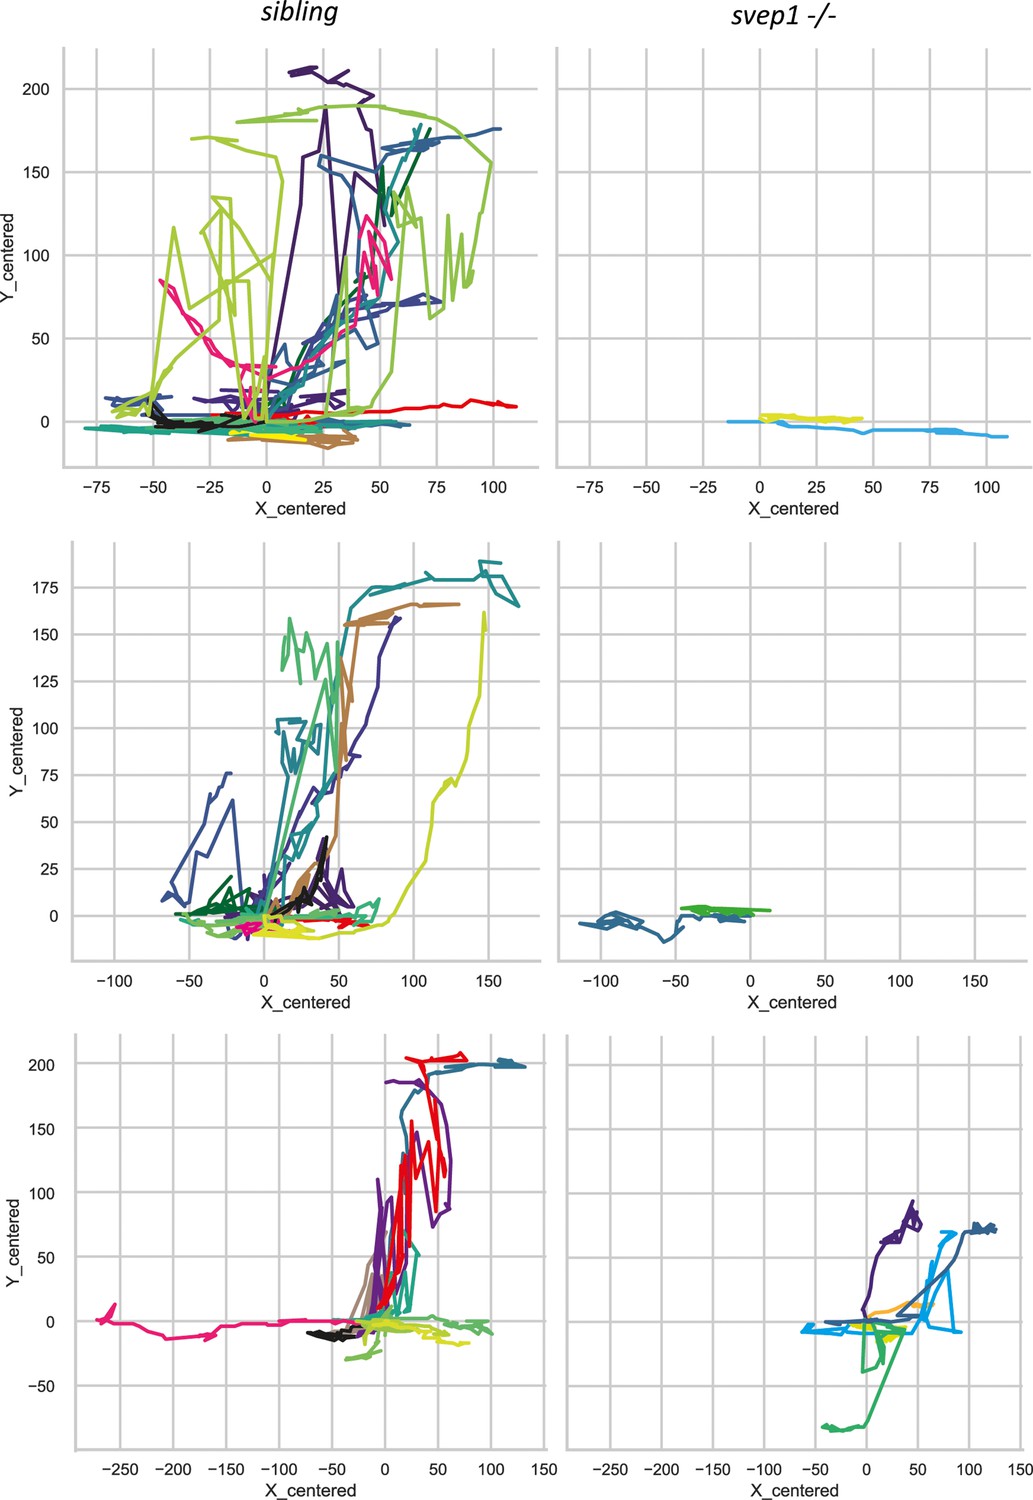
svep1 mutants display PL migration defect.
Additional cell tracking routes of PL cells in svep1 (n = 12 PLs in 5 embryos) from 2.5 to 3.5 dpf compared to siblings (n = 72 PLs in 14 embryos) tracked with manual tracking tool in each of three individual experiments. dpf, days post fertilization; PL, parachordal lymphangioblast.
Figure 4—figure supplement 2
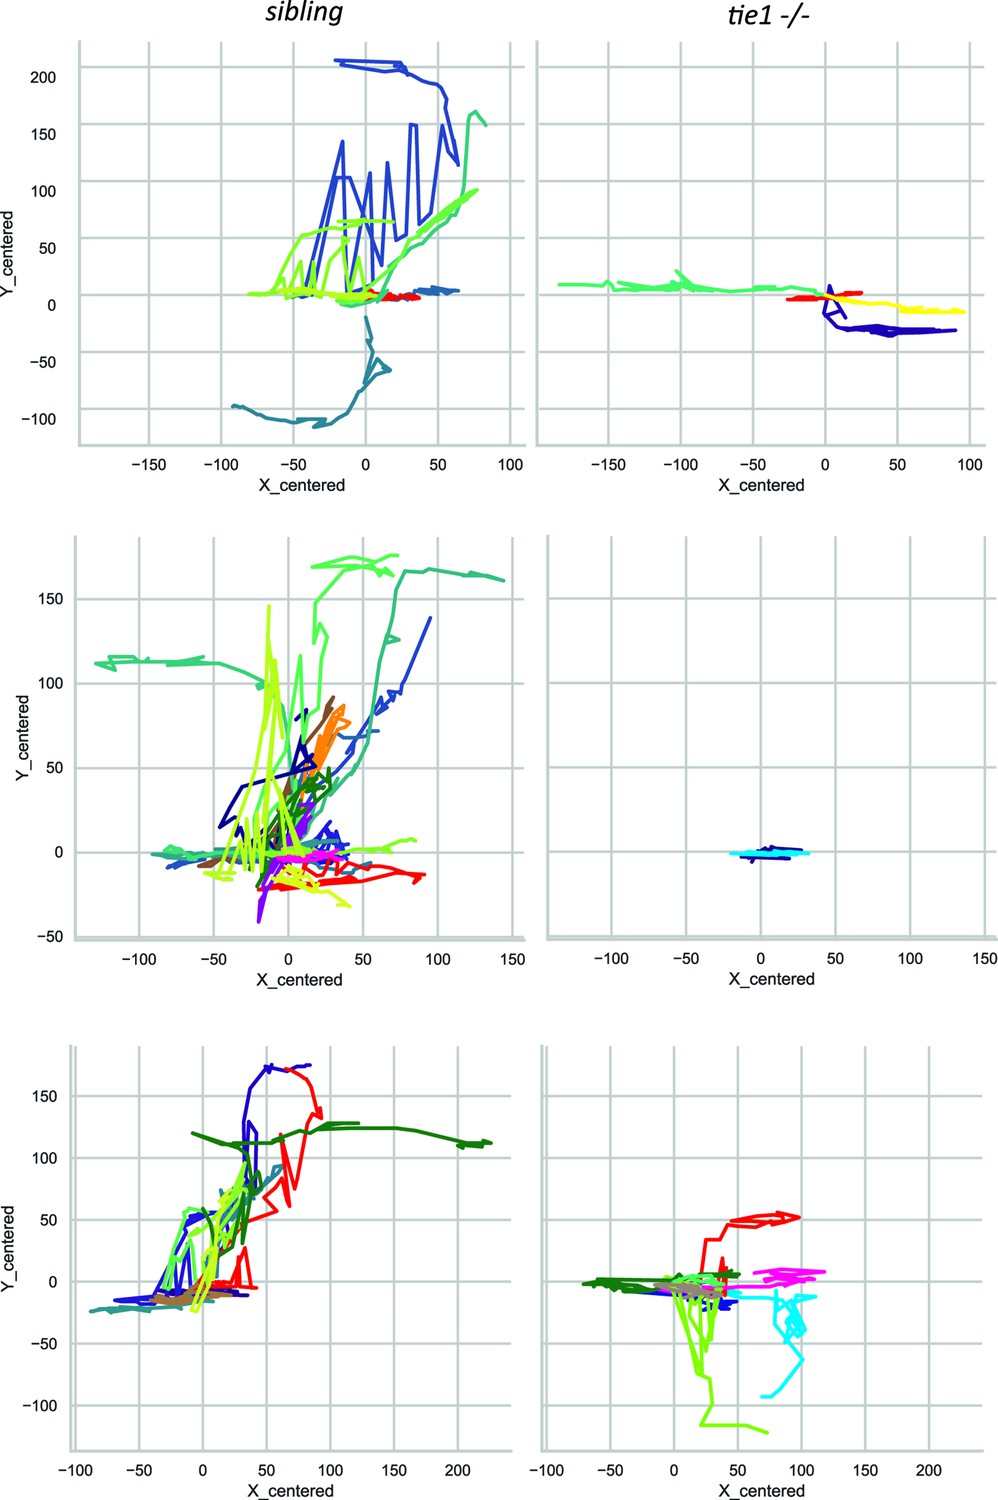
tie1 mutants display PL migration defect.
Additional cell tracking routes of PL cells in tie1 mutants (n = 14 PLs in 6 embryos) from 2.5 to 3.5 dpf compared to siblings (n = 42 PLs in 12 embryos) tracked with manual tracking tool in each of three individual experiments. dpf, days post fertilization; PL, parachordal lymphangioblast.
Figure 4—video 1
Confocal time-lapse imaging from 2.5 until 3.5 dpf in the trunk of sibling embryos positive for flt4.mCitrine and flt1:tdTomato.
dpf, days post-fertilization.
Figure 4—video 2
Confocal time-lapse imaging from 2.5 until 3.5 dpf in the trunk of svep1 mutant embryos positive for flt4.mCitrine and flt1:tdTomato.
dpf, days post-fertilization.
Figure 4—video 3
Confocal time-lapse imaging from 2.5 until 3.5 dpf in the trunk of tie1 mutant embryos positive for flt4.mCitrine and flt1:tdTomato.
dpf, days post-fertilization.
Figure 5 with 3 supplements

Reduced blood flow leads to vascular anastomosis defects in tie1 mutants, similar to the defects in svep1 mutants.
(A, B) Confocal images of sibling and tie1 mutant embryos at 2 dpf in a flt4:mCitrine and flt1:tdTomato transgenic background. (B’) Magnification and reduced stack of boxed area in (B). (C, D) Confocal images of sibling and tie1 mutant embryos treated with 0.014% tricaine from 30 until 48 hpf. Asterisks indicate incompletely formed DLAV segments. (D’) Magnification and reduced stack numbers of boxed area in (D). (E) Quantification of gaps in the DLAV in sibling and tie1 mutants that were either untreated or treated with 0.014% tricaine revealed significant increase of gaps in the DLAV in tie1 mutants. (F) Quantification of lumenized trunk segments of the DLAV in siblings and tie1 mutants, either untreated or treated with 0.014% tricaine (siblings untreated: n = 16; tie1−/− untreated: n = 20; siblings treated with 0.014% tricaine: n = 20; tie1−/− treated with 0.014% tricaine: n = 22), revealed significant decrease of lumenized segment numbers in the DLAV in tie1 mutants. Mann–Whitney test was applied for statistical analysis. (G, H) apelin:eGFP and flt1:tdTomato expression in 48-hpf-old embryos after tricaine treatment from 30 to 48 hpf and (I, J) in untreated conditions. (K) Maximum intensity projection of an aISV at 48 hpf, highlighting the ventral and dorsal region used for further quantifications in (J) adapted from Figure 5J of Coxam et al., 2022. (L) Quantification of ISVs with apelin expression in dorsal and ventral parts of the ISVs. Dorsal part was counted from DLAV until midline region. Lateral region was counted from midline region onwards in ventral direction. tie1 mutants showed significant increase of apelin positive ECs compared to siblings in untreated (dorsal: ***p = 0.0001; ventral: **p = 0.0028) and treated with 0.014% tricaine conditions (dorsal: **p = 0.0033; ventral: ***p = 0.0002) (siblings untreated: n = 53; tie1−/− untreated: n = 21; siblings treated with 0.014% tricaine: n = 66; tie1−/− treated with 0.014% tricaine: n = 28). Mann–Whitney test was applied for statistical analysis. Values are presented as means ± standard deviation (SD). ****p < 0.0001. Scale bar = 100 µm. hpf, hours post-fertilization; ISV, intersegmental vessel; DLAV, dorsal longitudinal anastomotic vessel; dpf, days post-fertilization.
Figure 5—figure supplement 1
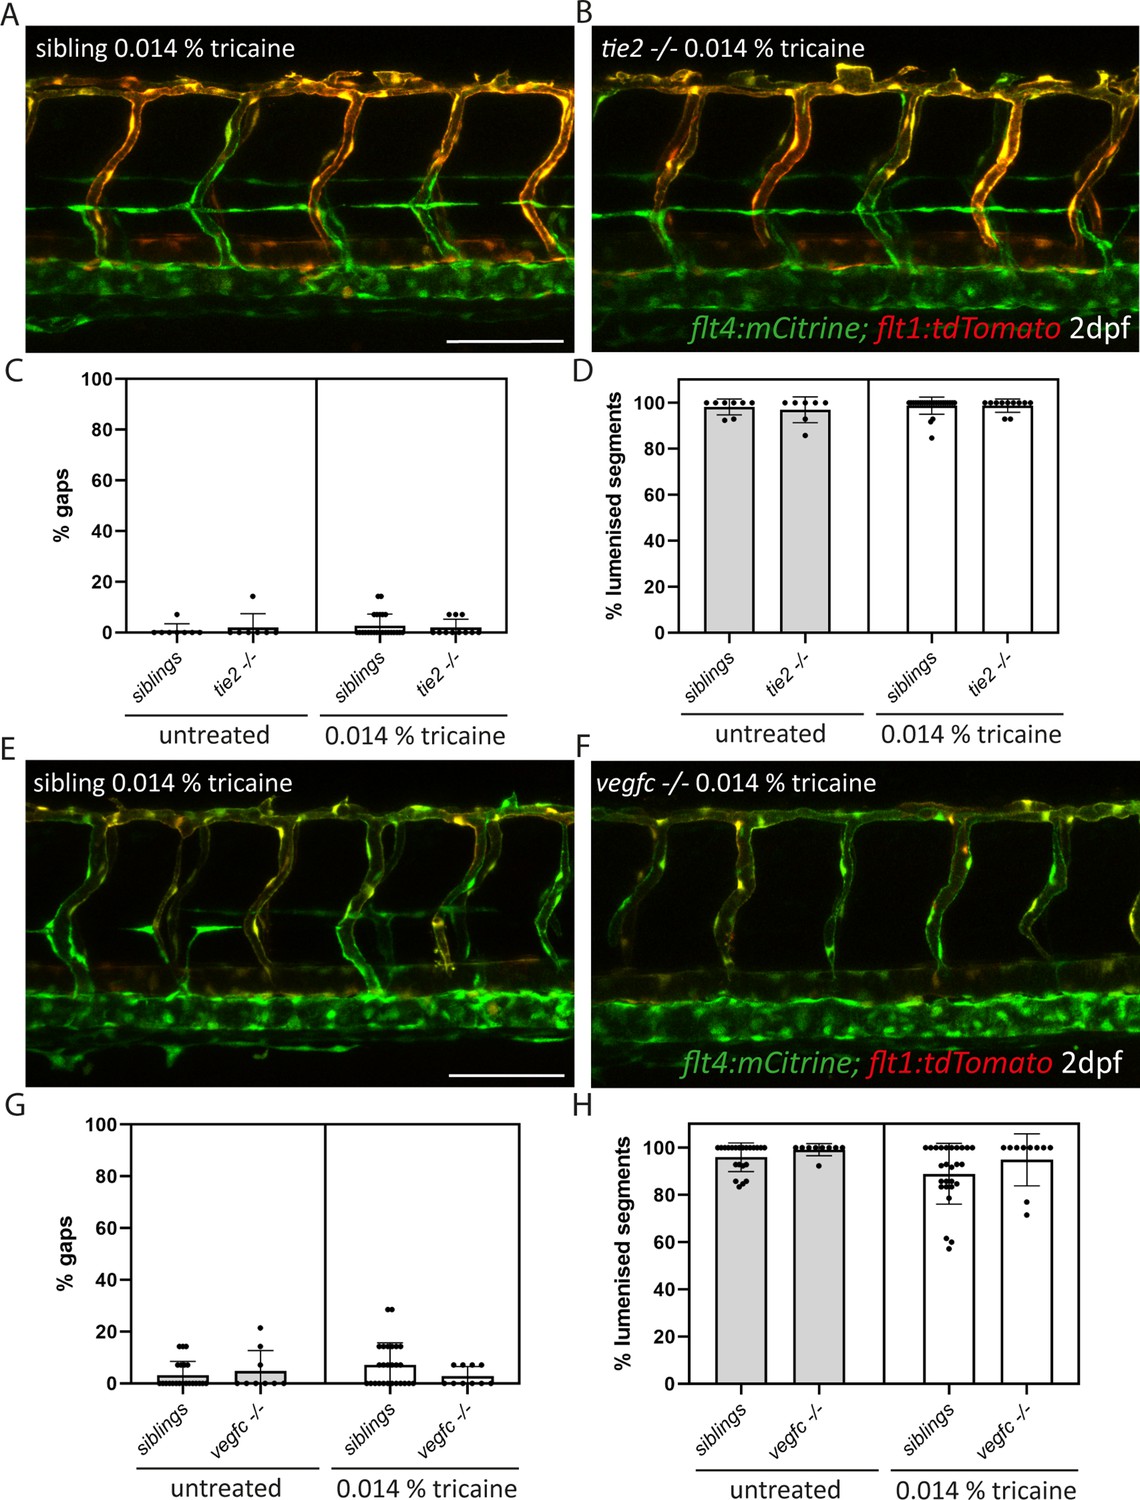
vegfc and tie2 mutants do not show defects in DLAV formation upon tricaine treatment.
(A, B) Confocal images of sibling and tie2 mutant embryos, expressing flt4:mCitrine and flt1:tdTomato at 2 dpf treated with 0.014% tricaine from 30 until 48 hpf. (C) Quantification of gaps in the DLAV in sibling and tie2 mutants that were either untreated or treated with 0.014% tricaine (siblings untreated: n = 8; tie2−/− untreated: n = 7; siblings treated with 0.014% tricaine: n = 24; tie2−/− treated with 0.014% tricaine: n = 11). (D) Quantification of lumenized trunk segments of the DLAV in siblings and tie2 mutants, either untreated or treated with 0.014% tricaine. (E, F) Confocal images of sibling and vegfc mutant embryos, expressing flt4:mCitrine and flt1:tdTomato at 2 dpf treated with 0.014% tricaine from 30 until 48 hpf. (G) Quantification of gaps in the DLAV in sibling and tie2 mutants that were either untreated or treated with 0.014% tricaine (siblings untreated: n = 22; vegfc−/− untreated: n = 9; siblings treated with 0.014% tricaine: n = 26; vegfc−/− treated with 0.014% tricaine: n = 10). (H) Quantification of lumenized trunk segments of the DLAV in siblings and tie2 mutants, either untreated or treated with 0.014% tricaine. Mann–Whitney test was applied for statistical analysis. Scale bar = 100 µm. DLAV, dorsal longitudinal anastomotic vessel; dpf, days post-fertilization; ISV, intersegmental vessel.
Figure 5—figure supplement 2
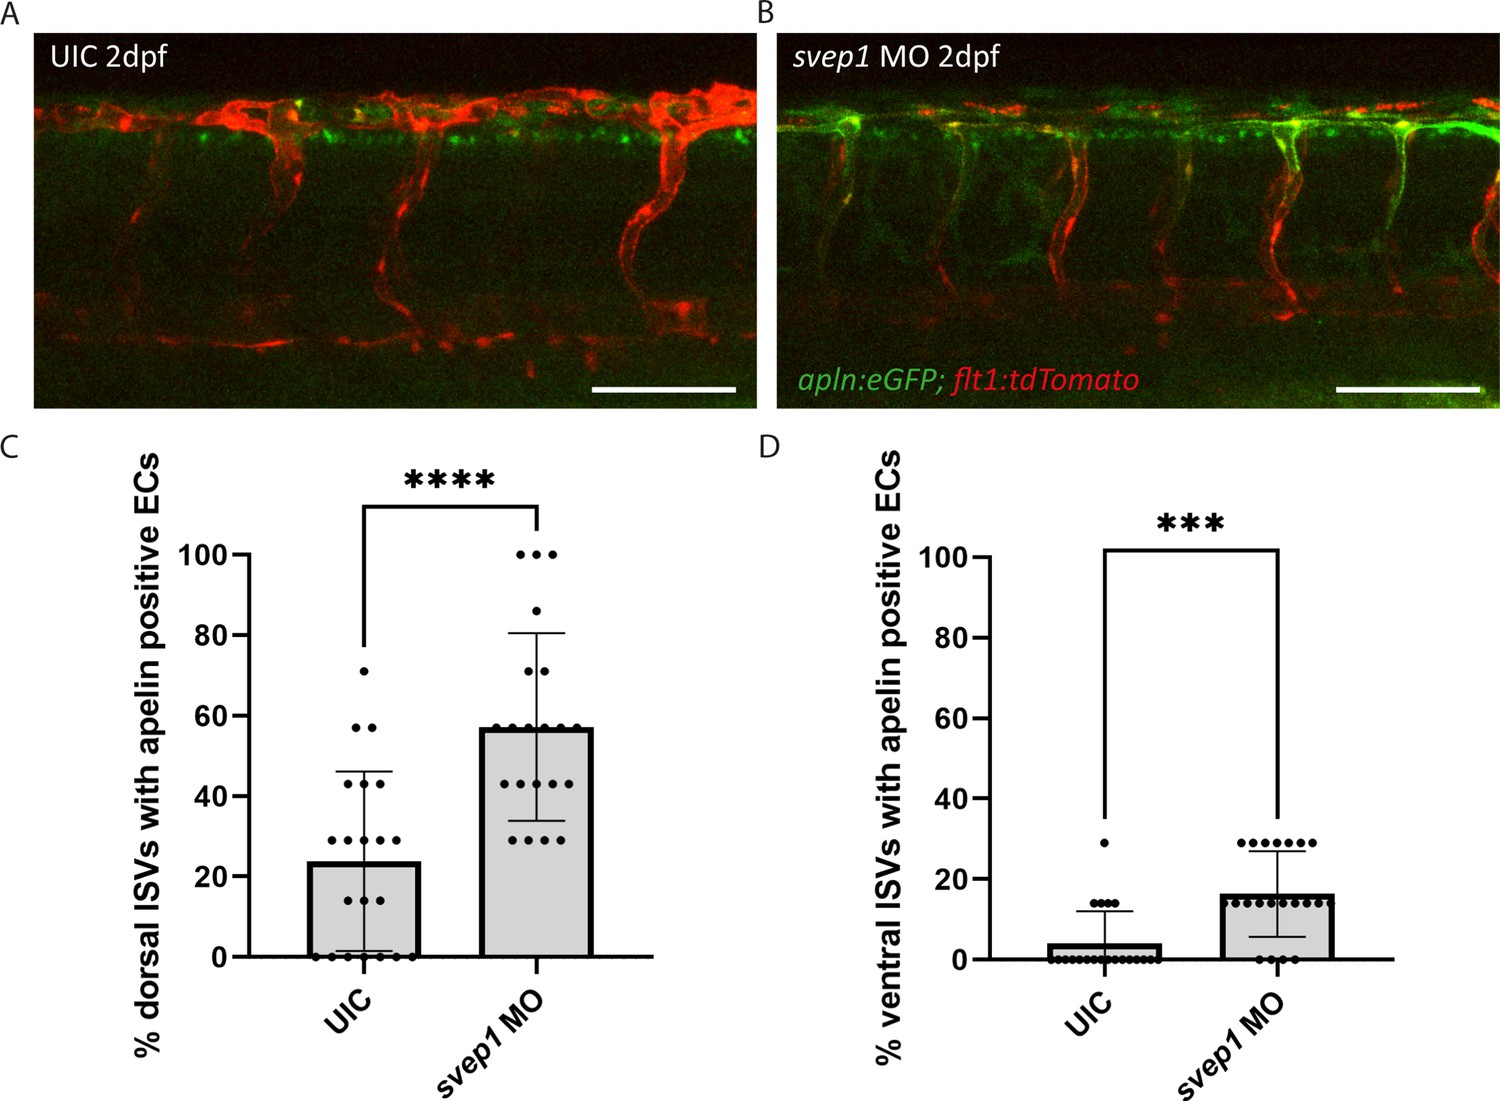
svep1 morphants show increased apelin expression in ISVs.
(A) apelin:eGFP and flt1:tdTomato expression at 2 dpf in UIC compared to (B) svep1 morphants. (C, D) Quantification of ISVs with apelin expression in dorsal and ventral parts of the ISVs. Dorsal part was counted from dorsal longitudinal anastomotic vessel (DLAV) until midline region. Lateral region was counted from midline region onwards in ventral direction. svep1 morphants showed significant increase of apelin positive ECs compared to siblings (UIC: n = 21; svep1 MO: n = 21). Mann–Whitney test was applied for statistical analysis. Values are presented as means ± standard deviation (SD). ****p < 0.0001, ***p = 0.0002. Scale bar = 100 µm. dpf, days post-fertilization; hpf, hours post-fertilization; ISV, intersegmental vessel; UIC, uninjected control.
Figure 5—figure supplement 3
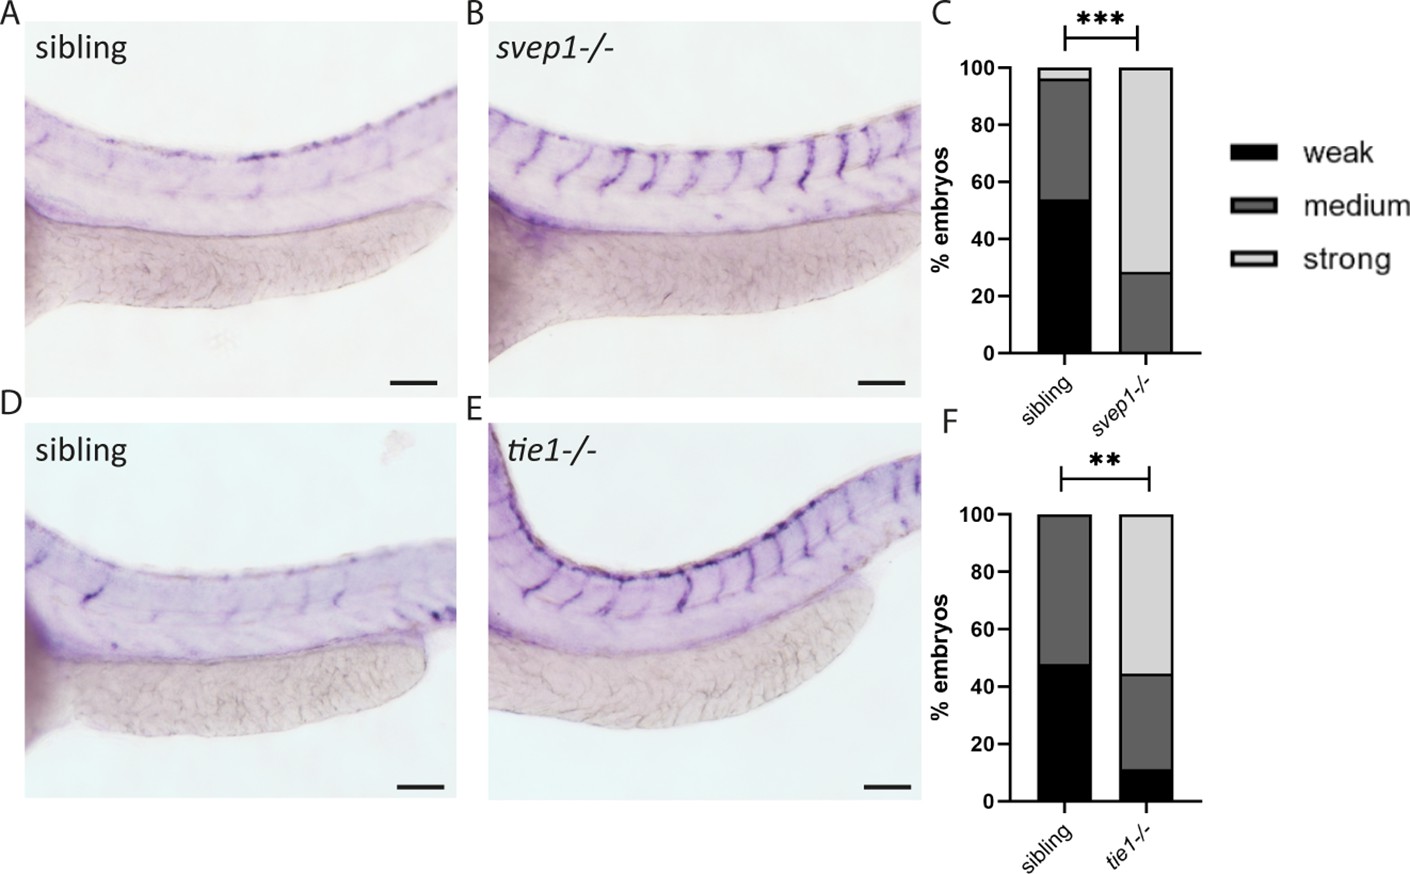
apelin expression is reduced in svep1 and tie1 mutants.
Representative pictures of in situ hybridization of apelin in svep1 (n = 7) and tie1 (n = 9) mutants (B, E) and siblings (n = 26 + 23) (A, D) at 48 hpf. Prior to genotyping the staining intensity was categorized in three groups (weak, medium, and strong). For statistical analysis (C, F), weak staining was counted as 0, medium staining as 1, whereas strong staining was included as 2, for each embryo. Mann–Whitney test was applied for statistical analysis. Values are presented as means ± standard deviation (SD), **p = 0.0011; ***p = 0.0001. Scale bar = 100 µm. hpf, hours post-fertilization.
Figure 6
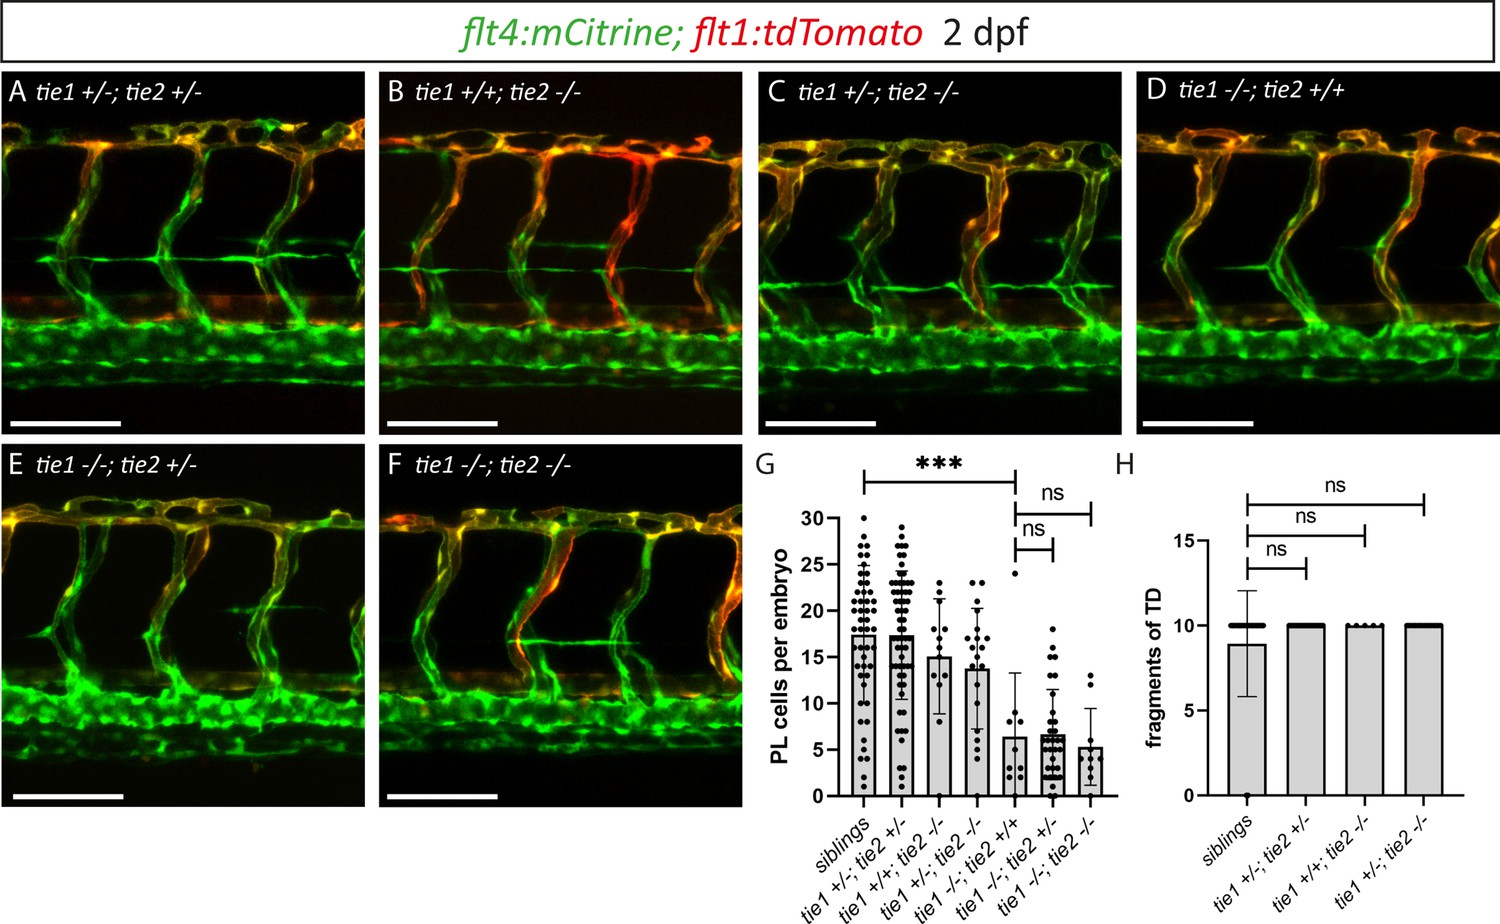
tie1; tie2 double mutants show no exacerbation of the tie1 mutant defects.
(A–F) Confocal images of blood and lymphatic vasculature in the trunk of 2 dpf old embryos derived from tie1; tie2 double heterozygous parents, showing no genetic interaction between tie1 and tie2. (G) Quantification of PLs at 2 dpf and of thoracic duct fragments at 5 dpf (siblings: n = 50; tie1+/−; tie2+/−: n = 62; tie1+/+; tie2−/−: n = 13; tie1+/−; tie2−/−: n = 20; tie1−/−; tie2+/+: n = 10; tie1−/−; tie2+/−: n = 32; tie1−/−; tie2−/−: n = 10). (H) TD fragments were counted over the anterior-most 10 somites (siblings: n = 47; tie1+/−; tie2+/−: n = 34; tie1+/+; tie2−/−: n = 5; tie1+/−; tie2−/−: n = 16). Mann–Whitney test was applied for statistical analysis. ***p = 0.0002, ns = not significant. Scale bar = 100 µm. dpf, days post-fertilization; PL, parachordal lymphangioblast; TD, thoracic duct.
Figure 7 with 2 supplements
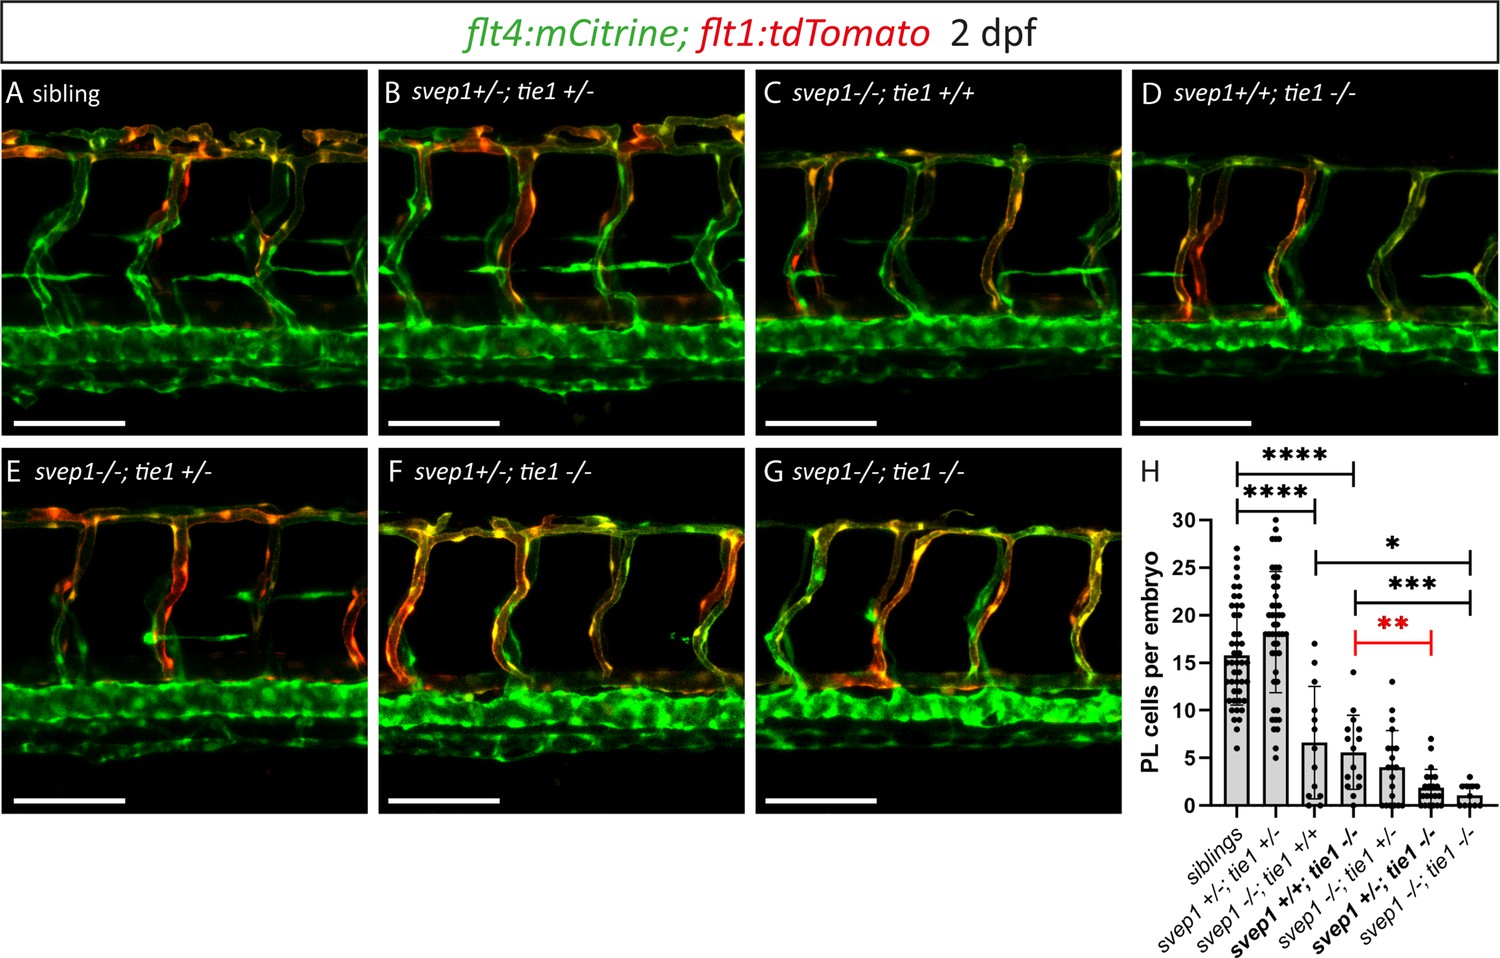
Heterozygous loss of svep1 exacerbates the PL phenotype in tie1 mutants, indicating genetic interaction between svep1 and tie1.
(A–G) Confocal images of blood and lymphatic vasculature in the trunk of 2-dpf-old embryos derived from svep1; tie1 double heterozygous fish, showing severely reduced PL numbers in svep1; tie1 double mutants and significant decrease of PL cell numbers in svep1+/−; tie1−/− compared to svep1+/+; tie1−/− (**p = 0.0012). (H) Quantification of PL cell numbers at 2 dpf using Mann–Whitney test (siblings: n = 45; svep1+/−; tie1+/−: n = 45; svep1−/−; tie1+/+: n = 13; svep1+/+; tie1−/−: n = 15; svep1−/−; tie1+/−: n = 20; svep1+/−; tie1−/−: n = 21; svep1−/−; tie1−/−: n = 11). Scale bar = 100 µm. Values are presented as means ± standard deviation (SD), ****p < 0.0001, ***p = 0.007, *p = 0.0163, ns = not significant. dpf, days post-fertilization; PL, parachordal lymphangioblast.
Figure 7—figure supplement 1
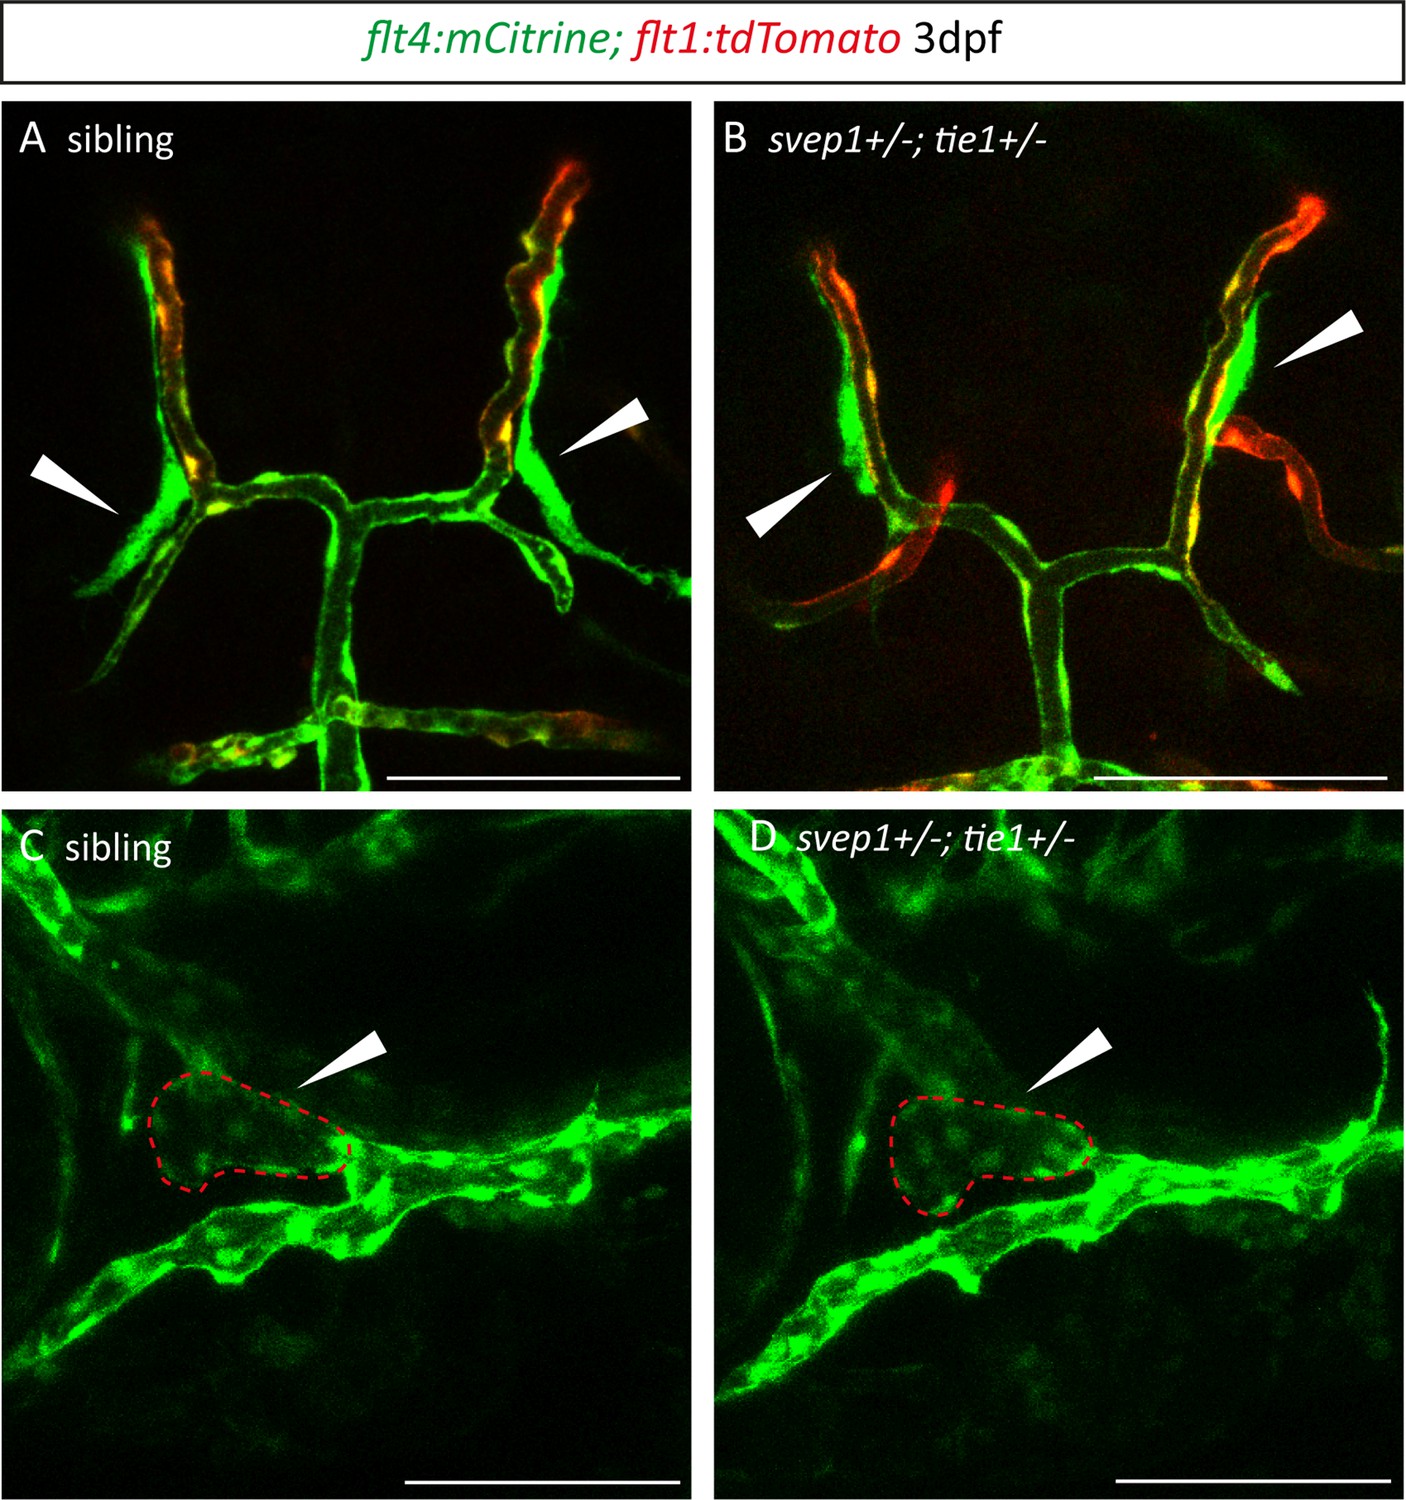
svep1; tie1 double heterozygouse embryos show normal BLECs and facial lymphatics.
flt4:mCitrine; flt1:tdTomato positive dorsal head vasculature in (A) siblings and (B) svep1+/−; tie1+/− embryos at 3 dpf (dorsal view). svep1+/−; tie1+/− embryos (n = 9) show normal amount of BLECs. Scale bar = 100 µm. Facial lymphatics at 3 dpf in flt4:mCitrine positive (D) svep1+/−; tie1+/− embryos (n = 6) and in (C) siblings (n = 7) (lateral view). Arrowheads point to BLECs in (A, B) and to FCLV in (C, D). Scale bar = 100 µm. BLEC, brain lymphatic endothelial cell; dpf, days post-fertilization; FCLV, facial collecting lymphatic vessel.
Figure 7—figure supplement 2
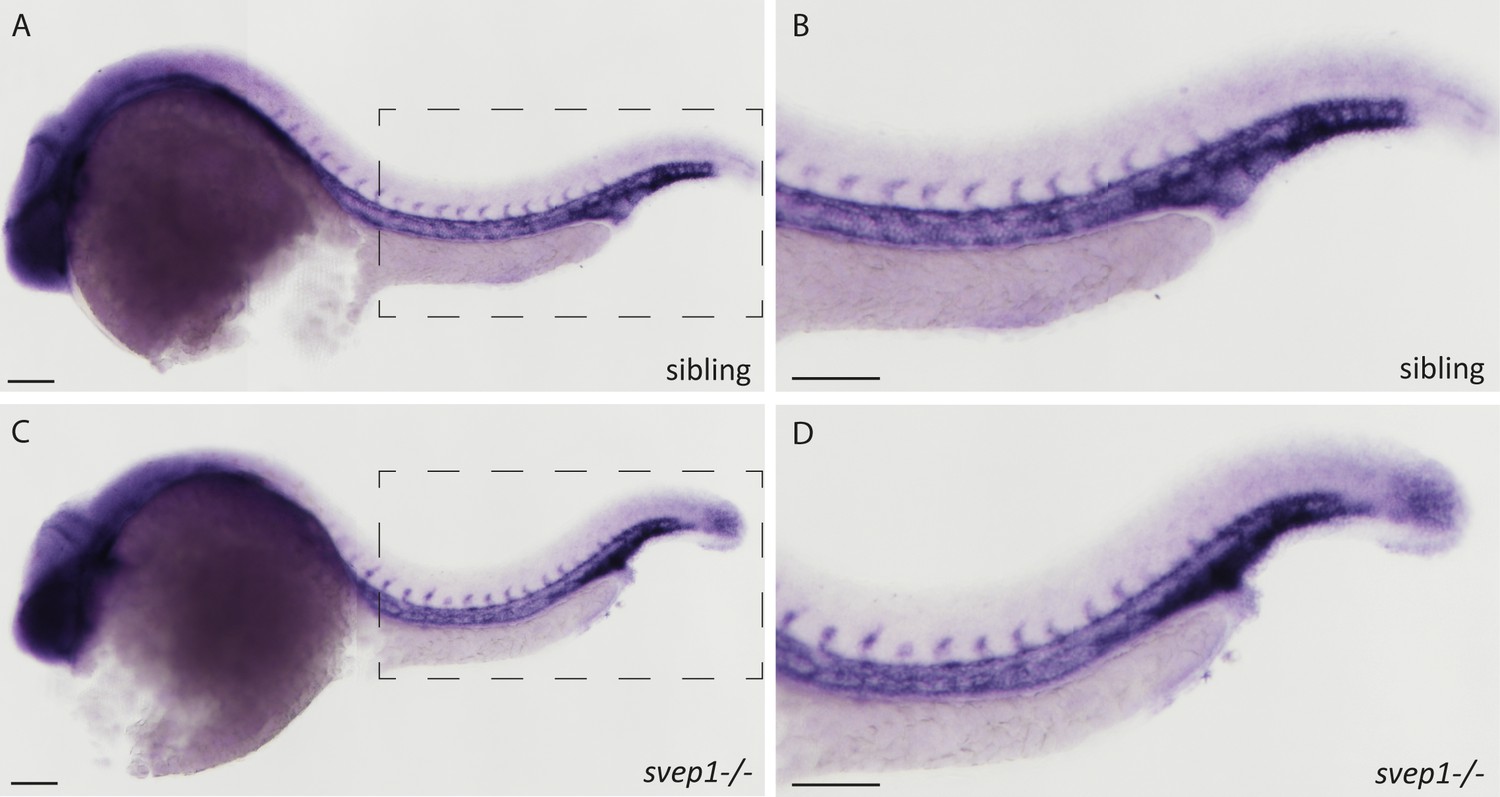
tie1 expression is not altered in svep1 mutants.
In situ hybridization of tie1 in sibling (n = 14) (A, B) and svep1 mutants (n = 6) (C, D) at 24 hpf. Images have been assembled from individual pictures to ensure proper focus of all areas. (B and D) are magnifications of boxed area in (A and C), respectively. Scale bar = 100 µm. hpf, hours post-fertilization.
Figure 8 with 1 supplement
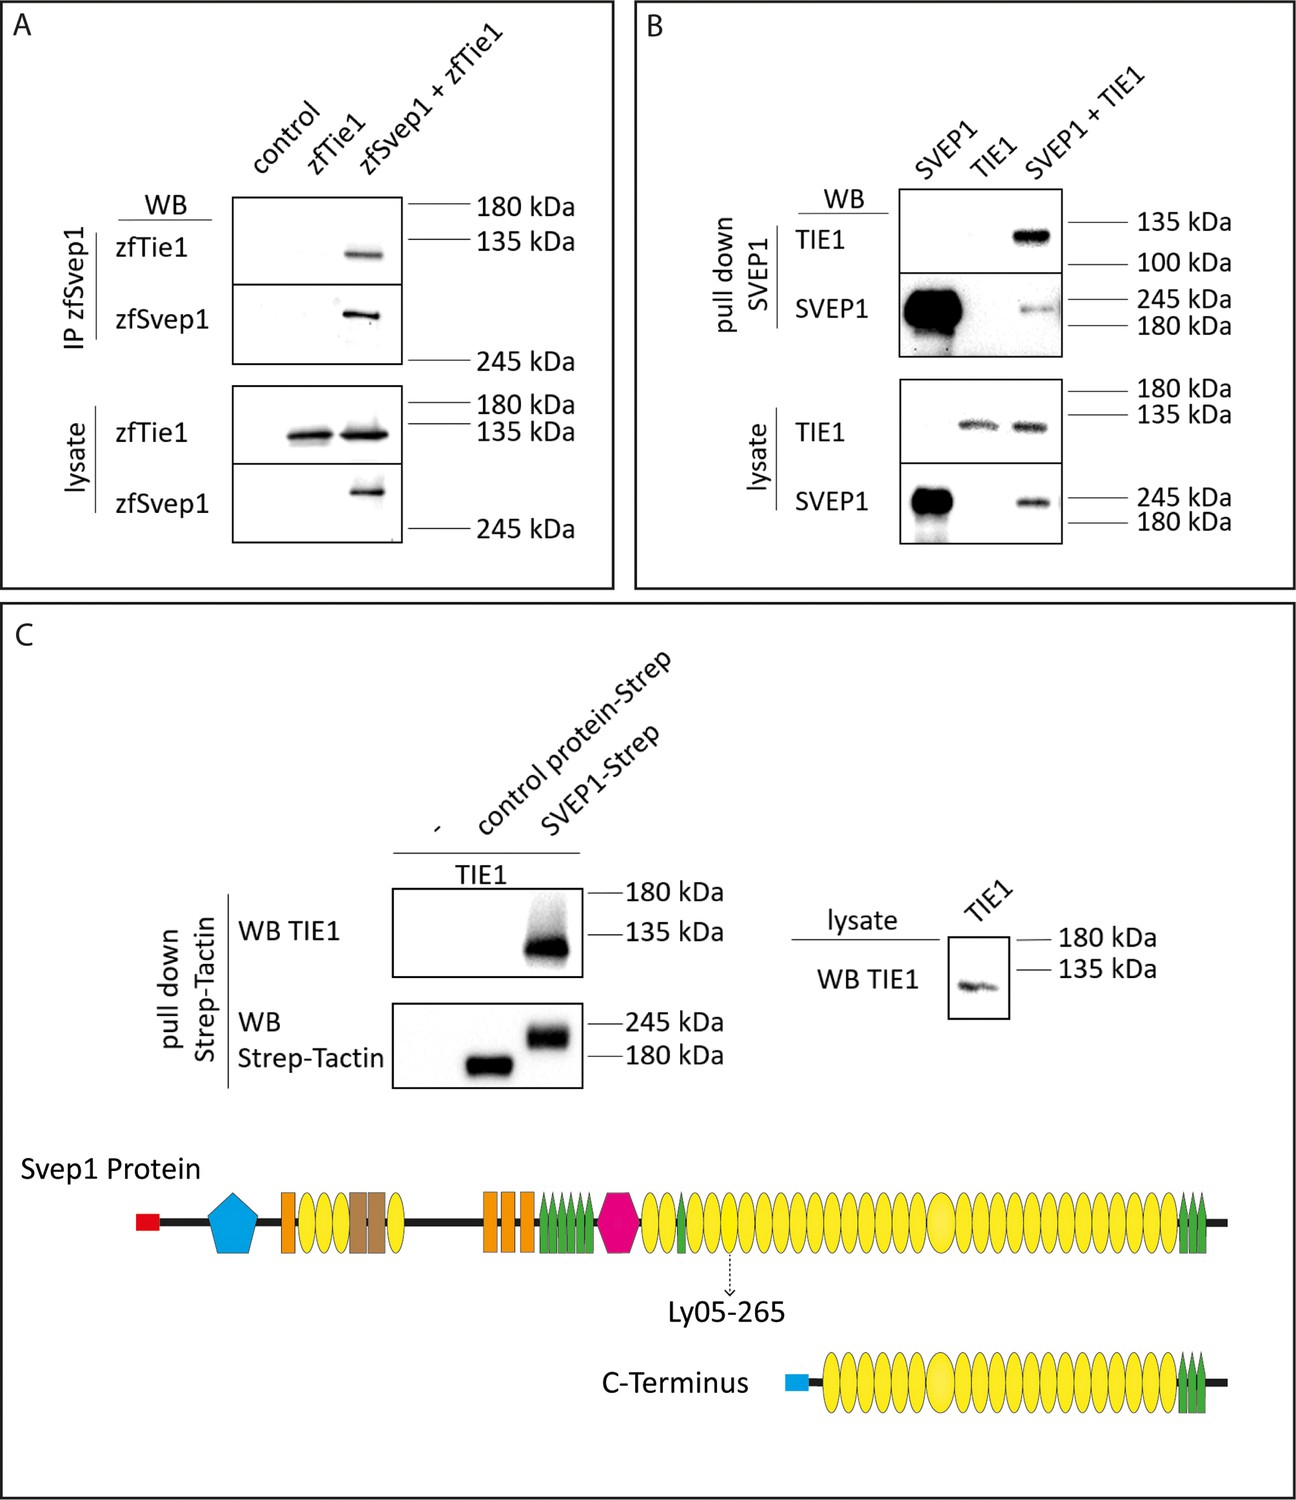
SVEP1 binds to TIE1.
(A) 293T HEK cells were transfected with zebrafish Svep1-HIS (zfSvep1) and zebrafish Tie1-HA (zfTie1). zfSvep1 was immunoprecipitated and associated Tie1 was detected by western blot. (B) Co-immunoprecipitation of C-terminal human SVEP1 co-transfected in 293T HEK cells with human TIE1. (C) Pull-down of recombinant C-terminal human SVEP1-Strep-tag II protein, which was incubated with TIE1 transfected 293T HEK cell lysates, shows binding of TIE1. Protein structure with all domains indicated and C-terminal part used for pull-down assays (adapted from Figure 2F of Karpanen et al., 2017, published under the CC BY-NC 4.0 license, https://creativecommons.org/licenses/by-nc/4.0/). It is not covered by the CC-BY 4.0 license and further reproduction of this panel would need to follow the terms of the CC BY-NC 4.0 license. Ly05-265 indicates position of stop codon in the zebrafish hu6985 allele (Karpanen et al., 2017), suggesting that the protein domains C-terminal to the nonsense allele are critical for function. Red and blue rectangle: signal peptide; blue pentagon: von Willebrand factor type A domain (vWF); orange rectangle: ephrin-receptor like domain; brown rectangle: Hyalin repeat; yellow ovals: SUSHI repeat; green pentagons: epidermal growth factor (EGF)-like and calcium-binding EGF-like domains; and pink hexagon: pentraxin domain (PTX).
© 2017, Karpanen et al. (C) Pull -down of recombinant C-terminal human SVEP1-Strep-tag II protein, which was incubated with TIE1 transfected 293 T HEK cell lysates, shows binding of TIE1. Protein structure with all domains indicated and C-terminal part used for pull down assays (adapted from Figure 2F of Karpanen et al., 2017, published under the CC BY-NC 4.0 license (https://creativecommons.org/licenses/by-nc/4.0/). It is not covered by the CC-BY 4.0 license and further reproduction of this panel would need to follow the terms of the CC BY-NC 4.0 license)
-
Figure 8—source data 1
Raw data of western blots.
- https://cdn.elifesciences.org/articles/82969/elife-82969-fig8-data1-v1.pdf
Figure 8—figure supplement 1
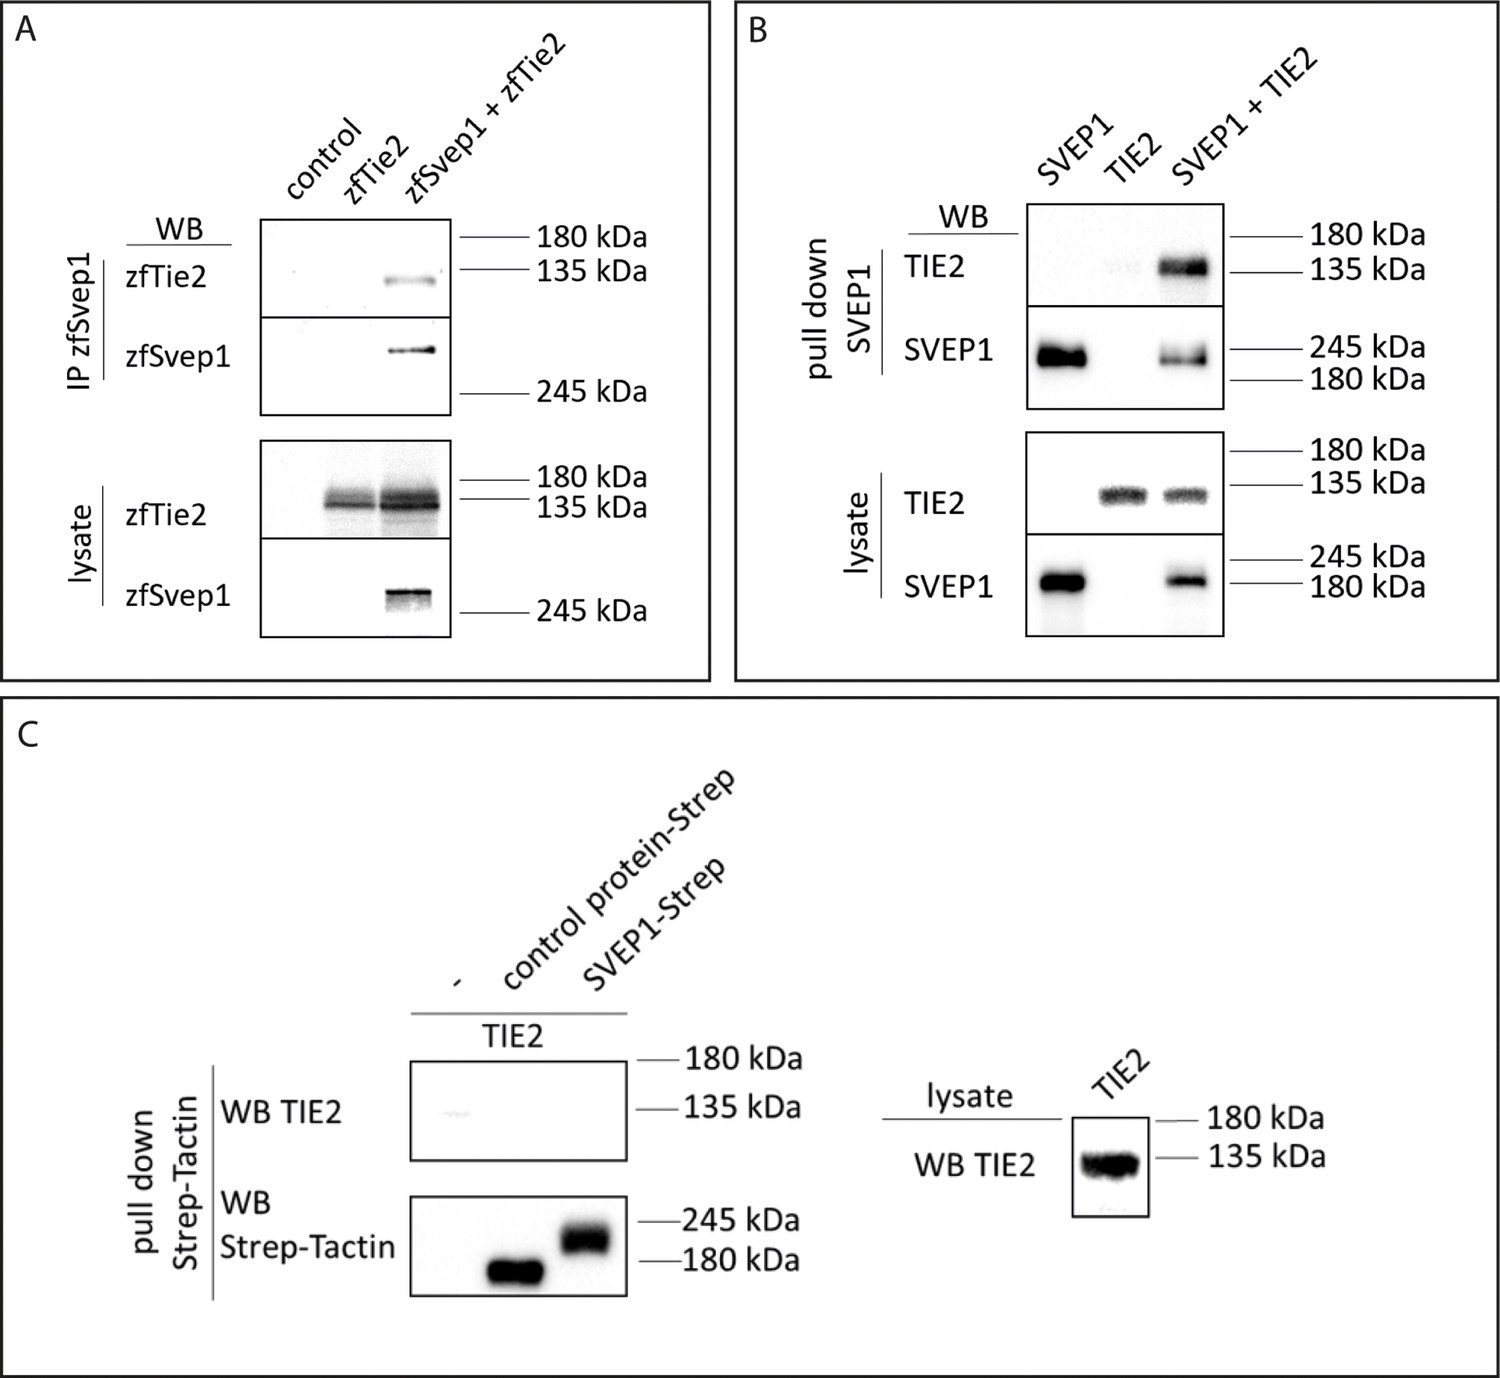
Co-transfected Tie2/TIE2 precipitates with Svep1/SVEP1, but does not bind recombinant human C-terminal SVEP1.
(A) 293T HEK cells were transfected with zebrafish Svep1-HIS (zfSvep1) and zebrafish Tie2-HA (zfTie2). zfSvep1 was immunoprecipitated and associated Tie2 was analysed by western blot. (B) Immunoprecipitation of SVEP1 protein bound to TIE2. (C) Pull-down of recombinant C-terminal human SVEP1-Strep-tag II, which was incubated with TIE2 transfected cell lysates, shows no binding of TIE2.
-
Figure 8—figure supplement 1—source data 1
Raw data of western blots.
- https://cdn.elifesciences.org/articles/82969/elife-82969-fig8-figsupp1-data1-v1.pdf
Tables
Key resources table
| Reagent type (species) or resource | Designation | Source or reference | Identifiers | Additional information |
|---|---|---|---|---|
| Genetic reagent (D. rerio) | Tg(flt4:mCitrine)hu7135 | van Impel et al., 2014 | ZFIN: hu7135 | |
| Genetic reagent (D. rerio) | Tg(flt1enh:tdTomato)hu5333 | Bussmann and Schulte-Merker, 2011 | ZFIN: hu5333 | |
| Genetic reagent (D. rerio) | Tg(lyve1:DsRed2)nz101 | Okuda et al., 2012 | ZFIN: nz101 | |
| Genetic reagent (D. rerio) | Tg(UAS:RFP)nkuasrfp1a | Asakawa et al., 2008 | ZFIN: nkuasrfp1a | |
| Genetic reagent (D. rerio) | Tg(vegfc:Gal4FF)mu402 | Wang et al., 2020 | ZFIN: mu402 | |
| Genetic reagent (D. rerio) | Tg(svep1:GAL4FF)hu8885 | Karpanen et al., 2017 | ZFIN: hu8885 | |
| Genetic reagent (D. rerio) | adamts3hu10891 | Wang et al., 2020 | ZFIN: hu10891 | |
| Genetic reagent (D. rerio) | adamts14hu11304 | Wang et al., 2020 | ZFIN: hu11304 | |
| Genetic reagent (D. rerio) | vegfchu6410 | Helker et al., 2013; Le Guen et al., 2014 | ZFIN: hu6410 | |
| Genetic reagent (D. rerio) | ccbe1hu10965 | Kok et al., 2015 | ZFIN: hu10965 | |
| Genetic reagent (D. rerio) | svep1hu6123 | Karpanen et al., 2017 | ZFIN: hu6123 | |
| Genetic reagent (D. rerio) | svep1hu4767 | Karpanen et al., 2017 | ZFIN: hu4767 | |
| Genetic reagent (D. rerio) | tie1bns208 | Carlantoni et al., 2021 | ZFIN: bns208 | |
| Genetic reagent (D. rerio) | tie2hu1667 | Gjini et al., 2011 | ZFIN: hu1667 | |
| Genetic reagent (D. rerio) | TgBAC(apln:EGFP)bns157 | Helker et al., 2020 | ZFIN: bns157 | |
| Cell line (Homo sapiens) | 293T HEK cells | Roukens et al., 2015 | ||
| Cell line (Homo sapiens) | HEK293 EBNA | Manuel Koch | ||
| Transfected construct (D. rerio) | zfTie1-HA in PCS2+ | This paper | Provided by Naoki Mochizuki | |
| Transfected construct (D. rerio) | zfTie2-HA in PCS2+ | This paper | zfTie2 cDNA provided by Naoki Mochizuki | |
| Transfected construct (D. rerio) | zfSvep1-HIS in PCS2+ | This paper | ||
| Transfected construct (Homo sapiens) | TIE1-HA in PCEP4 | This paper | TIE1 cDNA provided by Hellmut Augustin | |
| Transfected construct (Homo sapiens) | TIE2-HA in PCEP4 | This paper | Provided by Manuel Koch | |
| Transfected construct (Homo sapiens) | SVEP1-Strep II in PCEP4 | This paper | Provided by Manuel Koch | |
| Transfected construct (Mus musculus) | mouse nope ectodomain with Fc tag strep | This paper | Provided by Manuel Koch | |
| Antibody | anti-HA (rat monoclonal) | Roche | 11867423001 | 1:10,000 |
| Antibody | anti-rat (donkey polyclonal) | Invitrogen | # A18745 | 1:15,000 |
| Antibody | anti-HIS (rabbit polyclonal) | Invitrogen | # PA1-983B | 1:250 |
| Antibody | anti-HIS (mouse monoclonal) | Invitrogen | # MA1-135 | 1:250 |
| Antibody | anti-mouse (goat polyclonal) | dako | P0447 | 1:4000 |
| Antibody | anti-DIG primary antibody (sheep polyclonal) | Roche | 11093274910 | 1:2000 |
| Recombinant DNA reagent | apelin in pGEM-t-easy | Provided by Christian Helker | For in situ probe generation | |
| Peptide, recombinant protein | SVEP1-Strep II Purified recombinant protein | This paper | Provided by Manuel Koch | |
| Chemical compound, drug | DIG RNA Labeling Mix | Roche | 11277073910 | |
| Chemical compound, drug | Lipofectamin 2000 transfection reagent | Thermo Fisher Scientific | 11668030 | |
| Chemical compound, drug | FuGENE HD Transfection Reagen | Promega | E2311 | |
| Chemical compound, drug | T4 Ligase | Thermo Fisher Scientific | EL0012 | |
| Chemical compound, drug | FCS | Merck Chemicals GmbH | F7524 | |
| Chemical compound, drug | Q5 Hot Start High-Fidelity DNA Polymerase | New England Biolabs GmbH | M0493 | |
| Chemical compound, drug | DMEM/F-12, GlutaMAX Supplement | Thermo Fisher Scientific | 10565018 | |
| Chemical compound, drug | Strep-Tactin Superflow high capacity resin | IBA Lifesciences GmbH | 2-1208-002 | |
| Software, algorithm | GraphPad Prism 6 | GraphPad Software, USA | ||
| Software, algorithm | Fiji-ImageJ (version 1.52); Manual tracking plugin; StrackReg plugin | DOI:10.1038/nmeth.2019; Fabrice Cordelières, Institut Curie, Orsay (France); DOI:10.1109/83.650848 | RRID:SCR_002285 | |
| Software, algorithm | Python (version 3.8) | Python.org | RRID:SCR_008394 | Code available at https://github.com/MuensterImagingNetwork/Hussmann_et_al_2022 |
| Other | Strep-Tactin HRP conjugate | Iba-lifesciences | 2-1502-001 | 1:10,000 |
Additional files
-
Supplementary file 1
Primer list for genotyping, cloning, and in situ probe generation.
- https://cdn.elifesciences.org/articles/82969/elife-82969-supp1-v1.xlsx
-
MDAR checklist
- https://cdn.elifesciences.org/articles/82969/elife-82969-mdarchecklist1-v1.pdf
Download links
A two-part list of links to download the article, or parts of the article, in various formats.
Downloads (link to download the article as PDF)
Open citations (links to open the citations from this article in various online reference manager services)
Cite this article (links to download the citations from this article in formats compatible with various reference manager tools)
Svep1 is a binding ligand of Tie1 and affects specific aspects of facial lymphatic development in a Vegfc-independent manner
eLife 12:e82969.
https://doi.org/10.7554/eLife.82969


