Comparative genomics reveals insight into the evolutionary origin of massively scrambled genomes
- Departments of Biochemistry and Molecular Biophysics and Biological Sciences, Columbia University, United States
- Department of Chemistry and Biology, Universidad del Norte, Colombia
- Pacific Biosciences, United States
- Department of Mathematics and Statistics, University of South Florida, United States
Figures
Figure 1
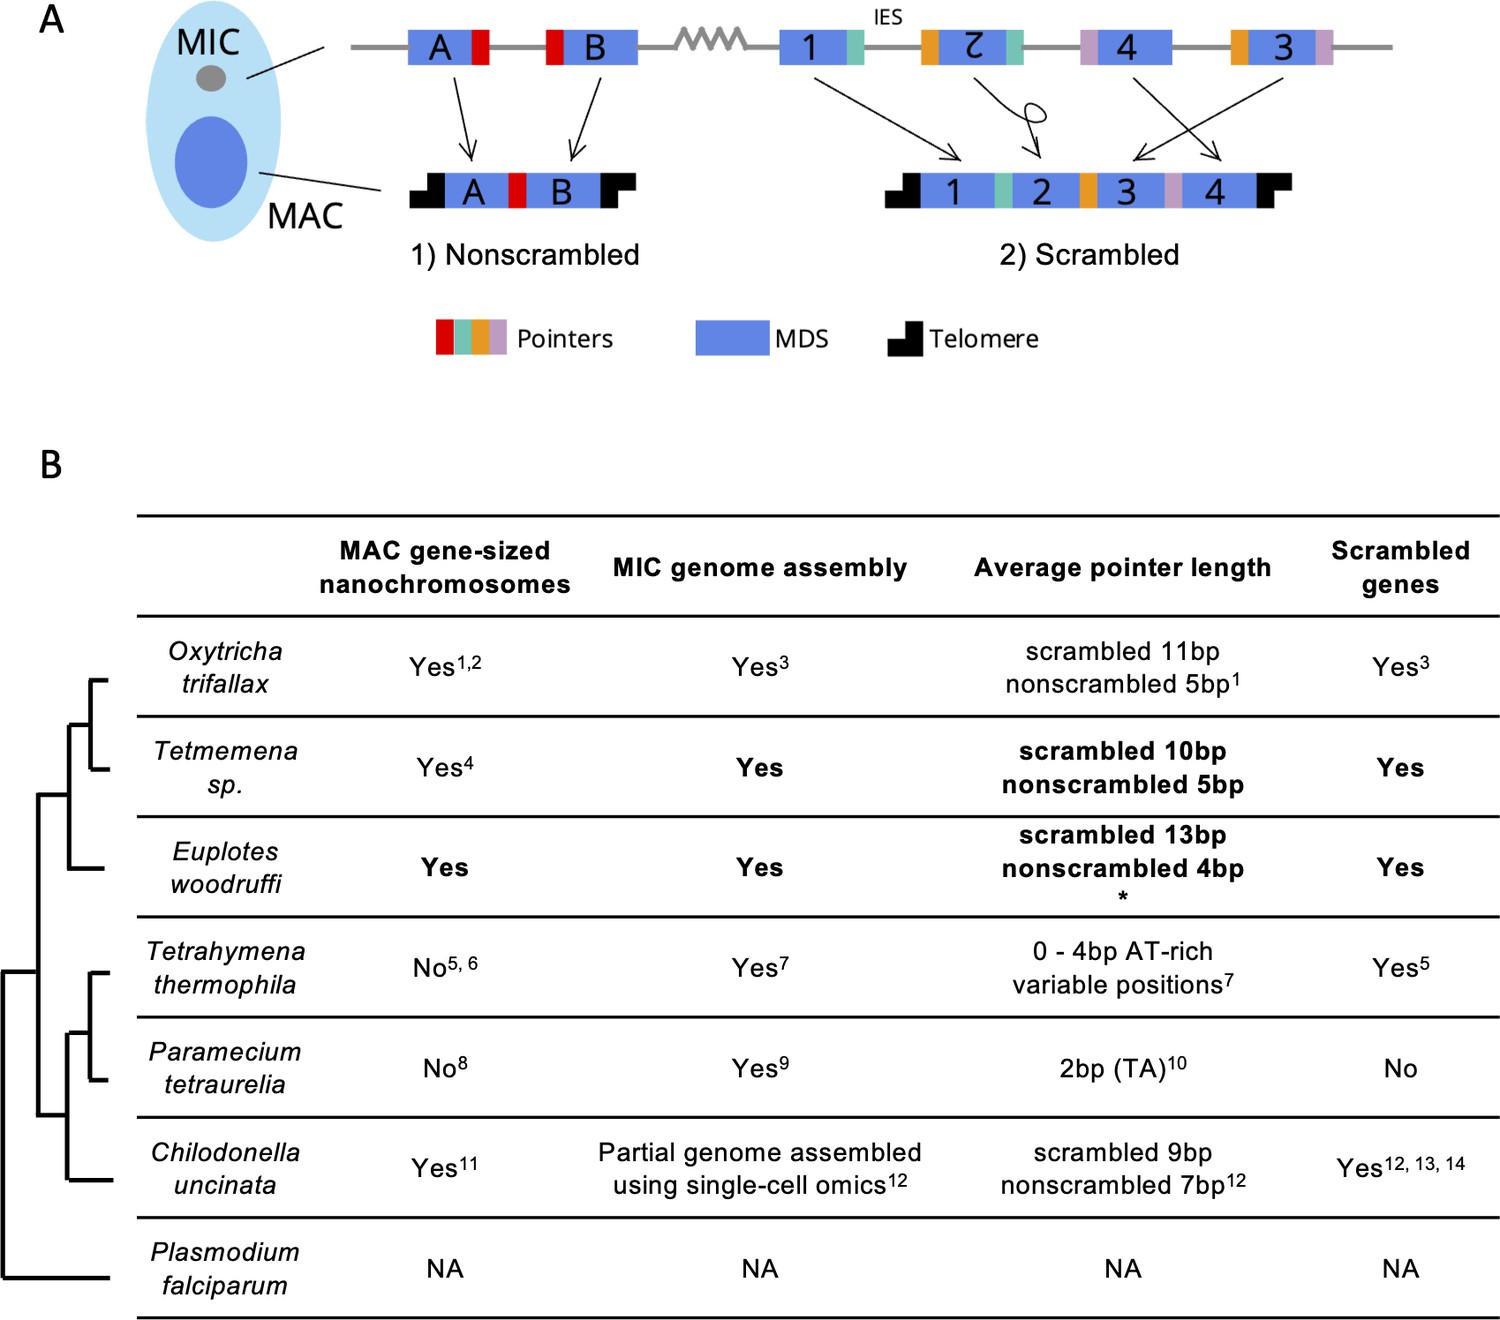
Genome rearrangements in representative ciliate species.
(A) Diagram of genome rearrangement in Oxytricha. Each ciliate cell contains a somatic macronucleus (MAC) and a germline micronucleus (MIC). During development, the MAC genome rearranges from a copy of the MIC genome. (1) Nonscrambled genes rearrange simply by joining consecutive macronuclear destined sequences (MDSs, blue boxes) and removing internal eliminated sequences (IESs, thin lines). (2) Rearrangement of scrambled genes requires MDS translocation and/or inversion. Pointers are microhomologous sequences (colored vertical bars) present in two copies in the MIC and only one copy in the MAC where consecutive MDSs recombine. (B) Comparison of genome rearrangement features of representative ciliates and the non-ciliate Plasmodium falciparum as an outgroup (phylogenetic information is based on Parfrey et al., 2011; Bracht et al., 2013). Conclusions from this study are shown in bold. * indicates that some scrambled pointers in Euplotes woodruffi are much longer, as discussed in the results. Statistics for pointers ≤30 bp in E. woodruffi are shown. Table information derives from the following sources: 1 - Swart et al., 2013; 2 - Lindblad et al., 2019; 3 - Chen et al., 2014; 4 - Chen et al., 2015; 5 - Sheng et al., 2020; 6 - Eisen et al., 2006; 7 - Hamilton et al., 2016; 8 - Aury et al., 2006; 9 - Guérin et al., 2017; 10 - Arnaiz et al., 2012; 11 - Riley and Katz, 2001; 12 - Maurer-Alcalá et al., 2018a; 13 - Katz and Kovner, 2010; 14 - Gao et al., 2014.
Figure 2 with 2 supplements
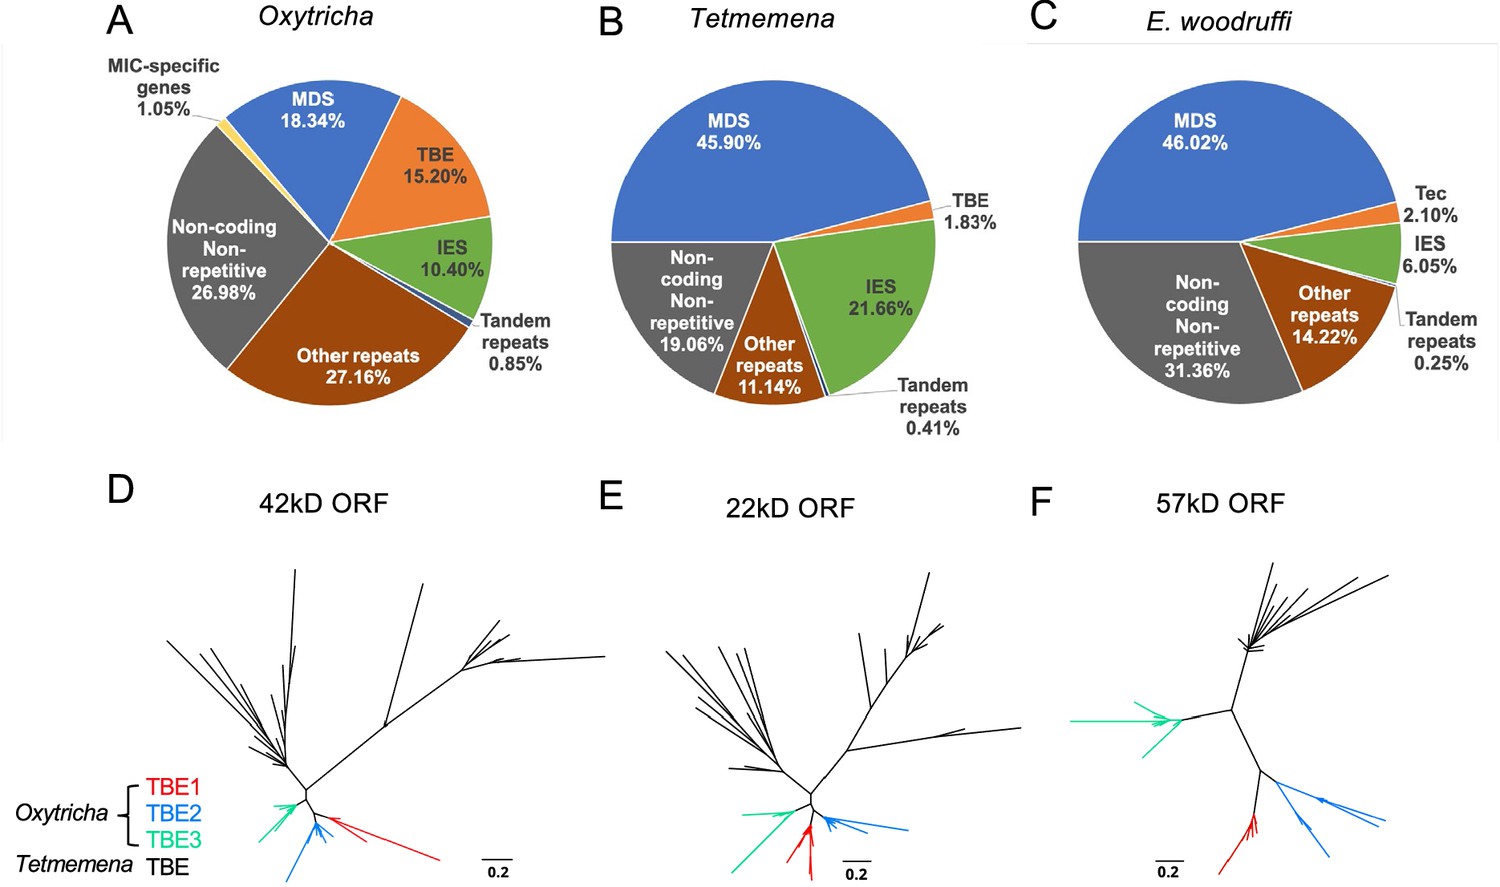
The three germline micronucleus (MIC) genomes differ in repeat content, especially transposable elements.
(A–C) MIC genome categories for (A) Oxytricha trifallax, (B) Tetmemena sp., and (C) Euplotes woodruffi. Oxytricha displays the greatest proportion of repetitive elements (telomere-bearing elements [TBE], other repeats, and tandem repeats) relative to the other species. Oxytricha MIC-specific genes were annotated in Chen et al., 2014; Miller et al., 2021. (D–F) Phylogenetic analysis of the three TBE open reading frames (ORFs) in Oxytricha and Tetmemena: (D) 42 kD, (E) 22 kD, and (F) 57 kD, suggest that TBE3 (green) is the ancestral transposon family in Oxytricha. For each ORF, 30 protein sequences from each species were randomly subsampled and maximum likelihood trees constructed using PhyML (Guindon et al., 2010).
Figure 2—figure supplement 1
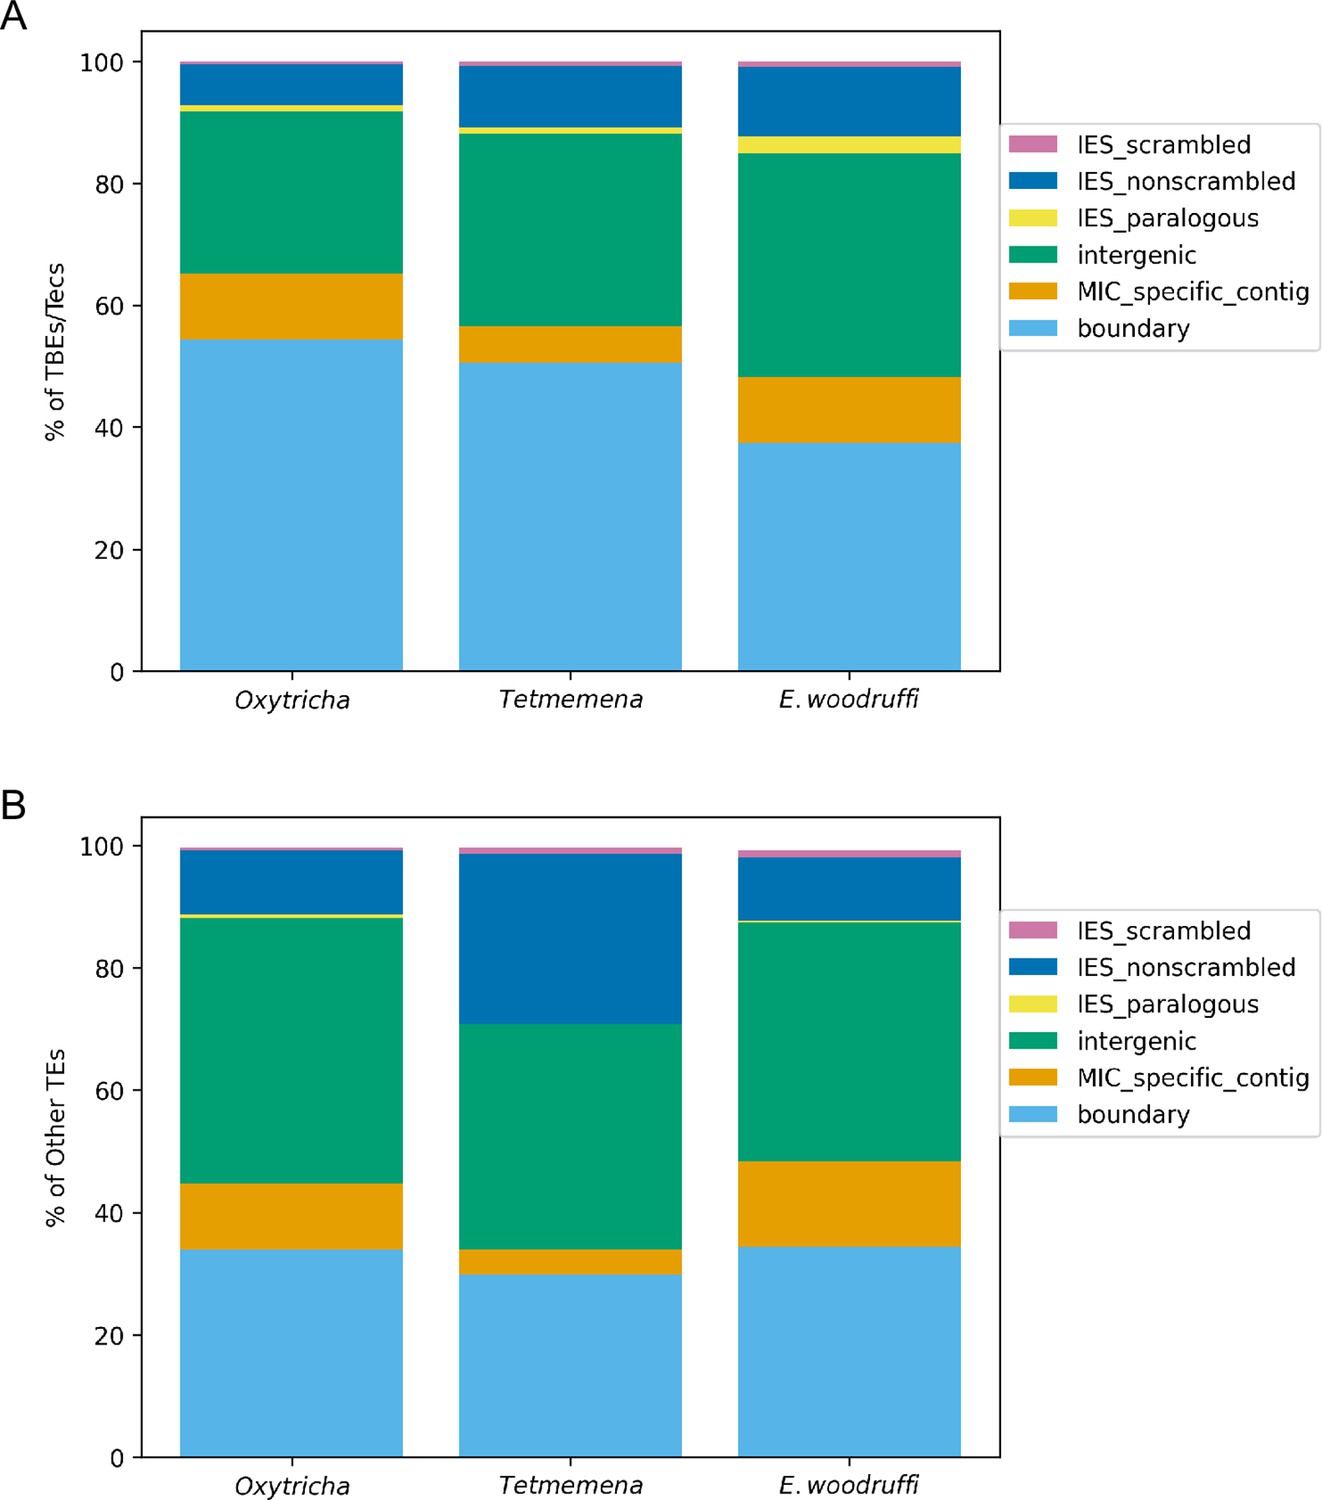
Comparison of germline micronuclear (MIC) genome context of (A) Telomere-Bearing Element (TBE) and Transposon of Euplotes crassus (Tec) transposons and (B) other transposable elements in the three species.
Complete and partial TBE/Tec elements were annotated by MIC context. Other transposable elements include all subcategories shown in Supplementary file 2. Boundary (light blue): edges of assembled MIC contigs. MIC-specific contig (orange): no macronuclear destined sequence (MDS) identified on the MIC contig so it cannot be annotated as intergenic or a long internally eliminated sequence (IES). Intergenic (green): MIC regions between MDSs for different MAC contigs. IES paralogous (yellow): transposable element (TE) insertions between duplicate (paralogous) MDSs, so they are neither scrambled nor nonscrambled. IES nonscrambled (dark blue): TE insertions that map between consecutive, nonscrambled MDSs for the same MAC contigs. IES scrambled (magenta): MIC regions between nonconsecutive (scrambled) MDSs for the same MAC contig. Note that TEs in IESs or intergenic regions could be flanked by other MIC-limited sequences extending beyond the TE ends.
Figure 2—figure supplement 2

Length distribution of assembled somatic macronuclear (MAC) nanochromosomes in the three species.
Chromosomes over 11 kb are excluded from the plot.
Figure 3 with 2 supplements
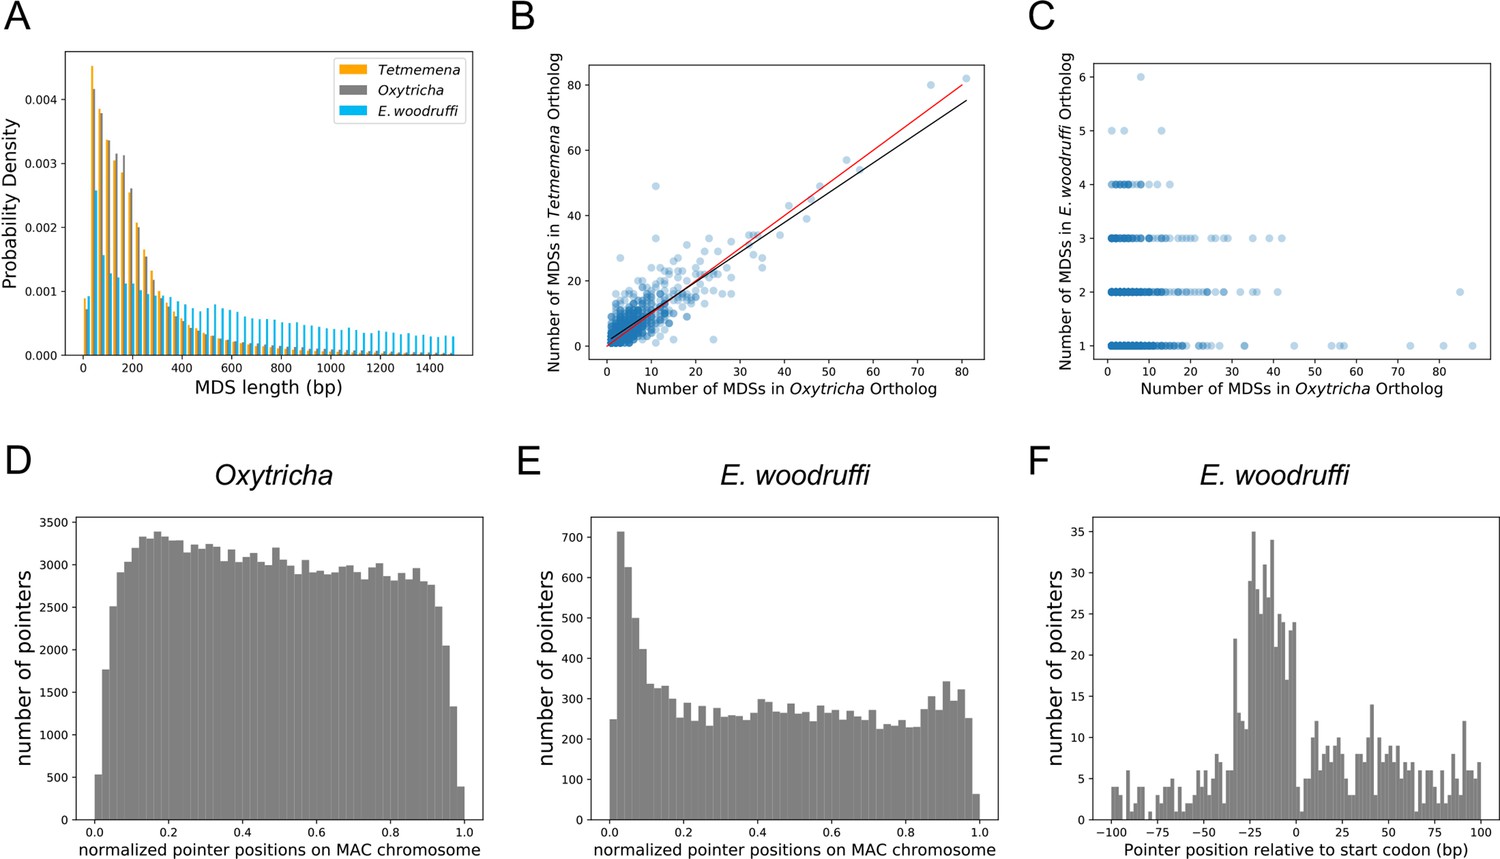
The three germline micronucleus genomes are interrupted by internally eliminated sequences (IESs) at different levels.
(A) Macronuclear destined sequences (MDSs) of Euplotes woodruffi are longer compared to Oxytricha or Tetmemena. (B) Positive correlation between the numbers of MDSs for orthologous genes in Tetmemena and in Oxytricha for 903 single-gene orthologs. Black line is the function of linear regression (R2=0.75). Red line is y=x. (C) Orthologs in E. woodruffi have fewer MDSs compared to Oxytricha, with no correlation (R2=0.003). Note that many highly discontinuous genes in Oxytricha are IES-less in E. woodruffi (present on one MDS). 917 single-gene orthologs are shown. (D) Distribution of pointers on single-gene somatic macronucleus (MAC) chromosomes in Oxytricha vs. (E) E. woodruffi, with MAC chromosomes oriented in gene direction. Pointers significantly accumulate at the 5’ end of single-gene MAC chromosomes in E. woodruffi. (F) Pointer positions on 3684 two-MDS MAC chromosomes demonstrate a preference upstream of the start codon.
Figure 3—figure supplement 1
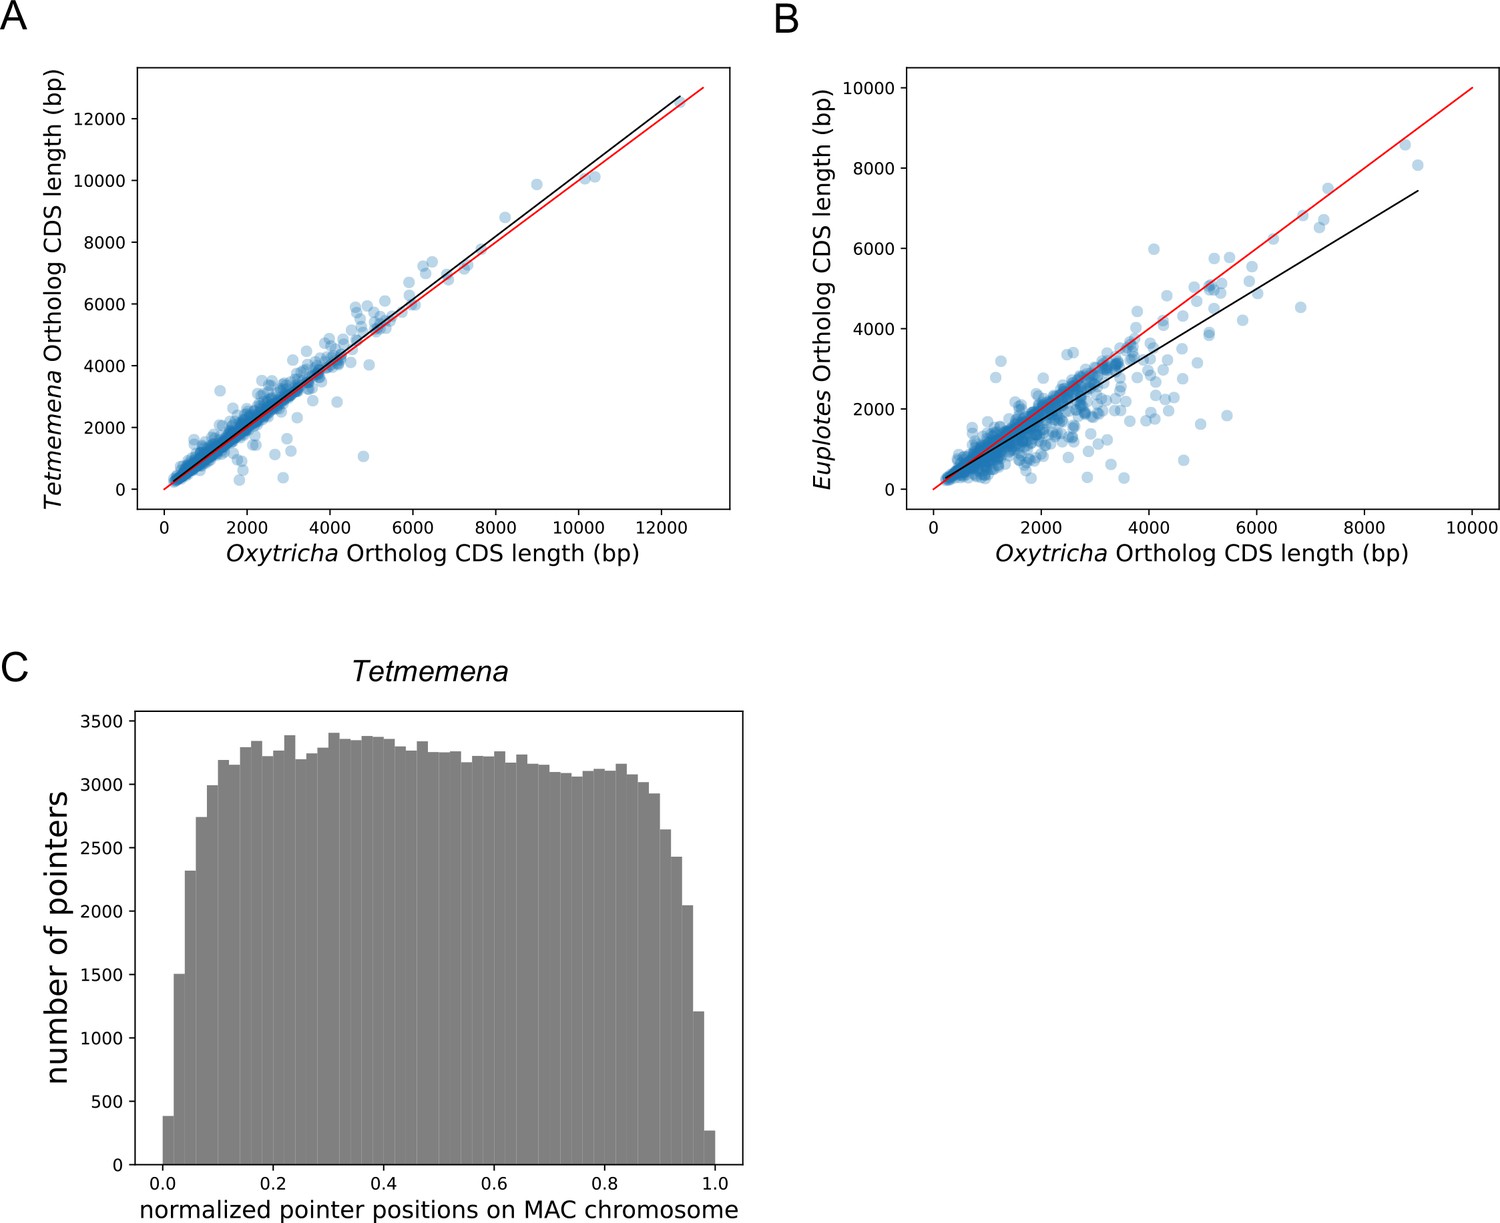
Lengths of orthologs in Oxytricha, Tetmemena and Euplotes woodruffi, and the distribution of pointers on Tetmemena chromosomes.
(A and B) Coding sequence (CDS) lengths correlate for Oxytricha, Tetmemena, and E. woodruffi orthologs (related to Figure 3). (A) Tetmemena CDS length positively correlates with that of Oxytricha orthologs (R2=0.96). Black line is the linear regression fitting function. Red line shows y=x. (B) E. woodruffi CDS length positively correlates with that of Oxytricha orthologs (R2=0.83). (C) The distribution of pointers on single-gene somatic macronucleus (MAC) chromosomes in Tetmemena displays a weak 5’ bias (related to Figure 3).
Figure 3—figure supplement 2
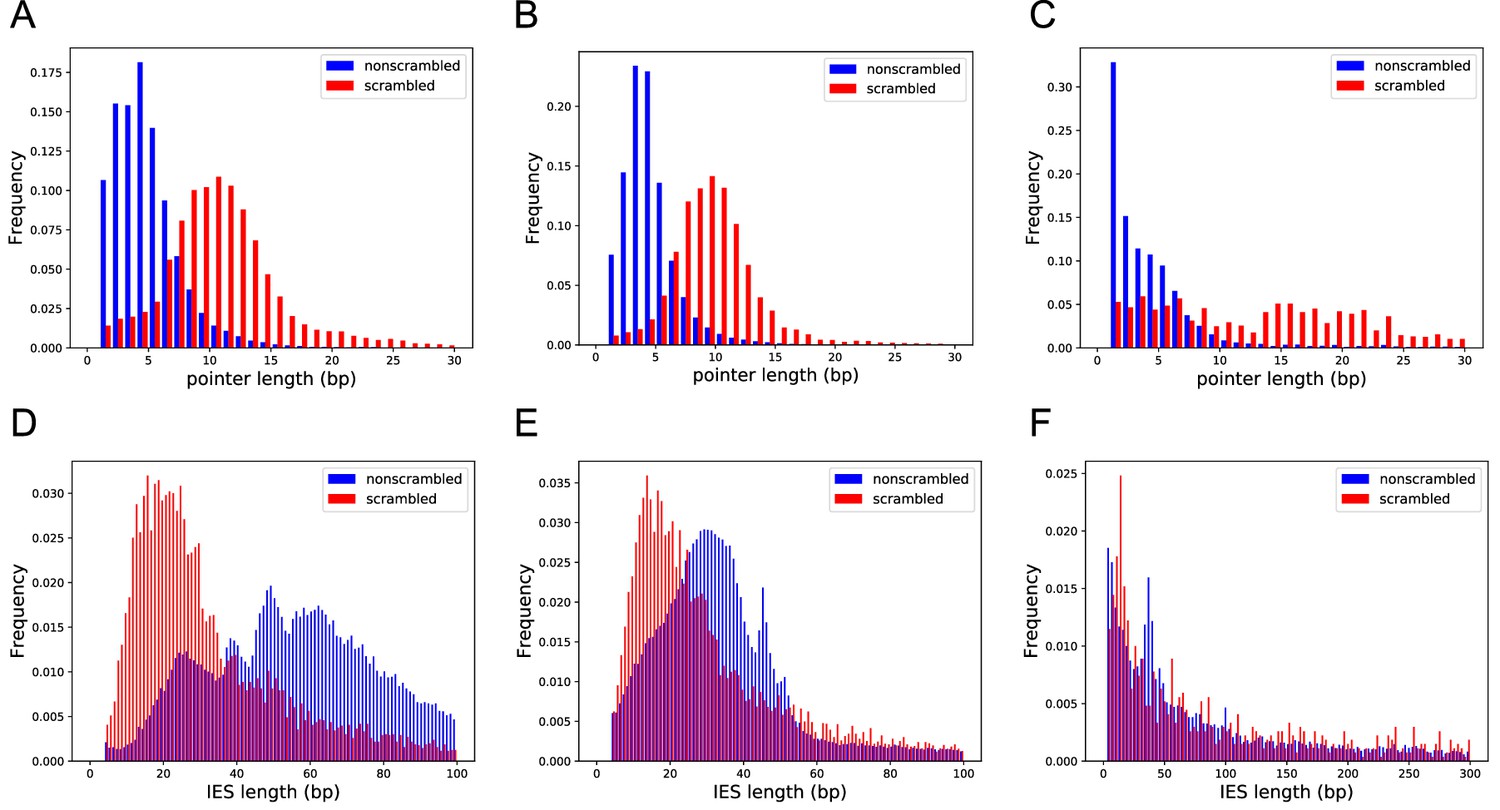
Scrambled and nonscrambled loci have distinct length distributions of internally eliminated sequences (IESs) and pointers.
(A–C) Length distribution of scrambled and nonscrambled pointers ≤30 bp in (A) Oxytricha, (B) Tetmemena, and (C) Euplotes woodruffi. (D–F) Length distribution of scrambled and nonscrambled IESs in (D) Oxytricha (≤100 bp), (E) Tetmemena (≤100 bp), and (F) E. woodruffi (≤300 bp).
Figure 4 with 3 supplements
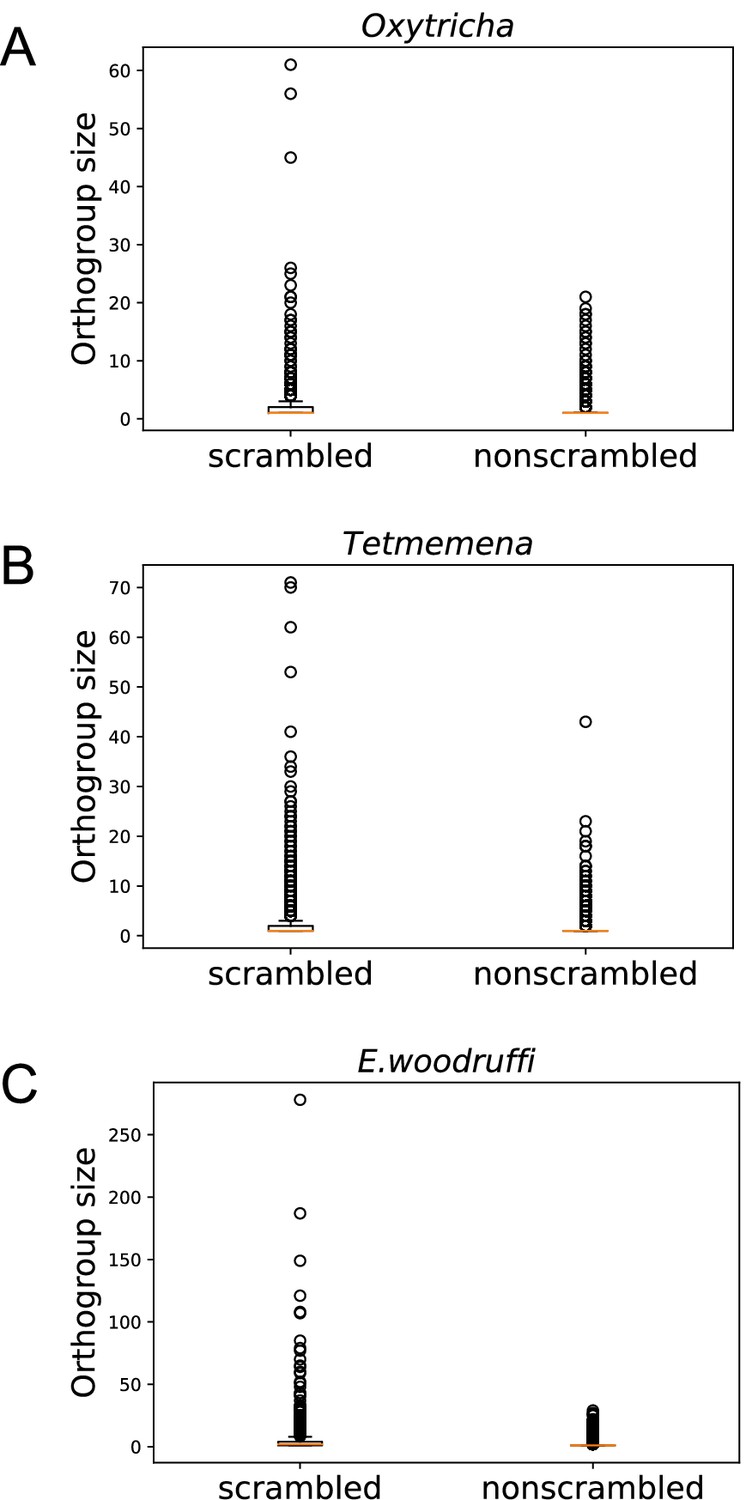
Scrambled genes have more paralogs than nonscrambled genes in the three species.
Orthogroups containing at least one scrambled gene (‘scrambled’) are larger than orthogroups that lack scrambled genes (‘nonscrambled’) in (A) Oxytricha, (B) Tetmemena, and (C) Euplotes woodruffi.
Figure 4—figure supplement 1
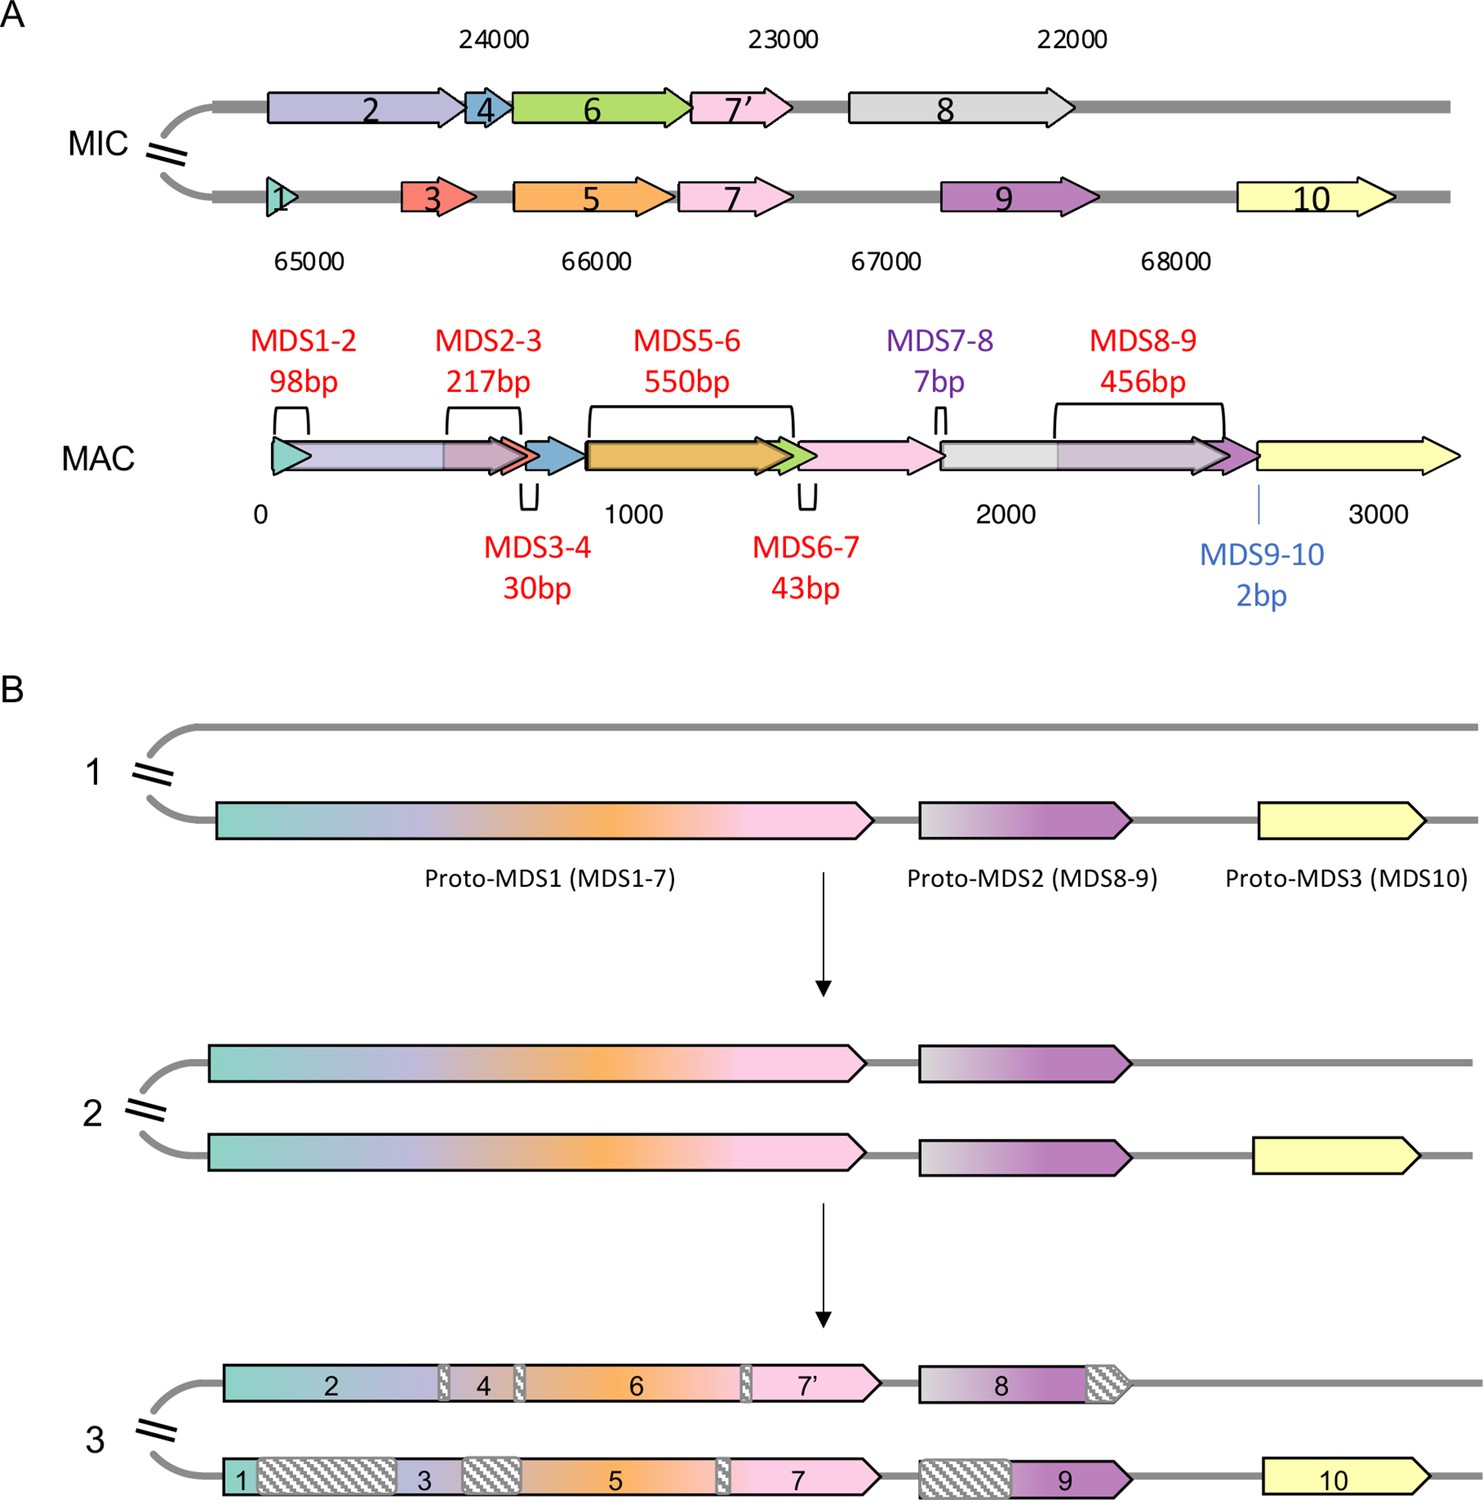
An example of a Euplotes woodruffi scrambled gene locus containing paralogous macronuclear destined sequences (MDSs).
(A) The upper panel is the map of a scrambled germline micronucleus (MIC) locus (EUPWOO_MIC_17325). Below is the corresponding map of the somatic macronucleus (MAC) chromosome (EUPWOO_MAC_29939). Pointers between MDSs are labeled above or below the MAC contig (nonscrambled pointer length in blue and scrambled pointers labeled in red). (B) A model for the evolutionary origin of this scrambled MIC locus by partial duplication and subsequent decay. Stage 1: The ancestral MIC locus contains three nonscrambled MDSs (labeled proto-MDSs because they are precursors for the modern state). Stage 2: The region containing two proto-MDSs duplicated in the MIC genome. Stage 3: Nucleotide substitutions accumulated in both paralogous copies at different positions (shown in gray dashed boxes) leading to the fixation of some regions as MDSs, while the regions that accumulated more mutations decayed into internally eliminated sequences, which are removed during genome rearrangement. (B) Has been adapted from a general model in Figure 3 from Gao et al., 2015.
Figure 4—figure supplement 2
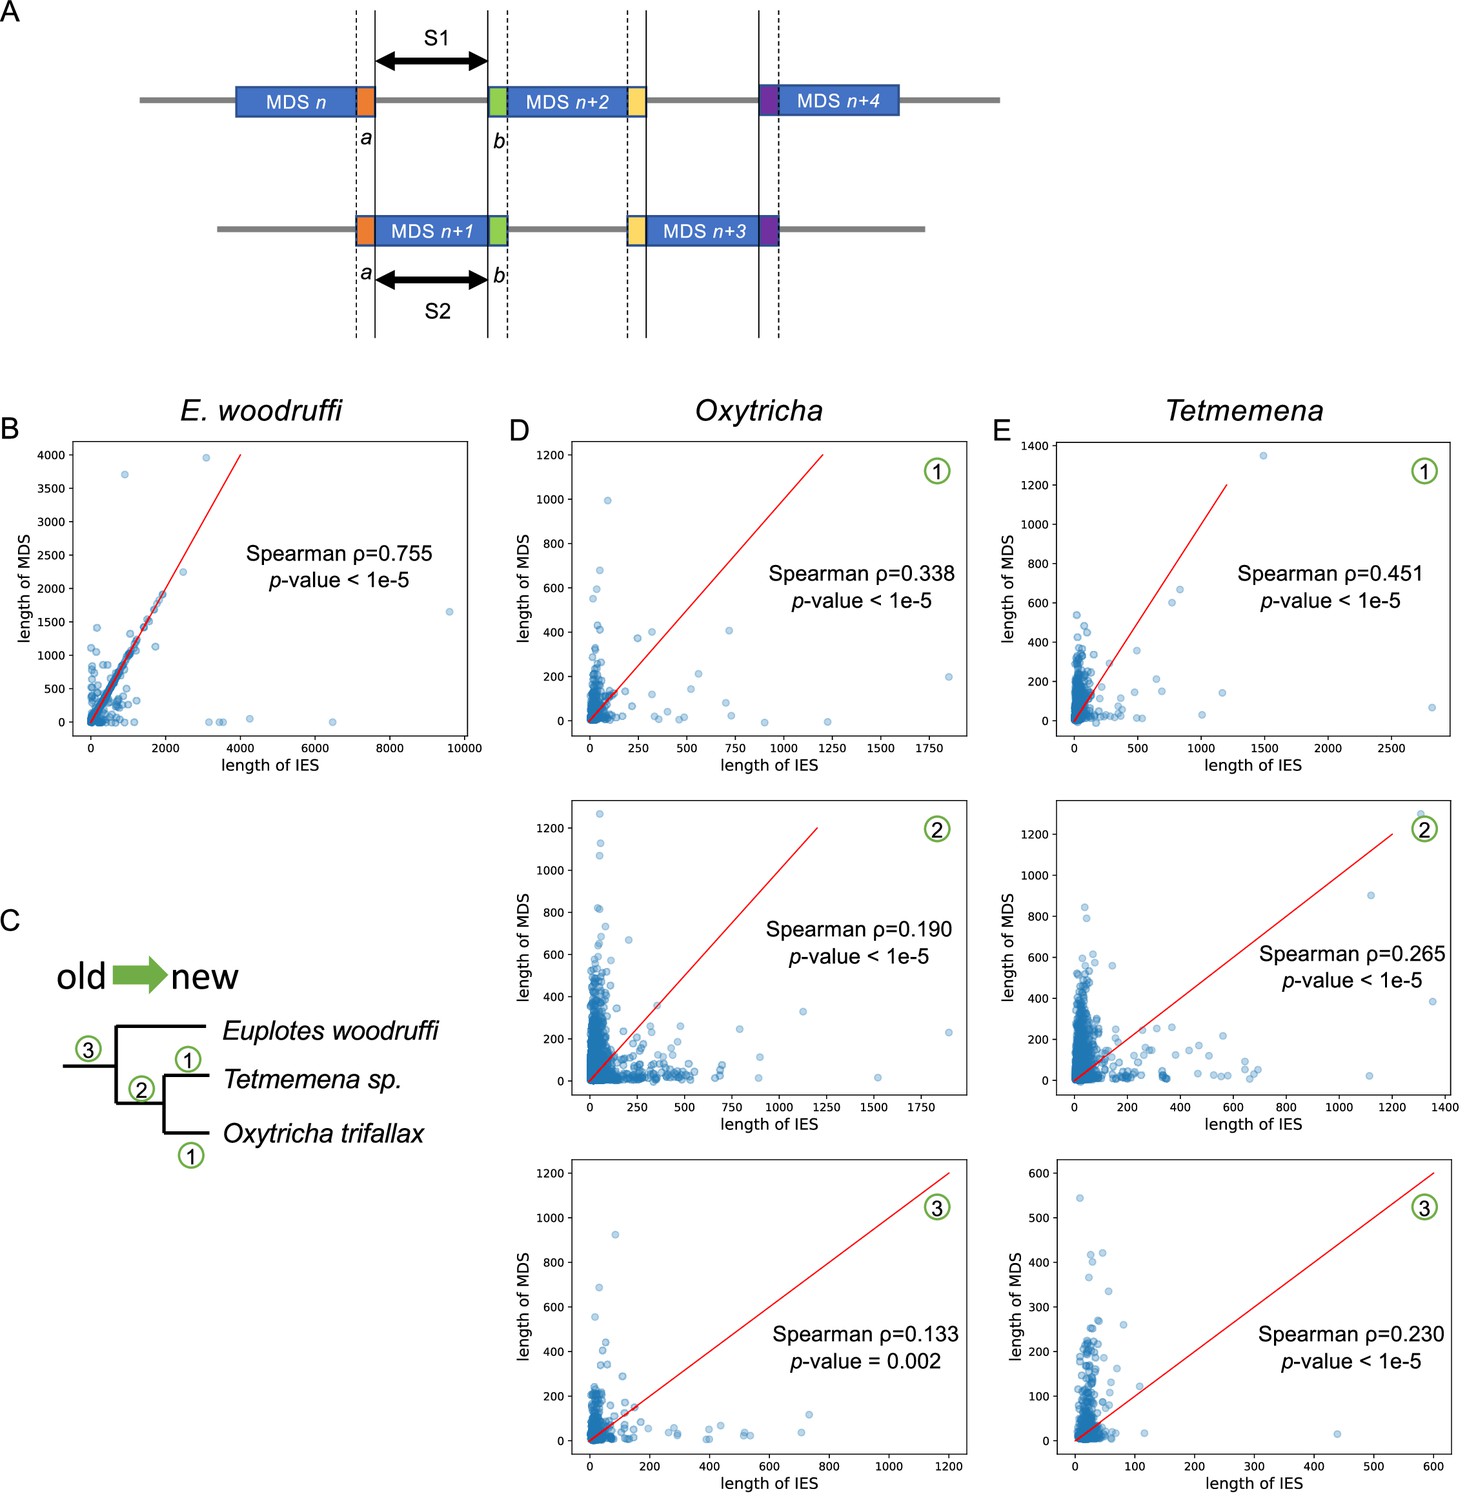
The trend of scrambled loci to contain odd-even patterns may arise from partial duplication followed by mutation accumulation.
(A) A diagram describing a typical scrambled region with an odd-even pattern. We propose that the internally eliminated sequence (IES) (S1) between macronuclear destined sequence (MDS) n and MDS n+2 may be ancestrally paralogous to MDS n+1 (S2) which evolved by duplication of MDS n+1 before it was scrambled. S1 and S2 would therefore be homologous in this model. (B) The lengths of modern IES (S1) and MDS (S2) display a strong positive correlation in Euplotes woodruffi (504 pairs). Many data points fall on the y=x (red line). All MDS and IES pairs were only considered if they are on the same germline micronucleus contig, to exclude alleles. (C) Character mapping of scrambled loci onto a phylogeny: (1) examples of scrambled loci uniquely present in one species (only showing for Oxytricha and Tetmemena; most scrambled genes in E. woodruffi have no ortholog detectable in the other two species, possibly because the long genetic distance obscured homology, see main text and Supplementary file 4); (2) scrambled loci shared between Oxytricha and Tetmemena, but not E. woodruffi; and (3) scrambled loci shared in three species. The lengths of IES (S1) and MDS (S2) in typical odd-even regions display a moderately positive correlation in Oxytricha (D) and Tetmemena (E). Newer scrambled loci correlate more strongly. Red line represents y=x. Note that S1 and S2 are flanked by identical pointers, a and b, in all annotated pairs.
Figure 4—figure supplement 3
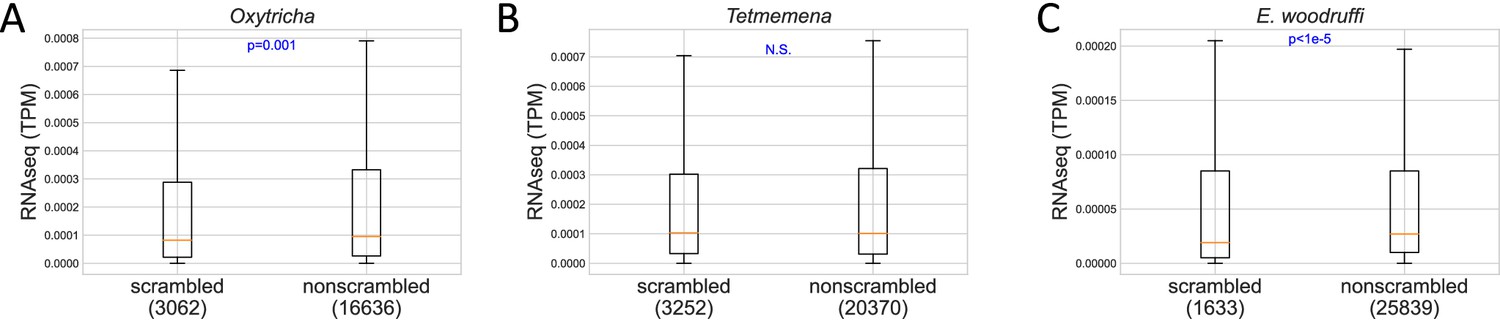
Expression level of scrambled and nonscrambled genes in (A) Oxytricha, (B) Tetmemena, and (C) Euplotes woodruffi.
p-Values of Mann-Whitney U tests are shown in blue. The line in orange shows the median. The box shows the range between the first and third quartiles. The upper whisker represents the third quartile + 1.5 × interquartile range (IQR), and the lower whisker shows the first quartile – 1.5 × IQR. Numbers in brackets indicate genes which have a coefficient of variation of TPM (transcripts per million) less than 1.
Figure 5 with 1 supplement
Identification and examples of conserved pointers.
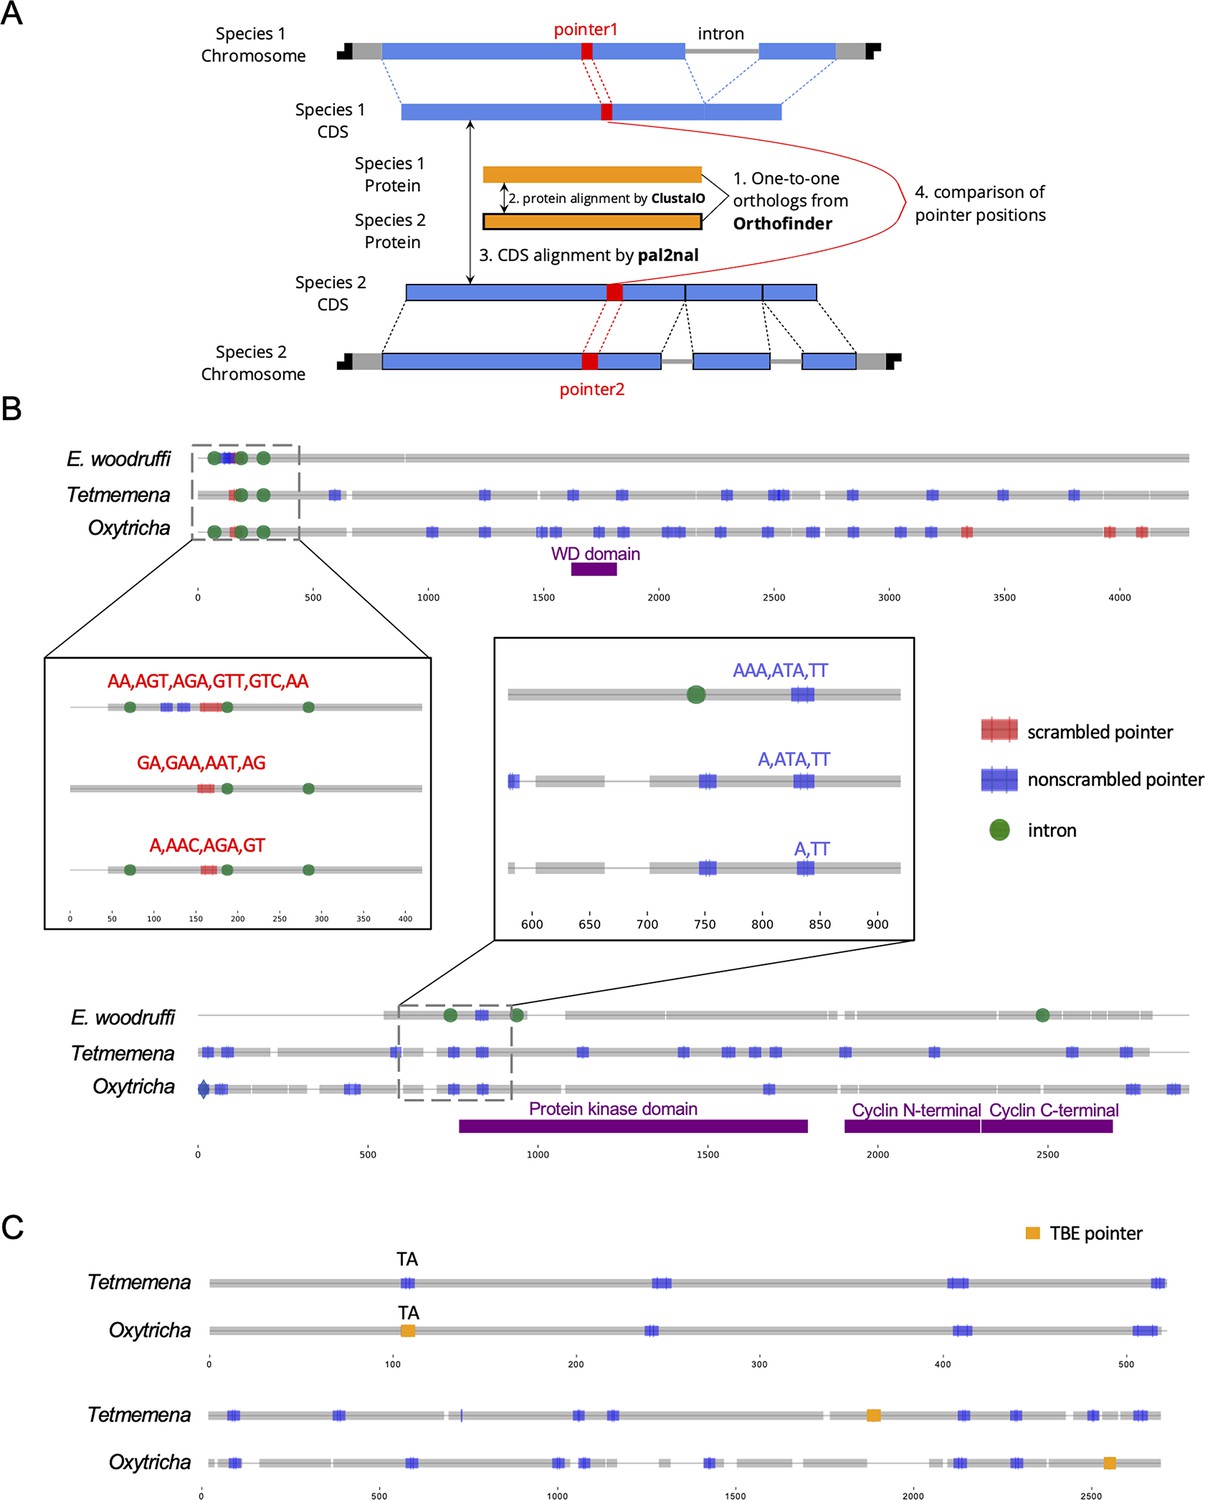
(A) Pipeline for comparison of pointer positions in orthologs. Orthologs are first grouped by OrthoFinder (Emms and Kelly, 2019), and protein sequences of single-copy orthologs aligned by Clustal Omega (Sievers et al., 2011). Then the protein alignments are reverse translated to coding sequence (CDS) alignments by a modified script of pal2nal (105, Methods). Pointers are annotated on the CDS alignments for comparison between any two orthologs. (B) Two examples of pointer conservation across three species. Gray lines represent the alignment of orthologous CDS regions, and boxes show magnified regions containing conserved pointers. The top panel shows a conserved scrambled pointer (Oxytricha: Contig889.1.g68; Tetmemena: LASU02015390.1.g1; Euplotes woodruffi: EUPWOO_MAC_30,105 .g1). The bottom panel shows a conserved nonscrambled pointer (Oxytricha: Contig19750.0.g98; Tetmemena: LASU02002033.1.g1; E. woodruffi: EUPWOO_MAC_31,621 .g1). Pointer sequences are noted, and commas indicate reading frame. Protein domains detected by HMMER (Finn et al., 2011) are marked in purple. (C) Examples of telomere-bearing element (TBE) insertions in nonscrambled internally eliminated sequences. The upper pair of sequences shows an Oxytricha TBE pointer (orange insertion of an incomplete TBE2 transposon containing the 42-kD and 57-kD open reading frames) conserved with a Tetmemena non-TBE pointer (Oxytricha: Contig736.1.g130; Tetmemena: LASU02012221.1.g1). Both species have a TA pointer at this junction. The bottom pair of sequences illustrates a case of nonconserved TBE pointers (Oxytricha: Contig17579.0.g71; Tetmemena: LASU02007616.1.g1).
-
Figure 5—source data 1
Pointers conserved in all three species.
- https://cdn.elifesciences.org/articles/82979/elife-82979-fig5-data1-v2.xlsx
-
Figure 5—source data 2
The telomere-bearing element (TBE) pointers in Oxytricha that are conserved with non-TBE pointers in Tetmemena.
- https://cdn.elifesciences.org/articles/82979/elife-82979-fig5-data2-v2.xlsx
Figure 5—figure supplement 1
Examples of intron-internally eliminated sequence (IES) conversion across three species.
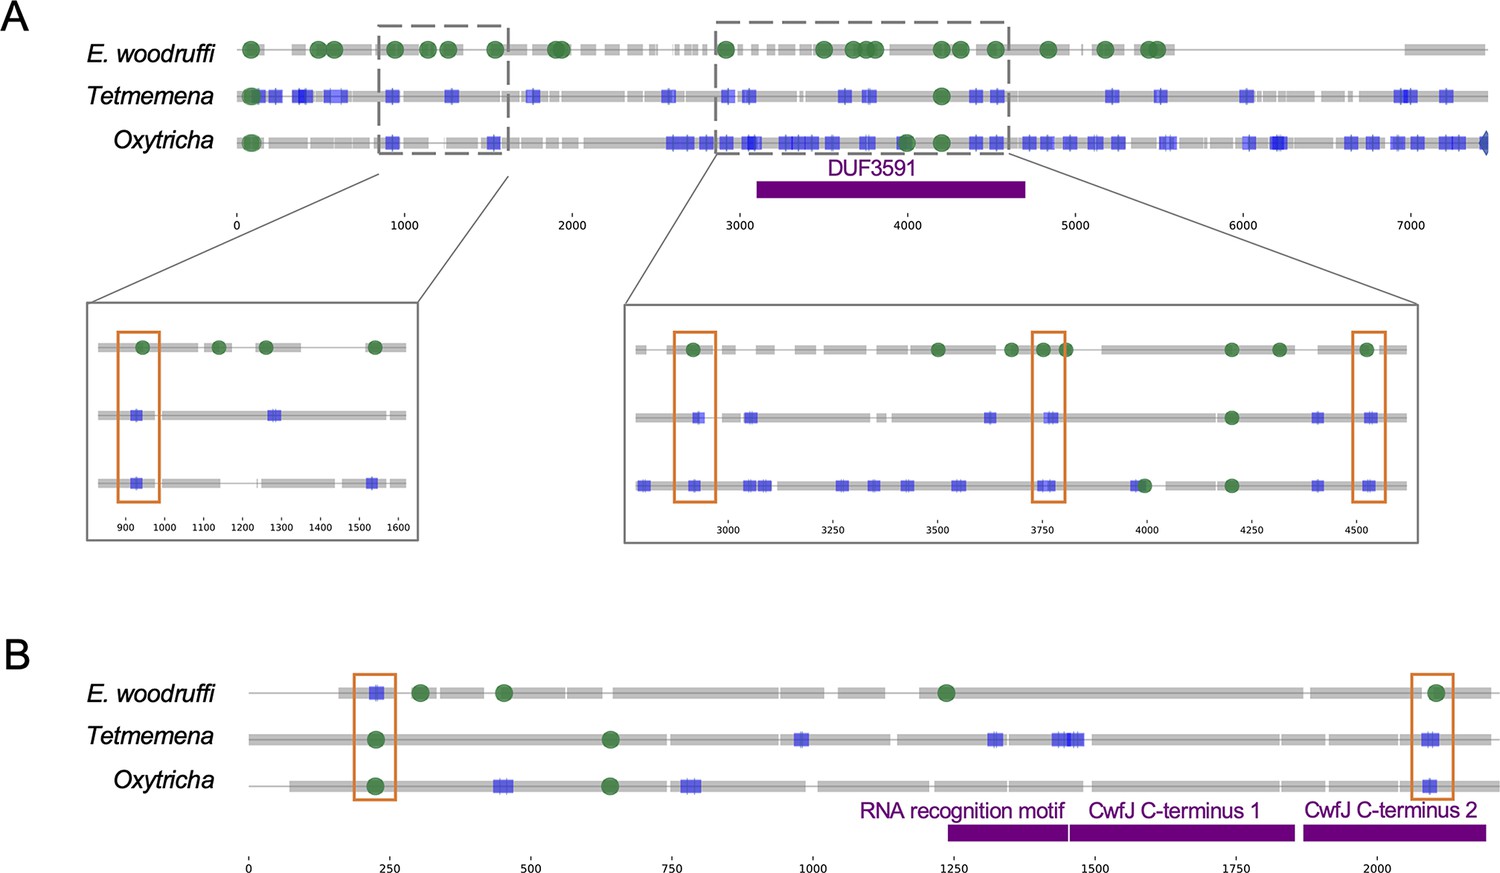
(A) Four intron positions in Euplotes woodruffi (orange boxes in magnified regions) overlap locations of nonscrambled pointers in the orthologous genes in Oxytricha and Tetmemena (Oxytricha: Contig13378.0.g40; Tetmemena: LASU02004100.1.g1; E. woodruffi: EUPWOO_MAC_08,218 .g1) consistent with a possible trend of some ancestral introns becoming IESs in the hypotrich lineage. Two positions fall within a conserved protein domain of unknown function (DUF3591). (B) An orthologous gene with two intron-IES conversions in reciprocal directions (Oxytricha: Contig16930.0.g77; Tetmemena: LASU02013377.1.g1; E. woodruffi: EUPWOO_MAC_15,089 .g1). Colors and annotation as in Figure 5.
Figure 6 with 2 supplements
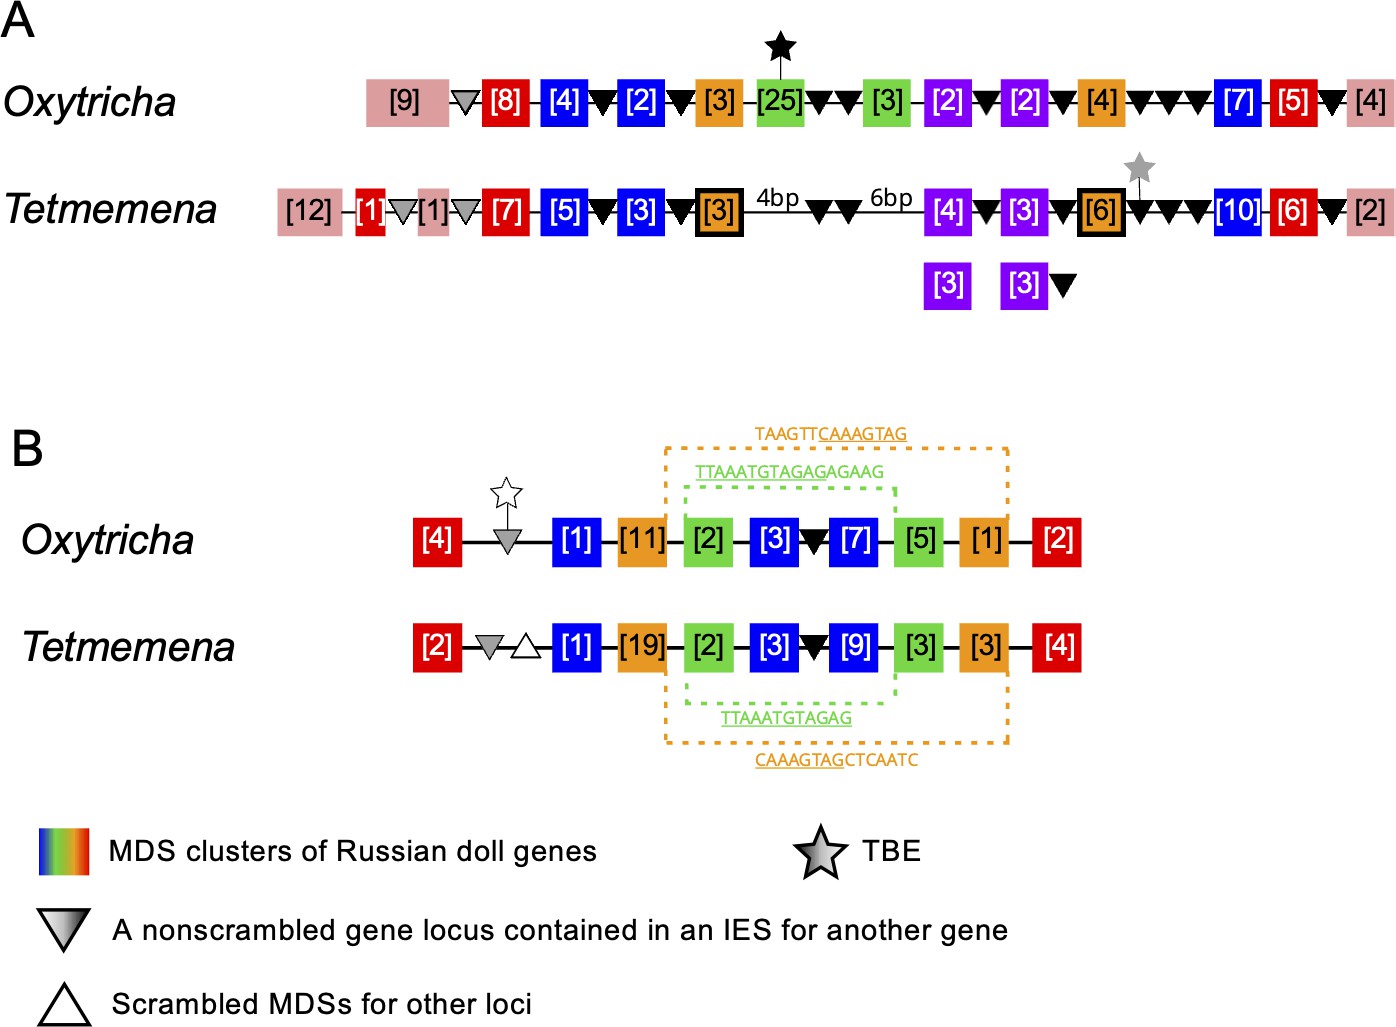
Synteny in ‘Russian doll’ loci in Oxytricha and Tetmemena.
(A) Schematic comparison of the Russian doll gene cluster on Oxytricha germline micronucleus (MIC) contig OXYTRI_MIC_87484 vs. Tetmemena MIC contig TMEMEN_MIC_21461. Boxes of the same color represent clusters of macronuclear destined sequences (MDSs) for orthologous genes (detailed map in Figure 6—figure supplement 1 and Figure 6—figure supplement 2). Numbers in brackets indicate the number of MDSs in each cluster, grouped by somatic macronucleus (MAC) chromosome. One nested gene (green) in Oxytricha is absent from Tetmemena. A two-gene chromosome (orange) that derives from seven MDSs in Oxytricha is processed as two single-gene chromosomes in Tetmemena instead (indicated by black border around orange boxes). The purple gene in Oxytricha has two paralogs in Tetmemena. Black triangles represent conserved, orthologous, and nonscrambled gene loci inserted between nested Russian doll genes. Empty triangle represents scrambled MDSs for other loci. Gray triangles, complete nonscrambled MAC loci embedded between gene layers in one species with no orthologous gene detected in the other species. Black star, a complete telomere-bearing element (TBE) transposon insertion. Gray star, a partial TBE insertion. (B) Oxytricha MIC contig OXYTRI_MIC_69233 vs. Tetmemena MIC contig TMEMEN_MIC_22886. Pointer sequences bridging the nested MDSs of orange and green genes are highlighted. The underlined pointer portions are conserved between species, e.g., the last 8 bp of the Oxytricha pointer, TAAGTTCAAAGTAG, is identical to the first 8 bp of CAAAGTAGCTCAATC in Tetmemena, illustrating pointer sliding (DuBois and Prescott, 1995), or gradual shifting of MDS/IES boundaries. White star indicates a decayed TBE with no open reading frame identified.
Figure 6—figure supplement 1

Detailed illustration of both Russian doll regions in Figure 6.
Macronuclear destined sequence (MDS) indices are annotated here for each somatic macronucleus (MAC) locus. Overlined numbers represent inverted MDSs. MAC contig numbers for the MDSs are listed below and shown in corresponding color patterns (the Oxytricha loci were previously characterized in Braun et al., 2018).
Figure 6—figure supplement 2

Details of the Russian doll region in Tetmemena (TMEMEN_MIC_21461, Figure 6A).
The whole region (~50 kb) was validated by 11 PCRs. The two black arrows indicate the absence of a Russian doll gene (green in Figure 6A) that is present in Oxytricha. Legend lists the 20 Tetmemena somatic macronucleus contigs that contain the corresponding macronuclear destined sequences.
Author response image 1
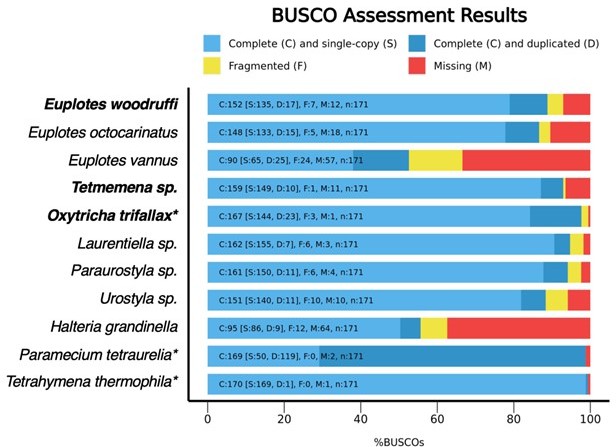
BUSCO assessments of MAC genomes in representative ciliates.
The three species in the present manuscript are shown in bold. Species with a * are expected to have high BUSCO scores because they were sampled in the BUSCO reference dataset (alveolata_odb10). MAC genomes included here: Euplotes octocarinatus (8), Euplotes vannus (9), Laurentiella sp., Paraurostyla sp., Urostyla sp. (shown to be complete based on the presence of core eukaryotic genes, 7), Halteria grandinella (Zheng et al., Genbank RRYP01000000; https://journals.asm.org/doi/10.1128/mBio.01964-20), Paramecium tetraurelia (https://paramecium.i2bc.parissaclay.fr/download/Paramecium/tetraurelia/51/annotations/ptetraurelia_mac_51/), Tetrahymena thermophila (http://ciliate.org/index.php/home/downloads).
Author response image 2
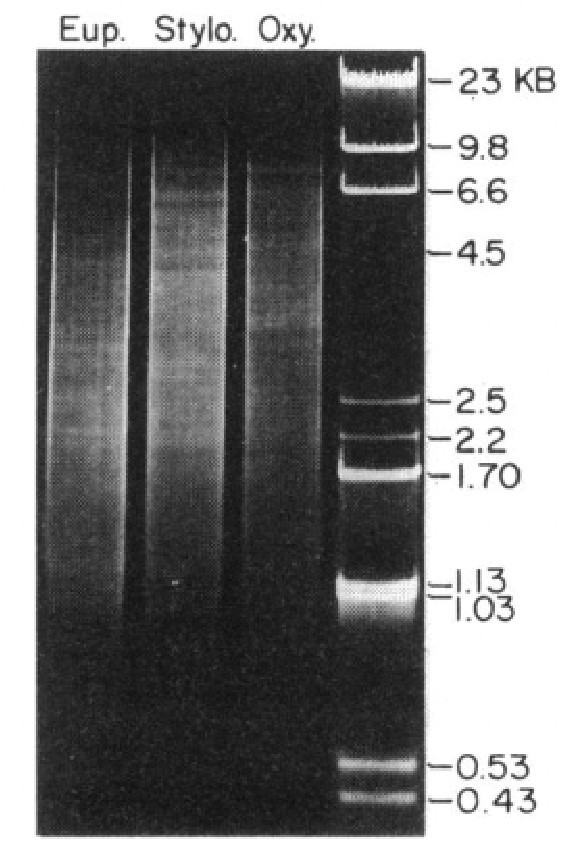
Agarose gel electrophoresis visualizing the size distribution of MAC DNA from Euplotes aediculatus, Stylonychia pustulata (also known as Tetmemena pustulata) and Oxytricha nova.
Figure 8 in ref. 13 and Swanton, Greslin, and Prescott. 1980. Chromosoma 77:203-215.
Tables
Table 1
Statistics of somatic macronucleus (MAC) and germline micronucleus (MIC) genomes in three species.
| Oxytricha trifallax | Tetmemena sp. | Euplotes woodruffi | ||||
|---|---|---|---|---|---|---|
| MACa,* | MICb | MACc | MIC† | MAC† | MIC† | |
| Genome size (Mbp) | 67.1 | 496 | 60.6 | 237 | 72.2 | 172 |
| N50 (bp) | 3745 | 27,807 | 3339 | 14,722 | 2702 | 44,656 |
| GC% | 31.36 | 28.44 | 37.05 | 32.17 | 36.56 | 35.31 |
| Number of contigs‡ | 22,426 | 25,720 | 25,206 | 28,446 | 35,099 | 17,655 |
| Two-telomere contigs | 14,225 | - | 15,802 | - | 19,061 | - |
| Telomeric contigs | 20,336 | - | 21,165 | - | 28,294 | - |
| Single-gene telomeric contigs | 76.1% | - | 75.5% | - | 68.5% | - |
| Maximum number of genes on a telomeric contig | 8 | - | 7 | - | 8 | - |
-
a - Swart et al., 2013; b - Chen et al., 2014; c - Chen et al., 2015.
-
*
This study used the MAC genome of Oxytricha from Swart et al., 2013 instead of the long-read assembly in Lindblad et al., 2019, because the short MAC genomes in the present study were primarily assembled from Illumina reads, as in Swart et al., 2013. Lindblad et al., 2019 updated Swart et al., 2013 by including nanochromosomes captured in single long reads, which are currently not available for the other two species. The MIC genomes of Tetmemena and E. woodruffi were assembled to a similar N50 as the reference O. trifallax genome (Chen et al., 2014) for comparative analysis.
-
†
Data from this study.
-
‡
Telomere-bearing element (TBE) transposon contaminants in MAC contigs were removed (Methods). Therefore, 24 Oxytricha MAC contigs and 13 Tetmemena MAC contigs were removed from the published versions.
Additional files
-
Supplementary file 1
Sequencing depth statistics for germline micronucleus (MIC) genome assemblies.
*Sequencing data from Chen et al., 2014.
**Raw reads were mapped to the MIC genome assembly by Minimap2 and Bowtie2 (Langmead and Salzberg, 2012). Average coverage was calculated with BBmap (sourceforge.net/projects/bbmap/) pileup.sh for macronuclear destined sequence-containing contigs in the MIC genome assembly.
- https://cdn.elifesciences.org/articles/82979/elife-82979-supp1-v2.docx
-
Supplementary file 2
Subcategories of repeat content in the three species.
Repeat content of the three genomes, as annotated by Repeatmasker (Smit et al., 2013) with additional manual annotation of Telomere-Bearing Element (TBE)/Transposon of Euplotes crassus (TEC) elements. The numbers may differ from Figure 2A–C because some repeats are assigned as other germline micronucleus (MIC) categories in the pie charts (Methods). For example, a MIC region which is both an internally eliminated sequence (IES) and satellite, is assigned as IES in Figure 2A–C, but is counted as a satellite in this table.
- https://cdn.elifesciences.org/articles/82979/elife-82979-supp2-v2.docx
-
Supplementary file 3
Telomere-bearing elements (TBE)/transposon of Euplotes crassus (TEC) elements open reading frames in three species.
* Differs from 10,109 in Chen et al. (Chen and Landweber, 2016) because we used different versions of BLAST and custom python scripts to identify complete TBEs (see Methods).
- https://cdn.elifesciences.org/articles/82979/elife-82979-supp3-v2.docx
-
Supplementary file 4
Orthology among scrambled and nonscrambled genes in the three species.
* Ciliate database is generated by extracting all protein sequences in phylum Ciliophora (taxid: 5878) from NR database.
- https://cdn.elifesciences.org/articles/82979/elife-82979-supp4-v2.docx
-
Supplementary file 5
Summary of orthologs in each pair of species.
The (i,j) cell shows the number of genes in species i with an ortholog in species j.
* Genes with no ortholog detected by OrthoFinder (Emms and Kelly, 2019) in the other two species.
- https://cdn.elifesciences.org/articles/82979/elife-82979-supp5-v2.docx
-
Supplementary file 6
More scrambled somatic macronucleus (MAC) contigs contain at least one paralogous macronuclear destined sequence that may be involved in alternative rearrangement.
- https://cdn.elifesciences.org/articles/82979/elife-82979-supp6-v2.docx
-
Supplementary file 7
Macronuclear destined sequence (MDS)-internally eliminated sequence (IES) pairs share homologous sequences in the three species (related to Figure 4—figure supplement 2).
- https://cdn.elifesciences.org/articles/82979/elife-82979-supp7-v2.docx
-
Supplementary file 8
Genes with expression support in the three species.
- https://cdn.elifesciences.org/articles/82979/elife-82979-supp8-v2.docx
-
Supplementary file 9
Presence of conserved pointers in three species, with Monte Carlo simulations.
- https://cdn.elifesciences.org/articles/82979/elife-82979-supp9-v2.docx
-
Supplementary file 10
Scrambled pointers are more conserved than nonscrambled pointers.
- https://cdn.elifesciences.org/articles/82979/elife-82979-supp10-v2.docx
-
Supplementary file 11
Most pointers conserved in position are different in sequence.
- https://cdn.elifesciences.org/articles/82979/elife-82979-supp11-v2.docx
-
Supplementary file 12
Intron-IES conversion comparison in three species and Monte Carlo simulations.
- https://cdn.elifesciences.org/articles/82979/elife-82979-supp12-v2.docx
-
Supplementary file 13
Pairwise intron-IES conversion comparisons and Monte Carlo simulations.
- https://cdn.elifesciences.org/articles/82979/elife-82979-supp13-v2.docx
-
Supplementary file 14
PCR primers for validation of the Russian doll region in Tetmemena DNA (Figure 6A).
- https://cdn.elifesciences.org/articles/82979/elife-82979-supp14-v2.docx
-
MDAR checklist
- https://cdn.elifesciences.org/articles/82979/elife-82979-mdarchecklist1-v2.docx
Download links
A two-part list of links to download the article, or parts of the article, in various formats.
Downloads (link to download the article as PDF)
Open citations (links to open the citations from this article in various online reference manager services)
Cite this article (links to download the citations from this article in formats compatible with various reference manager tools)
Comparative genomics reveals insight into the evolutionary origin of massively scrambled genomes
eLife 11:e82979.
https://doi.org/10.7554/eLife.82979


