Condensation of LINE-1 is critical for retrotransposition
- Institute for Systems Genetics, New York University Langone Medical Center, United States
Figures
Figure 1 with 1 supplement
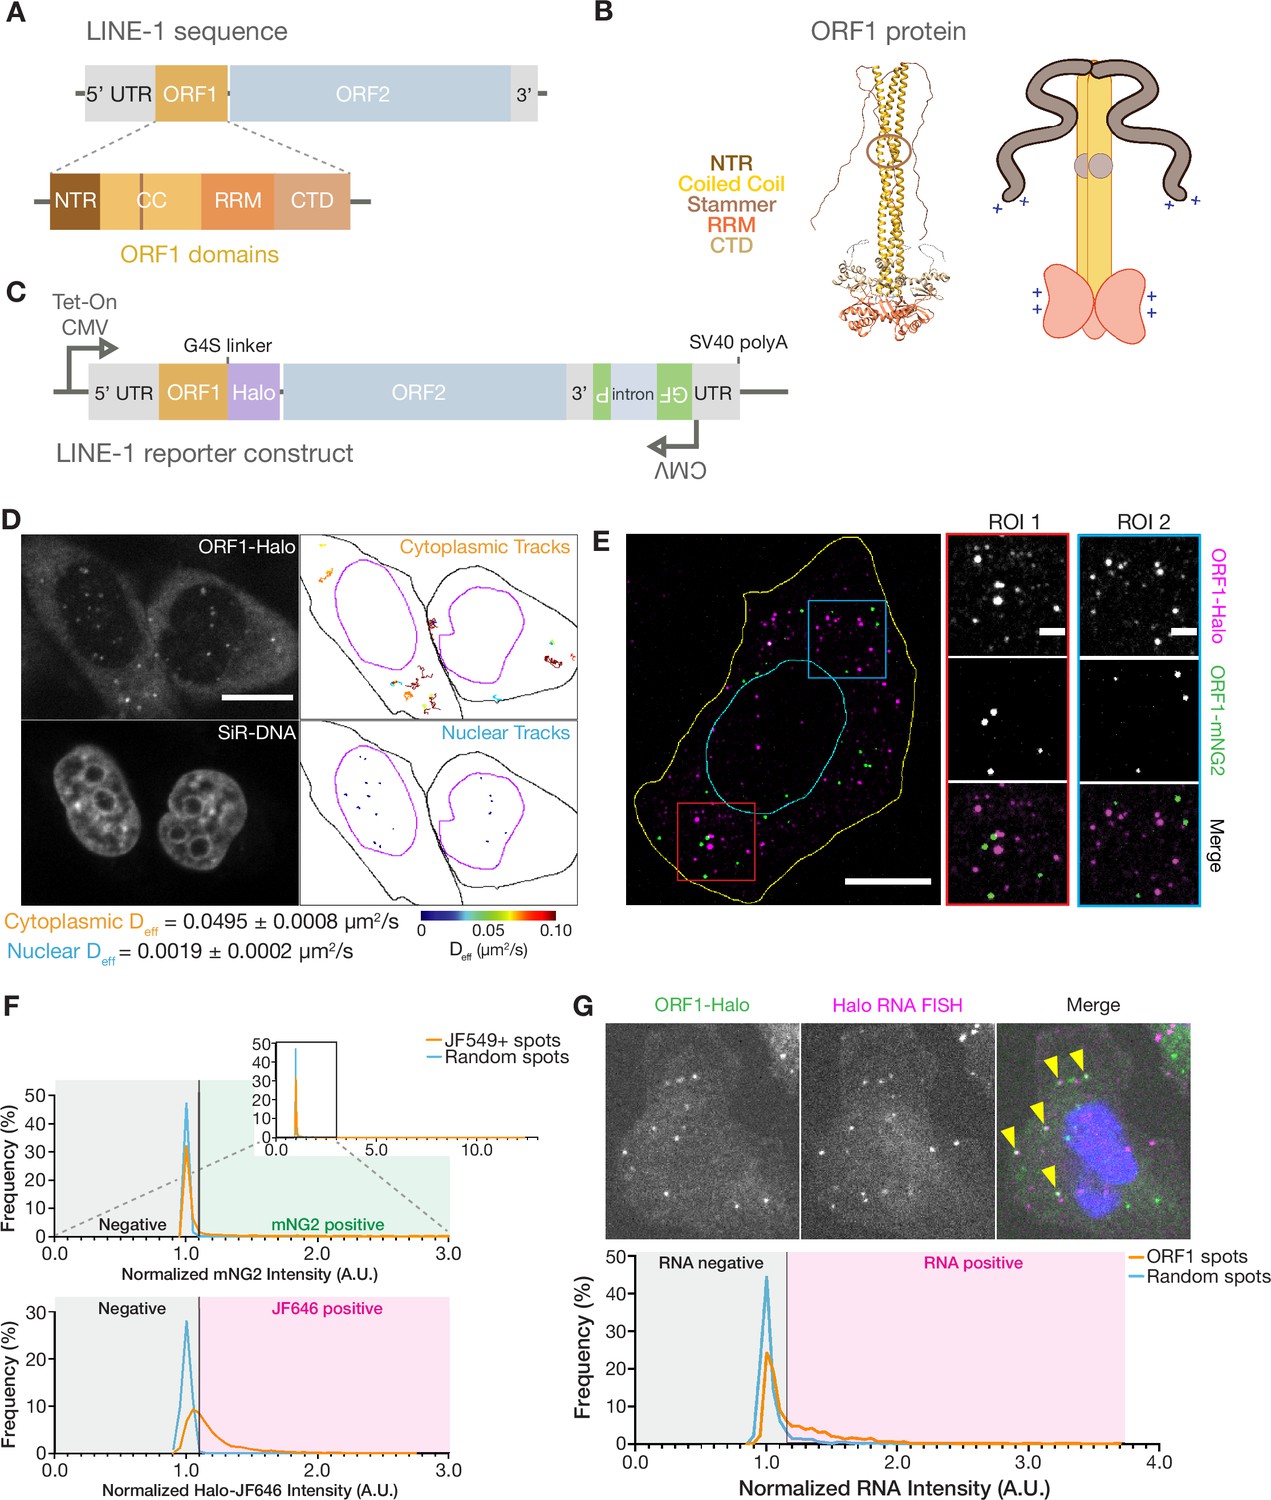
ORF1p forms monodisperse, diffusive puncta in live cells that do not readily mix.
(A) Schematic of a full-length endogenous L1 element, with a detailed view of the domains of ORF1. (B) A structural model of an ORF1p trimer. A composite model generated by superimposing the coiled-coil structure (Protein Data Bank (PDB) entry 6FIA) on the RRM and CTD structure (PDB entry 2YKO). An extended conformation of the disordered NTR is modeled in. The flexibility-conferring stammer motif in the coiled coil is circled in brown. A cartoon model highlighting the motifs of interest is presented on the right. (C) Schematic of the modified L1RP element used for cellular expression. A Tet-On CMV promoter drives expression of the full-length L1, which also contains a C-terminal HaloTag (Halo) on ORF1p and a GFP-AI retrotransposition reporter in its 3’ UTR. (D) ORF1 puncta diffuse much more slowly in the nucleus compared to the cytoplasm. A representative confocal micrograph at a single Z position shows ORF1 puncta in live HeLa cells after 24 hours of expression (top left) and corresponding nuclear staining (bottom left). Particle tracks generated from 10 s (100 frames) of imaging are shown for puncta in the cytoplasm (top right) and nucleus (bottom right) and are colored from blue to red, with blue indicating low effective diffusion and red representing high. Black and purple outlines represent hand-drawn cell and nuclear contours, respectively. Reported effective diffusion (Deff) is the median and SEM Deff of 20 fields of view that each contain more than 5 puncta-containing HeLa cells following 24 hr of L1 expression. Scale bar = 5 µm. (E) ORF1p from co-expressed L1s predominantly condense separately in singly-labeled foci. Representative maximum Z projection image of a fixed HeLa cell expressing ORF1-Halo (magenta) and ORF1-mNG2 (green) off of two separate L1 expression constructs for 5 hr. Red and blue squares represent representative ROIs shown (right). Manually drawn lines reflect the contours of the cell (yellow) and nucleus (cyan). Scale bars = 10 µm (left) and 2 µm (ROIs). (F) ORF1p signal from co-expressed L1s colocalizes significantly less than a colocalization control. The cells were stained simultaneously with two Halo ligand dyes (JF549 and JF646), giving a positive control for colocalization. Histograms of mNG2 (top) and JF646 (bottom) intensity at JF549+ spots (orange) versus an equal number of random intracellular spots (blue) are shown. The full mNG2 histogram is shown (top-right) with an enlarged view to better visualize the histograms. The normalized intensity cutoff used to detect mNG2 and JF646 in the spots is shown and is the same for both histograms (Materials and methods). Mann-Whitney test between the JF549+ spot intensities and random spot intensities had a two-tailed p-value p<0.0001 for both mNG2 and JF646. N=1522 JF549+ spots and 1522 random intracellular spots across 31 cellular ROIs. (G) ORF1 puncta are frequently associated with L1 reporter RNA. Representative image of a fixed HeLa cell expressing the L1 reporter construct with fluorescently-labeled ORF1-Halo (green) and HCR-RNA FISH for the HaloTag sequence in the reporter RNA (magenta) (top). Nuclear staining is shown in blue in the merged image and yellow arrowheads indicate colocalized ORF1-Halo and reporter RNA. Histogram shows normalized RNA channel intensities at detected ORF1-Halo spots (orange) versus an equal number of random cytoplasmic spots per cellular ROI (blue) (bottom). The intensity cutoff used to call RNA-positive spots is shown (Materials and methods). Mann-Whitney test between the two sets of intensities had a two-tailed p-value p<0.0001. N=1756 ORF1 spots and 1756 random cytoplasmic spots across 26 cellular ROIs. NTR = N-terminal region, CC = coiled coil, RRM = RNA recognition motif, CTD = C-terminal domain.
-
Figure 1—source data 1
Cytoplasmic and nuclear ORF1 puncta tracking data.
Output data matrix from GEMspa with tracking data for all tracked ORF1 particle trajectories in HeLa cells expressing the reporter L1 for 24 hr; associated with Figure 1D.
- https://cdn.elifesciences.org/articles/82991/elife-82991-fig1-data1-v2.zip
-
Figure 1—source data 2
ORF1-ORF1 colocalization data.
Output data matrices from the spot detection algorithm run on the ORF1-Halo and ORF1-mNG2 colocalization data, with intensity information for the detected intracellular JF549+ spots and randomly assigned intracellular spots; associated with Figure 1F.
- https://cdn.elifesciences.org/articles/82991/elife-82991-fig1-data2-v2.zip
-
Figure 1—source data 3
ORF1-L1 reporter RNA colocalization data.
Output data matrices from the spot detection algorithm run on the ORF1-Halo and reporter L1 RNA FISH colocalization data, with intensity information for the detected Halo+ spots and randomized cytoplasmic ‘Halo’ spots, as well as detected RNA+ spots and randomized cytoplasmic ‘RNA’ spots; associated with Figure 1G.
- https://cdn.elifesciences.org/articles/82991/elife-82991-fig1-data3-v2.zip
Figure 1—figure supplement 1
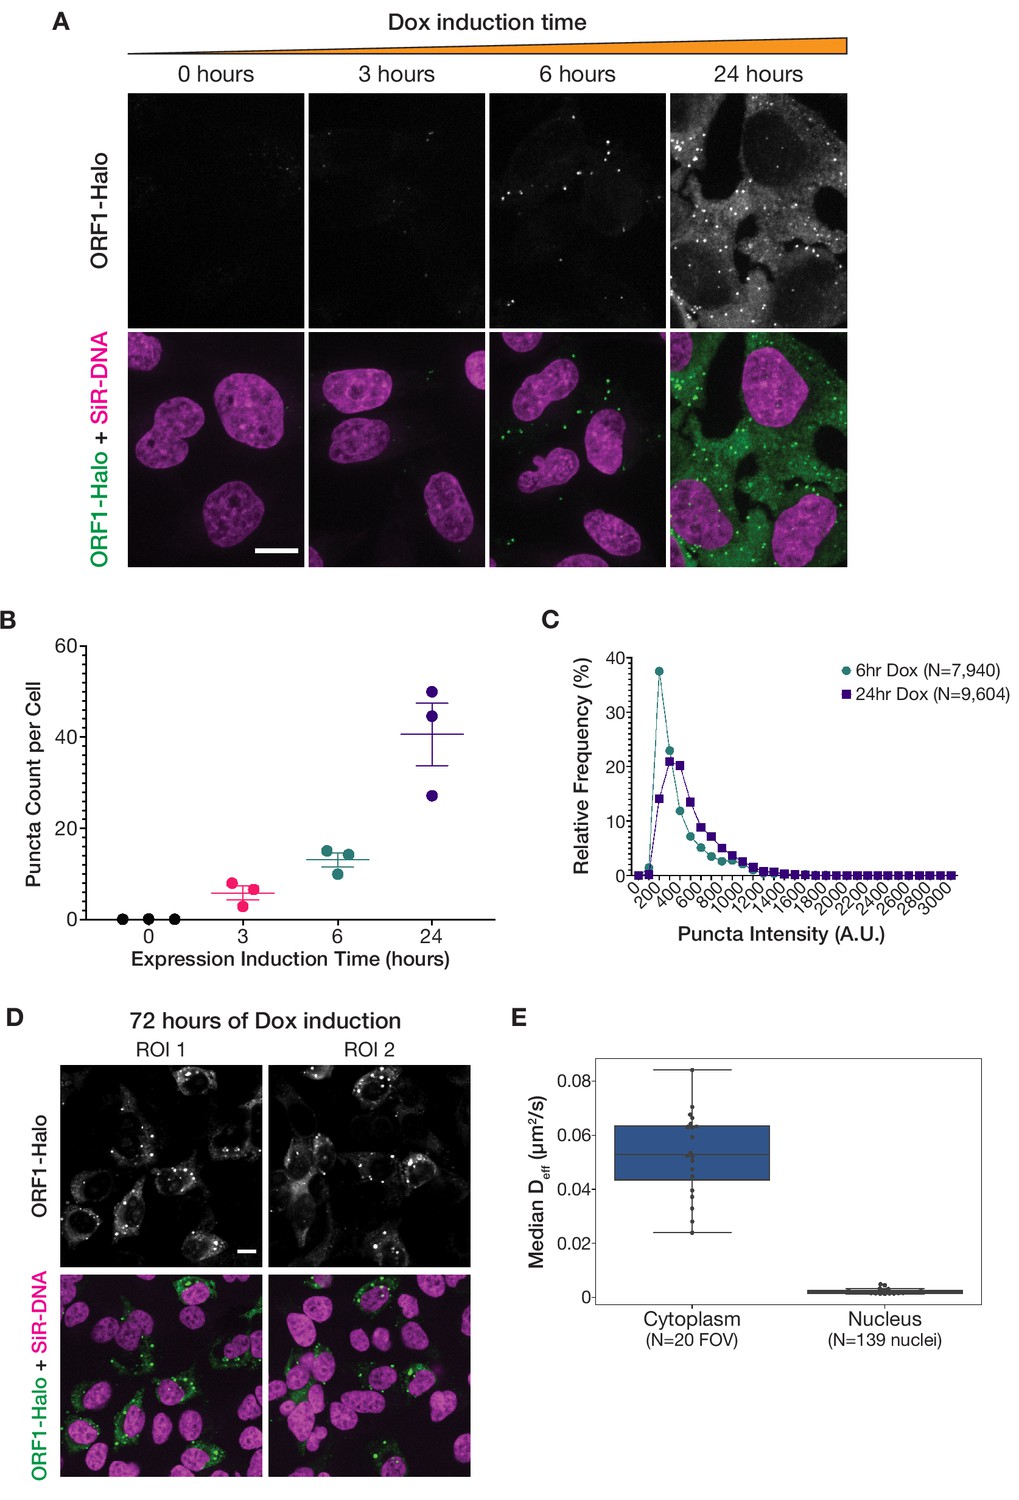
Increased L1 expression primarily increases the number of ORF1 puncta, but longer expression leads to the formation of larger stress-granule-like assemblies.
(A) ORF1 puncta form robustly after 6 hr of expression and increase in number after 24 hr of expression. Representative maximum intensity Z projections of live HeLa cells expressing WT ORF1p after varying lengths of L1 expression induction. ORF1-Halo signal is shown alone (top) and with nuclear staining (bottom, SiR-DNA). All of the ORF1p images have the same lookup tables. Scale bar = 10 µm. (B) The number of ORF1p condensates in cells increases with increased expression induction time. The average number of ORF1p puncta per cell was quantified after different L1 expression induction times. Each point represents one biological replicate of induction and is the average of at least 75 cells. The mean and SEM of three biological replicates are shown. (C) The fluorescence intensity of ORF1 puncta increases slightly between 6 and 24 hr of L1 expression. Histograms of the intensities of ORF1 puncta in HeLa cells after 6 hr (N=7940 puncta) or 24 hr (N=9604 puncta) of L1 expression. Movies of ORF1 puncta were tracked and puncta intensities were averaged over the duration of each track (see Materials and methods for details). (D) Larger, more heterogeneous ORF1 condensates form after 72 hr of expression. Two representative ROIs of HeLa cells expressing L1 for 72 hr, stained with Halo ligand dye immediately prior to fixation. ORF1-Halo signal is shown alone (top) and with nuclear staining (bottom, SiR-DNA). Scale bar = 10 µm. (E) Nuclear ORF1 puncta diffuse much more slowly than their cytoplasmic counterparts. Movies of ORF1 puncta were tracked, and the median Deff for each nucleus (N=139) or each field of view excluding nuclei (FOV; N=20) was calculated and plotted as a single point (see Materials and methods for details). Boxplots show the spread of the median Deff values.
Figure 2 with 2 supplements
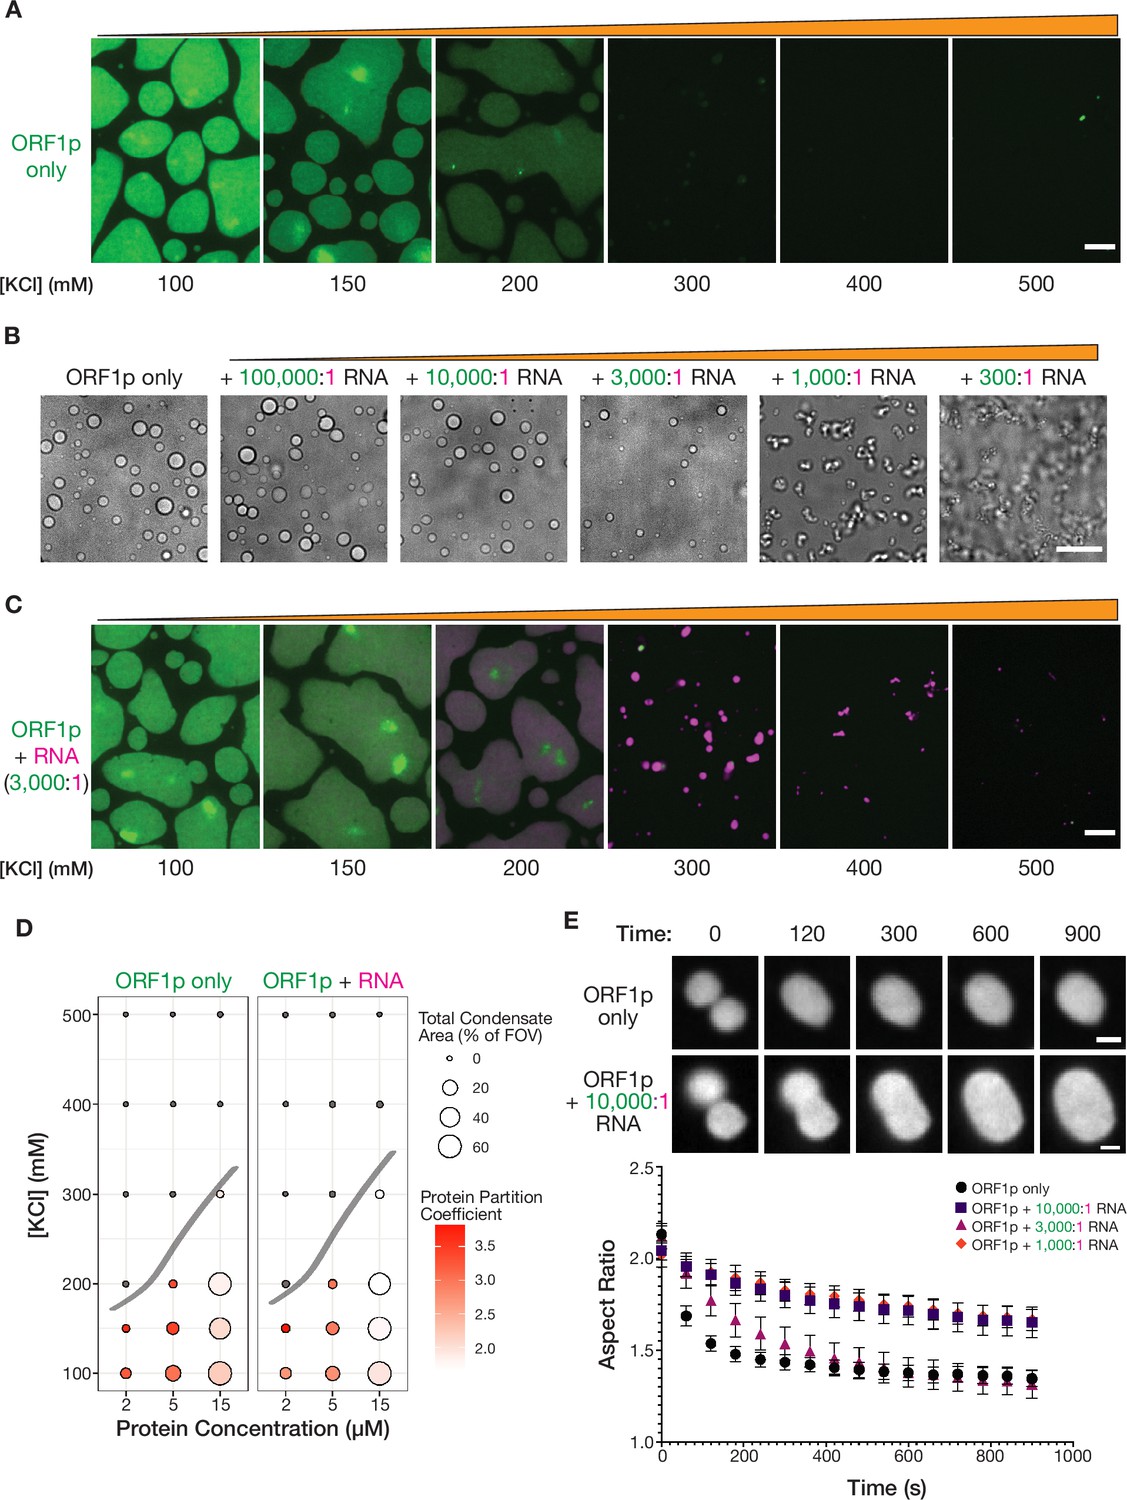
Purified ORF1p forms condensates with and without RNA, exhibiting differential condensate properties.
(A) Purified ORF1p forms an extensive condensed phase in vitro. Representative images of ORF1p (green) condensed phase formation across a range of salt concentrations. 15 µM protein was used. All of the images use the same lookup tables (LUTs). Scale bars = 5 µm. (B) Increasing RNA leads to decreasing droplet area and eventually the formation of irregular three-dimensional fibrillar structures. Representative brightfield images of ORF1p droplet morphology over a wide range of 2-kb L1 RNA stoichiometries, with increasing RNA concentration from left to right. 5 µM protein and 150 mM KCl was used in all conditions. Scale bar = 10 µm. (C) RNA robustly co-condenses with ORF1p in vitro. Representative images of ORF1p (green) condensed phase formation across a range of salt concentrations as in (A), in the presence of added labeled 2-kb L1 RNA (magenta). 15 µM protein and 5 nM RNA were used (3,000:1 protein:RNA). All of the images use the same LUTs for each channel. Scale bar = 5 µm. (D) RNA addition does not strongly affect the phase diagram of ORF1p in vitro. A phase diagram of ORF1p with and without added RNA (3,000:1 protein:RNA). Total condensed phase area of each condition is shown by the area of the circle for each condition, and the protein partition coefficient is represented by the filling. A hand-drawn phase boundary separates conditions with appreciable condensation with those that do not. (E) RNA-containing ORF1p condensates have slower droplet fusion kinetics than protein-only condensates. Representative images of fusion events over 15 min are shown for ORF1p with and without 10,000:1 protein:RNA addition, demonstrating slower fusion with RNA. 10 µM protein and 150 mM KCl were used in all conditions. Average aspect ratios across individual fusion events in each RNA condition are plotted (mean ± SEM) over time for 15 min. Ten or more fusions were analyzed per condition. Scale bars = 1 µm.
-
Figure 2—source data 1
WT ORF1p in vitro droplet fusion data.
Quantification of individual fusion events of WT ORF1p condensates in vitro across RNA concentrations; associated with Figure 2E.
- https://cdn.elifesciences.org/articles/82991/elife-82991-fig2-data1-v2.zip
Figure 2—figure supplement 1
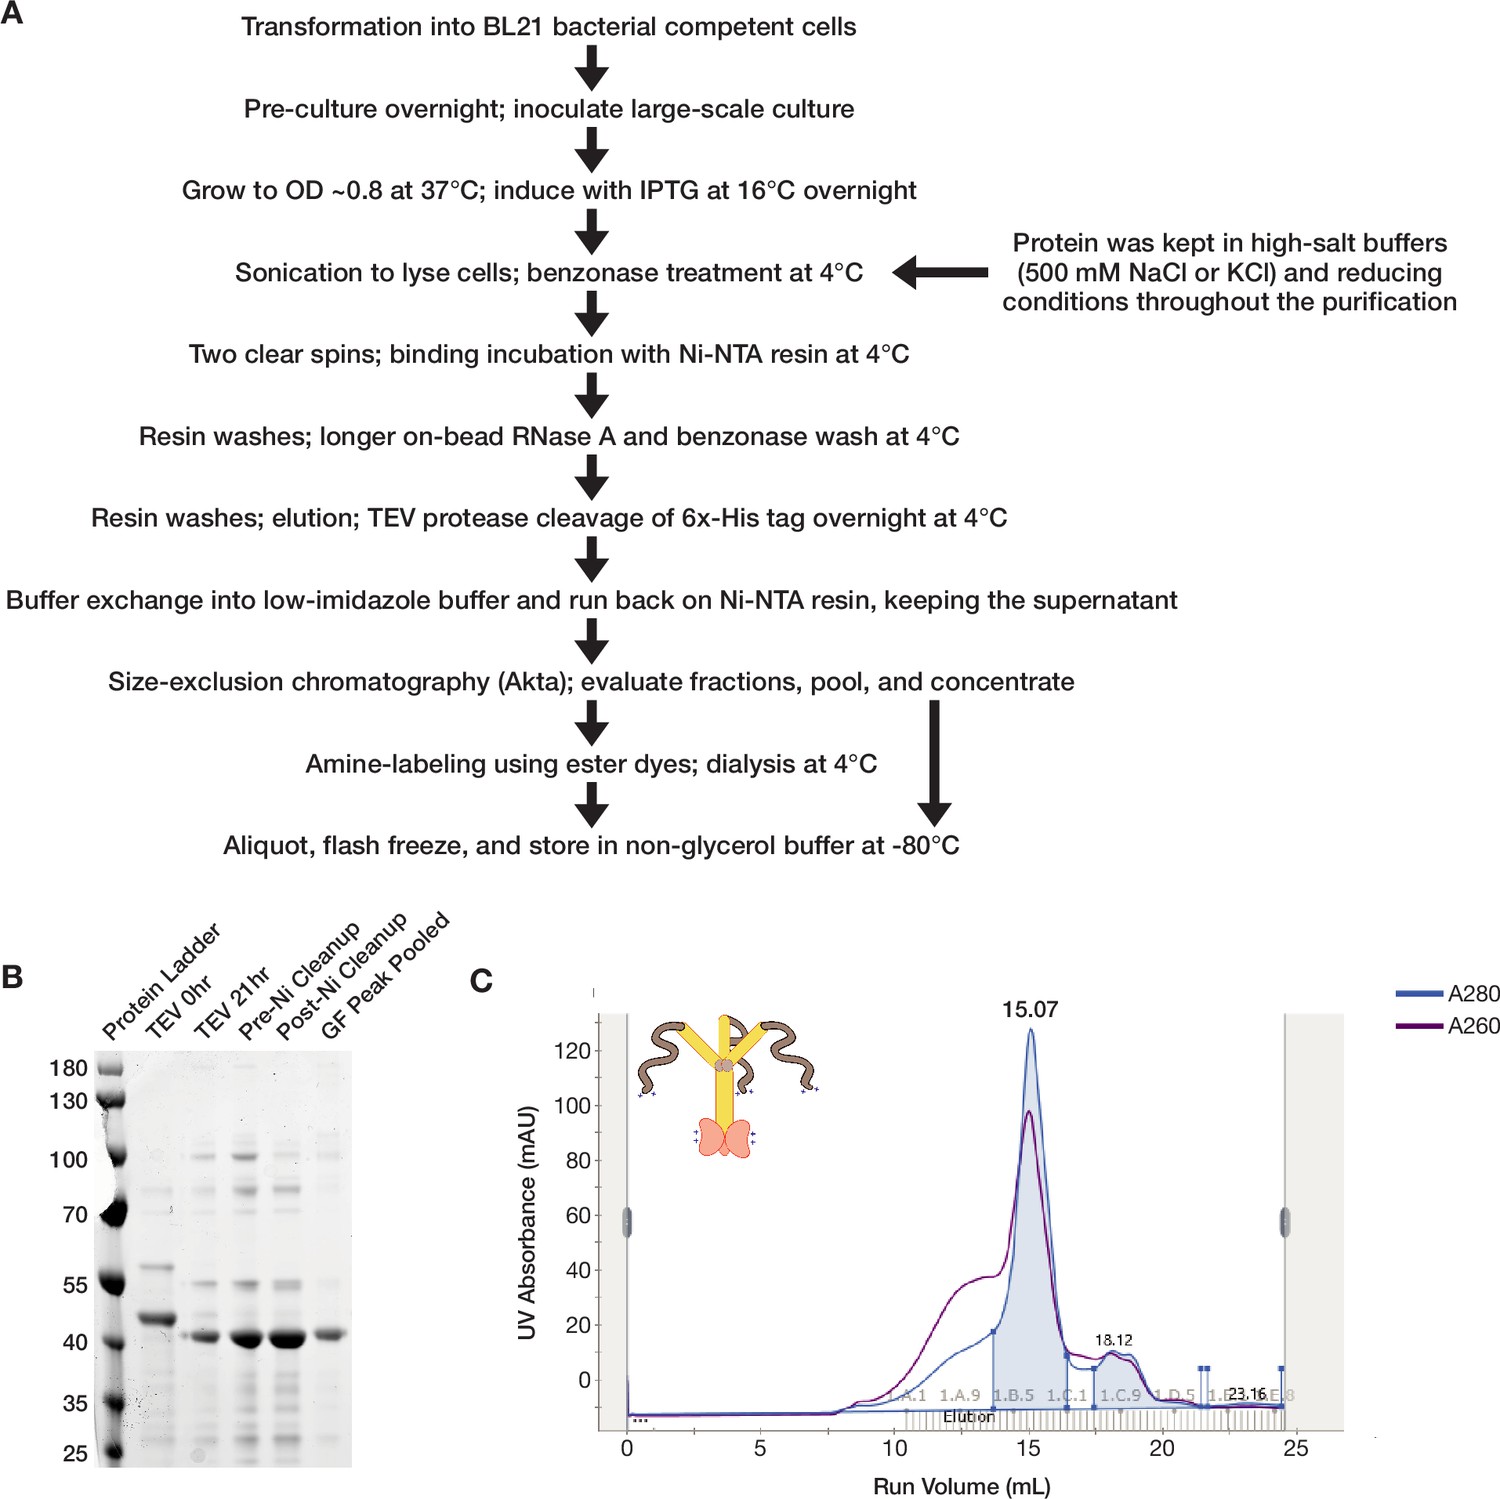
Full-length ORF1p purifies as a trimer from a bacterial expression system.
(A) A flowchart overview of the ORF1p purification protocol. A full purification protocol can be found in the Materials and methods. (B) Wild-type ORF1p can be purified with high purity from bacteria. A Coomassie-stained reducing SDS-PAGE gel shows purification intermediates from a purification of wild-type ORF1p. The gel filtration (GF) peak gel sample has a single dominant species at the expected monomer size of 40 kDa. (C) Wild-type ORF1p expressed in bacteria purifies as a trimer. A representative UV absorbance trace of a GF run for wild-type ORF1p. The trace shows a single dominant protein species that elutes around 15 mL, corresponding to a molecular weight of 150 kDa per the column specifications. The blue shaded area under the primary peak indicates the fractions that were pooled for use in in vitro experiments. The A260 signal (purple) shows that the protein peak has a A260/A280 ratio of about 0.8, indicating low nucleic acid carryover. A large shoulder of higher molecular weight products that have much more nucleic acid and less protein can also be observed.
Figure 2—figure supplement 2
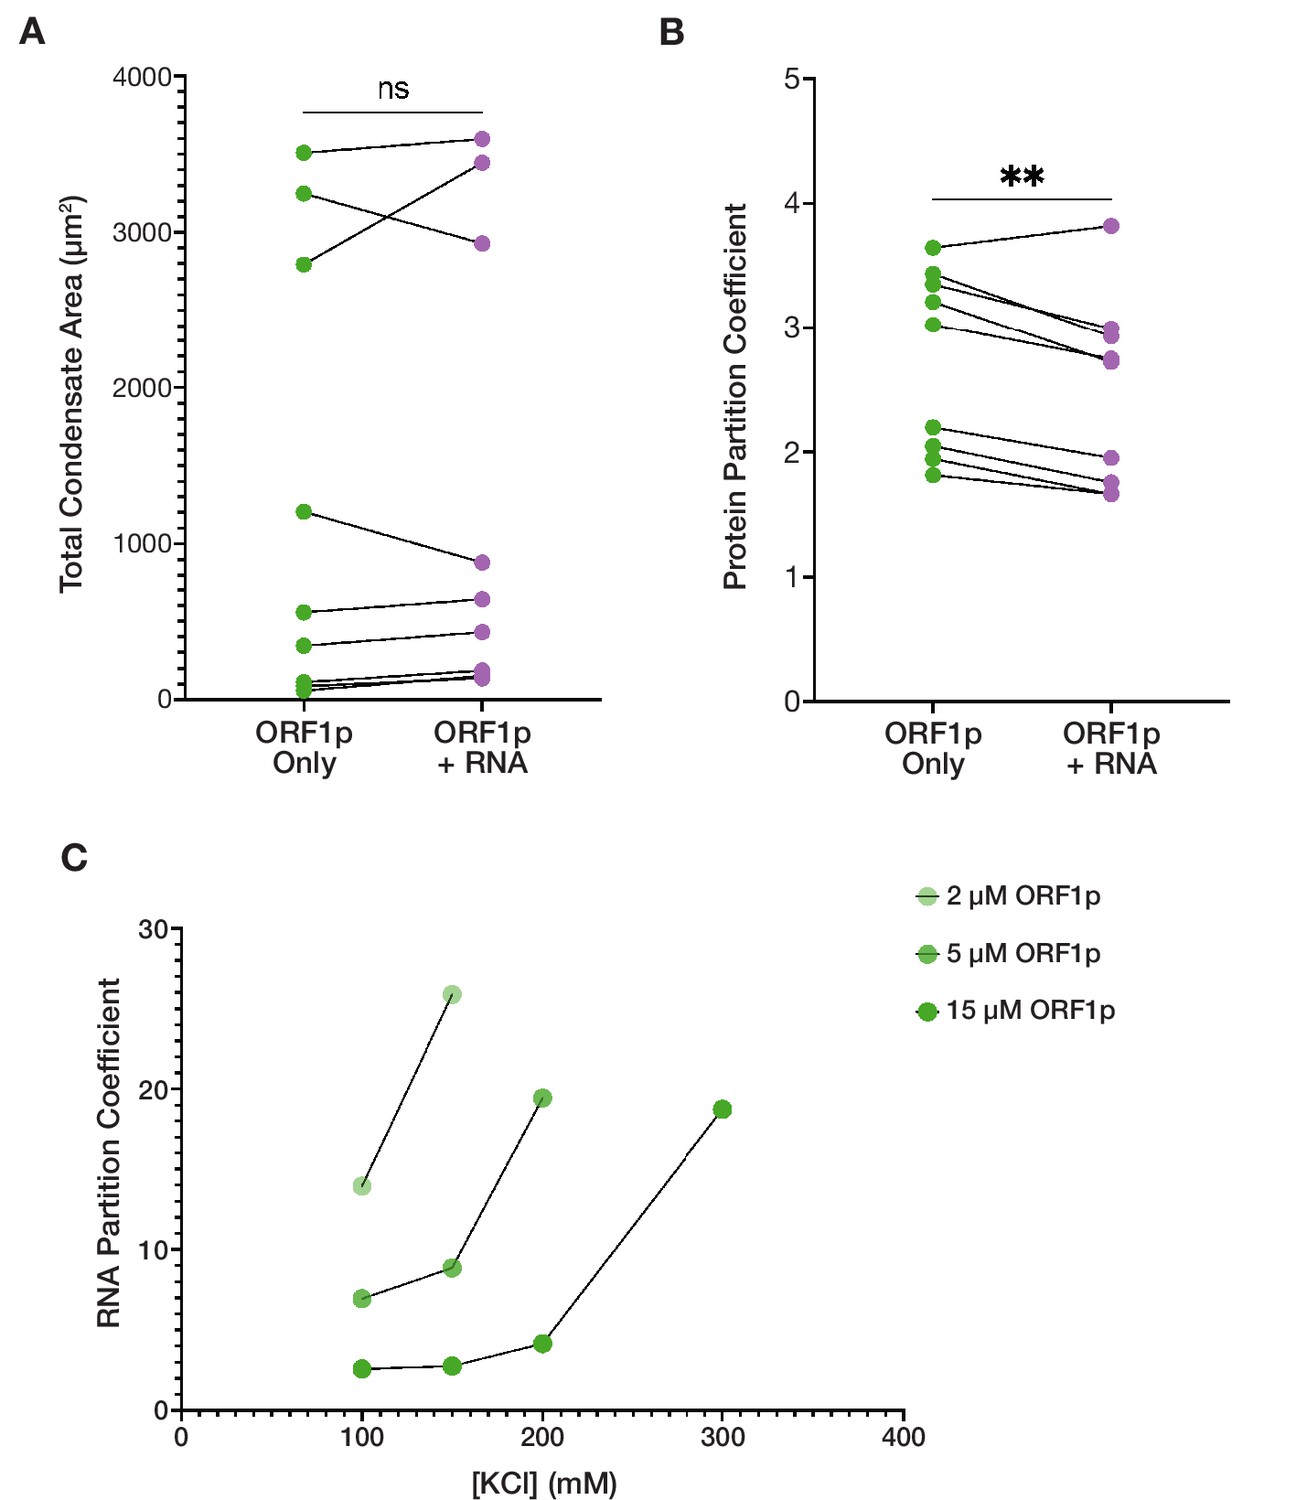
ORF1p-RNA co-condensation suggests competing forces for protein and RNA partitioning.
(A) Total condensate area of WT ORF1p does not significantly differ with the addition of RNA between matched conditions with ORF1p alone. Pairwise analysis of total condensed phase area reveals no significant difference with the addition of 3,000:1 2-kb L1 RNA in the matched conditions that resulted in condensate formation seen in Figure 2D. Each point represents the condensate area from a full field of view (FOV) of a single protein concentration-salt concentration condition. Lines connect the condensate area values from matched conditions with and without RNA addition. Statistical comparison was done using a paired two-tailed t test. ns = not significant. (B) ORF1p protein partition coefficient decreases with the addition of RNA compared to matched conditions with ORF1p alone in a pairwise analysis. As in (A), each point represents the partition coefficient from a single, full FOV of a single condition, and lines connect the values from matched conditions with and without RNA. Statistical comparison was done using a paired two-tailed t test. **p<0.01. (C) The RNA partition coefficient increases in conditions that are less conducive to protein condensation. Decreasing ORF1p concentration and increased salt concentration are associated with increased RNA partition coefficients. Each point represents the partition coefficient from a single, full FOV of a single condition, and lines connect the values from conditions with the same protein concentrations.
Figure 3 with 4 supplements

Mutations in key basic motifs attenuate droplet formation in vitro and abrogate condensation and retrotransposition in cells.
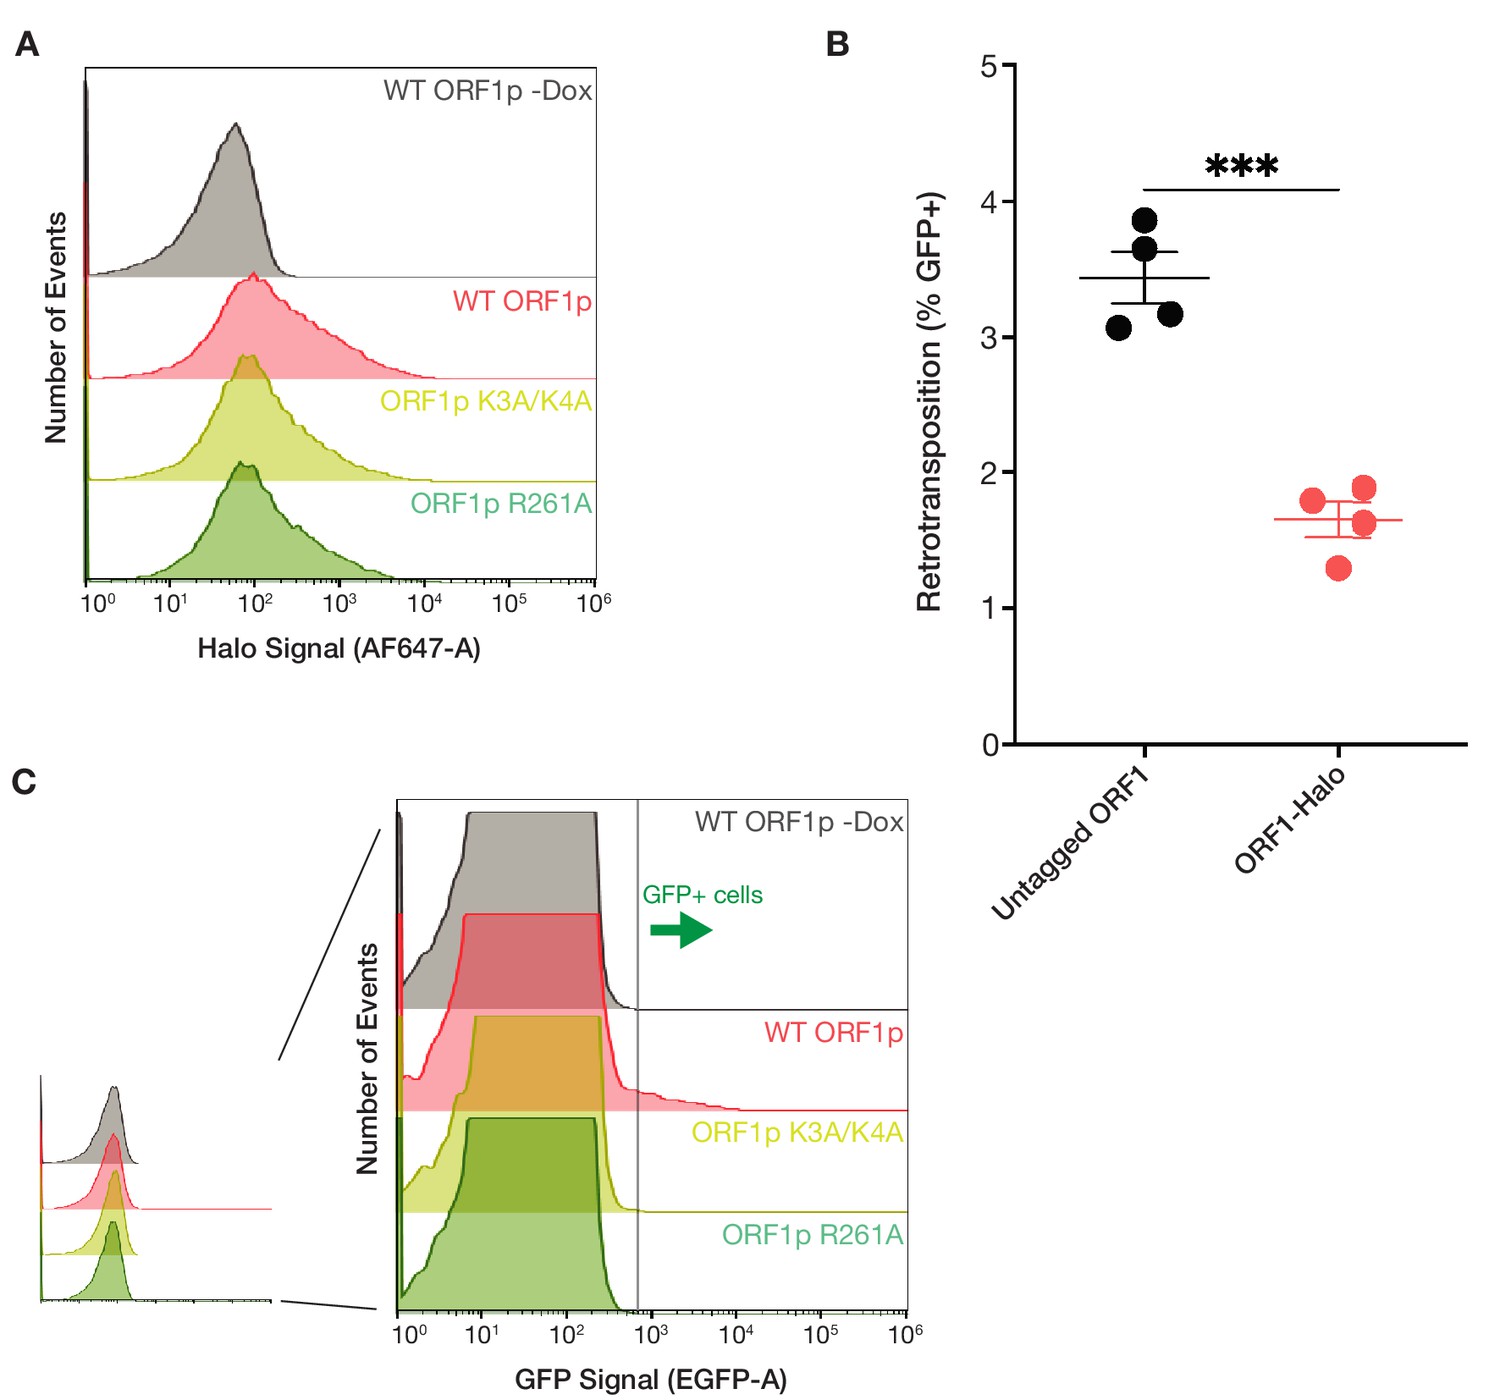
(A) ORF1p variants with mutations in basic motifs form condensed phases in vitro. Representative images of the condensed phases of WT, K3A/K4A, and R261A ORF1p. 15 µM protein and 150 mM KCl were used for all three images. Scale bar = 5 µm. (B) Basic motif mutants of ORF1p have decreased propensity to form condensates in conditions with high-salt concentration or low protein concentration compared to WT. A phase diagram of ORF1p condensation for WT, K3A/K4A, and R261A with and without the addition of 3,000:1 2-kb L1 RNA, as in Figure 2D. R261A generates an RNA-responsive condensed phase with much higher protein partition coefficients than WT or K3A/K4A. Hand-drawn phase boundaries separate conditions with appreciable condensation with those that do not. (C) RNA enhances R261A condensation but has minimal effect on WT and K3A/K4A. Representative images of WT, K3A/K4A, and R261A ORF1p with and without RNA (3,000:1). All condensates were generated with 5 µM protein and 100 mM KCl. Protein image LUTs are the same per mutant as in (A), and RNA LUTs are the same across mutants. Scale bar = 5 µm. (D) ORF1p R261A tends to have higher RNA partition coefficients than WT and K3A/K4A. A phase diagram showing RNA partition coefficients for WT, K3A/K4A, and R261A ORF1p with RNA (3,000:1). Hand-drawn phase boundaries are included as in (B). (E) WT ORF1p forms cellular puncta much more robustly than K3A/K4A or R261A. Representative maximum intensity Z projections of HeLa cells expressing WT, K3A/K4A, or R261A ORF1p after 6 hr of L1 expression. All images have the same lookup tables. Scale bar = 10 µm. (F) Quantification of the average number of ORF1p puncta per cell after 6 hr of expression of WT, K3A/K4A, or R261A ORF1p. Each point represents one biological replicate of induction and quantification and is the average of at least 75 cells. The mean and SEM of three biological replicates are shown, and statistical differences between mutants were calculated using a one-way ANOVA with Tukey’s multiple comparison correction. ****p<0.0001, ns = not significant. (G) WT L1 with ORF1-Halo undergoes retrotransposition at a cellular frequency of ~1%, while elements with ORF1 K3A/K4A and R261A have undetectable retrotransposition activity. Measured retrotransposition activity of WT, K3A/K4A, and R261A ORF1p after 72 hr of L1 expression. GFP+ cells were evaluated using FACS with a GFP+ threshold defined by WT cells without expression induction (WT -Dox). Each point is a biological replicate whose value is the average of three technical replicates, with 25,000 cells analyzed for each. The mean and SEM of three biological replicates are shown, and statistical differences between conditions were calculated using a one-way ANOVA with Tukey’s multiple comparison correction. ****p<0.0001, ns = not significant.
-
Figure 3—source data 1
WT, K3A/K4A, and R261A ORF1p cellular ORF1 puncta count data.
Data matrices from the three biological replicates of the puncta counting experiment with wild-type ORF1, ORF1 K3A/K4A, and ORF1 R261A after 6 hours of doxycycline-induced expression in HeLa cells; associated with Figure 3F.
- https://cdn.elifesciences.org/articles/82991/elife-82991-fig3-data1-v2.zip
-
Figure 3—source data 2
WT, K3A/K4A, and R261A L1 retrotransposition data.
FACS output data matrices from the three biological replicates of the 72 hr cellular retrotransposition assay with wild-type ORF1 with and without doxycycline induction, ORF1 K3A/K4A, and ORF1 R261A, all with the GFP-AI retrotransposition reporter in HeLa cells, each with three technical replicates; associated with Figure 3G.
- https://cdn.elifesciences.org/articles/82991/elife-82991-fig3-data2-v2.zip
Figure 3—figure supplement 1
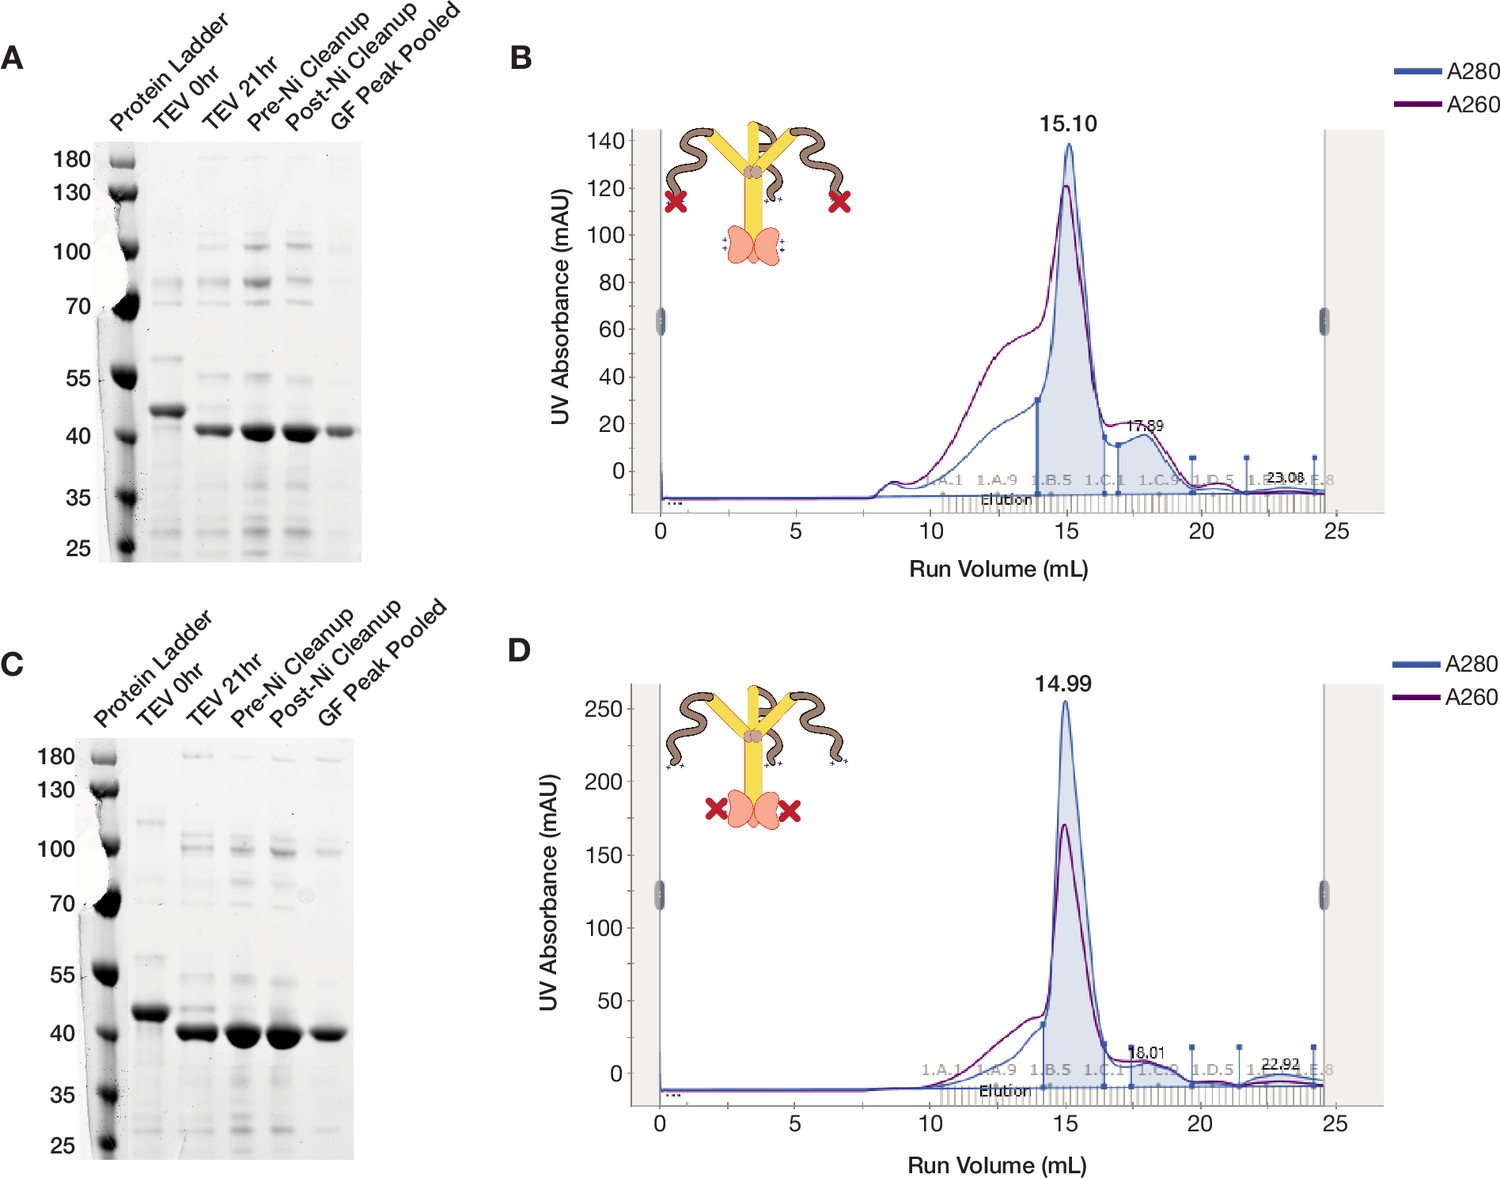
ORF1p K3A/K4A and R261A mutants purify as trimers.
(A and C) ORF1p K3A/K4A and R261A can be purified with high purity from bacteria. Coomassie-stained reducing SDS-PAGE gels showing purification intermediates from a purification of ORF1p K3A/K4A (A) and R261A (C), respectively. The gel filtration (GF) peak gel samples have a single dominant species at the expected size of 40 kDa. (B and D) ORF1p K3A/K4A and R261A expressed in bacteria purify as trimers. Representative UV absorbance traces of GF runs for ORF1p K3A/K4A (B) and R261A (D), respectively. The traces show a single dominant protein species that elutes around 15 mL, similar to WT. The blue shaded area under the primary peaks indicate the fractions that were pooled for use in in vitro experiments. The A260 signal (purple) shows that R261A has a much smaller shoulder of high-molecular-weight products with high nucleic acid carryover compared to WT or K3A/K4A, indicating that those species are driven by structured nucleic acid binding.
Figure 3—figure supplement 2
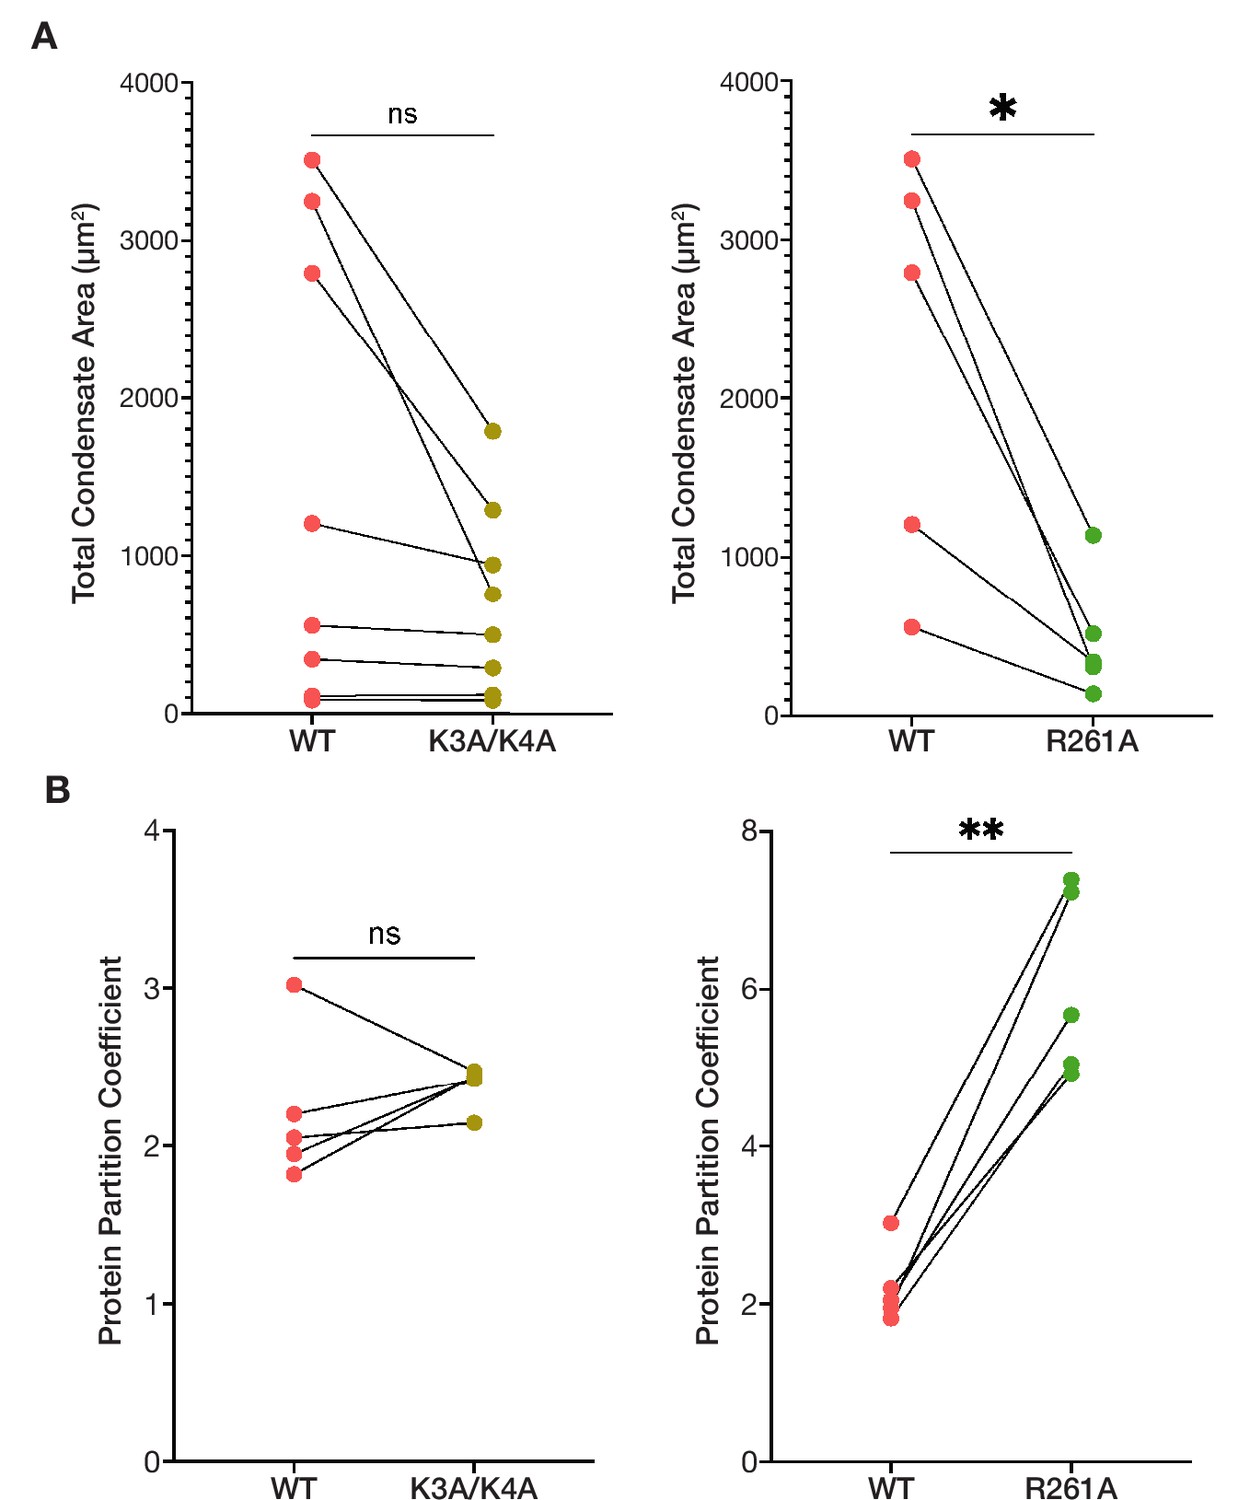
The condensed phases of ORF1p basic motif mutants are less extensive and have altered protein partitioning compared to wild-type.
(A) R261A has decreased total condensate area compared to WT across all conditions in which it formed condensates, while K3A/K4A tended to form less extensive condensed phases at high protein concentrations compared to WT. Pairwise analysis of total condensed phase area reveals a significant difference between WT and R261A across matched conditions that resulted in condensate formation, seen in Figure 3B (top). Each point represents the condensate area from a full FOV of a single condition. Lines connect the condensate area values of the ORF1p variants from matched conditions. Statistical comparison was done using a paired two-tailed t test. ns = not significant, *p<0.05. (B) R261A has increased protein partition coefficients compared to matched WT conditions in a pairwise analysis, while WT and K3A/K4A have similar protein partitioning. As in (A), each point represents the partition coefficient from a single, full FOV of a single condition, and lines connect the values for the ORF1p variants from matched conditions. Statistical comparison was done using a paired two-tailed t test. ns = not significant, **p<0.01.
Figure 3—figure supplement 3
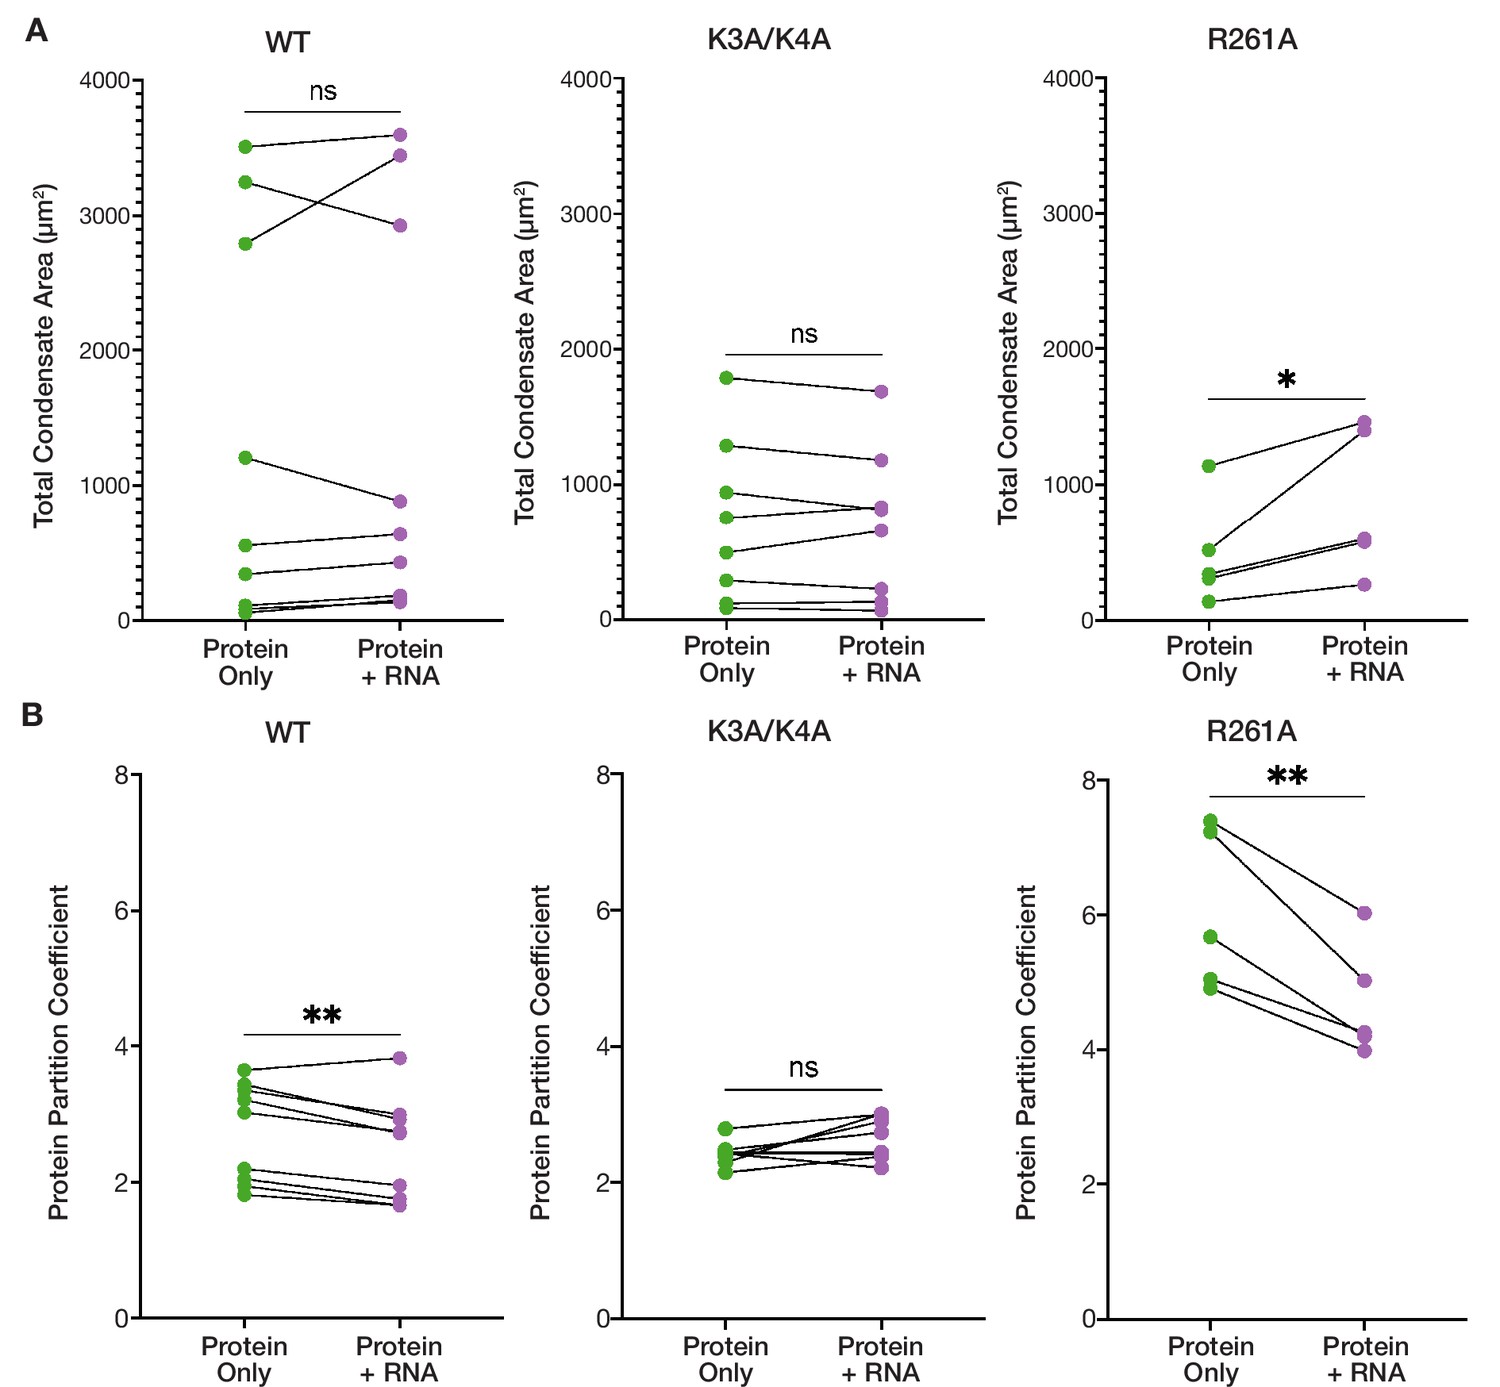
RNA addition has differential effects on the condensed phases of ORF1p basic motif mutants.
(A) R261A exhibits an increased total condensate area in the presence of RNA, while the WT and K3A/K4A condensed phases remain unchanged. Pairwise analysis of total condensed phase area reveals a significant increase for R261A with the addition of 3,000:1 2-kb L1 RNA in the matched conditions that resulted in condensate formation seen in Figure 3B. Each point represents the condensate area from a full FOV of a single protein concentration-salt concentration condition. Lines connect the condensate area values from matched conditions with and without RNA addition. Statistical comparison was done using a paired two-tailed t test. ns = not significant, *p<0.05. (B) K3A/K4A protein partitioning into condensates is unaffected by RNA, while WT and R261A exhibit decreased protein partitioning with RNA addition in pairwise analyses. As in (A) each point represents the partition coefficient from a single, full FOV of a single condition, and lines connect the values from matched conditions with and without RNA. Statistical comparison was done using a paired two-tailed t test. ns = not significant, **p<0.01.
Figure 3—figure supplement 4
ORF1p basic mutants are expressed at similar levels to WT but have no retrotransposition activity.
(A) Cellular ORF1p expression levels are comparable across the basic motif variants following expression induction. FACS analysis of Halo signal from HeLa cells expressing WT, K3A/K4A, or R261A ORF1p for 6 hr, compared to WT ORF1p cells that did not undergo expression induction (WT ORF1p -Dox). A total of 50,000 cells were analyzed per condition. (B) L1 with ORF1-Halo has readily detectable retrotransposition activity, with 50% of the activity of the untagged element. Measured retrotransposition activity of L1 with untagged and Halo-tagged ORF1p after 72 hr of L1 expression. Each point is a technical replicate with at least 5,000 cells analyzed for each. The mean and SEM of four technical replicates are shown, and statistical differences between conditions were calculated using an unpaired two-tailed t test. ***p<0.001. (C) GFP+ cells from the GFP-AI retrotransposition reporter are detectable by FACS. Representative retrotransposition assay replicates from each condition are shown, demonstrating the clear detection of GFP+ cells in the induced WT ORF1p population but not in the other conditions.
Figure 4 with 5 supplements
Stammer disruption of the ORF1p coiled coil is essential for L1 condensation in cells and modulates the physical properties of the ORF1p condensed phase.
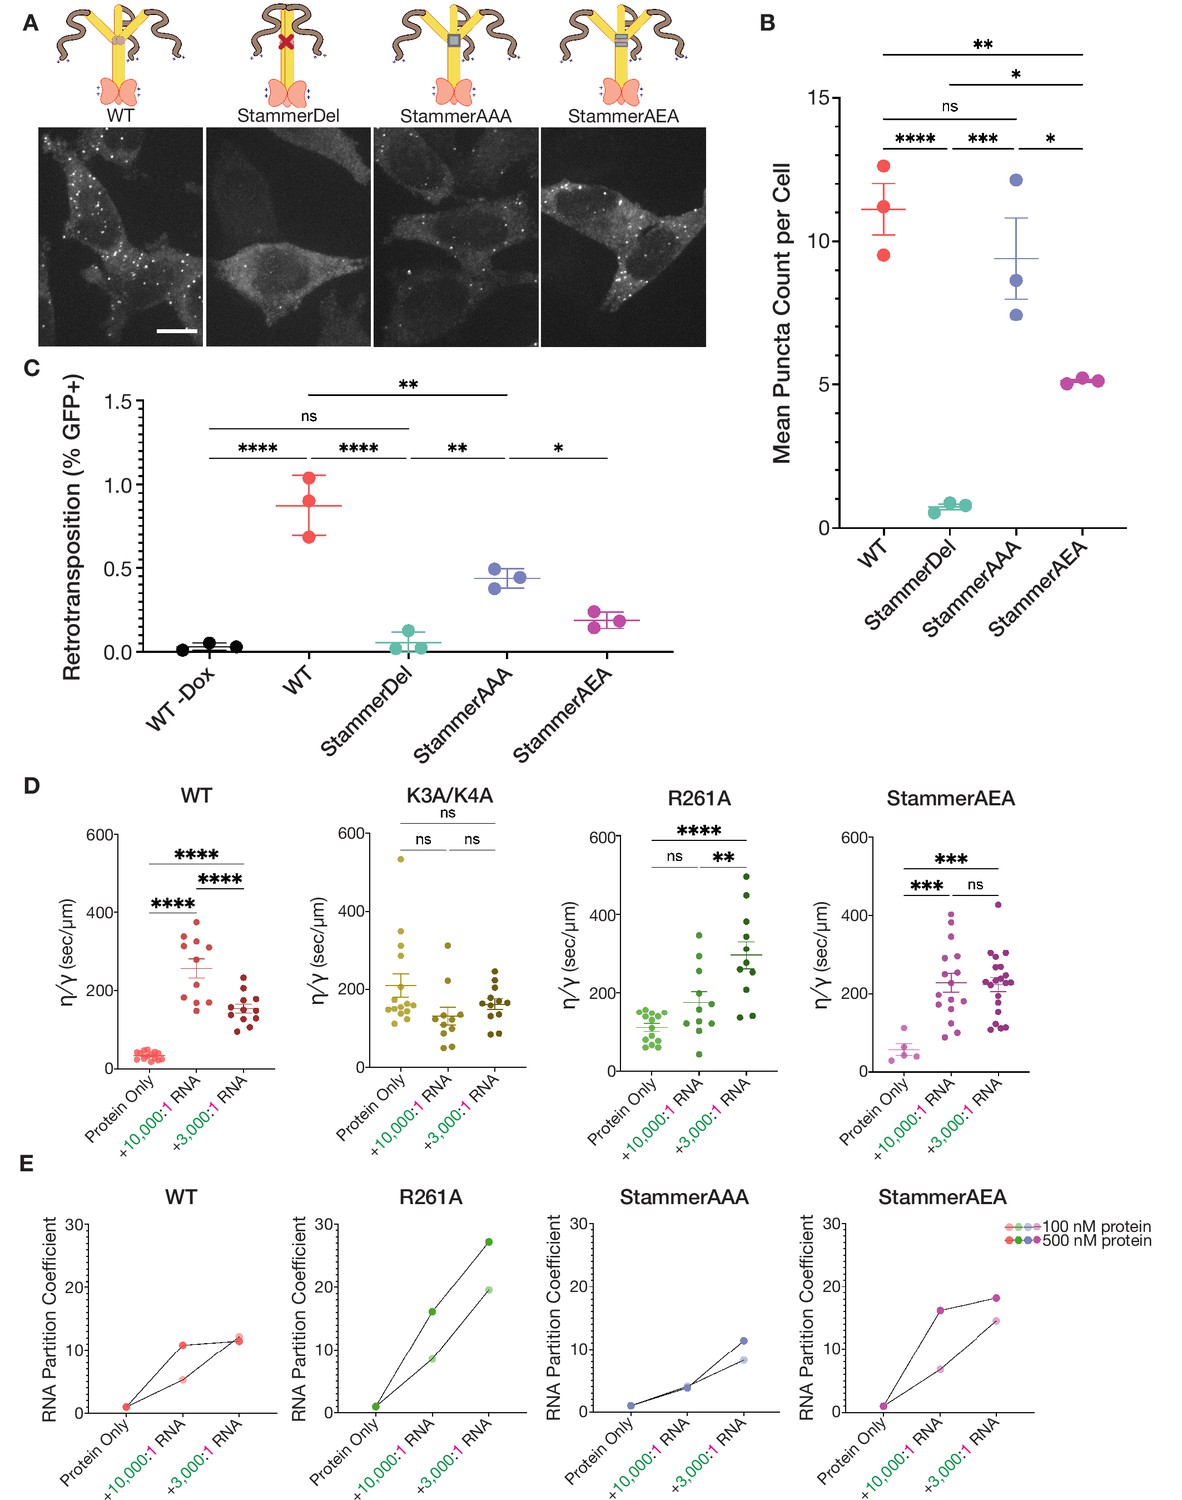
(A) Deletion of the stammer starkly decreases cellular ORF1p puncta formation, while stammer reconstitution rescues condensation. Representative maximum intensity Z projections of HeLa cells expressing WT, StammerDel, StammerAAA, or StammerAEA ORF1p after 6 hr of L1 expression. All images have the same lookup tables. Scale bar = 10 µm. ORF1p trimer cartoons displaying the corresponding mutations are shown, with hypothetical conformations based on the stammer’s proposed role in promoting an open coiled-coil state. (B) Stammer reconstitution can rescue ORF1p puncta formation to WT levels. Quantification of the average number of ORF1p puncta per cell after 6 hr of expression of WT, StammerDel, StammerAAA, or StammerAEA ORF1p. Each point represents one biological replicate of induction and quantification and is the average of at least 75 cells. The mean and SEM of three biological replicates are shown, and statistical differences between mutants were calculated using a one-way ANOVA with Tukey’s multiple comparison correction. *p<0.05, **p<0.01, ***p<0.001, ****p<0.0001, ns = not significant. (C) ORF1p stammer deletion abrogates retrotransposition, while stammer reconstitution rescues retrotransposition activity. Measured retrotransposition activity of WT, StammerDel, StammerAAA and StammerAEA ORF1p after 72 hr of L1 expression. GFP+ cells were evaluated using FACS as in Figure 3G. The mean and SEM of three biological replicates are shown, and statistical differences between conditions were calculated using a one-way ANOVA with Tukey’s multiple comparison correction. *p<0.05, **p<0.01, ****p<0.0001, ns = not significant. (D) WT ORF1p and StammerAEA exhibit similar non-monotonic changes in the inverse capillary velocity (η∕γ) of their condensed phases in response to increasing RNA concentrations. Inverse capillary velocity was calculated from individual droplet fusion events in each condition, with each point representing a single analyzed fusion event; see Materials and methods for details. Mean ± SEM is shown; 5 or more fusion events were analyzed per condition. Changes in inverse capillary velocity were assessed across RNA conditions for each mutant independently using a one-way ANOVA with Tukey’s multiple comparison correction. **p<0.01, ***p<0.001, ****p<0.0001, ns = not significant. (E) WT and stammer-mutant ORF1p exhibit attenuated RNA partitioning at nanomolar protein concentrations compared to R261A. R261A has increased RNA partition coefficients with both increased RNA stoichiometry and protein concentrations. Each point represents the RNA partition coefficient from a full FOV of a single condition. Lines connect the values that use the same protein concentration. 150 mM KCl was used for all conditions.
-
Figure 4—source data 1
StammerDel, StammerAAA, and StammerAEA cellular ORF1 puncta count data.
Data matrices from the three biological replicates of the puncta counting experiment with wild-type ORF1, ORF1 StammerDel, ORF1 StammerAAA, and ORF1 StammerAEA after 6 hr of doxycycline-induced expression in HeLa cells; associated with Figure 4B. WT ORF1 data is the same as in Figure 3—source data 1, as these samples were all run in parallel.
- https://cdn.elifesciences.org/articles/82991/elife-82991-fig4-data1-v2.zip
-
Figure 4—source data 2
StammerDel, StammerAAA, and StammerAEA L1 retrotransposition data.
FACS output data matrices from the three biological replicates of the 72 hr cellular retrotransposition assay with wild-type ORF1 with and without doxycycline induction, ORF1 StammerDel, ORF1 StammerAAA, and ORF1 StammerAEA, all with the GFP-AI retrotransposition reporter in HeLa cells, each with three technical replicates; associated with Figure 4C. WT ORF1 with and without doxycycline data is the same as in Figure 3—source data 2, as these samples were all run in parallel.
- https://cdn.elifesciences.org/articles/82991/elife-82991-fig4-data2-v2.zip
-
Figure 4—source data 3
ORF1p mutant in vitro droplet fusion data.
Quantification of individual fusion events of ORF1p K3A/K4A, R261A, StammerAEA, and StammerAAA condensates in vitro across RNA concentrations; associated with Figure 4D.
- https://cdn.elifesciences.org/articles/82991/elife-82991-fig4-data3-v2.zip
Figure 4—figure supplement 1
ORF1p stammer mutant proteins express at similar levels as WT but have variable retrotransposition rates.
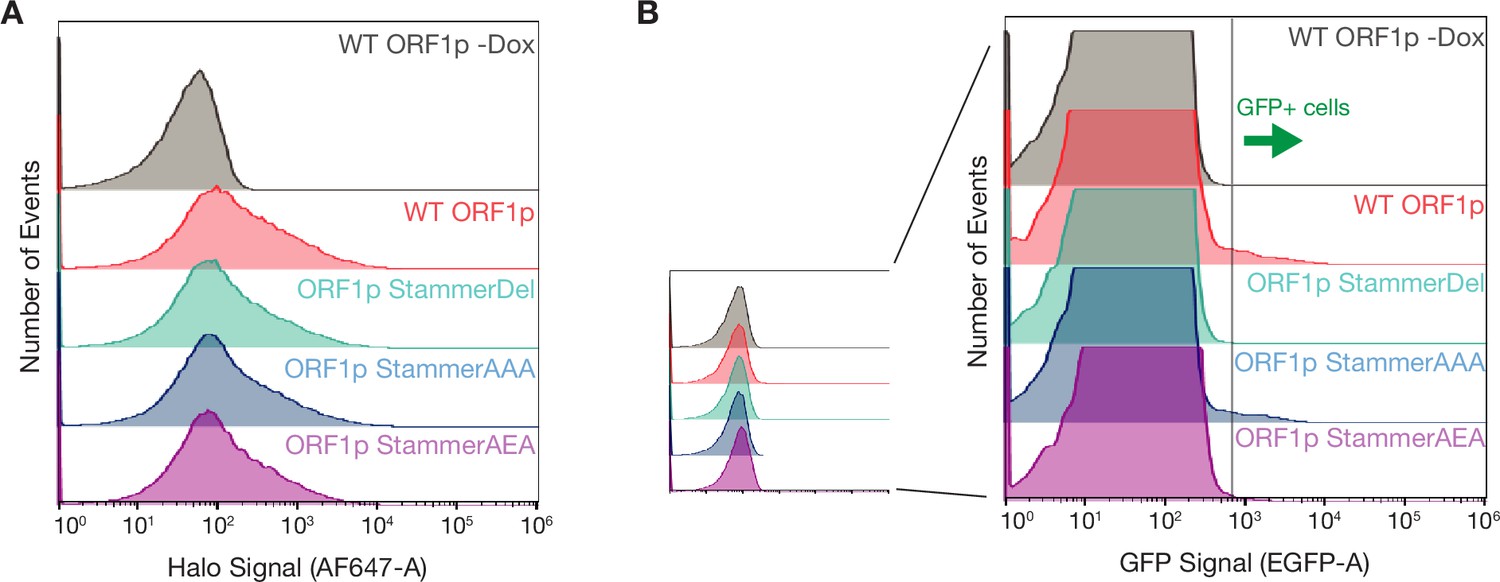
(A) Cellular ORF1p expression levels are comparable across the stammer variants following expression induction. FACS analysis of Halo signal from HeLa cells expressing WT, StammerDel, StammerAAA, or StammerAEA ORF1p for 6 hr, compared to WT ORF1p cells that did not undergo expression induction (WT ORF1p -Dox). A total of 50,000 cells were analyzed per condition. (B) GFP+ cells from the GFP-AI retrotransposition reporter are detectable by FACS. A representative retrotransposition assay replicate is shown, exemplifying the clear detection of GFP+ cells in the induced WT, StammerAAA, and StammerAEA populations.
Figure 4—figure supplement 2
ORF1p StammerAAA and StammerAEA purify as trimers.
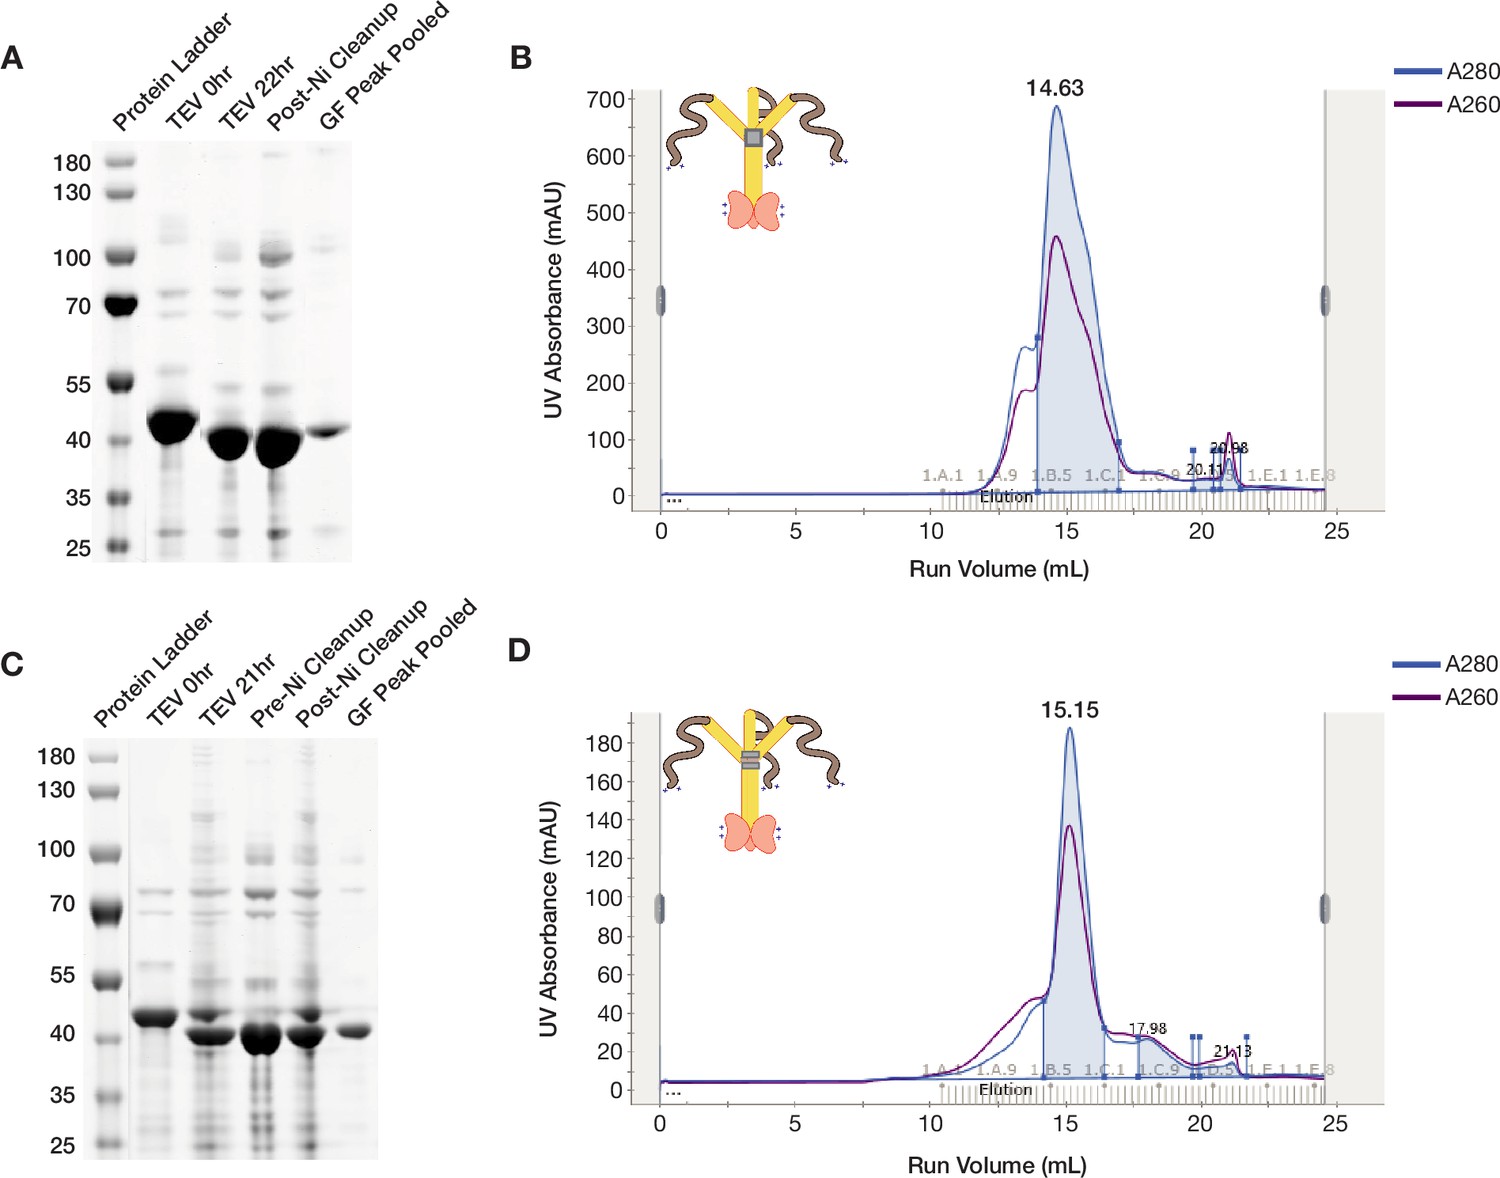
(A and C) ORF1p StammerAAA and StammerAEA can be purified with high purity from bacteria. Coomassie-stained reducing SDS-PAGE gels showing purification intermediates from a purification of ORF1p StammerAAA (A) and StammerAEA (C) respectively. The gel filtration (GF) peak gel samples have a single dominant species at the expected size of 40 kDa. (B and D) ORF1p StammerAAA and StammerAEA expressed in bacteria purify as trimers. Representative UV absorbance traces of GF runs for ORF1p StammerAAA (B) and StammerAEA (D), respectively. The traces show a single dominant protein species that elutes around 15 mL, similar to WT. The blue shaded area under the primary peaks indicate the fractions that were pooled for use in in vitro experiments. The A260 signal (purple) shows that both mutants have an A260/A280 of between 0.6 and 0.8, indicating low nucleic acid carryover.
Figure 4—figure supplement 3
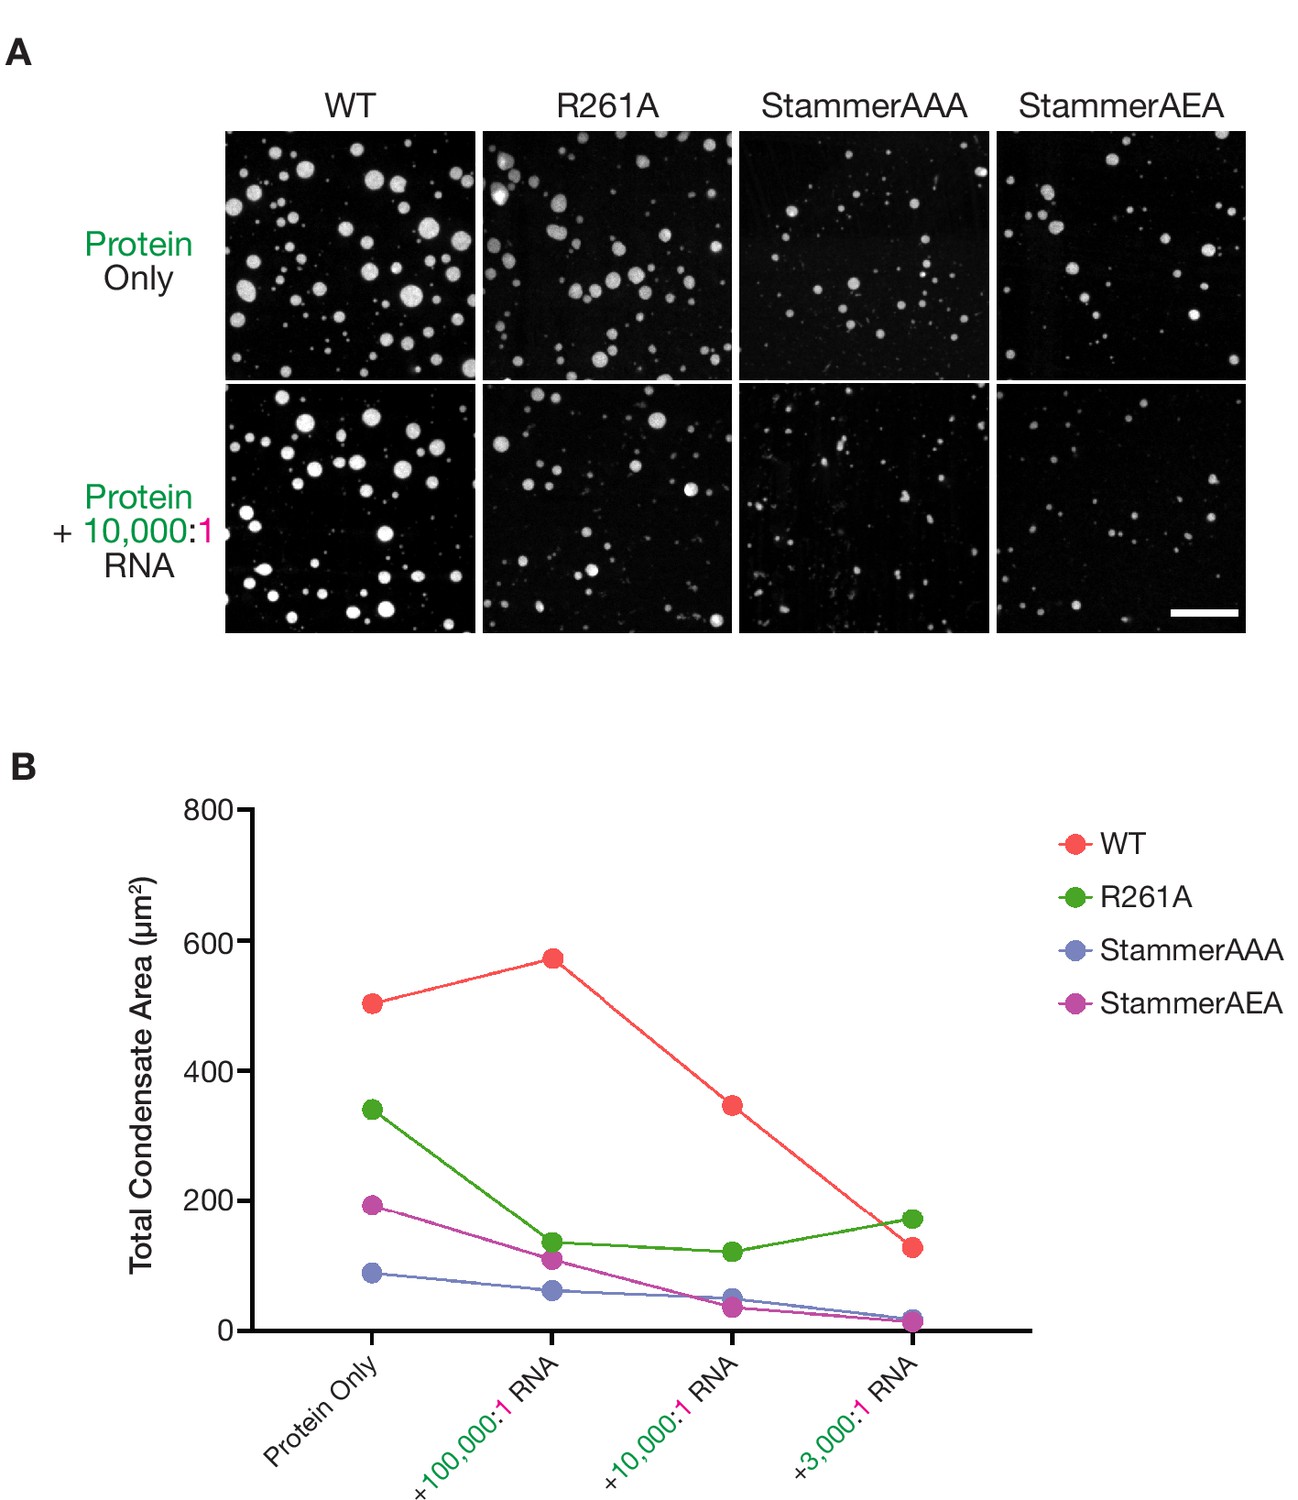
Stammer-mutant ORF1p variants form limited condensed phases in vitro.
(A) ORF1p with orthogonal stammer motifs form small condensates that decrease in area in response to RNA addition. Representative images of the ORF1p signal in the in vitro condensed phases of WT, R261A, StammerAAA, and StammerAEA with and without the addition of 10,000:1 RNA. 5 µM protein and 150 mM KCl was used in all conditions. Protein LUTs were the same with and without RNA for each ORF1p variant. Scale bar = 10 µm. (B) Total condensate areas for stammer mutants undergo further decreases in the presence of low stoichiometries of RNA. Each point represents the partition coefficient from a single, full FOV of a single condition, and lines connect the values for each ORF1p variant across RNA stoichiometries.
Figure 4—figure supplement 4
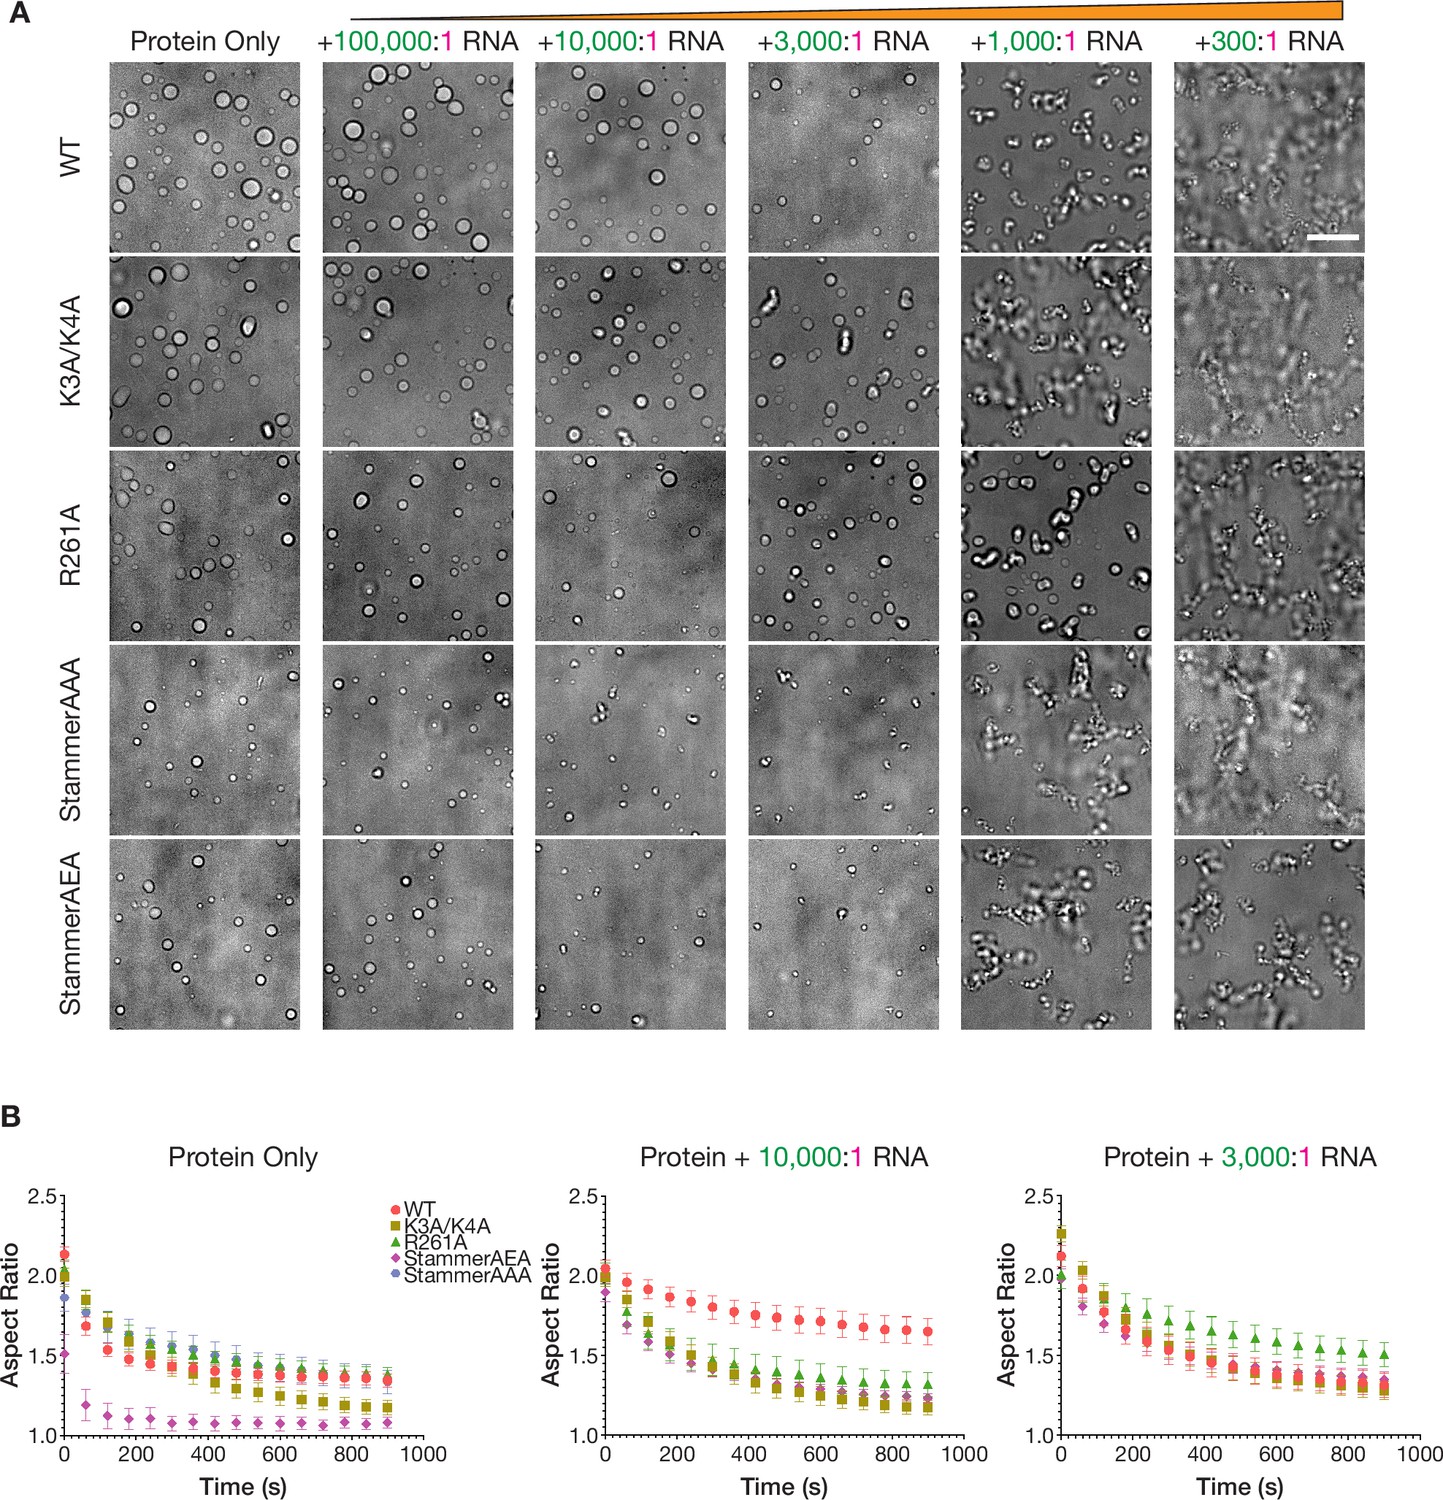
The physical properties of the condensed phases of ORF1p variants have differential responses to RNA.
(A) StammerAAA and StammerAEA form smaller, punctate condensates in response to low RNA stoichiometries. Representative brightfield images of ORF1p mutant droplet morphology over a wide range of RNA stoichiometries. 5 µM protein and 150 mM KCl was used in all conditions. WT images are the same as in Figure 2B. Scale bar = 10 µm. (B) Fusion analysis of WT and mutant ORF1p droplets across RNA stoichiometries reveals differential fusion kinetics. Average aspect ratios across fusion events in each RNA condition are plotted (mean ± SEM) over time for 15 minutes. 5 or more fusions were analyzed per condition. 10 µM protein and 150 mM KCl were used in all conditions.
Figure 4—figure supplement 5
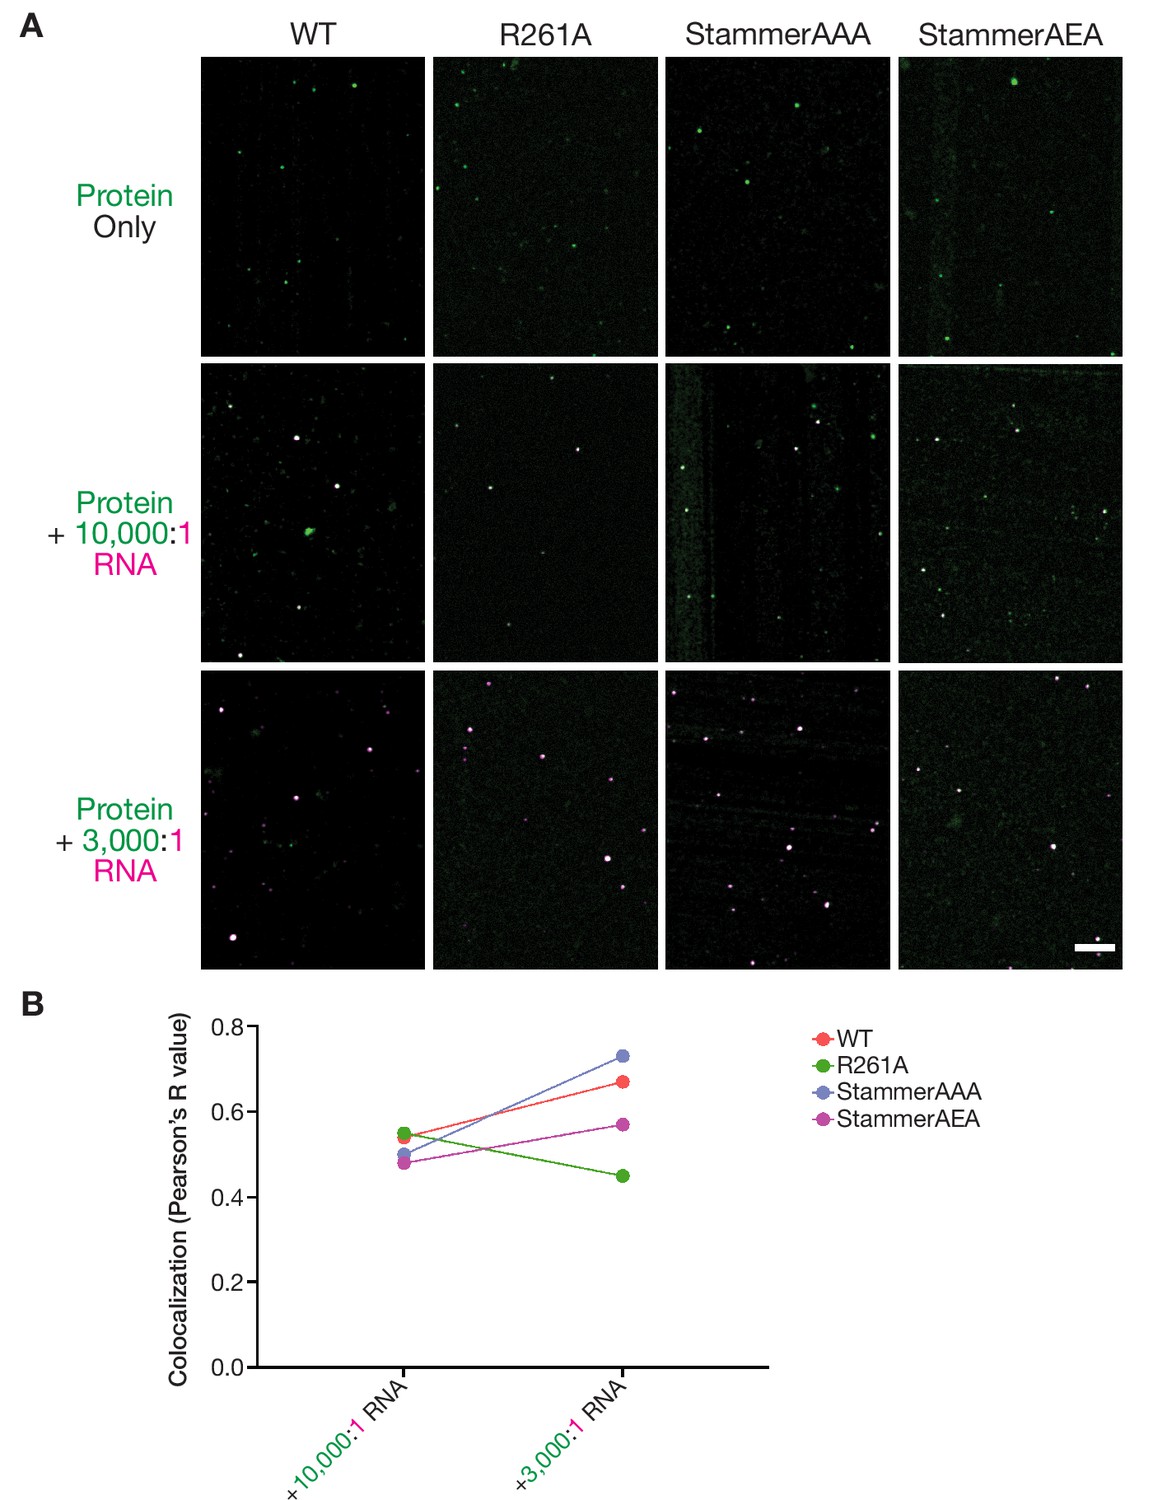
Nanomolar ORF1p concentrations allow for punctate assembly formation in vitro in the presence and absence of RNA.
(A) Representative merged images of ORF1p variants without RNA and in the presence of 10,000:1 and 3,000:1 RNA stoichiometries. 100 nM protein and 150 mM KCl was used in all images. All of the images use the same RNA LUTs, and the protein LUTs are fixed for each variant across RNA conditions. Scale bar = 5 µm. (B) Labeled RNA strongly colocalizes with ORF1p variants at nanomolar protein concentrations. Analysis of colocalization between the ORF1 protein signal and labeled RNA was performed across ORF1p variants and RNA stoichiometries. Each dot represents a single analyzed FOV with a line demonstrating the change in colocalization between RNA conditions for each protein variant.
Videos
Video 1
ORF1 puncta diffuse more freely in the cytoplasm of HeLa cells than in the nucleus.
A representative real-time confocal microscopy movie of ORF1-Halo puncta diffusing in the cytoplasm and nuclei of HeLa cells after 6 hr of L1 expression (left), with a corresponding confocal image of nuclear staining with SiR-DNA (right). Scale bars = 10 µm.
Video 2
Co-expressed ORF1 puncta exhibit minimal mixing in live HeLa cells.
A representative movie of a HeLa cell co-expressing two L1s with ORF1 tagged with either HaloTag or mNeonGreen2 (mNG2) for 4 hr. Confocal images in each channel were acquired every 5 s for 1 min. Scale bar = 10 µm.
Video 3
ORF1p droplets exhibit slower fusion kinetics in the presence of RNA.
Movies of ORF1p condensates settling out of solution and coalescing in the presence of varying amounts of RNA (from left to right: no RNA, +10,000:1 RNA, +3,000:1 RNA, and +1,000:1 RNA). 10 µM protein and 150 mM KCl were used in all conditions. Confocal images were acquired every minute for 2 hr. Scale bars = 5 µm.
Video 4
Mutant ORF1p condensates exhibit differential changes in condensed phase material properties with the addition of RNA.
Movies of ORF1p condensates settling out of solution and coalescing either without RNA (top) or in the presence of 10,000:1 RNA (bottom). All ORF1p variants (from left to right: WT, K3A/K4A, R261A, StammerAEA and StammerAAA) were assayed with 10 µM protein and 150 mM KCl. Confocal images were acquired every minute for 2 hr. Scale bars = 5 µm.
Tables
Key resources table
| Reagent type (species) or resource | Designation | Source or reference | Identifiers | Additional information |
|---|---|---|---|---|
| Gene (human) | LINE-1 retinitis pigmentosa (L1RP; LINE-1; L1) | 10.1093/hmg/8.8.1557; 10.1016 /j.cell.2013.10.021; 10.7554/eLife.30094 | ||
| Gene (synthetic) | HaloTag | Promega | G7711 | |
| Gene (synthetic) | EGFP antisense intron retrotransposition reporter (GFP-AI) | 10.1093/nar/28.6.1418 | ||
| Gene (synthetic) | mNeonGreen2 (mNG2) | 10.1038 /s41467-017-00494-8 | ||
| Strain, strain background (Escherichia coli) | BL21(DE3) | Sigma-Aldrich | 69450 | Used for recombinant protein expression |
| Strain, strain background (Escherichia coli) | DH10B | Thermo Fisher Scientific | EC0113 | Used for molecular cloning |
| Cell line (human) | HeLa rtTA2S-M2 (HeLa M2) | 10.1093/nar/gkp108; 10.1016 /j.jmb.2006.10.009; 10.7554/eLife.30058 | RRID:CVCL_WN71 | Cells were routinely tested for mycoplasma and were negative. |
| Recombinant DNA reagent | L1 reporter construct with wild-type ORF1 (pLH2035; plasmid) | This paper | L1 reporter construct with wild-type ORF1-GGGGS-HaloTag and GFP-AI engineered into the L1RP sequence driven by a Tet-On promoter on a pCEP-puro episomal plasmid backb one | |
| Recombinant DNA reagent | L1 reporter construct with wild-type ORF1 tagged with mNeonGreen2 (pLH2060; plasmid) | This paper | L1 reporter construct with wild-type ORF1- GGGGS-mNeonGreen2 engineered into the L1RP sequence driven by a Tet- On promoter on a pCEP-puro episomal plasmid backbone | |
| Recombinant DNA reagent | L1 reporter construct with ORF1 K3A/K4A (pLH2042; plasmid) | This paper | pLH2035 with ORF1 mutations K3A and K4A | |
| Recombinant DNA reagent | L1 reporter construct with ORF1 R261A (pLH2043; plasmid) | This paper | pLH2035 with ORF1 mutation R261A | |
| Recombinant DNA reagent | L1 reporter construct with ORF1 StammerDel (pLH2040; plasmid) | This paper | pLH2035 with deletion of residues M91, E92, and L93 in ORF1 | |
| Recombinant DNA reagent | L1 reporter construct with ORF1 StammerAAA (pLH2041; plasmid) | This paper | pLH2035 with ORF1 mutations M91A, E92A, and L93A | |
| Recombinant DNA reagent | L1 reporter construct with ORF1 StammerAEA (pLH2046; plasmid) | This paper | pLH2035 with ORF1 mutations M91A and L93A | |
| Recombinant DNA reagent | Human ORF1p purification construct (pMT538; plasmid) | 10.1002/art.41054; 10.1016 /j.cell.2013.10.021 | Full length synthetic human ORF1p from ORFeusHS with an N-terminal HIS6-TEV sequence in a pETM11 backbone such that cleavage leaves only an N-glycine scar | |
| Recombinant DNA reagent | Human ORF1p K3A/K4A purification construct (pLH2075; plasmid) | This paper | pMT538 with ORF1p mutations K3A and K4A | |
| Recombinant DNA reagent | Human ORF1p R261A purification construct (pLH2076; plasmid) | This paper | pMT538 with ORF1p mutation R261A | |
| Recombinant DNA reagent | Human ORF1p StammerAAA purification construct (pLH2037; plasmid) | This paper | pMT538 with ORF1 mutations M91A, E92A, and L93A | |
| Recombinant DNA reagent | Human ORF1p StammerAEA purification construct (pLH2077; plasmid) | This paper | pMT538 with ORF1 mutations M91A and L93A | |
| Sequence-based reagent | T7_L1RP_F (oSS0133; forward primer for the amplicon used to generate IVT 2-kb L1 RNA) | This paper | PCR primers | TAATACGACTCACTATAGGGGCCGCTCTAGCCCTGGAAT |
| Sequence-based reagent | L1RP_R (oSS0121; reverse primer for the amplicon used to generate IVT 2-kb L1 RNA) | This paper | PCR primers | TGATTTTGCAGCGGCTGGTACCGGTTGTTCCTTTCCATGTTTAGCGCT |
| Commercial assay or kit | HaloTag Ligand JF549 | Promega | GA1111 | |
| Commercial assay or kit | HaloTag Ligand JF646 | Promega | GA1121 | |
| Commercial assay or kit | SiR-DNA | Cytoskeleton | CY-SC007 | |
| Chemical compound, drug | Hoechst 33342 | Thermo Fisher Scientific | 62249 | |
| Software, algorithm | NIS-Elements | Nikon | ||
| Software, algorithm | FlowJo | BD Biosciences | ||
| Software, algorithm | FIJI | 10.1038/nmeth.2019 | ||
| Software, algorithm | Prism 9 | GraphPad | ||
| Software, algorithm | RStudio | Posit |
Additional files
Download links
A two-part list of links to download the article, or parts of the article, in various formats.
Downloads (link to download the article as PDF)
Open citations (links to open the citations from this article in various online reference manager services)
Cite this article (links to download the citations from this article in formats compatible with various reference manager tools)
Condensation of LINE-1 is critical for retrotransposition
eLife 12:e82991.
https://doi.org/10.7554/eLife.82991


