Succinate mediates inflammation-induced adrenocortical dysfunction
- Institute of Clinical Chemistry and Laboratory Medicine, University Hospital, Technische Universität Dresden, Germany
- Center of Neurogenomics and Cognitive Research (CNCR), Department of Molecular and 10 Cellular Neurobiology, Vrije Universiteit, Netherlands
- Research Unit Analytical Pathology, German Research Center for Environmental Health, Helmholtz Zentrum München, Germany
- Department of Clinical Chemistry, Medical School, University of Crete, Greece
- Department of Medicine III & Center for Healthy Ageing, Technische Universität Dresden, Germany
- Center for Regenerative Therapies, TU Dresden, Technische Universität Dresden, Germany
- DRESDEN-concept Genome Center, Center for Molecular and Cellular Bioengineering, Technische Universität Dresden, Germany
Figures
Figure 1 with 2 supplements
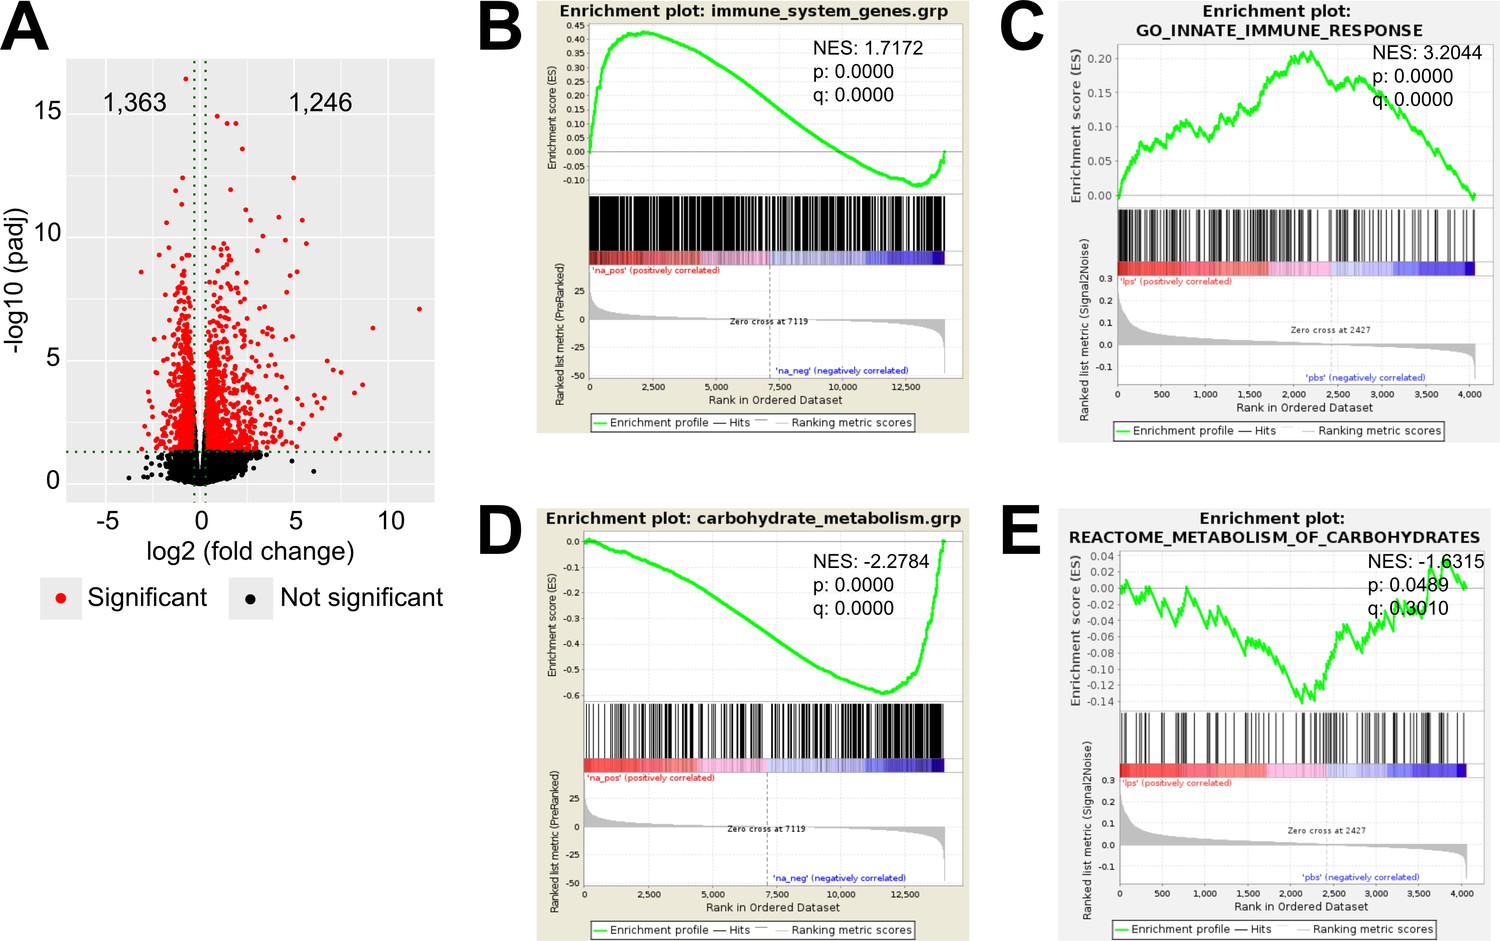
LPS-induced inflammation changes the transcriptional and proteomic profile of the adrenal cortex.
(A) Volcano plot showing differentially expressed genes in the microdissected adrenal gland cortex of mice treated for 6 hr with PBS or LPS. (B) Gene set enrichment analysis (GSEA) for immune pathways in the adrenal cortex of LPS versus PBS mice. (C) GSEA for proteins associated with the innate immune response in CD31-CD45- adrenocortical cells of mice treated for 24 hr with PBS or LPS. (D) RNA-Seq-based GSEA for carbohydrate metabolism in the adrenal cortex of LPS versus PBS mice. (E) GSEA for proteins associated with carbohydrate metabolism in CD31-CD45- adrenocortical cells of LPS versus PBS mice. NES: normalized enrichment score. (A,B,D) n=3 mice per group, (C,E) n=6 mice per group, padj <0.05 was used as a cut-off for significance.
-
Figure 1—source data 1
LPS-induced inflammation changes the transcriptional and proteomic profile of the adrenal cortex.
- https://cdn.elifesciences.org/articles/83064/elife-83064-fig1-data1-v2.zip
Figure 1—figure supplement 1
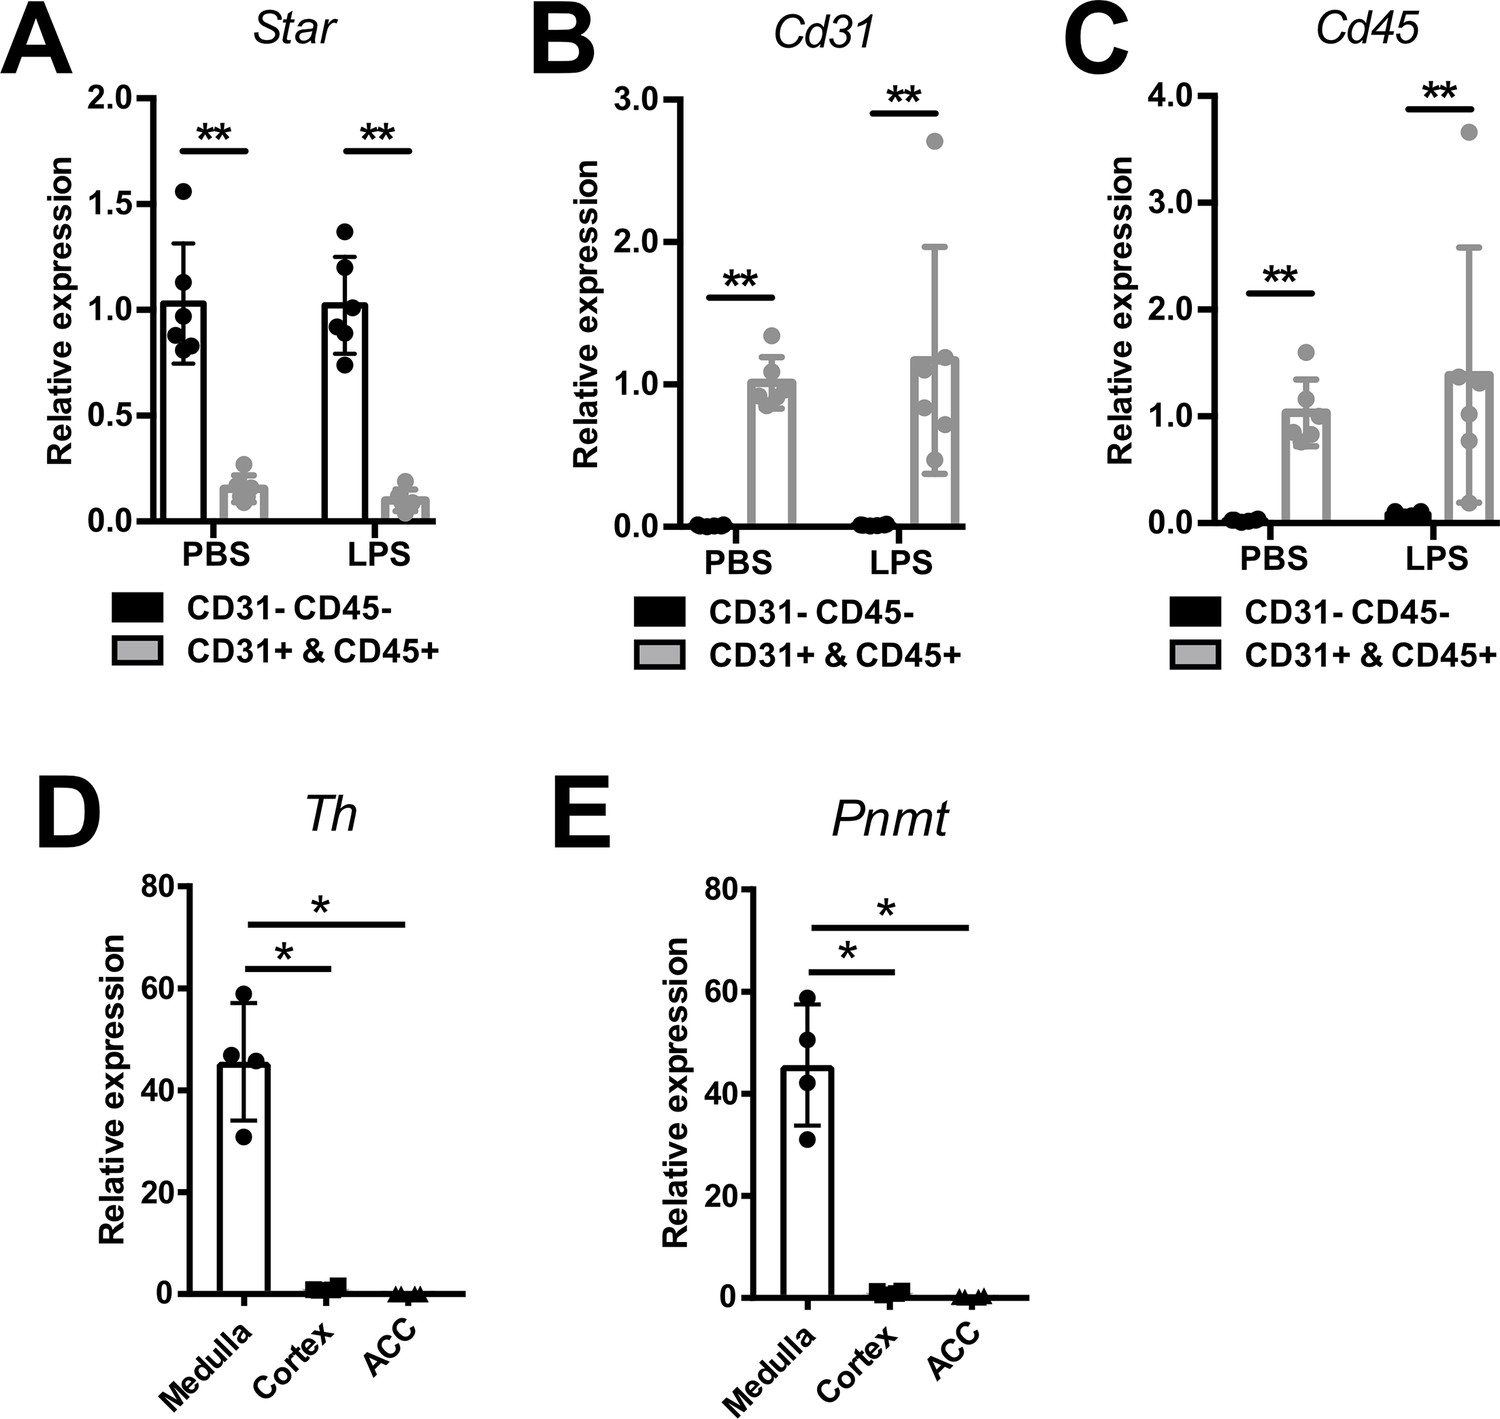
Efficiency of CD31-CD45-, immune (CD45+), and endothelial (CD31+) cell sorting.
mRNA expression of Star (A), Cd31 (B), and Cd45 (C) in sorted CD31-CD45-, CD45+, and CD31+ cell populations from adrenal glands of mice 6 hr post-injection of PBS or LPS (n=6 mice per group). mRNA expression of tyrosine hydroxylase (Th) (D) and phenylethanolamine N-methyltransferase (Pnmt) (E) in medulla, cortex, and CD31-CD45- cells (ACC) (n=4 mice per group). Data are presented as mean ± s.d. Statistical analysis was done with two-tailed Mann-Whitney U-test. *p<0.05, **p<0.01.
-
Figure 1—figure supplement 1—source data 1
Efficiency of CD31-CD45-, immune (CD45+), and endothelial (CD31+) cell sorting.
- https://cdn.elifesciences.org/articles/83064/elife-83064-fig1-figsupp1-data1-v2.zip
Figure 1—figure supplement 2
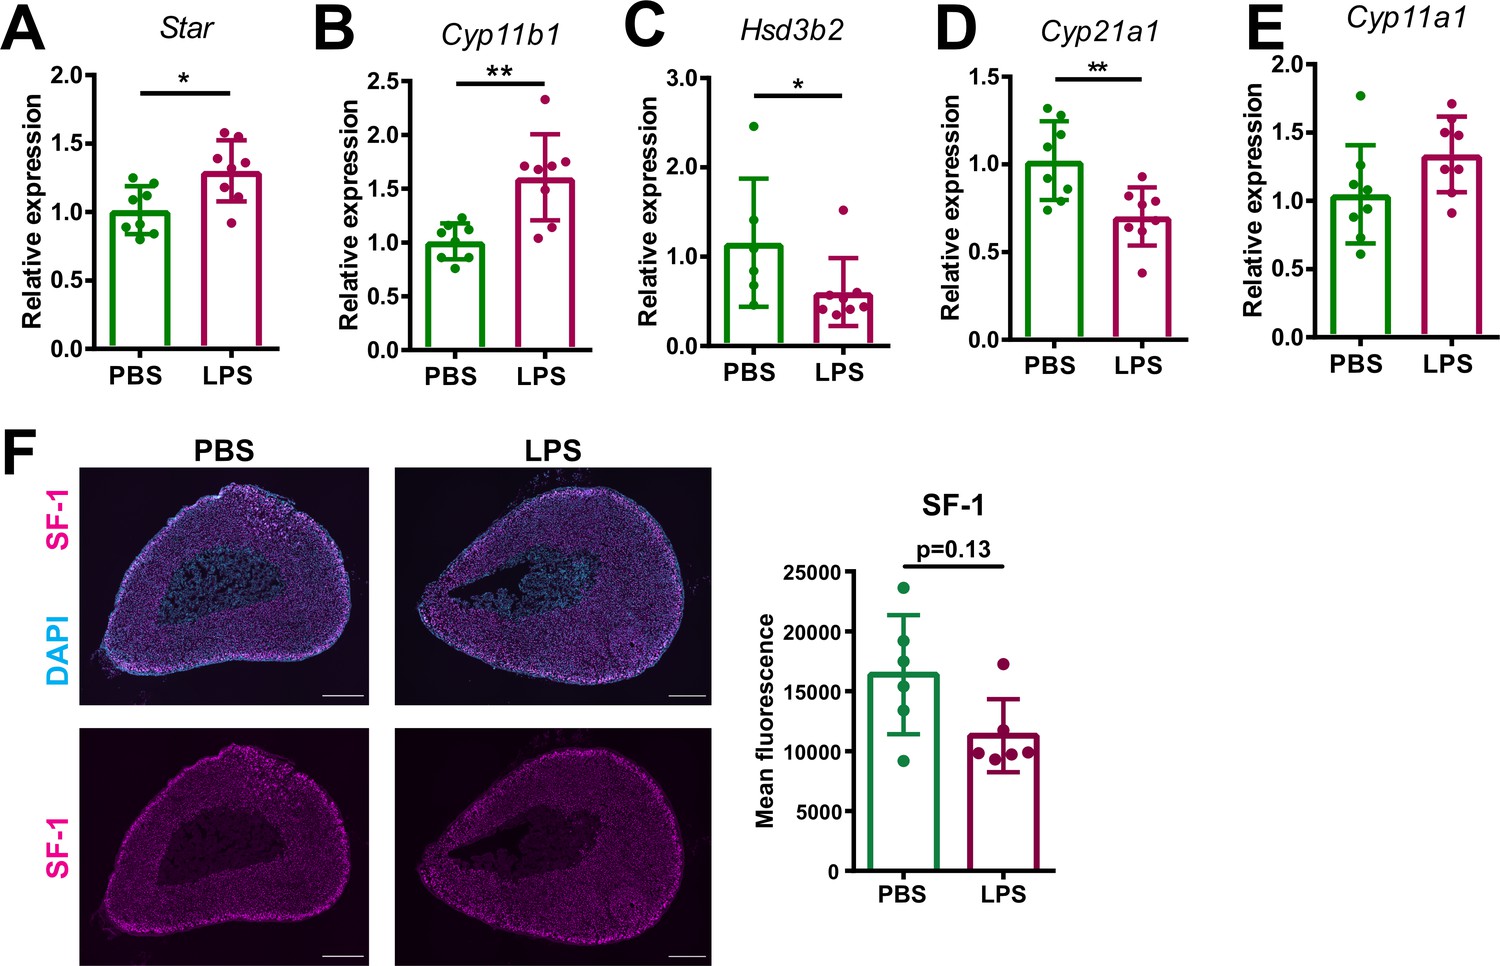
Inflammation-associated changes in the steroidogenic pathway.
(A–E) mRNA expression of steroidogenic enzymes (Star, Cyp11b1, Hsd3b2, Cyp21a1, and Cyp11a1) in adrenocortical cells of mice treated for 6 hr with PBS or LPS (n=6–8 mice per group, shown one from two experiments). (F) Representative immunofluorescence images of adrenal gland sections from PBS and LPS mice stained for steroidogenic factor 1 (SF-1) (magenta) and DAPI (blue). Scale bar, 300 μm. Quantification of the mean fluorescence intensity of SF-1 staining in the adrenal cortex (excluding the outer capsule region) (n=6 mice per group). Data are presented as mean ±s.d. Statistical analysis was done with two-tailed Mann-Whitney test. *p<0.05, **p<0.01.
-
Figure 1—figure supplement 2—source data 1
Inflammation-associated changes in the steroidogenic pathway.
- https://cdn.elifesciences.org/articles/83064/elife-83064-fig1-figsupp2-data1-v2.zip
Figure 2 with 1 supplement
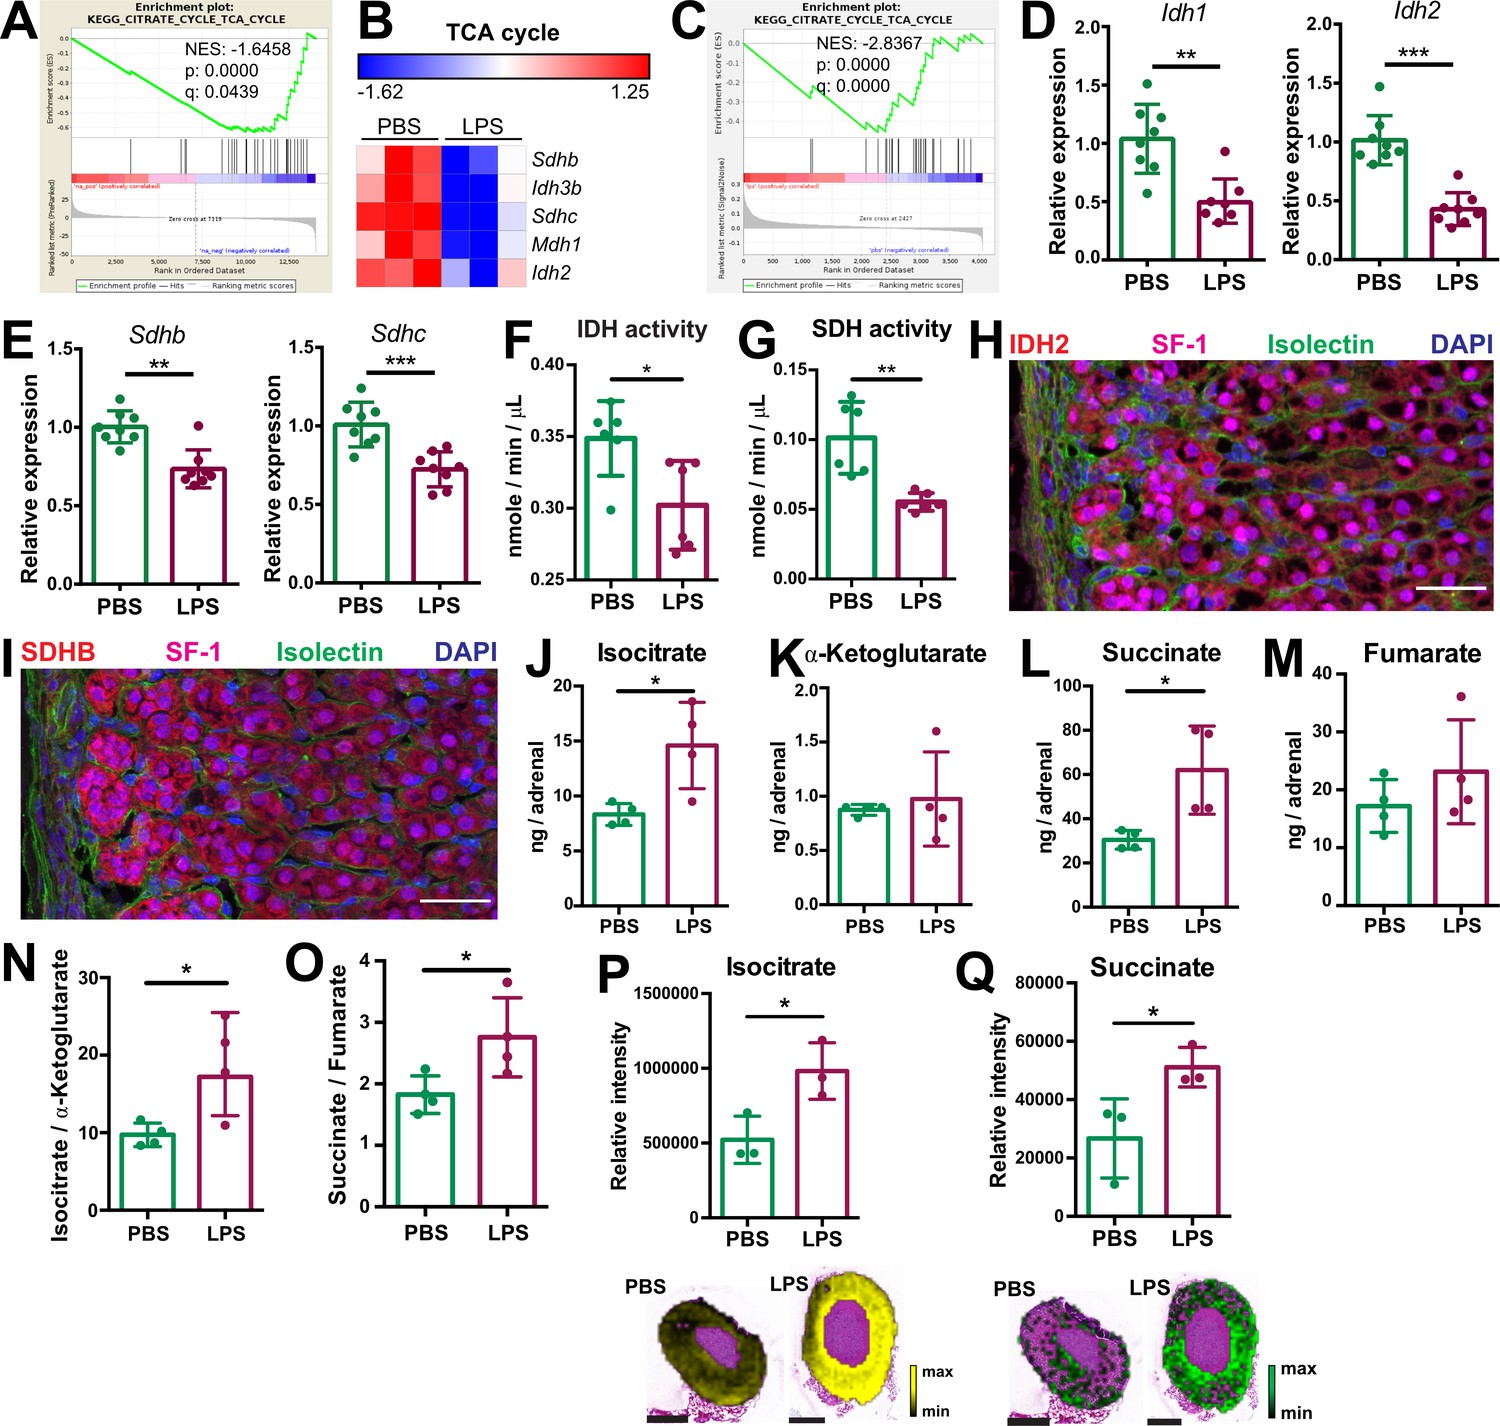
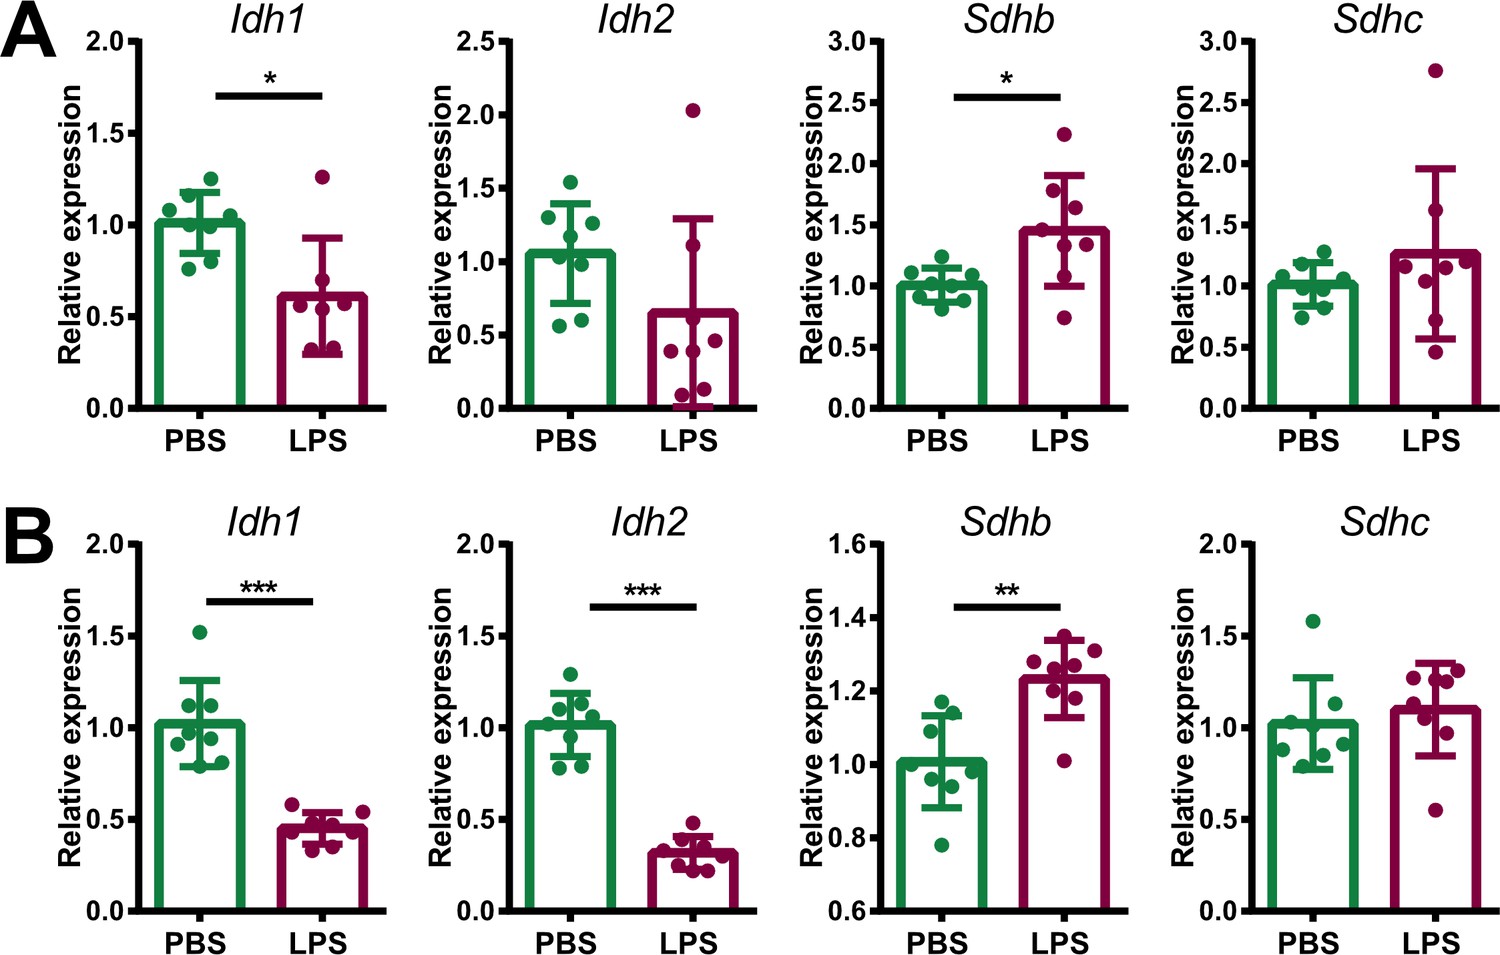
Systemic inflammation disrupts the TCA cycle in the adrenal cortex.
(A,B) Transcriptome analysis in the microdissected adrenal gland cortex of mice treated for 6 hr with PBS or LPS (n=3 mice per group). (A) Gene set enrichment analysis (GSEA) for TCA cycle genes. (B) Heatmap of differentially expressed TCA cycle genes (padj <0.05). (C) GSEA analysis for TCA cycle proteins in CD31-CD45- adrenocortical cells of mice treated for 24 hr with PBS or LPS (n=6 mice per group). (D,E) mRNA expression of Idh1, Idh2, Sdhb, and Sdhc in adrenocortical CD31-CD45- cells of mice treated for 6 hr with PBS or LPS (n=8 mice per group, shown one from two experiments). (F,G) Quantification of IDH and SDH activities in the adrenal cortex of mice treated for 24 hr with LPS or PBS (n=6 mice per group). Values are normalized to the total protein amount in the adrenal cortex. (H,I) Immunofluorescence images of the adrenal gland, stained for IDH2 (red) or SDHB (red), SF-1 (magenta), Isolectin (staining endothelial cells, green), and DAPI (blue). Scale bar, 30 μm. (J–O) TCA cycle metabolites (isocitrate, α-ketoglutarate, succinate, fumarate) were measured by LC-MS/MS in adrenal glands of mice 24 hr after injection with PBS or LPS (n=4 mice per group, shown one from two experiments). (P,Q) MALDI-MSI for isocitrate and succinate in the adrenal cortex of mice treated for 24 hr with PBS or LPS (n=3 mice per group). Representative images and quantifications are shown. Scale bar, 500 μm. Data in (D–G,J–Q) are presented as mean ±s.d. Statistical analysis was done with two-tailed Mann-Whitney test (D–G) or one-tailed Mann-Whitney test (J–Q). *p<0.05, **p<0.01, ***p<0.001, ****p<0.0001. NES: normalized enrichment score.
-
Figure 2—source data 1
Systemic inflammation disrupts the TCA cycle in the adrenal cortex.
- https://cdn.elifesciences.org/articles/83064/elife-83064-fig2-data1-v2.zip
Figure 2—figure supplement 1
Expression of TCA cycle genes in endothelial and immune cells of adrenal glands of LPS-treated mice.
mRNA expression of Idh1, Idh2, Sdhb, and Sdhc in endothelial (CD31+) (A) and immune (CD45+) cells (B) sorted from adrenal glands of mice treated for 6 hr with PBS or LPS (n=6–8 mice per group, shown one from two experiments). Data are presented as mean ± s.d. Statistical analysis was done with two-tailed Mann-Whitney test. *p<0.05, **p<0.01, ***p<0.001.
-
Figure 2—figure supplement 1—source data 1
Expression of TCA cycle genes in endothelial and immune cells of adrenal glands of LPS-treated mice.
- https://cdn.elifesciences.org/articles/83064/elife-83064-fig2-figsupp1-data1-v2.zip
Figure 3
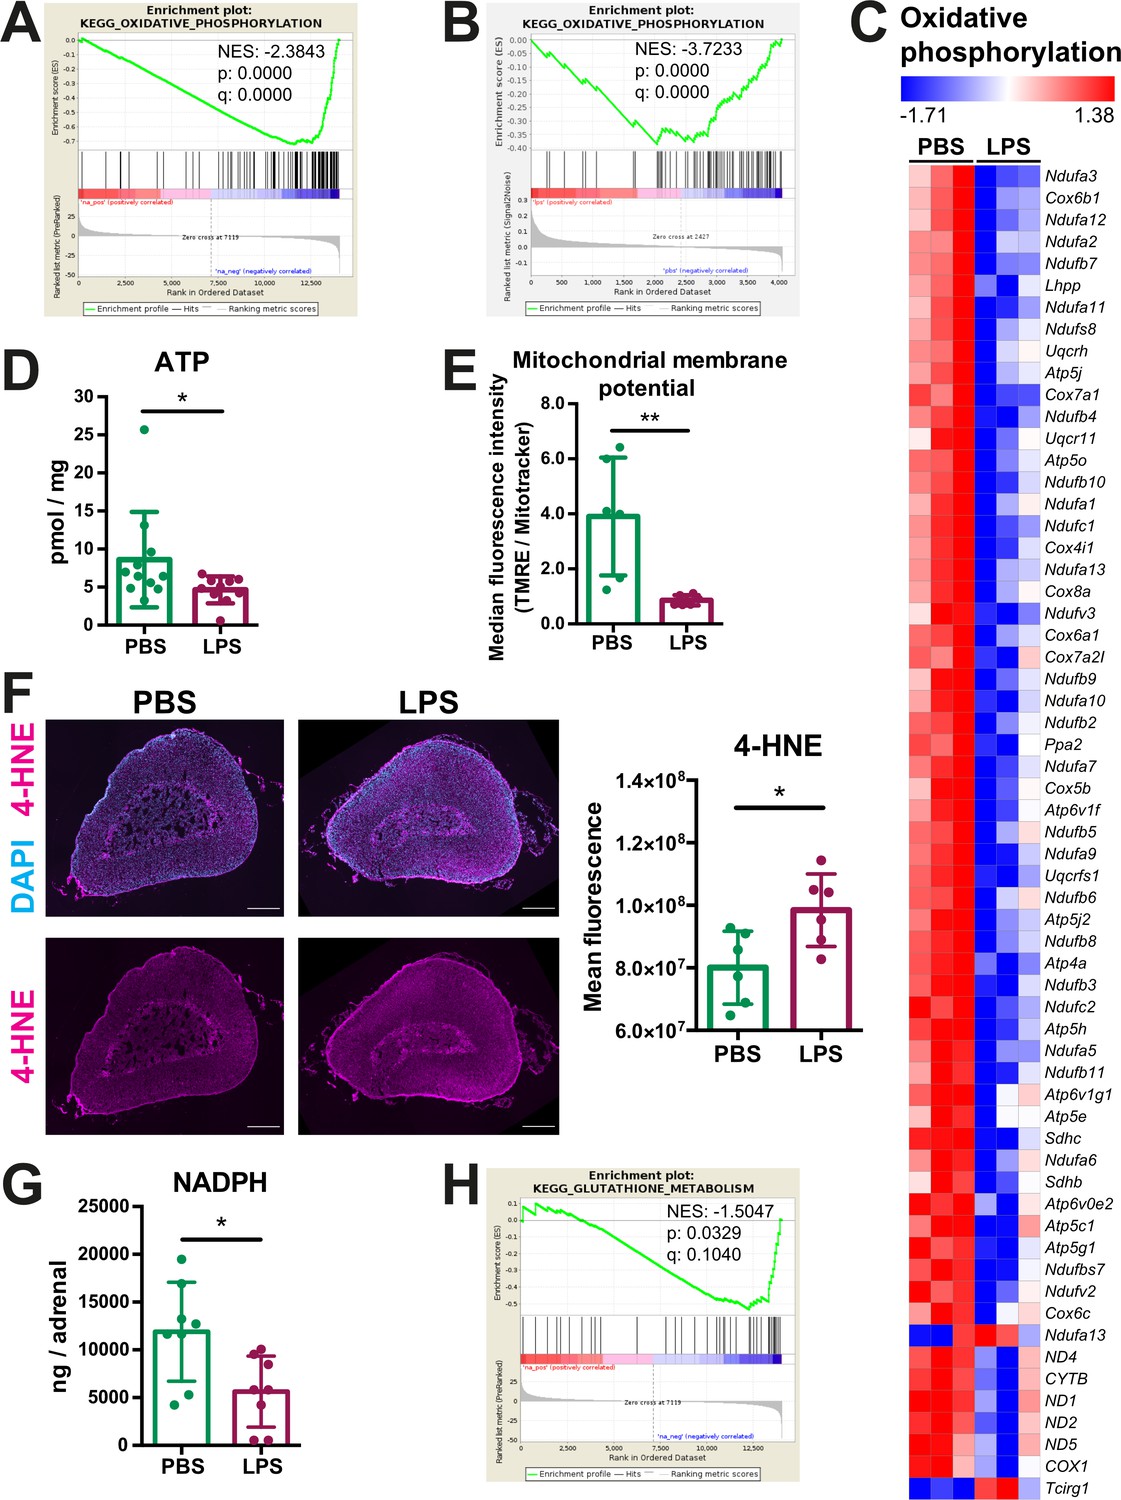
Oxidative phosphorylation is reduced and oxidative stress is increased in the adrenal cortex of LPS-treated mice.
(A) Gene set enrichment analysis (GSEA) for oxidative phosphorylation-related genes in the adrenal cortex of mice treated for 6 hr with PBS or LPS (n=3 mice per group). (B) GSEA for oxidative phosphorylation-associated proteins in CD31-CD45- adrenocortical cells of mice treated for 24 hr with PBS or LPS (n=6 mice per group). (C) Heatmap of differentially expressed genes related to oxidative phosphorylation (padj <0.05). (D) Measurement of ATP in adrenal glands of mice treated for 24 hr with PBS or LPS (n=10–11 mice per group, pooled from two experiments). (E) Measurement of mitochondrial membrane potential by TMRE staining and mitochondrial load by Mitotracker Green FM in CD31-CD45-adrenocortical cells of PBS or LPS mice. Data are presented as ratio of the median fluorescence intensities of TMRE to Mitotracker Green FM (n=6 mice per group). (F) Representative immunofluorescence images of adrenal gland sections from PBS- and LPS-treated mice (24 hr post-injection), stained for 4-hydroxynonenal (4-HNE) (magenta) and DAPI (blue). Scale bar, 300 μm. Quantification of the mean fluorescence intensity of 4-HNE staining in the adrenal cortex of PBS- or LPS-treated mice (n=6 mice per group). (G) NADPH measurement by liquid chromatography-tandem mass spectrometry (LC-MS/MS) in adrenal glands of mice treated with PBS or LPS for 24 hr (n=8 mice per group). Data are given as observed peak area intensities of NADPH. (H) GSEA for glutathione metabolism of RNA-Seq data in the adrenal cortex of LPS versus PBS mice (n=3 mice per group). Data in (D–G) present mean ± s.d. Statistical analysis was done with two-tailed Mann-Whitney test. *p<0.05, **p<0.01. NES: normalized enrichment score.
-
Figure 3—source data 1
Oxidative phosphorylation is reduced and oxidative stress is increased in the adrenal cortex of LPS-treated mice.
- https://cdn.elifesciences.org/articles/83064/elife-83064-fig3-data1-v2.zip
Figure 4
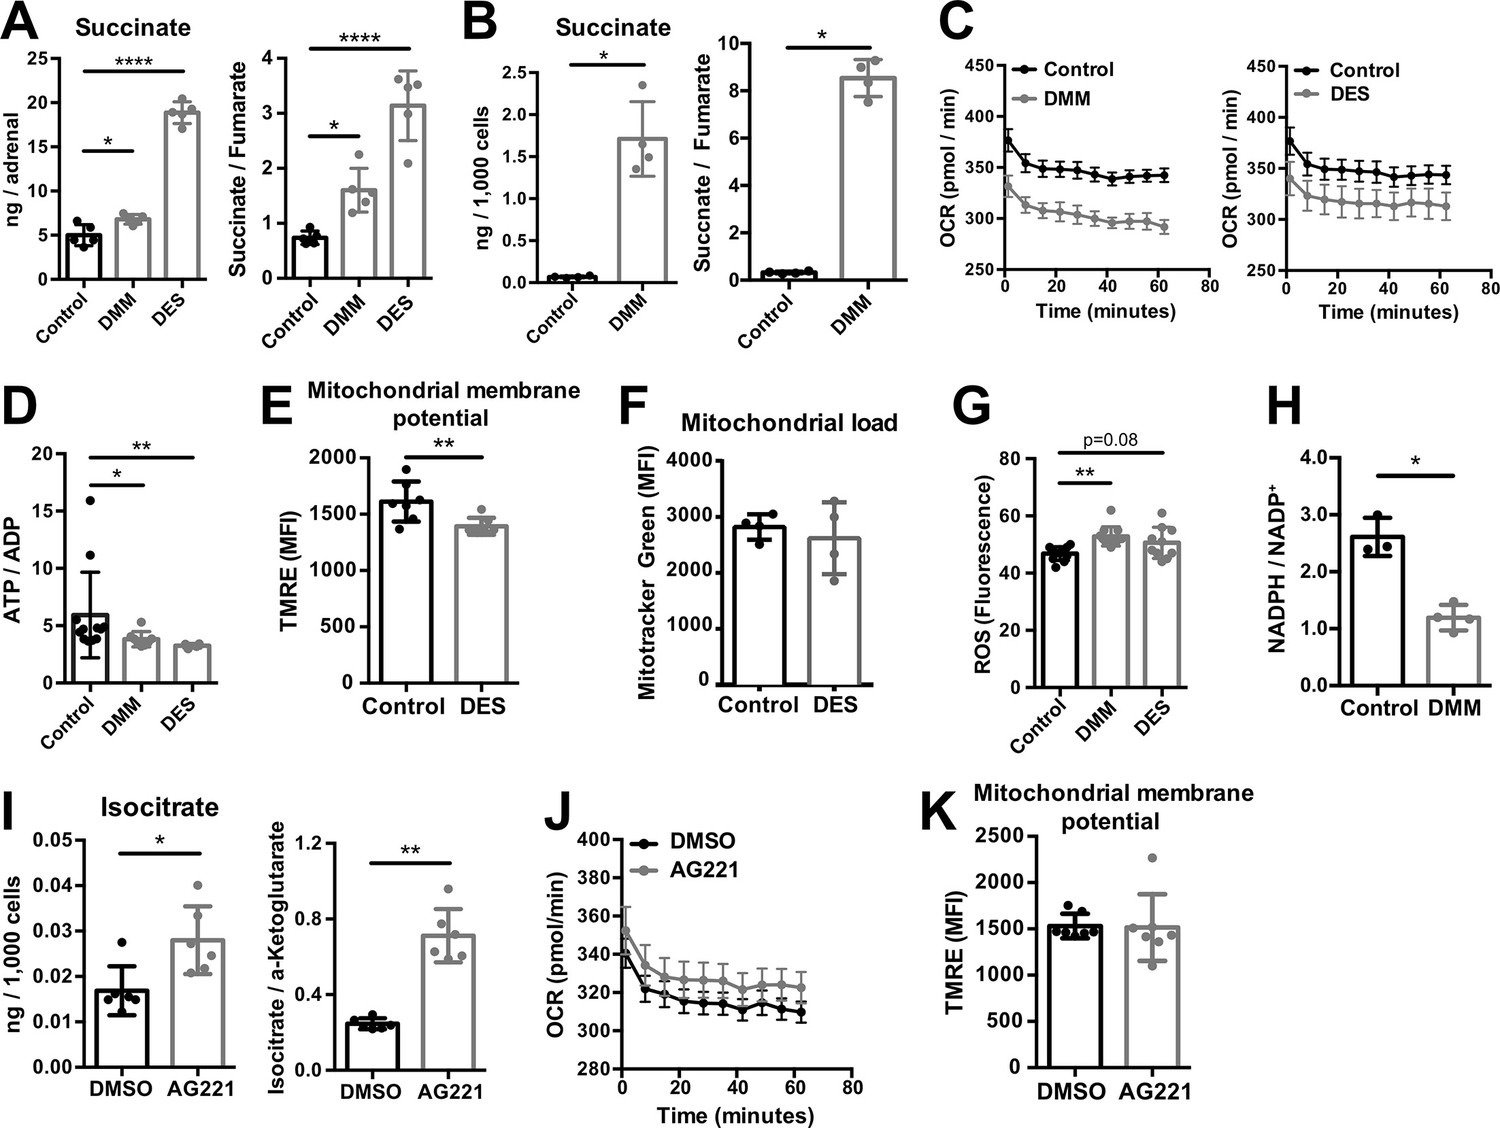
Increased succinate levels impair mitochondrial function in adrenocortical cells.
(A,B) Succinate and fumarate levels were measured by liquid chromatography-tandem mass spectrometry (LC-MS/MS) in adrenal gland explants (A) and NCI-H295R cells (B) treated with dimethyl malonate (DMM) or diethyl succinate (DES) for 24 hr (n=5 for (A) and n=4 for (B)). (C) Oxygen consumption rate (OCR) measurement with Seahorse technology in NCI-H295R cells treated with DMM or DES for 24 hr (n=6). (D) Measurement of ATP/ADP ratio in NCI-H295R cells treated with DMM or DES for 24 hr (n=4–12). (E,F) TMRE and Mitotracker Green FM staining assessed by flow cytometry in NCI-H295R cells treated with DES for 4 hr, MFI is shown (n=7 for (E) and n=4, one from two experiments for (F)). (G) ROS measurement in NCI-H295R cells treated with DMM or DES for 2 hr (n=10–12). (H) Measurement of NADPH/NADP+ ratio in NCI-H295R cells treated with DMM for 24 hr (n=3–4). (I) Isocitrate levels measured by LC-MS/MS in NCI-H295R cells treated for 24 hr with AG221 or DMSO (n=6). (J) OCR measurement in NCI-H295R cells treated for 24 hr with AG221 or DMSO (n=10). (K) TMRE staining and flow cytometry in NCI-H295R cells treated for 4 hr with AG221 or DMSO, MFI is shown (n=7). Data in (A–B,D–I,K) are presented as mean ± s.d. Data in (C,J) are presented as mean ± s.e.m. Statistical analysis was done with one-way ANOVA (A, G) or two-tailed (B,D,E,F,I,K) or one-tailed (H) Mann-Whitney test. *p<0.05, **p<0.01, ***p<0.001, ****p<0.0001.
-
Figure 4—source data 1
Increased succinate levels impair mitochondrial function in adrenocortical cells.
- https://cdn.elifesciences.org/articles/83064/elife-83064-fig4-data1-v2.zip
Figure 5 with 4 supplements
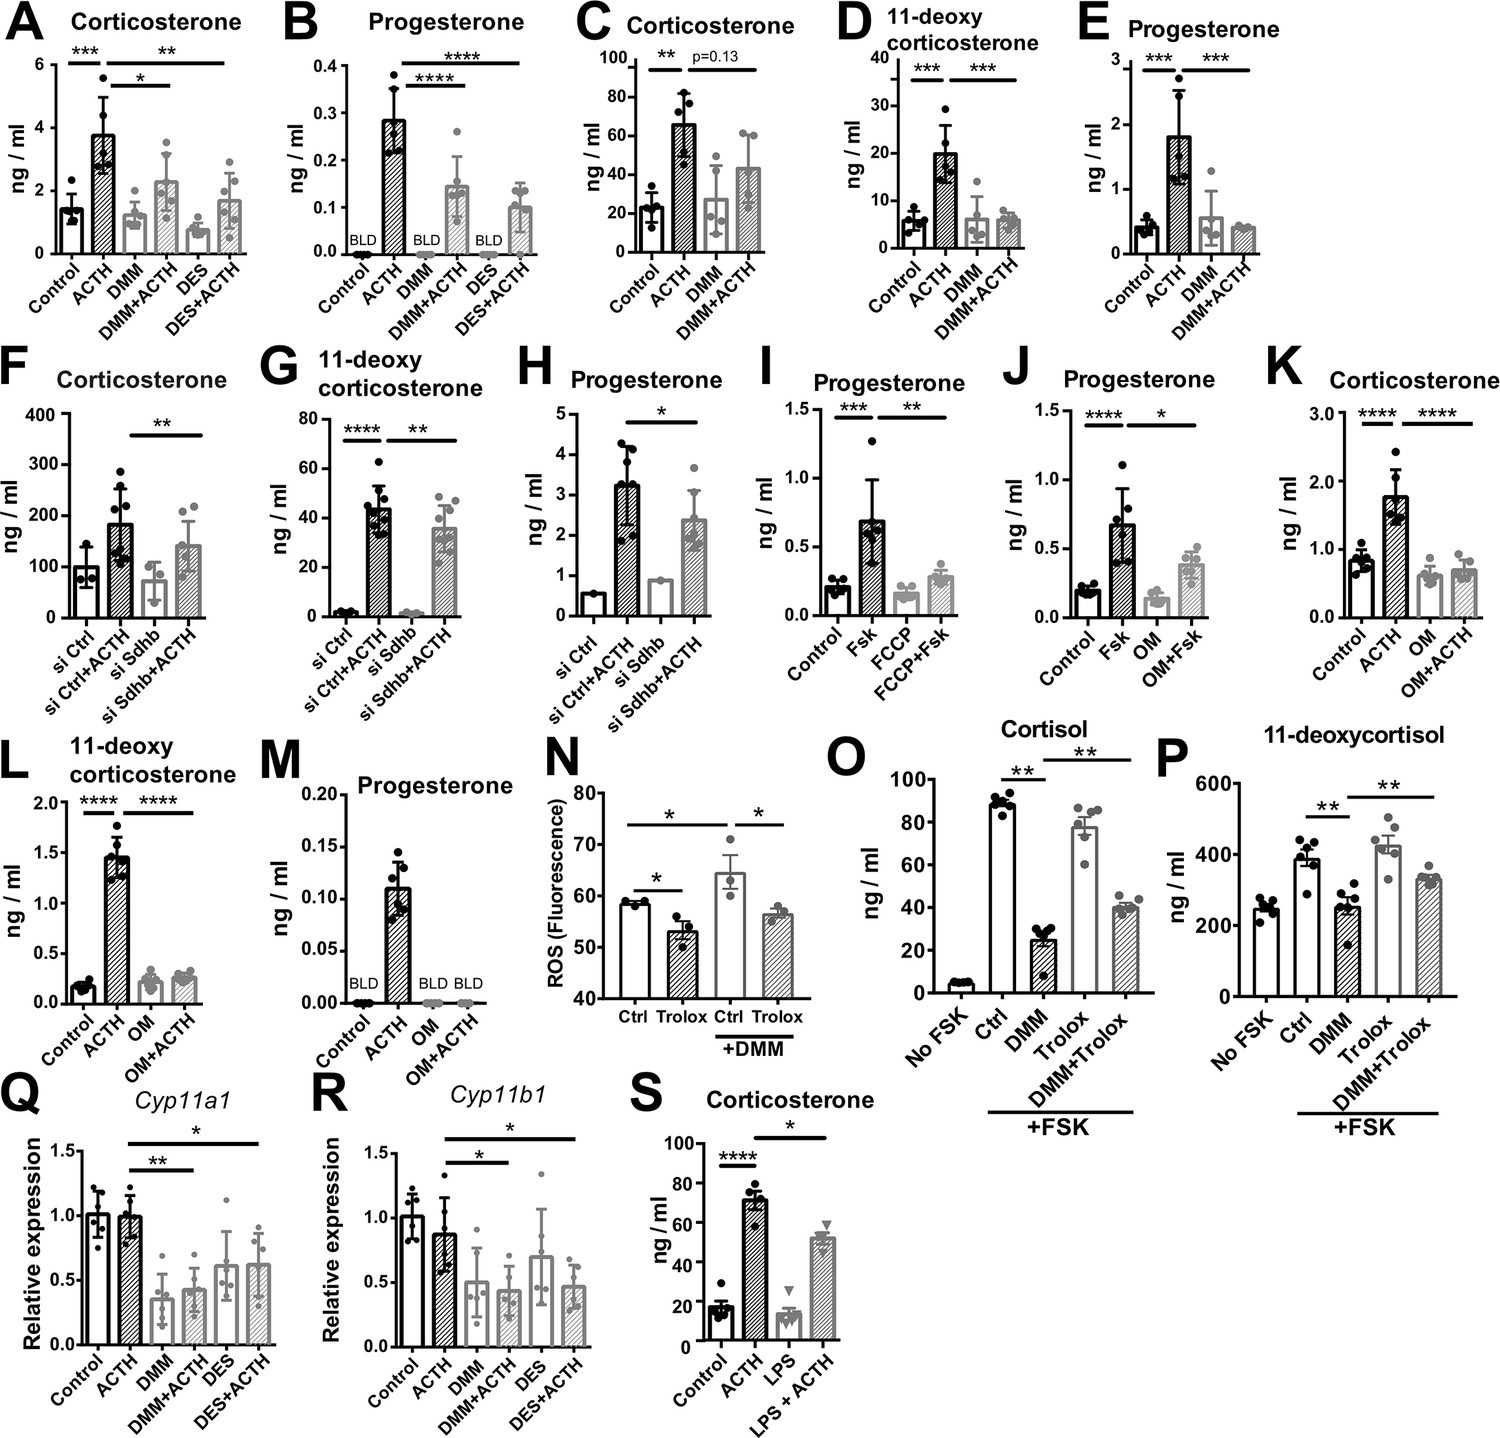
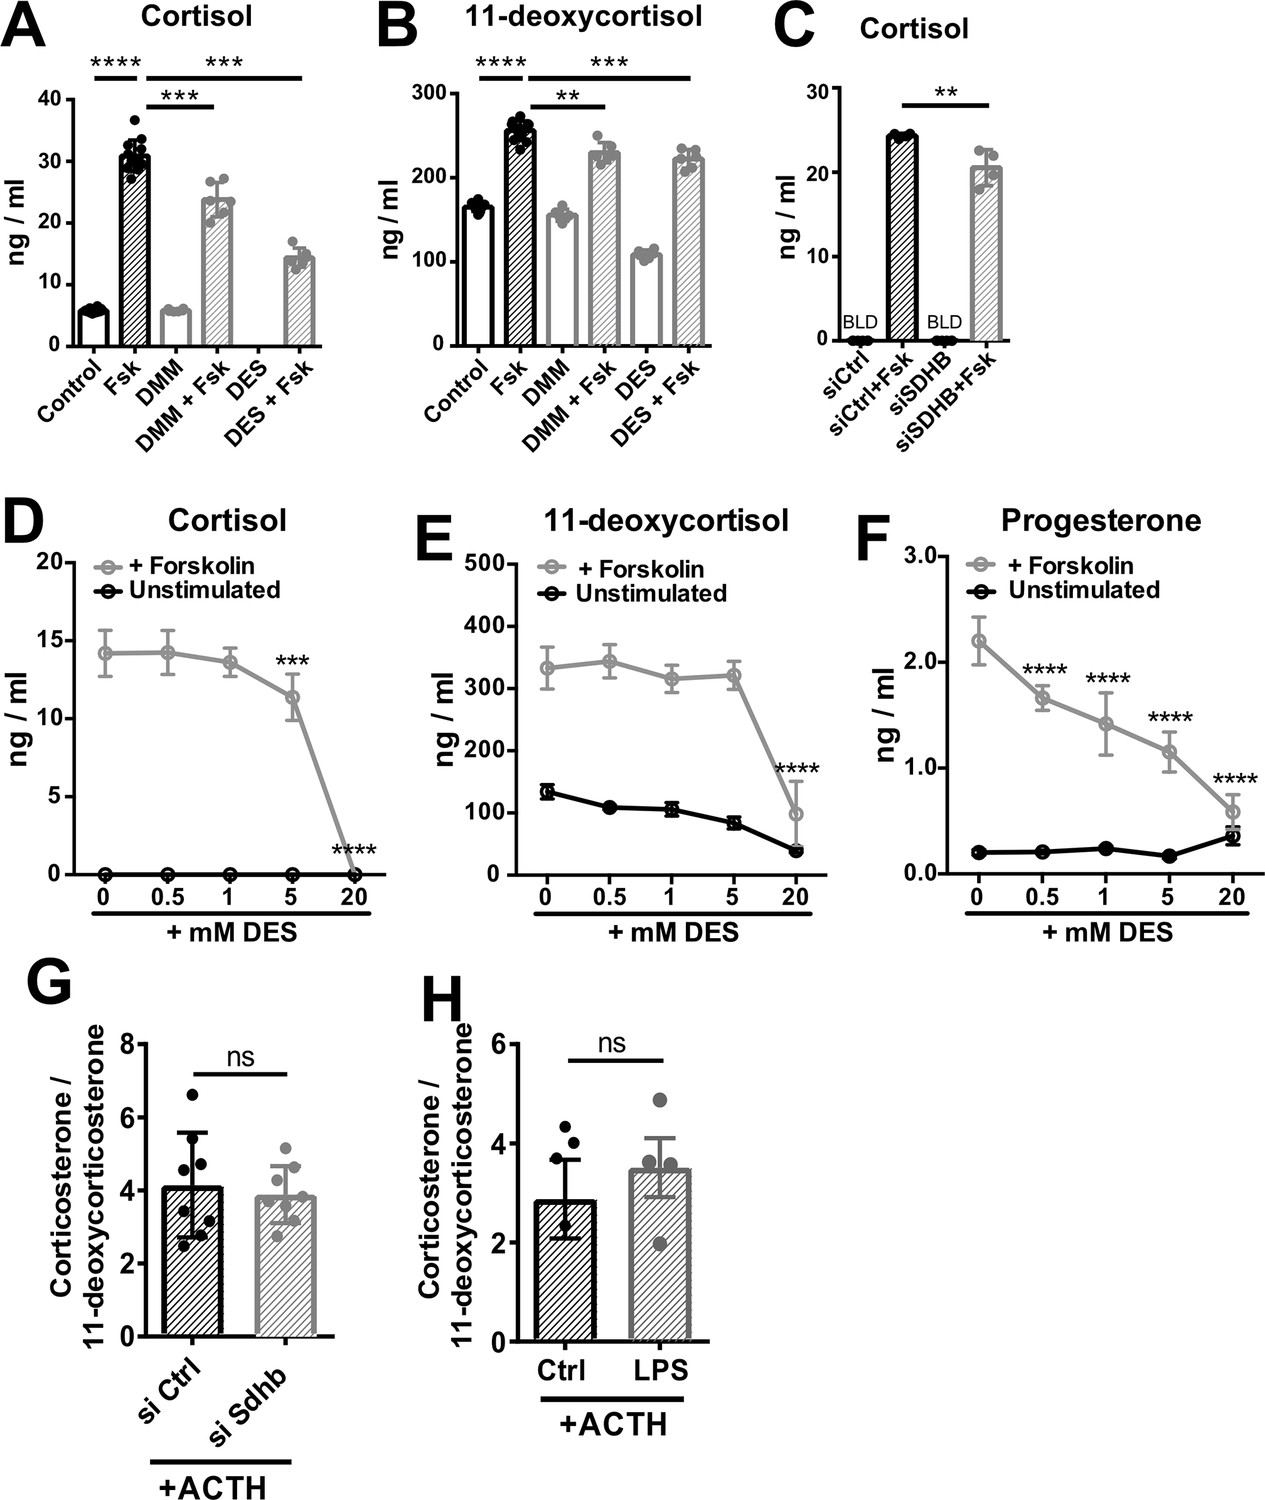
Disruption of SDH function impairs glucocorticoid production.
(A–E) Primary adrenocortical cells (A,B) and adrenal explants (C–E) were treated for 24 hr with dimethyl malonate (DMM) or diethyl succinate (DES) and for another 45 min with adrenocorticotropic hormone (ACTH) (10 ng/ml or 100 ng/ml, respectively) (n=5–6). (F–H) Primary adrenocortical cells were transfected with siSdhb or non-targeting siRNA (siCtrl) and 24 hr post-transfection they were treated for 45 min with ACTH (n=7–8). (I,J) NCI-H295R cells were treated for 24 hr with FCCP (I) or oligomycin (OM) (J) and for another 30 min with Forskolin (Fsk) (n=6). (K–M) Primary adrenocortical cells were treated for 24 hr with oligomycin (OM) and for another 45 min with ACTH (n=6). (N) ROS measurement in NCI-H295R cells pre-treated for 15 min with Trolox or control solution (DMSO) and then treated for 2 hr with DMM (n=3). (O,P) NCI-H295R cells pre-treated for 15 min with Trolox or DMSO were treated or not for 24 hr with DMM and Forskolin (n=6). (Q,R) Cyp11a1 and Cyp11b1 expression in primary adrenocortical cells treated for 24 hr with DMM or DES and for 45 min with ACTH (n=5–6). (S) Adrenal gland explants were treated for 24 hr with LPS and for 45 min with ACTH (n=4–5). Measurements of steroid hormones in (A–M,O,P,S) were performed in supernatants of primary adrenocortical cell cultures or adrenal gland explants by liquid chromatography-tandem mass spectrometry (LC-MS/MS). Data are presented as mean ± s.d. Statistical analysis was done with one-way ANOVA (A–E, I–M,S), Wilcoxon (F,G,H), one-tailed Mann-Whitney (N), or two-tailed Mann-Whitney test (O–R). *p<0.05, **p<0.01, ***p<0.001, ****p<0.0001. BLD = below level of detection.
-
Figure 5—source data 1
Disruption of SDH function impairs glucocorticoid production.
- https://cdn.elifesciences.org/articles/83064/elife-83064-fig5-data1-v2.zip
Figure 5—figure supplement 1
High succinate levels impair glucocorticoid production in adrenocortical cells.
(A,B) NCI-H295R cells were treated for 24 hr with dimethyl malonate (DMM) or diethyl succinate (DES) and for another 24 hr with Forskolin (Fsk) (n=6–12). (C) NCI-H295R cells were transfected with siSDHB or control siRNA (siCtrl) and 24 hr post-transfection they were treated for 24 hr with Forskolin (n=4). (D–F) NCI-H295R cells were treated for 24 hr with the indicated concentrations of DES and for another 24 hr with Forskolin (n=4). (G) Primary adrenocortical cells were transfected with siSdhb or non-targeting siRNA (siCtrl) and 24 hr post-transfection they were treated for 45 min with adrenocorticotropic hormone (ACTH) (n=8). (H) Adrenal gland explants were treated for 24 hr with LPS and for 45 min with ACTH (n=4–5). Measurements for indicated steroid hormones were performed in cell culture or adrenal explant supernatants by liquid chromatography-tandem mass spectrometry (LC-MS/MS). Data are presented as mean ± s.d. Statistical analysis was done with one-way ANOVA (A–C); two-way ANOVA (D–F), or two-tailed Mann-Whitney test (G,H). **p<0.01, ***p<0.001, ****p<0.0001. BLD = below level of detection.
-
Figure 5—figure supplement 1—source data 1
High succinate levels impair glucocorticoid production in adrenocortical cells.
- https://cdn.elifesciences.org/articles/83064/elife-83064-fig5-figsupp1-data1-v2.zip
Figure 5—figure supplement 2
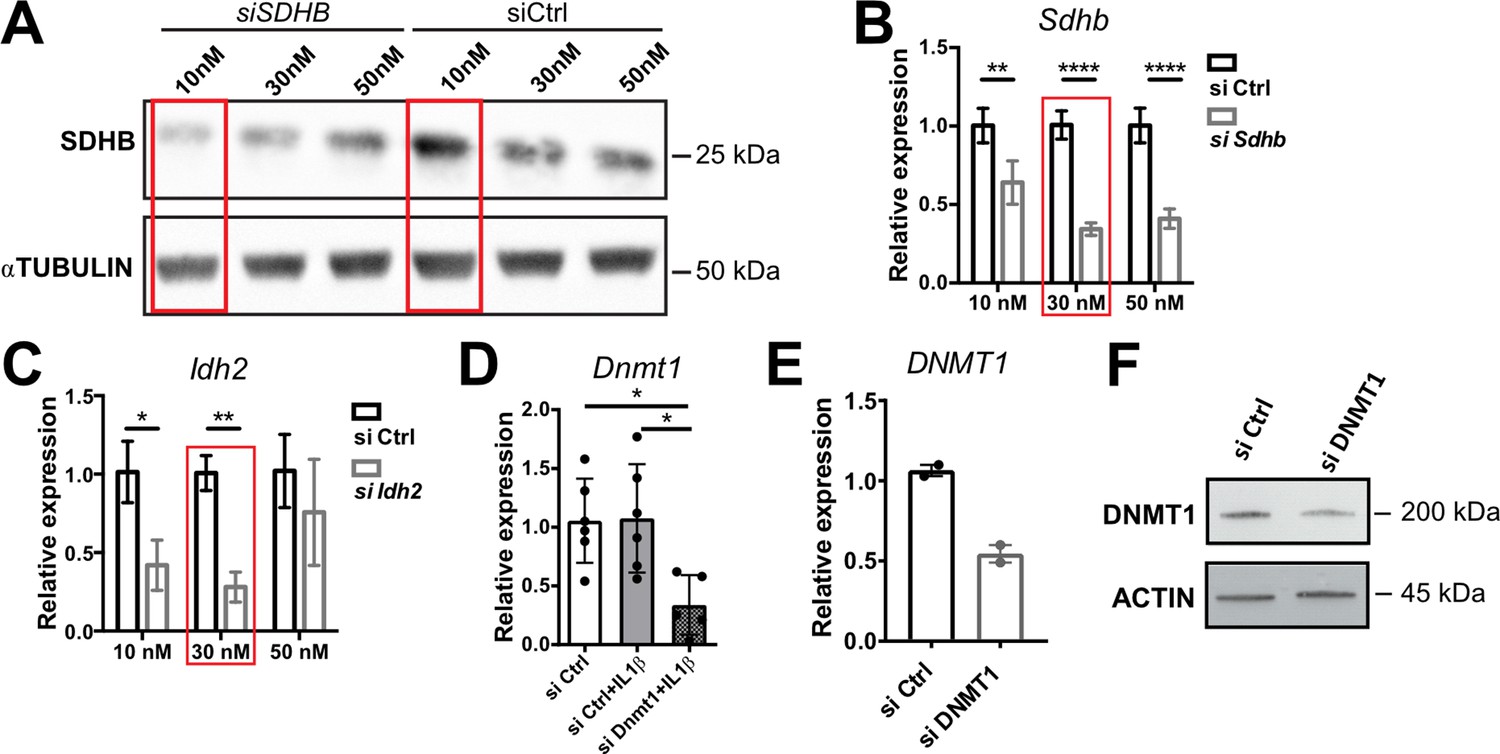
SiRNA silencing efficiencies.
(A) Western blot analysis for SDHB in NCI-H295R cells transfected with 10, 30, or 50 nM siSDHB or siCtrl (24 hr post-transfection). α-TUBULIN was used as loading control. (B,C) mRNA expression of Sdhb and Idh2 in primary adrenocortical cells transfected for 24 hr with 10, 30, or 50 nM siSdhb, siIdh2, or siCtrl (n=3). (D) Dnmt1 expression in primary adrenocortical cells transfected for 24 hr with 30 nM siDnmt1 or siCtrl (n=5–6). (E) DNMT1 expression in NCI-H295R cells transfected for 48 hr with 30 nM siDNMT1 or siCtrl (n=2). (F) Western blot analysis for DNMT1 in NCI-H295R cells transfected with 30 nM siDNMT1 or siCtrl (48 hr post-transfection). β-Actin was used as loading control. Data in (B–E) are presented as mean ± s.d. Statistical analysis was done with two-way ANOVA (B,C) or one-way ANOVA (D). *p<0.05, **p<0.01, ****p<0.0001. Red boxes mark the concentrations with most efficient knock-down, which were chosen for further experiments. Full unedited blots for (A) and (F) are available in Figure 5—figure supplement 2—source data 1.
-
Figure 5—figure supplement 2—source data 1
SiRNA silencing efficiencies.
- https://cdn.elifesciences.org/articles/83064/elife-83064-fig5-figsupp2-data1-v2.zip
Figure 5—figure supplement 3
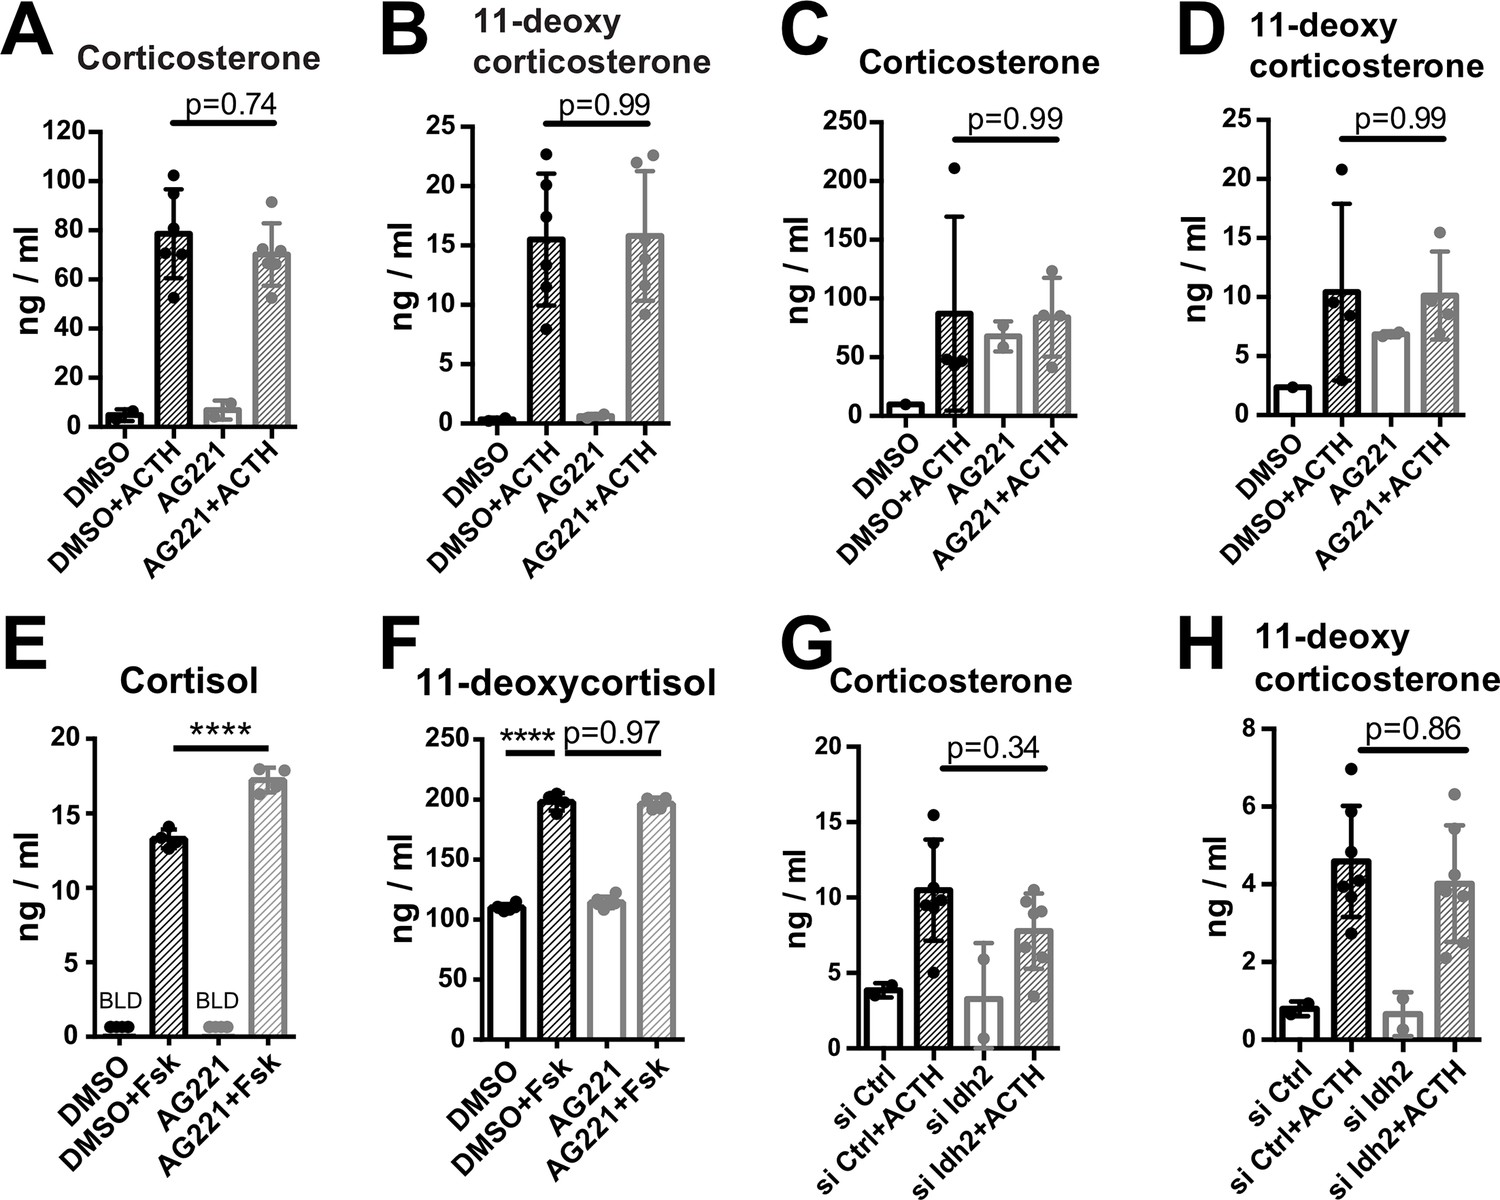
Disruption of IDH function does not affect glucocorticoid production.
(A,B) Primary adrenocortical cells were treated for 24 hr with AG221 or DMSO and for another 45 min with adrenocorticotropic hormone (ACTH) (n=2–6). (C,D) Adrenal gland explants were treated for 24 hr with AG221 or DMSO and for another 45 min with ACTH (n=2–4). (E,F) NCI-H295R cells were treated for 24 hr with AG221 or DMSO and for another 24 hr with Forskolin (n=4–6). (G,H) Primary adrenocortical cells were transfected with siIdh2 or siCtrl and 24 hr post-transfection they were treated for 45 min with ACTH (n=2–7). Measurements of steroid hormones were performed in supernatants of primary adrenocortical cell cultures, adrenal gland explants, or NCI-H295R cells by liquid chromatography-tandem mass spectrometry (LC-MS/MS). Data are presented as mean ± s.d. Statistical analysis was done with one-way ANOVA. ****p<0.0001. BLD = below level of detection.
-
Figure 5—figure supplement 3—source data 1
Disruption of IDH function does not affect glucocorticoid production.
- https://cdn.elifesciences.org/articles/83064/elife-83064-fig5-figsupp3-data1-v2.zip
Figure 5—figure supplement 4
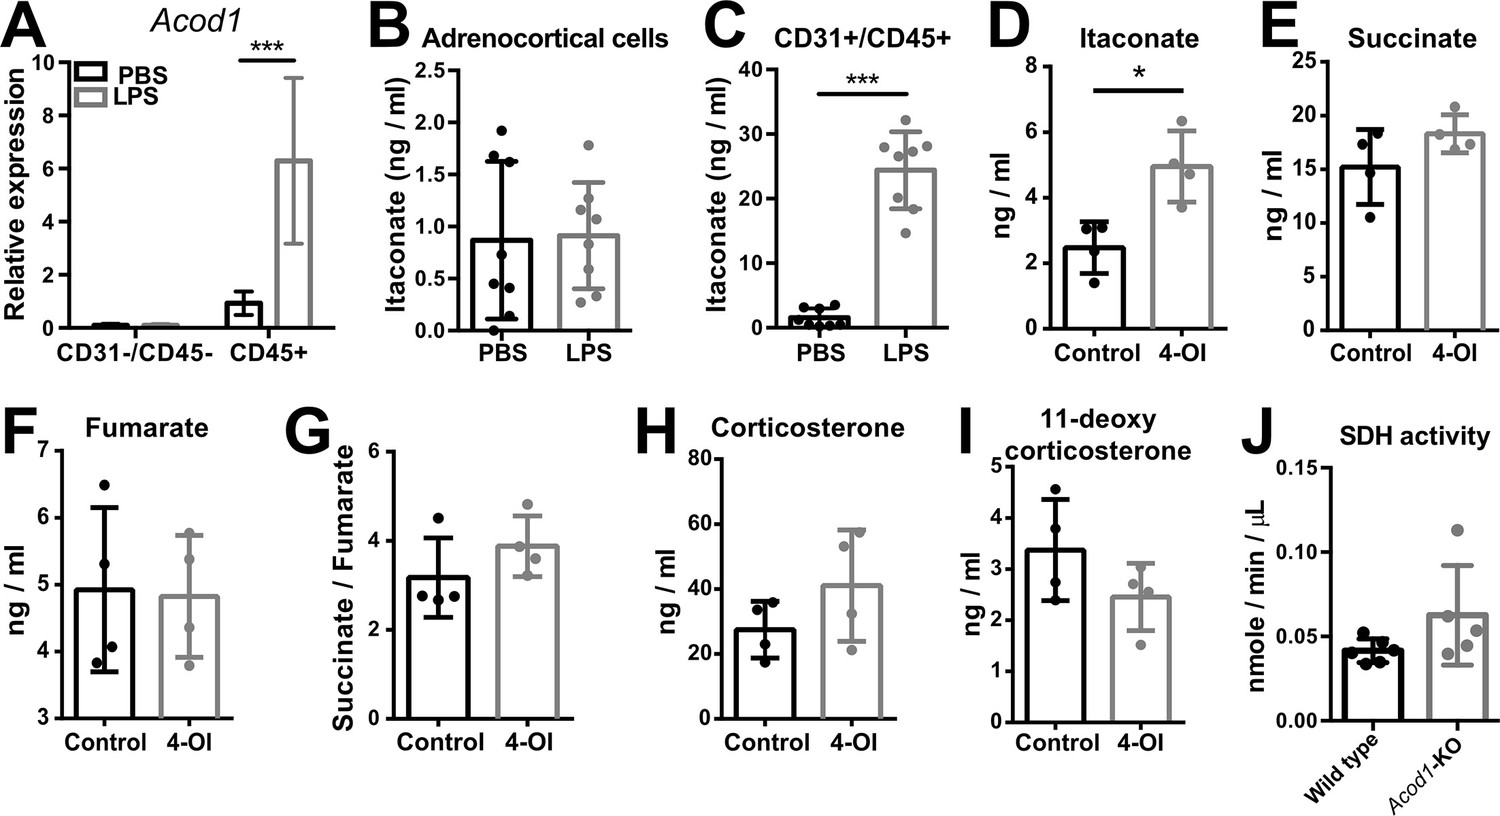
Itaconate does not affect SDH activity or steroidogenesis in adrenocortical cells.
(A) mRNA expression of Acod1 in CD31-/CD45- and CD45+ cells sorted from adrenal cortex of mice treated for 6 hr with PBS or LPS (n=4–8 mice per group, shown one from two experiments). (B,C) Itaconate levels in CD31-/CD45- (B) and CD31+/CD45+ cells (C) sorted from adrenal glands of mice treated for 24 hr with PBS or LPS (n=8 mice per group, shown one from two experiments). (D–G) Itaconate, succinate, and fumarate levels and succinate/fumarate ratio in lysates of primary adrenocortical cells treated for 24 hr with 4-octyl itaconate (4-OI) (n=4). (H,I) Corticosterone and 11-deoxycorticosterone levels in the supernatant of primary adrenocortical cells treated for 24 hr with 4-OI (n=4). (J) Quantification of SDH activity in the adrenal cortex of Acod1-KO and wild-type mice treated for 16 hr with LPS (n=5–6 mice per group). Values are normalized to the total protein amount in the adrenal cortex. Data are presented as mean ± s.d. Statistical analysis was done with two-tailed Mann-Whitney test. *p<0.05, ***p<0.001.
-
Figure 5—figure supplement 4—source data 1
Itaconate does not affect SDH activity or steroidogenesis in adrenocortical cells.
- https://cdn.elifesciences.org/articles/83064/elife-83064-fig5-figsupp4-data1-v2.zip
Figure 6
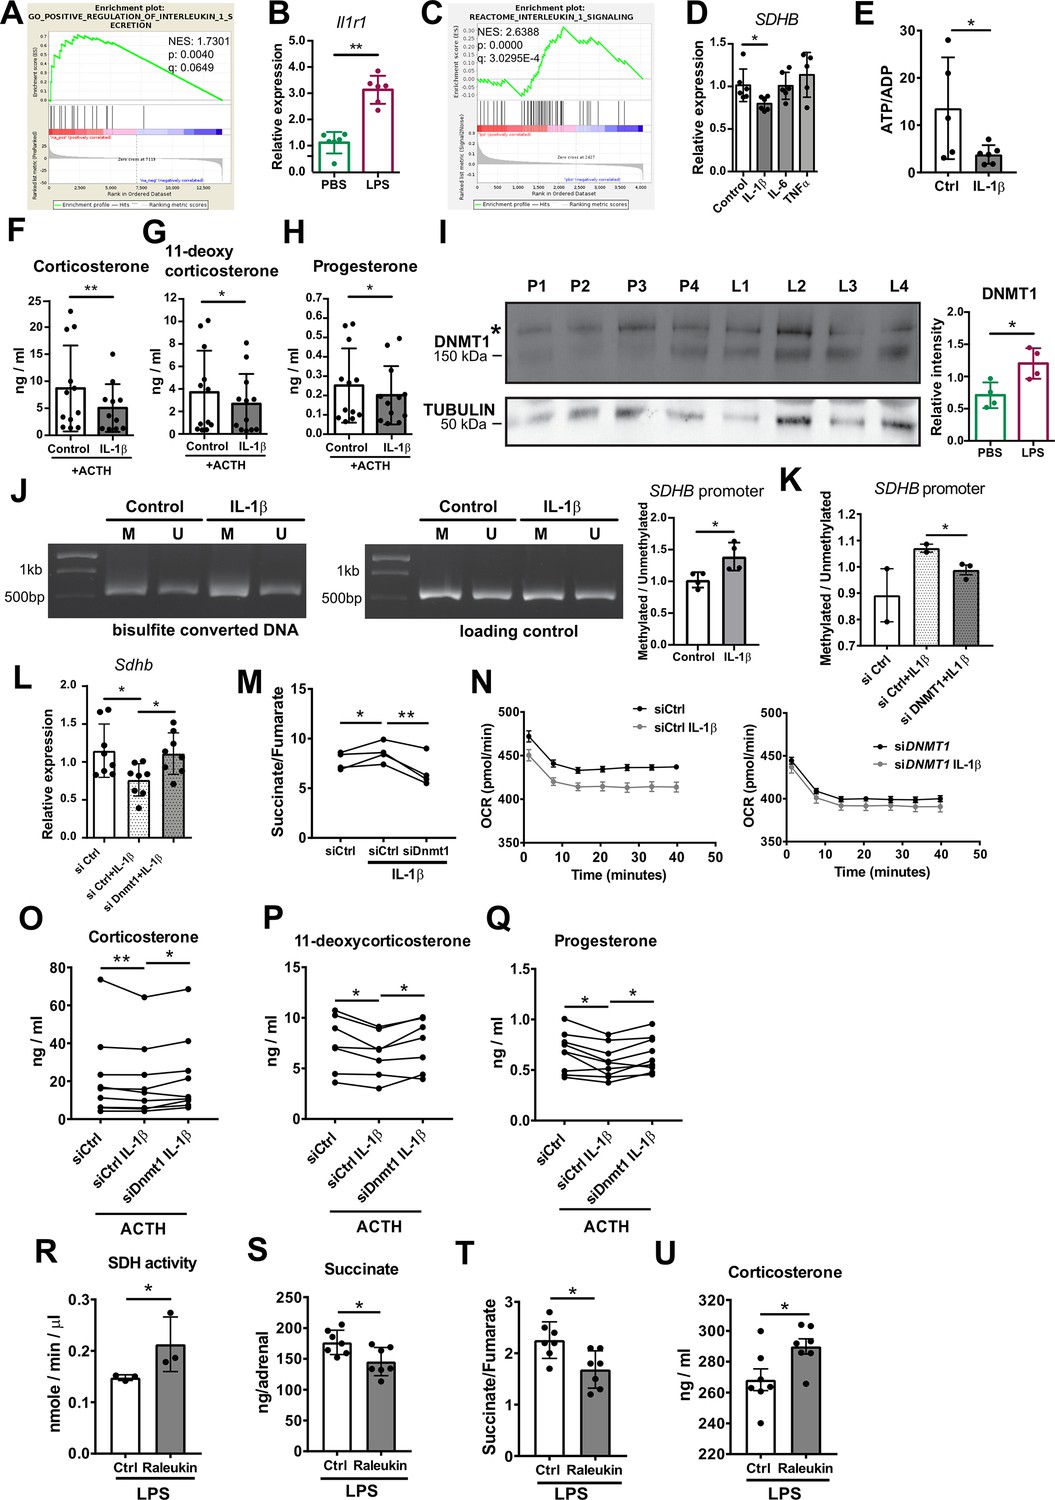
IL-1β reduces SDHB expression and adrenocortical steroidogenesis in a DNA methyltransferase 1 (DNMT1)-dependent manner.
(A) Gene set enrichment analysis (GSEA) for genes related to positive regulation of IL-1β secretion in the adrenal cortex of mice treated for 6 hr with PBS or LPS (n=3 mice per group). (B) Il1r1 expression in CD31-CD45- adrenocortical cells of mice 6 hr post-injection with PBS or LPS (n=6 mice per group). (C) GSEA for proteins related to IL-1β signaling in CD31-CD45- adrenocortical cells of mice treated for 24 hr with PBS or LPS (n=6 mice per group). (D) SDHB expression in NCI-H295R cells treated for 2 hr with IL-1β, IL-6, or TNFα (n=5–6). (E) Measurement of ATP/ADP ratio in NCI-H295R cells treated for 24 hr with IL-1β (n=5–6). (F–H) Primary adrenocortical cells were treated for 6 hr with IL-1β and for another 45 min with adrenocorticotropic hormone (ACTH) (10 ng/ml) (n=11–12). Steroid hormones were measured in the culture supernatant by liquid chromatography-tandem mass spectrometry (LC-MS/MS). (I) Western blot analysis for DNMT1 in CD31-CD45- adrenocortical cells 24 hr after injection of PBS (P) or LPS (L) (n=4 mice per group), α-TUBULIN was used as loading control. The asterisk (*) depicts an unspecific band. Quantification of the western blot is shown as relative intensity of DNMT1 to α-TUBULIN. (J) NCI-H295R cells were treated for 2 hr with IL-1β; representative gel electrophoresis images of bisulfite converted and non-treated DNA (M – methylated, U – unmethylated) are shown. The ratio of methylated to unmethylated SDHB promoter was assayed after bisulfite conversion (n=4). (K) NCI-H295R cells were transfected with siDNMT1 or siCtrl and 24 hr post-transfection they were treated for 2 hr with IL-1β. The ratio of methylated to unmethylated SDHB promoter was quantified (n=2–3). (L) Sdhb expression in primary adrenocortical cells transfected with siDnmt1 or siCtrl and 24 hr post-transfection treated for 6 hr with IL-1β (n=8). (M) Primary adrenocortical cells were transfected with siDnmt1 or siCtrl and 6 hr post-transfection they were treated for 18 hr with IL-1β (n=4). Succinate and fumarate were measured by LC-MS/MS. (N) Oxygen consumption rate (OCR) measurement in NCI-H295R cells transfected with siDNMT1 or siCtrl and 24 hr post-transfection treated for 24 hr with IL-1β (n=8). (O–Q) Primary adrenocortical cells were transfected with siDnmt1 or siCtrl, 6 hr post-transfection they were treated for 18 hr with IL-1β and subsequently they were stimulated for 45 min with ACTH (n=7–9). Steroid hormones were measured in the cell culture supernatant by LC-MS/MS. (R) Mice were simultaneously injected with Raleukin or control solution and LPS and 24 hr later SDH activity was measured in isolated adrenal cortices (n=3 mice per group). (S–T) Mice were treated with Raleukin or control solution together with LPS and 24 hr post-injection succinate and fumarate levels were determined in the adrenal glands (n=7 mice per group). (U) Mice were treated with Raleukin or control solution together with LPS and 6 hr later corticosterone plasma levels were determined by LC-MS/MS (n=7 mice per group). Data in (B,D–L,R–U) are presented as mean ± s.d. Statistical analysis was done with Mann-Whitney (B,D,I,J,N,R–U), unpaired t-test (E,K), paired t-test, (M) and Wilcoxon test (F–H,L,O–Q). *p<0.05, **p<0.01. NES: normalized enrichment score. Full unedited blots and gels are available in Figure 6—source data 1 (I,J).
-
Figure 6—source data 1
IL-1β reduces SDHB expression and adrenocortical steroidogenesis in a DNA methyltransferase 1 (DNMT1)-dependent manner.
- https://cdn.elifesciences.org/articles/83064/elife-83064-fig6-data1-v2.zip
Figure 7
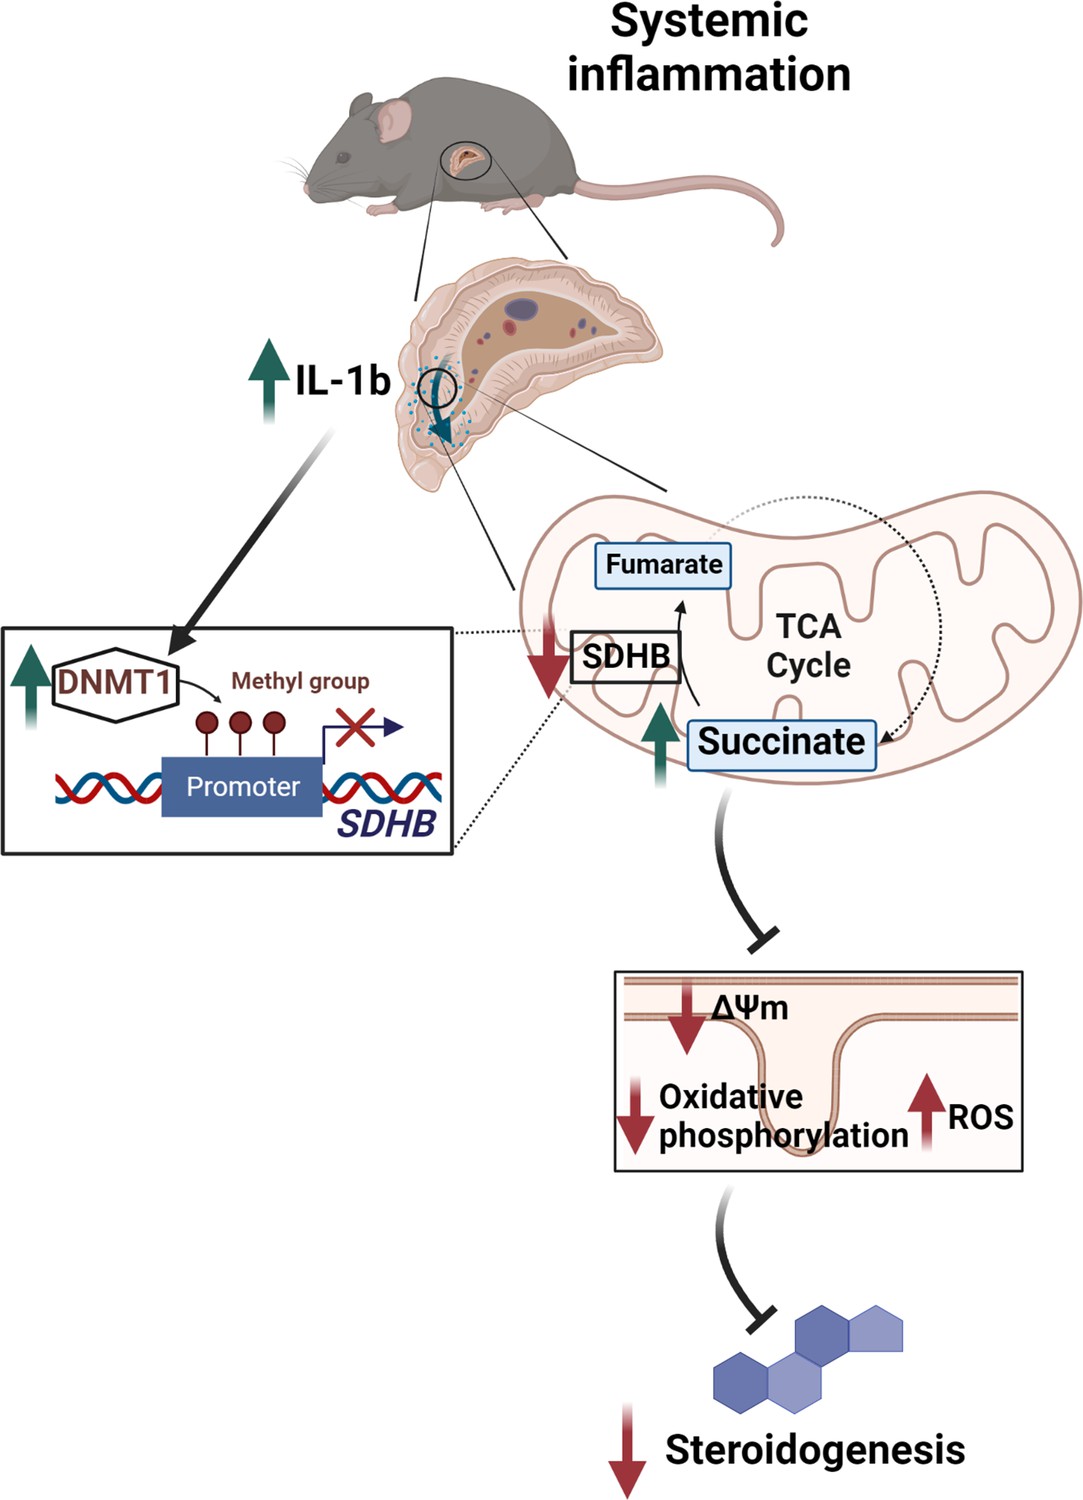
Illustration of the regulation of adrenocortical steroidogenesis by inflammation.
IL-1β reduces SDHB expression through upregulation of DNA methyltransferase 1 (DNMT1) and methylation of the SDHB promoter. Consequently, increased succinate levels impair oxidative phosphorylation and increase ROS production, leading to reduced steroidogenesis.
Author response image 1
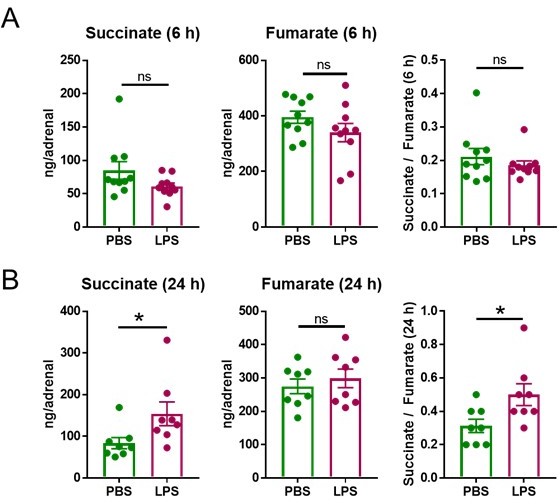
LPS increases the succinate/fumarate ratio at 24 but not 6 h.
Mice were i.p. injected with 1 mg/kg LPS and 6 h (A) and 24 h (B) post-injection succinate and fumarate levels were determined by LC-MS/MS in the adrenal gland. n=8-10; data are presented as mean ± s.e.m. Statistical analysis was done with two-tailed Mann-Whitney test. *p < 0.05.
Author response image 2
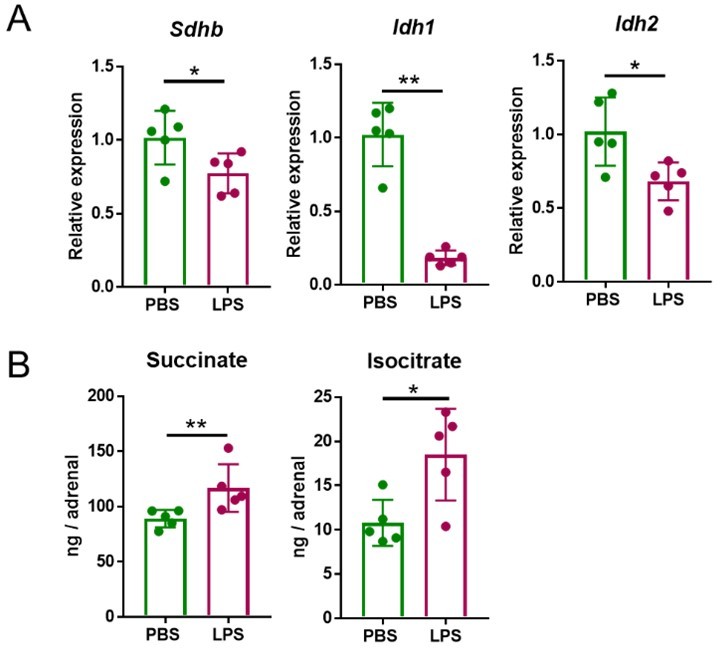
Five mg/kg LPS downregulate Sdhb, Idh1 and Idh2 expression and increase succinate and isocitrate levels in the adrenal gland of mice.
Sdhb, Idh1 and Idh2 expression (A) and succinate and isocitrate levels (B) were assessed in the adrenal gland of mice treated with 5 mg/kg LPS for 4 h (A) and 24 h (B). n=5; data are presented as mean ± s.d. Statistical analysis was done with two-tailed Mann-Whitney test. *p < 0.05, **p < 0.01.
Tables
Table 1
Cellular metabolic pathways transcriptionally regulated by inflammation in the adrenal cortex.
The pathway analysis of differentially expressed genes was done with the software package EGSEA and queried against the KEGG pathways repository. Pathways with p<0.05 are shown.
| ID | Metabolic pathway | Number of expressed genes | p-Value | padj | avg.logfc | Direction |
|---|---|---|---|---|---|---|
| mmu00190 | Oxidative phosphorylation | 132/134 | 8.32E-15 | 7.32E-13 | 0.613034377 | Down |
| mmu00280 | Valine, leucine, and isoleucine degradation | 55/56 | 1.16E-05 | 0.001119154 | 0.725758563 | Down |
| mmu00511 | Other glycan degradation | 18/18 | 3.82E-05 | 0.001119154 | 0.29921956 | Down |
| mmu00980 | Metabolism of xenobiotics by cytochrome P450 | 65/65 | 0.000282456 | 0.006214029 | 0.650304677 | Down |
| mmu00350 | Tyrosine metabolism | 38/39 | 0.001754788 | 0.030884268 | 0.305935415 | Down |
| mmu00640 | Propanoate metabolism | 31/31 | 0.002151447 | 0.031554563 | 0.886410728 | Down |
| mmu00020 | Citrate cycle (TCA cycle) | 32/32 | 0.003091828 | 0.034636464 | 0.21912487 | Down |
| mmu01200 | Carbon metabolism | 118/118 | 0.003685749 | 0.034636464 | 0.715139933 | Down |
| mmu00471 | D-Glutamine and D-glutamate metabolism | 3/3 | 0.003980826 | 0.034636464 | 0.338725016 | Up |
| mmu00300 | Lysine biosynthesis | 2/2 | 0.004518807 | 0.034636464 | 0.156233777 | Down |
| mmu00630 | Glyoxylate and dicarboxylate metabolism | 29/29 | 0.006079126 | 0.034636464 | 0.886410728 | Down |
| mmu00071 | Fatty acid degradation | 49/49 | 0.006124673 | 0.034636464 | 0.401441917 | Down |
| mmu01210 | 2-Oxocarboxylic acid metabolism | 19/19 | 0.006297539 | 0.034636464 | 0.942661129 | Down |
| mmu00920 | Sulfur metabolism | 11/11 | 0.006297539 | 0.034636464 | 0.601864913 | Down |
| mmu00480 | Glutathione metabolism | 58/59 | 0.006297539 | 0.034636464 | 0.550257753 | Down |
| mmu00510 | N-Glycan biosynthesis | 49/49 | 0.006297539 | 0.034636464 | 0.254426968 | Down |
| mmu00450 | Selenocompound metabolism | 17/17 | 0.009115527 | 0.047186259 | 0.329118527 | Up |
| mmu00514 | Other types of O-glycan biosynthesis | 22/22 | 0.010614958 | 0.050693394 | 0.204924928 | Up |
| mmu00440 | Phosphonate and phosphinate metabolism | 6/6 | 0.010945165 | 0.050693394 | 0.291510253 | Up |
| mmu00120 | Primary bile acid biosynthesis | 16/16 | 0.01193422 | 0.052510566 | 2.713591551 | Down |
| mmu00565 | Ether lipid metabolism | 44/44 | 0.016711812 | 0.061724814 | 0.433837026 | Down |
| mmu00520 | Amino sugar and nucleotide sugar metabolism | 49/49 | 0.018212661 | 0.061724814 | 0.652646241 | Down |
| mmu00790 | Folate biosynthesis | 14/14 | 0.01821569 | 0.061724814 | 0.420000237 | Down |
| mmu00230 | Purine metabolism | 174/178 | 0.018793387 | 0.061724814 | 0.830115541 | Down |
| mmu00603 | Glycosphingolipid biosynthesis – globo series | 16/16 | 0.019832034 | 0.061724814 | 0.534287429 | Up |
| mmu00534 | Glycosaminoglycan biosynthesis – heparan sulfate/heparin | 24/24 | 0.020491524 | 0.061724814 | 0.471378176 | Up |
| mmu00270 | Cysteine and methionine metabolism | 46/48 | 0.020959507 | 0.061724814 | 0.601864913 | Down |
| mmu01100 | Metabolic pathways | 1303/1315 | 0.022419002 | 0.061724814 | 0.683947211 | Down |
| mmu00531 | Glycosaminoglycan degradation | 21/21 | 0.023139686 | 0.061724814 | 0.911753864 | Down |
| mmu00604 | Glycosphingolipid biosynthesis – ganglio series | 15/15 | 0.023268716 | 0.061724814 | 0.457285673 | Down |
| mmu00250 | Alanine, aspartate, and glutamate metabolism | 36/37 | 0.023685519 | 0.061724814 | 0.942661129 | Down |
| mmu00240 | Pyrimidine metabolism | 101/104 | 0.024235887 | 0.061724814 | 0.308135641 | Up |
| mmu00130 | Ubiquinone and other terpenoid-quinone biosynthesis | 11/11 | 0.024630584 | 0.061724814 | 0.40991964 | Down |
| mmu00330 | Arginine and proline metabolism | 49/50 | 0.025088792 | 0.061724814 | 0.479554867 | Down |
| mmu00564 | Glycerophospholipid metabolism | 94/94 | 0.025448859 | 0.061724814 | 0.498146256 | Down |
| mmu00910 | Nitrogen metabolism | 17/17 | 0.025782601 | 0.061724814 | 1.765582115 | Up |
| mmu00982 | Drug metabolism – cytochrome P450 | 67/67 | 0.027201304 | 0.061724814 | 0.620562175 | Down |
| mmu00785 | Lipoic acid metabolism | 3/3 | 0.027507553 | 0.061724814 | 0.133403173 | Down |
| mmu00051 | Fructose and mannose metabolism | 35/35 | 0.029679889 | 0.061724814 | 0.652646241 | Down |
| mmu00561 | Glycerolipid metabolism | 59/59 | 0.030468773 | 0.061724814 | 0.4155946 | Down |
| mmu00512 | Mucin type O-glycan biosynthesis | 28/28 | 0.030540327 | 0.061724814 | 0.472458211 | Up |
| mmu00052 | Galactose metabolism | 32/32 | 0.031376559 | 0.061724814 | 0.42838689 | Down |
| mmu01230 | Biosynthesis of amino acids | 78/78 | 0.031800904 | 0.061724814 | 0.942661129 | Down |
| mmu00533 | Glycosaminoglycan biosynthesis – keratan sulfate | 14/14 | 0.031872109 | 0.061724814 | 0.27544313 | Down |
| mmu00900 | Terpenoid backbone biosynthesis | 22/23 | 0.032232321 | 0.061724814 | 0.320850492 | Up |
| mmu00730 | Thiamine metabolism | 15/15 | 0.032265244 | 0.061724814 | 0.323024942 | Down |
| mmu00500 | Starch and sucrose metabolism | 33/33 | 0.033413545 | 0.062178073 | 0.452533726 | Up |
| mmu00770 | Pantothenate and CoA biosynthesis | 18/18 | 0.033915312 | 0.062178073 | 0.307590054 | Down |
| mmu00062 | Fatty acid elongation | 27/27 | 0.035703854 | 0.062200773 | 0.536297353 | Down |
| mmu00592 | Alpha-linolenic acid metabolism | 25/25 | 0.035861114 | 0.062200773 | 0.568488547 | Down |
| mmu00562 | Inositol phosphate metabolism | 70/70 | 0.037060597 | 0.062200773 | 0.197317479 | Up |
| mmu00760 | Nicotinate and nicotinamide metabolism | 34/35 | 0.037777703 | 0.062200773 | 0.44361797 | Down |
| mmu00740 | Riboflavin metabolism | 8/8 | 0.038531607 | 0.062200773 | 0.336638606 | Down |
| mmu00670 | One carbon pool by folate | 19/19 | 0.039807001 | 0.062200773 | 0.293141874 | Up |
| mmu00310 | Lysine degradation | 57/59 | 0.040221284 | 0.062200773 | 0.409052131 | Up |
| mmu00010 | Glycolysis/gluconeogenesis | 66/66 | 0.040372513 | 0.062200773 | 0.4474754 | Down |
| mmu00053 | Ascorbate and aldarate metabolism | 27/27 | 0.040535303 | 0.062200773 | 0.319047565 | Down |
| mmu00030 | Pentose phosphate pathway | 32/32 | 0.040995964 | 0.062200773 | 0.316347941 | Down |
Table 2
Cellular metabolic pathways regulated on protein level by inflammation in adrenocortical cells.
The pathway analysis of differentially expressed proteins was done with the software package EGSEA and queried against the KEGG pathways repository. Pathways with p<0.05 are shown.
| ID | Metabolic pathway | Number of detected proteins | p-Value | padj | avg.logfc | Direction |
|---|---|---|---|---|---|---|
| mmu00534 | Glycosaminoglycan biosynthesis – heparan sulfate/heparin | 4/24 | 1.50E-07 | 1.29E-05 | 0.13 | Up |
| mmu00280 | Valine, leucine, and isoleucine degradation | 37/57 | 5.20E-07 | 2.23E-05 | 0.01 | Down |
| mmu00983 | Drug metabolism – other enzymes | 25/92 | 3.80E-05 | 0.000856142 | 0.02 | Down |
| mmu00562 | Inositol phosphate metabolism | 19/72 | 5.89E-05 | 0.000856142 | 0.03 | Up |
| mmu00260 | Glycine, serine, and threonine metabolism | 19/40 | 6.89E-05 | 0.000856142 | 0.03 | Down |
| mmu00240 | Pyrimidine metabolism | 25/58 | 6.98E-05 | 0.000856142 | 0.04 | Up |
| mmu00982 | Drug metabolism – cytochrome P450 | 16/71 | 7.76E-05 | 0.000856142 | 0.02 | Down |
| mmu00230 | Purine metabolism | 44/133 | 7.96E-05 | 0.000856142 | 0.04 | Up |
| mmu00790 | Folate biosynthesis | 9/26 | 9.75E-05 | 0.000931452 | 0.09 | Up |
| mmu01100 | Metabolic pathways | 593/1608 | 0.000134694 | 0.001151176 | 0.03 | Down |
| mmu00190 | Oxidative phosphorylation | 70/135 | 0.000160368 | 0.001151176 | 0.02 | Down |
| mmu00980 | Metabolism of xenobiotics by cytochrome P450 | 19/73 | 0.000175997 | 0.001151176 | 0.02 | Down |
| mmu01240 | Biosynthesis of cofactors | 74/154 | 0.000178113 | 0.001151176 | 0.04 | Down |
| mmu00730 | Thiamine metabolism | 5/15 | 0.000187401 | 0.001151176 | 0.02 | Down |
| mmu00020 | Citrate cycle (TCA cycle) | 30/32 | 0.00020177 | 0.001156812 | 0.01 | Down |
| mmu01200 | Carbon metabolism | 81/121 | 0.000404805 | 0.002175826 | 0.02 | Down |
| mmu00760 | Nicotinate and nicotinamide metabolism | 11/41 | 0.000459649 | 0.002325283 | 0.04 | Up |
| mmu00860 | Porphyrin and chlorophyll metabolism | 19/43 | 0.000549279 | 0.002624333 | 0.04 | Up |
| mmu00360 | Phenylalanine metabolism | 7/23 | 0.000744591 | 0.003370253 | 0.01 | Up |
| mmu00630 | Glyoxylate and dicarboxylate metabolism | 20/32 | 0.000794408 | 0.003415956 | 0.02 | Down |
| mmu00480 | Glutathione metabolism | 28/72 | 0.001037994 | 0.004250832 | 0.02 | Down |
| mmu00061 | Fatty acid biosynthesis | 12/19 | 0.00119934 | 0.004323466 | 0.04 | Up |
| mmu00052 | Galactose metabolism | 17/32 | 0.001212032 | 0.004323466 | 0.02 | Down |
| mmu00350 | Tyrosine metabolism | 12/40 | 0.001275764 | 0.004323466 | 0.02 | Down |
| mmu00900 | Terpenoid backbone biosynthesis | 8/23 | 0.001283046 | 0.004323466 | 0.01 | Down |
| mmu00140 | Steroid hormone biosynthesis | 12/92 | 0.001307094 | 0.004323466 | 0.02 | Down |
| mmu00511 | Other glycan degradation | 11/18 | 0.001620057 | 0.005160182 | 0.03 | Down |
| mmu00520 | Amino sugar and nucleotide sugar metabolism | 29/51 | 0.001922509 | 0.005904848 | 0.02 | Down |
| mmu00040 | Pentose and glucuronate interconversions | 9/35 | 0.002291756 | 0.006796243 | 0.02 | Down |
| mmu00620 | Pyruvate metabolism | 34/44 | 0.004741112 | 0.013428366 | 0.02 | Down |
| mmu00524 | Neomycin, kanamycin, and gentamicin biosynthesis | 3/5 | 0.004840458 | 0.013428366 | 0.02 | Down |
| mmu00053 | Ascorbate and aldarate metabolism | 9/31 | 0.005220665 | 0.013429037 | 0.01 | Down |
| mmu00830 | Retinol metabolism | 8/97 | 0.005279453 | 0.013429037 | 0.01 | Down |
| mmu00531 | Glycosaminoglycan degradation | 10/21 | 0.005309154 | 0.013429037 | 0.02 | Down |
| mmu00450 | Selenocompound metabolism | 9/17 | 0.006951355 | 0.017080471 | 0.02 | Down |
| mmu00250 | Alanine, aspartate, and glutamate metabolism | 17/39 | 0.007955263 | 0.019004239 | 0.02 | Down |
| mmu01230 | Biosynthesis of amino acids | 45/79 | 0.008873164 | 0.020624111 | 0.02 | Down |
| mmu01212 | Fatty acid metabolism | 40/62 | 0.009336325 | 0.021129578 | 0.03 | Down |
| mmu00500 | Starch and sucrose metabolism | 14/34 | 0.011170016 | 0.024631316 | 0.02 | Down |
| mmu00514 | Other types of O-glycan biosynthesis | 15/43 | 0.011876496 | 0.025349557 | 0.04 | Up |
| mmu01210 | 2-Oxocarboxylic acid metabolism | 11/20 | 0.01227639 | 0.025349557 | 0.01 | Down |
| mmu00650 | Butanoate metabolism | 13/28 | 0.012404185 | 0.025349557 | 0.01 | Down |
| mmu00670 | One carbon pool by folate | 9/19 | 0.012674778 | 0.025349557 | 0.05 | Down |
| mmu00310 | Lysine degradation | 20/64 | 0.01401052 | 0.027384197 | 0.02 | Down |
| mmu00590 | Arachidonic acid metabolism | 9/86 | 0.015253177 | 0.029150517 | 0.01 | Down |
| mmu00770 | Pantothenate and CoA biosynthesis | 8/21 | 0.016632522 | 0.031095584 | 0.02 | Down |
| mmu00592 | Alpha-linolenic acid metabolism | 3/25 | 0.017819371 | 0.032605657 | 0.03 | Up |
| mmu00780 | Biotin metabolism | 3/3 | 0.018650597 | 0.033415653 | 0.01 | Down |
| mmu00640 | Propanoate metabolism | 25/31 | 0.020182799 | 0.035173564 | 0.02 | Down |
| mmu00290 | Valine, leucine, and isoleucine biosynthesis | 2/4 | 0.02053428 | 0.035173564 | 0.02 | Down |
| mmu00920 | Sulfur metabolism | 7/11 | 0.021206387 | 0.035173564 | 0.02 | Down |
| mmu00062 | Fatty acid elongation | 15/19 | 0.021267736 | 0.035173564 | 0.02 | Down |
| mmu00604 | Glycosphingolipid biosynthesis – ganglio series | 5/15 | 0.022065753 | 0.035804807 | 0.02 | Down |
| mmu00563 | Glycosylphosphatidylinositol (GPI)-anchor biosynthesis | 8/26 | 0.023553511 | 0.036186307 | 0.04 | Down |
| mmu00750 | Vitamin B6 metabolism | 3/9 | 0.023553511 | 0.036186307 | 0.03 | Up |
| mmu00220 | Arginine biosynthesis | 7/20 | 0.024245413 | 0.036186307 | 0.02 | Down |
| mmu00270 | Cysteine and methionine metabolism | 29/53 | 0.025410276 | 0.036186307 | 0.03 | Up |
| mmu00051 | Fructose and mannose metabolism | 17/36 | 0.02551991 | 0.036186307 | 0.04 | Down |
| mmu00071 | Fatty acid degradation | 30/52 | 0.025667032 | 0.036186307 | 0.02 | Down |
| mmu00330 | Arginine and proline metabolism | 23/54 | 0.025667032 | 0.036186307 | 0.02 | Down |
| mmu00561 | Glycerolipid metabolism | 23/62 | 0.025667032 | 0.036186307 | 0.03 | Down |
| mmu00010 | Glycolysis/gluconeogenesis | 40/67 | 0.050728869 | 0.068166917 | 0.02 | Down |
| mmu00030 | Pentose phosphate pathway | 17/33 | 0.050728869 | 0.068166917 | 0.03 | Down |
| mmu00410 | Beta-alanine metabolism | 19/32 | 0.050728869 | 0.068166917 | 0.01 | Down |
Table 3
ROS pathways are transcriptionally upregulated in the adrenal cortex of LPS-treated mice.
The pathway analysis of differentially expressed genes was done with the software package EGSEA and queried against the GO gene sets repository. Pathways with padj. <0.05 are shown.
| ID | Gene set | Number of expressed genes | p-Value | padj | avg.logfc | Direc tion |
|---|---|---|---|---|---|---|
| M13446 | GO Regulation of reactive oxygen species metabolic process | 271/275 | 3.75E-08 | 1.26E-06 | 1.0100 | Up |
| M13580 | GO Positive regulation of reactive oxygen species metabolic process | 182/186 | 2.33E-07 | 6.26E-06 | 1.0100 | Up |
| M16953 | GO Response to reactive oxygen species | 300/317 | 0.003422132 | 0.009035375 | 0.8600 | Up |
| M16581 | GO Cellular response to reactive oxygen species | 173/177 | 0.002537297 | 0.009035375 | 0.7600 | Up |
| M10618 | GO Negative regulation of response to reactive oxygen species | 24/24 | 0.0072384 | 0.010942115 | 0.7100 | Up |
| M15379 | GO Regulation of reactive oxygen species biosynthetic process | 145/148 | 5.90E-05 | 0.000770609 | 0.7000 | Up |
| M10827 | GO Positive regulation of reactive oxygen species biosynthetic process | 120/123 | 0.000465606 | 0.00454261 | 0.7000 | Up |
| M15990 | GO Reactive oxygen species metabolic process | 163/167 | 0.008936465 | 0.012568942 | 0.6700 | Up |
| M16764 | GO Regulation of response to reactive oxygen species | 43/43 | 0.006753207 | 0.010498628 | 0.6200 | Down |
| M16007 | GO Negative regulation of reactive oxygen species biosynthetic process | 23/23 | 0.016434387 | 0.020274996 | 0.6000 | Up |
| M12185 | GO Reactive oxygen species biosynthetic process | 32/33 | 0.006483259 | 0.01024232 | 0.5700 | Down |
| M10894 | GO Negative regulation of reactive oxygen species metabolic process | 59/59 | 0.006538654 | 0.010287661 | 0.5500 | Up |
Table 4
ROS-related protein expression is upregulated in the adrenal cortex of LPS-treated mice.
The pathway analysis of differentially expressed proteins was done with the software package EGSEA and queried against the GO gene sets repository. Pathways with padj. <0.05 are shown.
| ID | Protein set | Number of detected proteins | p-Value | padj | avg.logfc | Direc-tion |
|---|---|---|---|---|---|---|
| M13446 | GO REGULATION OF REACTIVE OXYGEN SPECIES METABOLIC PROCESS | 62/275 | 6.30E-06 | 0.00012401 | 0.03 | Up |
| M15379 | GO REGULATION OF REACTIVE OXYGEN SPECIES BIOSYNTHETIC PROCESS | 34/148 | 9.43E-06 | 0.00014372 | 0.03 | Up |
| M13580 | GO POSITIVE REGULATION OF REACTIVE OXYGEN SPECIES METABOLIC PROCESS | 29/186 | 1.11E-05 | 0.00015778 | 0.03 | Up |
| M10827 | GO POSITIVE REGULATION OF REACTIVE OXYGEN SPECIES BIOSYNTHETIC PROCESS | 20/123 | 1.17E-05 | 0.00016203 | 0.03 | Up |
| M10894 | GO NEGATIVE REGULATION OF REACTIVE OXYGEN SPECIES METABOLIC PROCESS | 23/59 | 5.29E-05 | 0.00037856 | 0.05 | Down |
| M16007 | GO NEGATIVE REGULATION OF REACTIVE OXYGEN SPECIES BIOSYNTHETIC PROCESS | 12/23 | 0.00014126 | 0.00073167 | 0.07 | Up |
| M16581 | GO CELLULAR RESPONSE TO REACTIVE OXYGEN SPECIES | 50/177 | 0.00015378 | 0.00077551 | 0.03 | Down |
| M15990 | GO REACTIVE OXYGEN SPECIES METABOLIC PROCESS | 35/167 | 0.00037436 | 0.00150479 | 0.02 | Down |
| M16953 | GO RESPONSE TO REACTIVE OXYGEN SPECIES | 83/317 | 0.00076076 | 0.00262274 | 0.03 | Up |
| M12185 | GO REACTIVE OXYGEN SPECIES BIOSYNTHETIC PROCESS | 9/33 | 0.00192844 | 0.00545214 | 0.02 | Down |
Key resources table
| Reagent type (species) or resource | Designation | Source or reference | Identifiers | Additional information |
|---|---|---|---|---|
| Gene (Mus musculus) | C57BL/6J | The Jackson Laboratory | Stock#000664 RRID:MGI:3028467 | |
| Gene (Mus musculus) | C57BL/6NJ-Acod1em1(IMPC)J/J | The Jackson Laboratory | Strain #:029340 RRID:IMSR_JAX:029340 | |
| Cell line (Homo sapiens) | NCI-H295R | ATCC | CRL-2128 | |
| Chemical compound, drug | Ultrapure LPS, E. coli 0111:B4 | InVivoGen | tlrl-3pelps | For in vivo |
| Chemical compound, drug | Raleukin | MedChemExpress | Art. -Nr.: HY-108841 | |
| Chemical compound, drug | Ultrapure lipopolysaccharide from E. coli K12 | InVivoGen | tlrl-peklps | For in vitro |
| Chemical compound, drug | DMM | Sigma-Aldrich | 136441 | |
| Chemical compound, drug | DES | Sigma-Aldrich | 112402 | |
| Chemical compound, drug | FCCP | Agilent Technologies | Seahorse XFp Cell Mito Stress Test Kit 103010-100 | |
| Chemical Compound, drug | Oligomycin | Agilent Technologies | Seahorse XFp Cell Mito Stress Test Kit 103010-100 | |
| Chemical compound, drug | Enasidenib (AG-221) | Selleckchem | S8205 | |
| Chemical compound, drug | 4-Octyl-itaconate | Cayman Chemical | 25374 | |
| Chemical compound, drug | Trolox | Abcam | ab120747 | |
| Peptide, recombinant protein (human) | IL-1β | PeproTech | 200-01B | |
| Peptide, recombinant protein (mouse) | IL-1β | PeproTech | 211-11B | |
| Peptide, recombinant protein (human) | IL-6 | PeproTech | 200-06 | |
| Peptide, recombinant protein (human) | TNFα | PeproTech | 300-01A | |
| Peptide, recombinant protein (mouse) | ACTH | Sigma-Aldrich | A0298 | |
| Chemical compound, drug | Forskolin | Sigma-Aldrich | F3917 | |
| Transfected construct (human) | siRNA to SDHB (ON-TARGETplus siRNA SMARTpool) | Dharmacon/Thermo Fisher Scientific | L-011773-02-0005 | |
| Transfected construct (human) | siRNA to DNMT1 (ON-TARGETplus siRNA SMARTpool) | Dharmacon/Thermo Fisher Scientific | L-004605-00-0005 | |
| Transfected construct (mouse) | siRNA to Sdhb (ON-TARGETplus siRNA SMARTpool) | Dharmacon/Thermo Fisher Scientific | L-042339-01-0005 | |
| Transfected construct (mouse) | siRNA to Dnmt1 (ON-TARGETplus siRNA SMARTpool) | Dharmacon/Thermo Fisher Scientific | L-056796-01-0005 | |
| Sequence-based reagent | See Table 5 | This paper | qPCR primers | See Table 5 |
| Antibody | Anti-SDHB (Rabbit polyclonal) | Sigma-Aldrich | HPA002868 | 1:1000 for WB 1:300 for IF |
| Antibody | anti-IDH2 (Rabbit polyclonal) | Sigma-Aldrich | HPA007831 | 1:50 for IF |
| Antibody | Anti-DNMT1 (Rabbit monoclonal) | Cell Signaling | #5032 | 1:1000 |
| Antibody | Anti-Tubulin (Mouse monoclonal) | Sigma-Aldrich | T5186 | 1:3000 |
| Antibody | Anti-β-Actin (Rabbit polyclonal) | Cell Signaling | #4967 | 1:1000 |
| Antibody | Anti-SF-1 (Mouse monoclonal) | TransGenic Inc | KO610 | 1:100 |
| Commercial assay or kit | ATP measurement | Abcam | ab83355 | |
| Commercial assay or kit | ATP/ADP measurement | Sigma-Aldrich | MAK135 | |
| Commercial assay or kit | DCFDA/H2DCFDA Cellular ROS Detection Assay Kit | Abcam | ab113851 | |
| Commercial assay or kit | NADP/NADPH Assay | Abcam | ab176724 | |
| Commercial assay or kit | SDH activity | Sigma-Aldrich | MAK197 | |
| Commercial assay or kit | IDH activity | Abcam | ab102528 | |
| Commercial assay or kit | Seahorse XFp Cell Mito Stress Test Kit | Agilent Technologies | 103010-100 | |
| Commercial assay or kit | EZ DNA Methylation Kit | Zymo Research | D5001 | |
| Software, algorithm | ImageJ software | ImageJ (http://imagej.nih.gov/ij/) | RRID:SCR_003070 | |
| Software, algorithm | GraphPad Prism 7.04 software | GraphPad Prism (https://graphpad.com) | RRID:SCR_015807 | |
| Software, algorithm | Morpheus | Broad Institute | https://software.broadinstitute.org/morpheus/ | |
| Software, algorithm | STAR Aligner | Dobin et al., 2013 | ||
| Software, algorithm | Mouse Genome version GRCm38 (release M12 GENCODE) | Anders et al., 2015 | ||
| Software, algorithm | DESeq2_1.8.1 | Anders and Huber, 2010 | ||
| Software, algorithm | ggplot2_1.0.1 | Wickham, 2009 | ||
| Software, algorithm | GSEA | Subramanian et al., 2005 | ||
| Software, algorithm | EGSEA | Alhamdoosh et al., 2017 | ||
| Software, algorithm | Mass Spectrometry Downstream Analysis Pipeline (MS-DAP) (version beta 0.2.5.1) (https://github.com/ftwkoopmans/msdap) | Hondius et al., 2021 | ||
| Software, algorithm | R/Bioconductor, ‘impute’ command running of ‘DEP’ | Zhang et al., 2018 | ||
| Other | TMRE | Thermo Fisher | T669 | 2.5 μM for dissociated adrenocortical cells, 100 nM for NCI-H295R cells |
| Other | Mitotracker Green | Thermo Fisher | M7514 | 0.25 μM for dissociated adrenocortical cells, 100 nM for NCI-H295R cells |
| Other | DAPI stain | Roche, Sigma-Aldrich | 10236276001 | 1:10,000 |
| Other | Lectin Esculentum DyLight488 | Vector Laboratories | DL-1174 | 1:300 |
| Other | 4-Hydroxynonenal | Abcam | ab48506 | 1:200 |
Table 5
Primer sequences.
| Gene name | Forward sequence (5’ → 3’) | Reverse sequence (5’ → 3’) |
|---|---|---|
| Mouse 18S rRNA | GTTCCGACCATAAACGATGCC | TGGTGGTGCCCTTCCGTCAAT |
| Mouse Idh1 | GTGGTGGAGATGCAAGGAGAT | TGGTCATTGGTGGCATCACG |
| Mouse Idh2 | GATGGACGGTGACGAGATGAC | GGTCTGGTCACGGTTTGGA |
| Mouse Sdhb | GGACCTCAGCAAAGTCTCCAA | TGCAGATACTGTTGCTTGCC |
| Mouse Sdhc | GCTAAGGAGGAGATGGAGCG | AGAGACCCCTCCACTCAAGG |
| Mouse Star | CTGTCCACCACATTGACCTG | CAGCTATGCAGTGGGAGACA |
| Mouse Cyp11b1 | TCACCATGTGCTGAAATCCTTCCA | GGAAGAGAAGAGAGGGCAATGTGT |
| Mouse Hsd3b2 | GCGGCTGCTGCACAGGAATAAAG | TCACCAGGCAGCTCCATCCA |
| Mouse Cyp21a1 | TGGGGATGCAAGATGTGGTGGT | GGTCGGCCAGCAAAGTCCAC |
| Mouse Cyp11a1 | GGATGCTGGAGGAGATCGT | GAAGTCTGGAGGCAGGTTGA |
| Mouse Cd31 | TGCAGGAGTCCTTCTCCACT | ACGGTTTGATTCCACTTTGC |
| Mouse Cd45 | CCAGTCATGCTACCACAACG | TGGACATCTTTGAGGTCTGCC |
| Mouse Th | AAGGGCCTCTATGCTACCCA | GCCAGTCCGTTCCTTCAAGA |
| Mouse Pnmt | GCATCACATCACCACACTGC | CGGACCTCGTAACCACCAAG |
| Mouse Acod1 | CTCCCACCGACATATGCTGC | GCTTCCGATAGAGCTGTGA |
| Mouse Il1r1 | TGGAAGTCTTGTGTGCCCTT | TCCGAAGAAGCTCACGTTGT |
| Mouse Dnmt1 | CTGGAAGAGGTAACAGCGGG | CGTCCAAGTGAGTTTCCGGT |
| Human 18S | TGCCCTATCAACTTTCGATG | GATGTGGTAGCCGTTTCTCA |
| Human SDHB | CAAGGCTGGAGACAAACCTCA | GGGTGCAAGCTAGAGTGTTG |
| Human DNMT1 | GGAGGGCTACCTGGCTAAAG | CTGCCATTCCCACTCTACGG |
| Human methylated SDHB promoter | AGTGGGTCCTCAGTGGATGTA | GGCGATAGTTTGGTGGCAGA |
| Human unmethylated SDHB promoter | CGCGATGTTCGACGGGATA | CTTCACACCCCGCAAATCTC |
Additional files
Download links
A two-part list of links to download the article, or parts of the article, in various formats.
Downloads (link to download the article as PDF)
Open citations (links to open the citations from this article in various online reference manager services)
Cite this article (links to download the citations from this article in formats compatible with various reference manager tools)
Succinate mediates inflammation-induced adrenocortical dysfunction
eLife 12:e83064.
https://doi.org/10.7554/eLife.83064


