FGF21 protects against hepatic lipotoxicity and macrophage activation to attenuate fibrogenesis in nonalcoholic steatohepatitis
- Department of Medicine, Division of Endocrinology, Leiden University Medical Center, Netherlands
- Einthoven Laboratory for Experimental Vascular Medicine, Leiden University Medical Center, Netherlands
- Department of Parasitology, Leiden University Medical Center, Netherlands
- Department of Cell and Chemical Biology, Leiden University Medical Center, Netherlands
- Department of Gastroenterology and Hepatology, Leiden University Medical Center, Netherlands
- Bioscience Metabolism, Research and Early Development, Cardiovascular, Renal and Metabolism (CVRM), BioPharmaceuticals R&D, AstraZeneca, Sweden
- Biologics Engineering and Targeted Delivery, Oncology R&D, AstraZeneca, United States
- Bioscience Metabolism, Research and Early Development, Cardiovascular, Renal and Metabolism (CVRM), BioPharmaceuticals R&D, AstraZeneca, United States
- Med-X institute, Center for Immunological and Metabolic Diseases, and Department of Endocrinology, First Affiliated Hospital of Xi'an Jiaotong University, Xi'an Jiaotong University, China
Figures
Figure 1
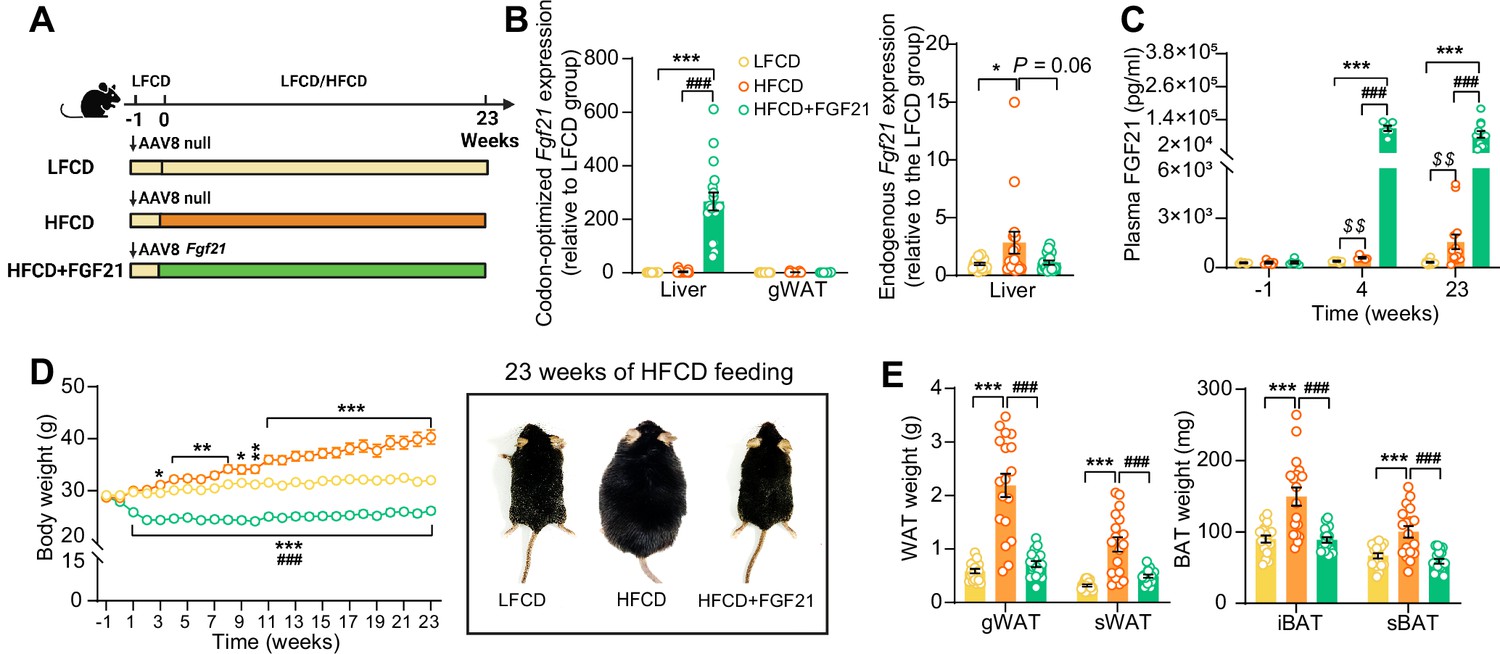
Liver-specific FGF21 overexpression increases circulating FGF21 levels and protects against HFCD-induced body fat mass gain.
(A) Experimental setup. (B) At week 23, codon-optimized FGF21 mRNA expression in the liver and gWAT was quantified (n=16 –18), and endogenous Fgf21 expression in the liver was also measured (n=16–18). (C) Plasma FGF21 levels were measured before (at week –1; pooled samples, n=6 per group) and after (at week 4, pooled samples, n=6 per group; week 23, n=12–16 per group) AAV8-Fgf21 administration. (D) Body weight was monitored throughout the experimental period (n=17–18). (E) At week 23, brown adipose tissue (BAT) and white adipose tissue (WAT) depots were isolated and weighed (n=18). Data are shown as mean ± SEM. Differences were assessed using one-way ANOVA followed by a Tukey’s post test. *p<0.05, **p<0.01, ***p<0.001, compared with the LFCD group. ###p<0.001, compared with the HFCD group. (C) Differences between the LFCD and HFCD groups were assessed using Student’s t test. $$p<0.01, compared the LFCD group. AAV8, adeno-associated virus 8; FGF21, fibroblast growth factor 21; gWAT, gonadal WAT; HFCD, high-fat and high-cholesterol diet; iBAT, interscapular BAT; LFCD, low-fat and low-cholesterol diet; sBAT, subscapular BAT; sWAT, subcutaneous WAT.
-
Figure 1—source data 1
Liver-specific FGF21 overexpression increases circulating FGF21 levels and protects against HFCD-induced body fat mass gain.
- https://cdn.elifesciences.org/articles/83075/elife-83075-fig1-data1-v2.xlsx
Figure 2 with 1 supplement
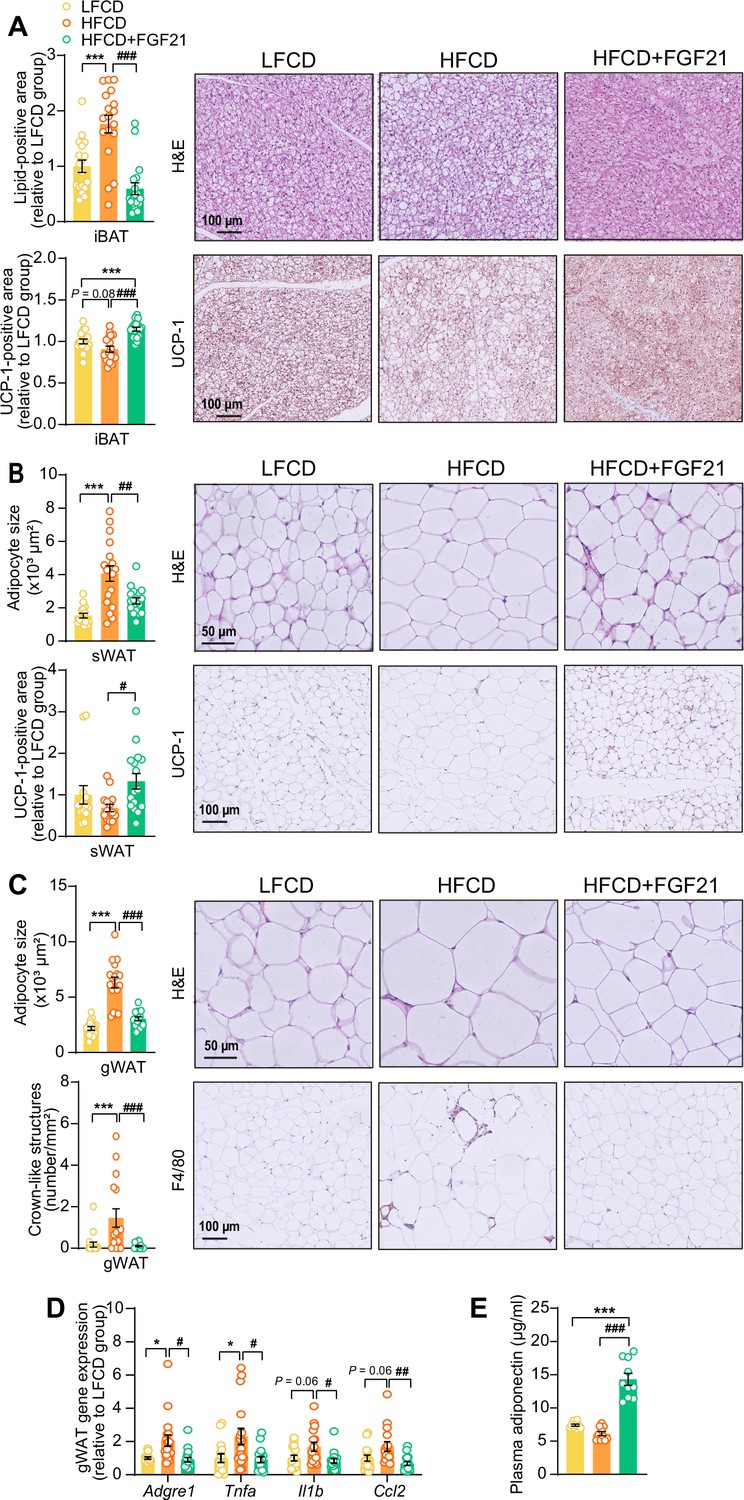
Fibroblast growth factor 21 (FGF21) protects against high-fat high-cholesterol diet (HFCD)-induced adipose tissue dysfunction.
(A) In interscapular brown adipose tissue (iBAT), the lipid content and expression of uncoupling protein-1 (UCP-1) were quantified after hematoxylin-eosin (H&E) staining and UCP-1 immunostaining, respectively. (B) In subcutaneous white adipose tissue (sWAT), the adipocyte enlargement was assessed by H&E staining, and the tissue browning was evaluated by UCP-1 immunostaining. (C) In gonadal white adipose tissue (gWAT), the adipocyte hypertrophy was detected, and the number of crown-like structures (CLSs) was assessed, and (D) mRNA expression of pro-inflammatory markers was quantified. (E) Plasma adiponectin concentration in fasted blood plasma was measured at week 22. (A–D) n=14–18 per group; (E) n=10 per group. Differences were assessed using one-way ANOVA followed by a Tukey’s post test. *p<0.05, ***p<0.001, compared with the low-fat low-cholesterol diet (LFCD) group. #p<0.05, ##p<0.01, ###p<0.001, compared with the HFCD group. Adgre1, adhesion G protein-coupled receptor E1; Tnfa, tumor necrosis factor α; Il1b, interleukin-1β; Ccl2, chemokine C–C motif ligand 2.
-
Figure 2—source data 1
Fibroblast growth factor 21 (FGF21) protects against high-fat high-cholesterol diet (HFCD)-induced adipose tissue dysfunction.
- https://cdn.elifesciences.org/articles/83075/elife-83075-fig2-data1-v2.xlsx
Figure 2—figure supplement 1

Liver-specific fibroblast growth factor 21 (FGF21) overexpression tends to upregulate mRNA expression of FGF21 receptor 1 (FGFR1) and co-receptor β-Klotho (KLB) in white adipose tissue (WAT).
The mRNA expression of KLB and FGFR1 in gonadal WAT (gWAT). Data are shown as mean ± SEM (n=16–18 per group). Differences were assessed using one-way ANOVA followed by a Tukey’s post test.
-
Figure 2—figure supplement 1—source data 1
Liver-specific fibroblast growth factor 21 (FGF21) overexpression tends to upregulate mRNA expression of FGF21 receptor 1 (FGFR1) and co-receptor β-Klotho (KLB) in white adipose tissue (WAT).
- https://cdn.elifesciences.org/articles/83075/elife-83075-fig2-figsupp1-data1-v2.xlsx
Figure 3 with 1 supplement

Fibroblast growth factor 21 (FGF21) alleviates high-fat high-cholesterol diet (HFCD)-induced hyperglycemia and hypertriglyceridemia.
(A) Fasting plasma glucose levels were measured during the experimental period. (B) At week 16, an intraperitoneal glucose tolerance test (IPGTT) was initiated. (B) The area under the curve (AUC) of plasma glucose during the IPGTT and (C) plasma insulin concentration in response to the IPGTT was determined at the indicated timepoints. (C) Homeostasis model assessment of insulin resistance (HOMA-IR) was determined from fasting glucose and insulin levels. (D) Fasting plasma triglyceride (TG) levels were measured throughout the study. The distribution of triglyceride over lipoproteins was determined (pooled samples; n=5 per group) from plasma of week 22. (E) At week 20, an oral lipid tolerance test (OLTT) was initiated, and AUC of plasma TG during the OLTT was calculated. (A and D) n=14–18 per group; (B–C) n=7–8 per group; (E) n=6–9 per group. Data are shown as mean ± SEM. Differences were assessed using one-way ANOVA followed by a Tukey’s post test. *p<0.05, **p<0.01, ***p<0.001, compared with the low-fat low-cholesterol diet (LFCD) group. #p<0.05, ##p<0.01, ###p<0.001, compared with the HFCD group.
-
Figure 3—source data 1
Fibroblast growth factor 21 (FGF21) alleviates high-fat high-cholesterol diet (HFCD)-induced hyperglycemia and hypertriglyceridemia.
- https://cdn.elifesciences.org/articles/83075/elife-83075-fig3-data1-v2.xlsx
Figure 3—figure supplement 1
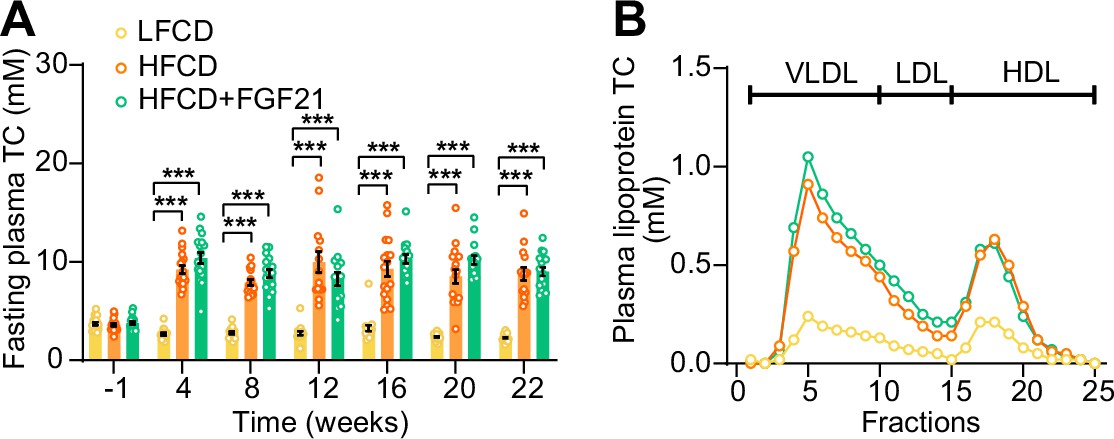
High-fat high-cholesterol diet (HFCD) increases fasting cholesterol levels.
(A) Fasting plasma total cholesterol (TC) levels were measured over a 23-week intervention period (n=14–18 per group), and (B) the distribution of the cholesterol over circulating lipoproteins was assessed at week 22 (pooled samples; n=18 per group). Data are shown as mean ± SEM. Differences were assessed using one-way ANOVA followed by a Tukey’s post test. ***p<0.001, compared with the low-fat low-cholesterol diet (LFCD) group. VLDL, very low-density lipoprotein; LDL, low-density lipoprotein; HDL, high-density lipoprotein.
-
Figure 3—figure supplement 1—source data 1
High-fat high-cholesterol diet (HFCD) increases fasting cholesterol levels.
- https://cdn.elifesciences.org/articles/83075/elife-83075-fig3-figsupp1-data1-v2.xlsx
Figure 4 with 1 supplement
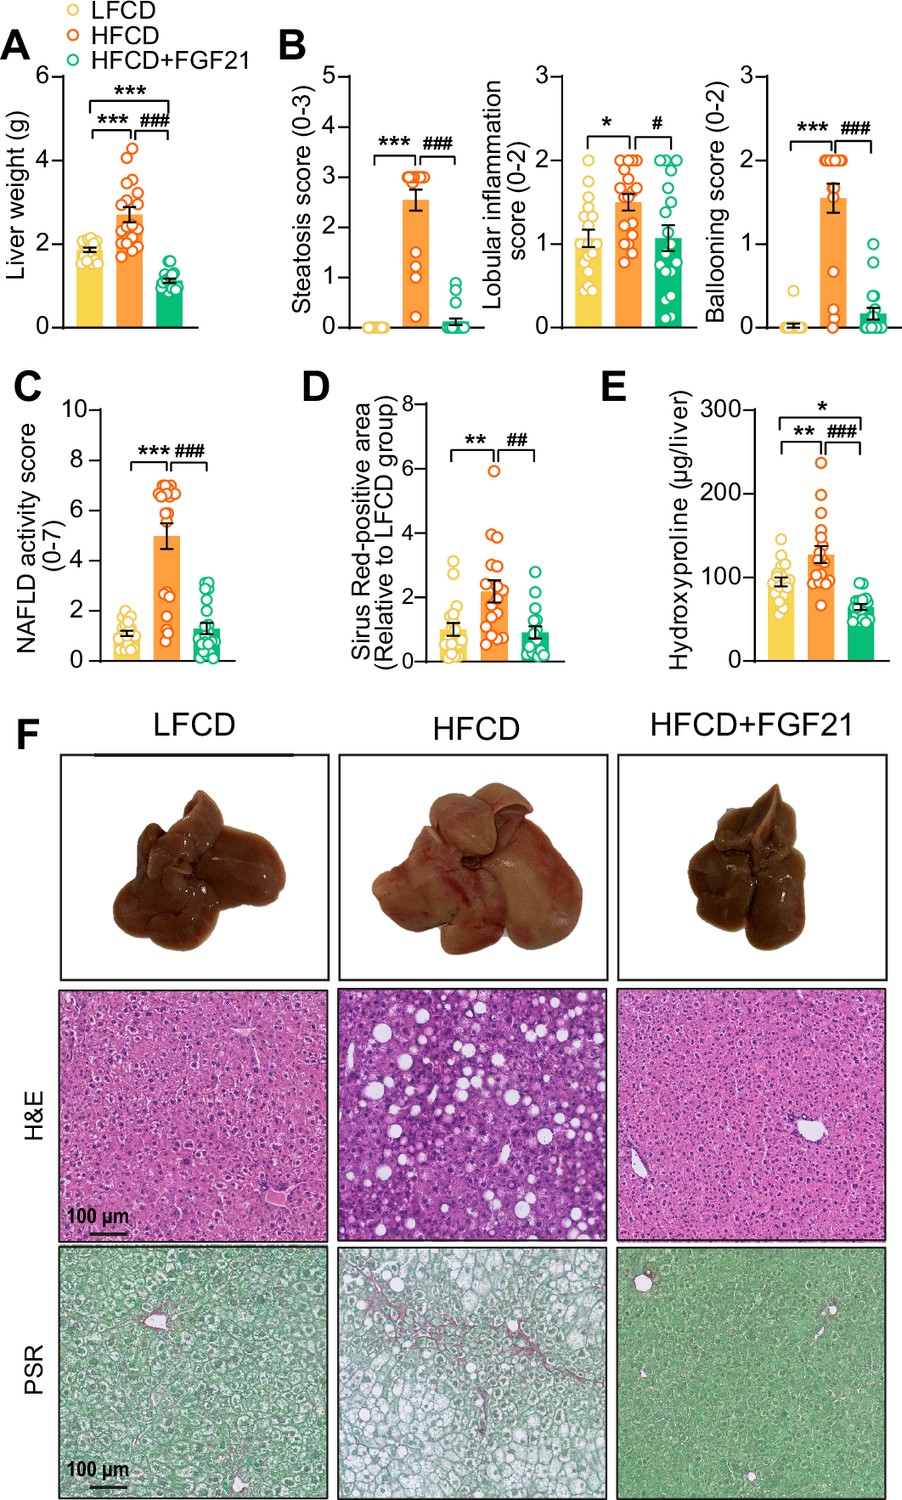
Fibroblast growth factor 21 (FGF21) protects against high-fat high-cholesterol diet (HFCD)-induced hepatic steatosis, inflammation, and fibrosis.
(A) At week 23, liver weight was determined, and (B) scoring of histological features of steatosis, lobular inflammation, and ballooning as well as (C) nonalcoholic fatty liver disease (NAFLD) activity was evaluated by hematoxylin-eosin (H&E) staining. (D) Liver fibrosis was assessed by Picrosirius Red (PSR) staining, and (E) hepatic hydroxyproline levels were determined. (F) Representative macroscopic, H&E, and PSR pictures are shown. Data are shown as mean ± SEM (n=16–18 per group). Differences were assessed using one-way ANOVA followed by a Tukey’s post test. *p<0.05; **p<0.01, ***p<0.001, compared with the low-fat low-cholesterol diet (LFCD) group. ##p<0.01; ###p<0.001, compared with the HFCD group.
-
Figure 4—source data 1
Fibroblast growth factor 21 (FGF21) protects against high-fat high-cholesterol diet (HFCD)-induced hepatic steatosis, inflammation, and fibrosis.
- https://cdn.elifesciences.org/articles/83075/elife-83075-fig4-data1-v2.xlsx
Figure 4—figure supplement 1
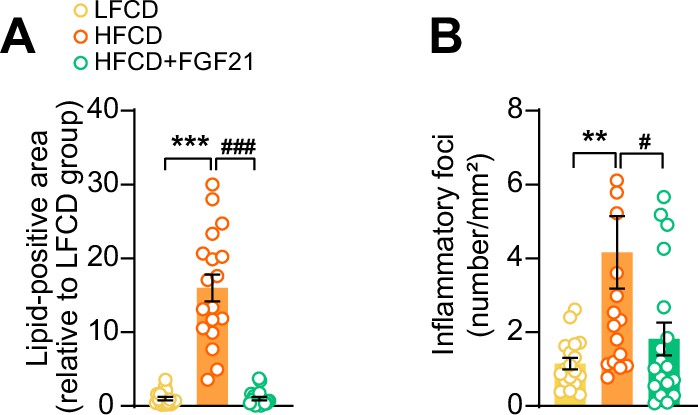
Fibroblast growth factor 21 (FGF21) abolishes high-fat high-cholesterol diet (HFCD)-induced increase of hepatic lipid-positive area and the number of inflammatory foci.
At week 23, (A) hepatic lipid droplet content and (B) inflammatory foci numbers were assessed by hematoxylin-eosin (H&E) staining. Data are shown as mean ± SEM (n=18 per group). Differences were assessed using one-way ANOVA followed by a Tukey’s post test. **p<0.01, ***p<0.001, compared with the low-fat low-cholesterol diet (LFCD) group. #p<0.01 ###p<0.001, compared with the HFCD group.
-
Figure 4—figure supplement 1—source data 1
Fibroblast growth factor 21 (FGF21) abolishes high-fat high cholesterol diet (HFCD)-induced increase of hepatic lipid-positive area and the number of inflammatory foci.
- https://cdn.elifesciences.org/articles/83075/elife-83075-fig4-figsupp1-data1-v2.xlsx
Figure 5 with 2 supplements
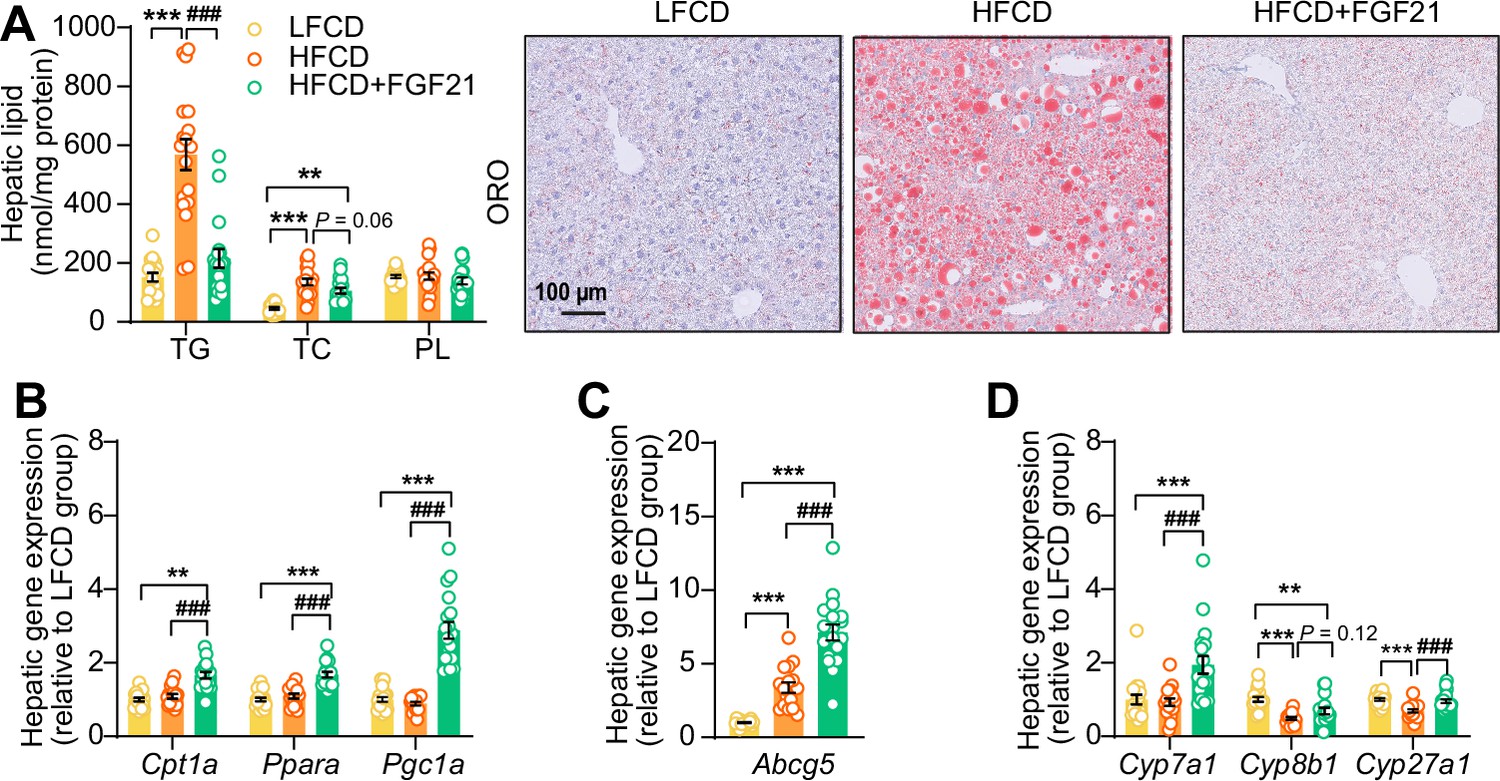
Fibroblast growth factor 21 (FGF21) abolishes liver lipotoxicity, accompanied by activation of hepatic signaling involved in fatty acid (FA) oxidation and cholesterol removal.
(A) Triglyceride (TG), total cholesterol (TC), and phospholipid (PL) levels were determined in the liver (n=18 per group), and representative Oil Red O (ORO) pictures are shown. (B) The relative mRNA expression of genes involved in fatty acid oxidation and (C and D) cholesterol removal (n=15–18 per group) were determined in the liver. Data are shown as mean ± SEM. Differences were assessed using one-way ANOVA followed by a Tukey’s post test. **p<0.01, ***p<0.001, compared with the low-fat low-cholesterol diet (LFCD) group. ###p<0.001, compared with the high-fat high-cholesterol diet (HFCD) group. Abcg5, ATP-binding cassette transporter G member 5; Cpt1a, carnitine palmitoyl transferase 1α; Cyp7a1, cholesterol 7α-hydroxylase; Cyp8b1, sterol 12α-hydroxylase; Cyp27a1, sterol 27-hydroxylase; Pgc1a, peroxisome proliferator-activated receptor gamma coactivator 1α; Ppara, peroxisome proliferator-activated receptor α.
-
Figure 5—source data 1
Fibroblast growth factor 21 (FGF21) abolishes liver lipotoxicity, accompanied by activation of hepatic signaling involved in fatty acid (FA) oxidation and cholesterol removal.
- https://cdn.elifesciences.org/articles/83075/elife-83075-fig5-data1-v2.xlsx
Figure 5—figure supplement 1
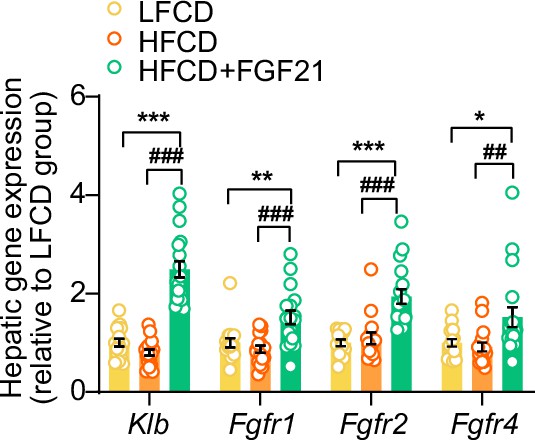
Liver-specific fibroblast growth factor 21 (FGF21) overexpression upregulates hepatic mRNA expression of FGF21 receptors (FGFRs) and co-receptor β-Klotho (KLB).
The mRNA levels of KLB and FGFRs in the liver. Data are shown as mean ± SEM (n=14–18 per group). Differences were assessed using one-way ANOVA followed by a Tukey’s post test. *p<0.05, **p<0.01, ***p<0.001, compared with the low-fat low-cholesterol diet (LFCD) group. ##p<0.01, ###p<0.001, compared with the high-fat high-cholesterol diet (HFCD) group.
-
Figure 5—figure supplement 1—source data 1
Liver-specific fibroblast growth factor 21 (FGF21) overexpression upregulates hepatic mRNA expression of FGF21 receptors (FGFRs) and co-receptor β-Klotho (KLB).
- https://cdn.elifesciences.org/articles/83075/elife-83075-fig5-figsupp1-data1-v2.xlsx
Figure 5—figure supplement 2

Fibroblast growth factor 21 (FGF21) increases apolipoprotein B mRNA (Apob) expression in the liver.
At end of the study, hepatic expression of genes involved in (A) fatty acid uptake and (B) very low-density lipoprotein (VLDL) production was quantified (n=15–18 per group). Data are shown as mean ± SEM. Differences were assessed using one-way ANOVA followed by a Tukey’s post test. ***p<0.001, compared with the low-fat low-cholesterol diet (LFCD) group. ###p<0.001, compared with the high-fat high-cholesterol diet (HFCD) group. Apob, apolipoprotein B; Cd36, cluster of differentiation 36; Mttp, microsomal triglyceride transfer protein.
-
Figure 5—figure supplement 2—source data 1
Fibroblast growth factor 21 (FGF21) increases apolipoprotein B mRNA (Apob) expression in the liver.
- https://cdn.elifesciences.org/articles/83075/elife-83075-fig5-figsupp2-data1-v2.xlsx
Figure 6 with 2 supplements
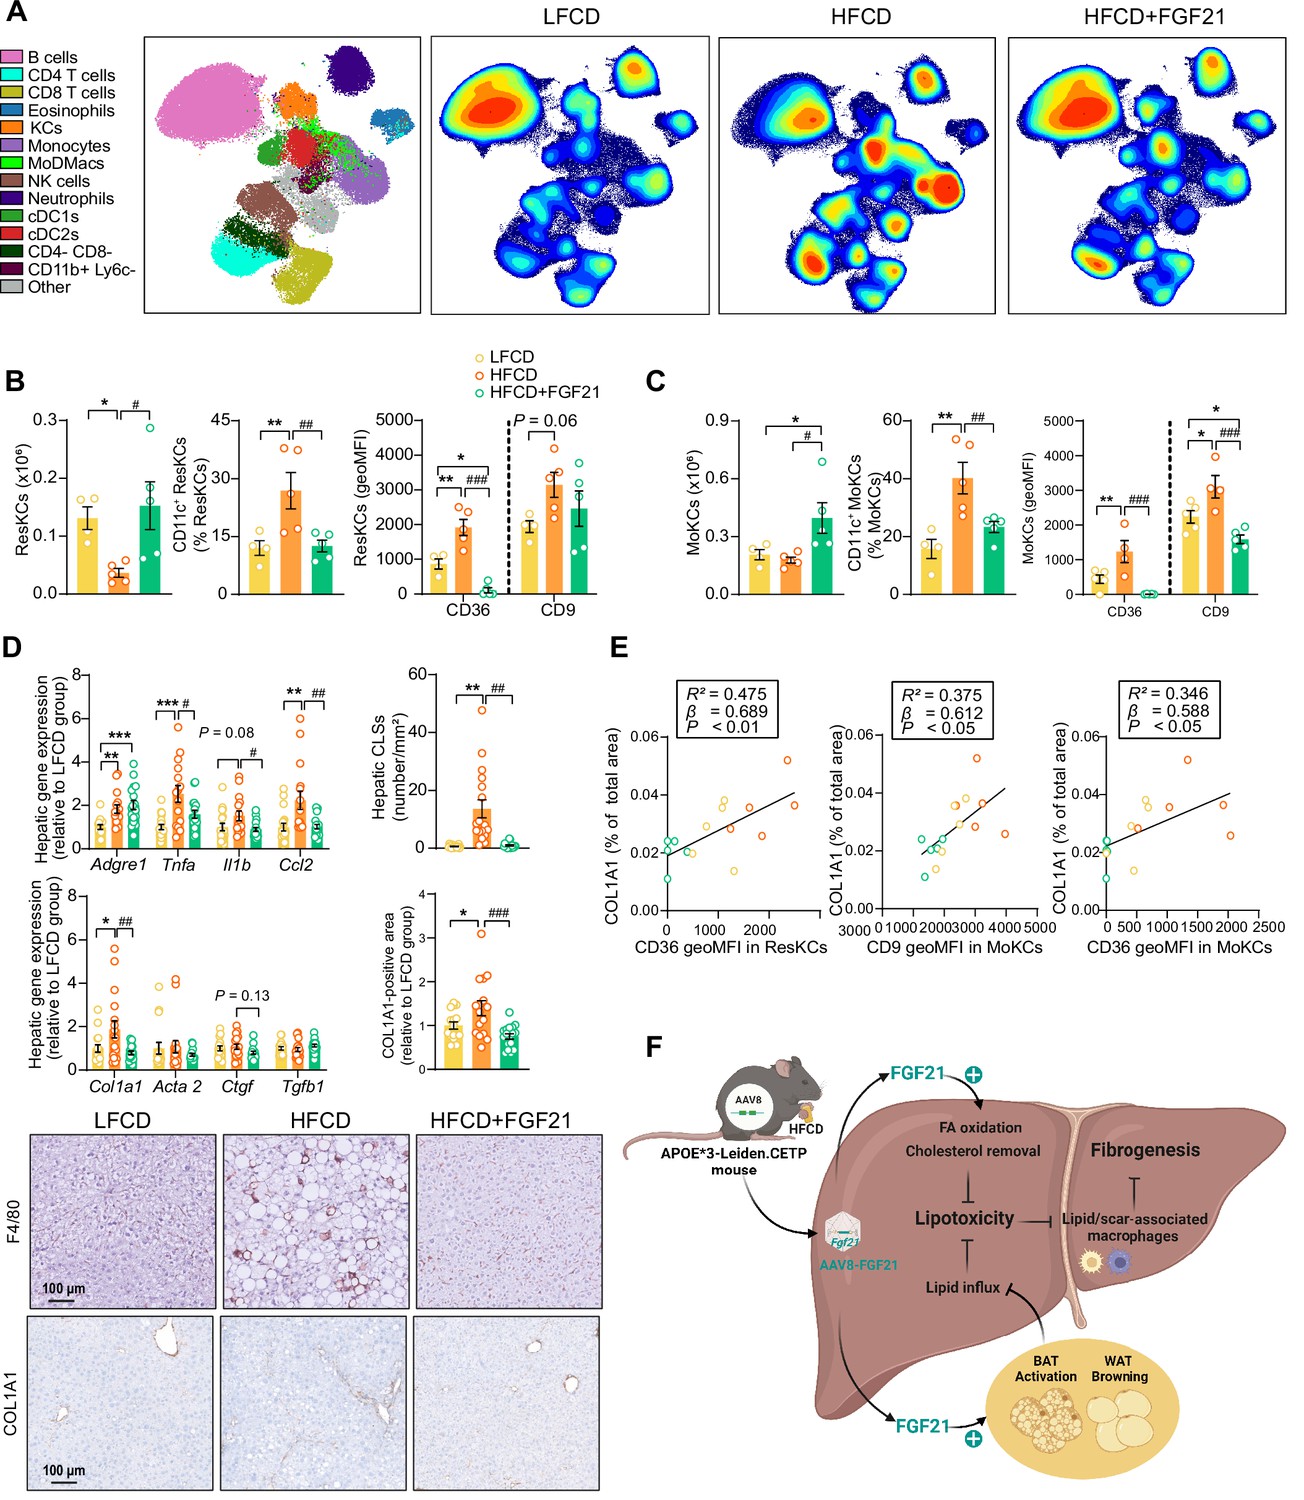
Fibroblast growth factor 21 (FGF21) modulates hepatic macrophage pool and protects against COL1A1 accumulation, as predicted by the reduction of CD36hi Kupffer cells (KCs) and CD9hi KCs.
(A) Uniform manifold approximation and projection for dimension reduction (UMAP) of immune cell subsets from livers after 23 weeks of intervention. (B) The number of resident KCs (ResKCs), the proportion of CD11c+ ResKCs, and the expression of CD36 and CD9 in ResKCs were quantified. (C) The amount of monocyte-derived KCs (MoKCs) was assessed, the percentage of CD11c+ MoKCs was determined, the CD36 and CD9 expression levels in MoKCs were quantified. (D) Hepatic inflammation was evaluated by pro-inflammatory gene expression and the formation of crown-like structures (CLSs) within the liver. The mRNA expression of liver fibrogenesis markers was quantified, and the protein expression of collagen type 1α 1 (COL1A1) was determined. (E) The expression of CD36 in ResKCs, and the expression of CD9 and CD36 in MoKCs were plotted against COL1A1-positive area in the liver. (F) Mechanistic model. Data are shown as mean ± SEM (A–B and E, n=4–5 per group; D, n=16–18 per group). Linear regression analyses were performed. Differences were assessed using one-way ANOVA followed by a Fisher’s LSD test. *p<0.05, **p<0.01, ***p<0.001, compared with the low-fat low-cholesterol diet (LFCD) group. #p<0.05, ##p<0.01, ###p<0.001, compared with the high-fat high-cholesterol diet (HFCD) group. Acta2, actin α2; Ctgf, connective tissue growth factor; FA, fatty acid; Tgfb1, transforming growth factor-β.
-
Figure 6—source data 1
Fibroblast growth factor 21 (FGF21) modulates hepatic macrophage pool and protects against COL1A1 accumulation, as predicted by the reduction of CD36hi Kupffer cells (KCs) and CD9hi KCs.
- https://cdn.elifesciences.org/articles/83075/elife-83075-fig6-data1-v2.xlsx
Figure 6—figure supplement 1
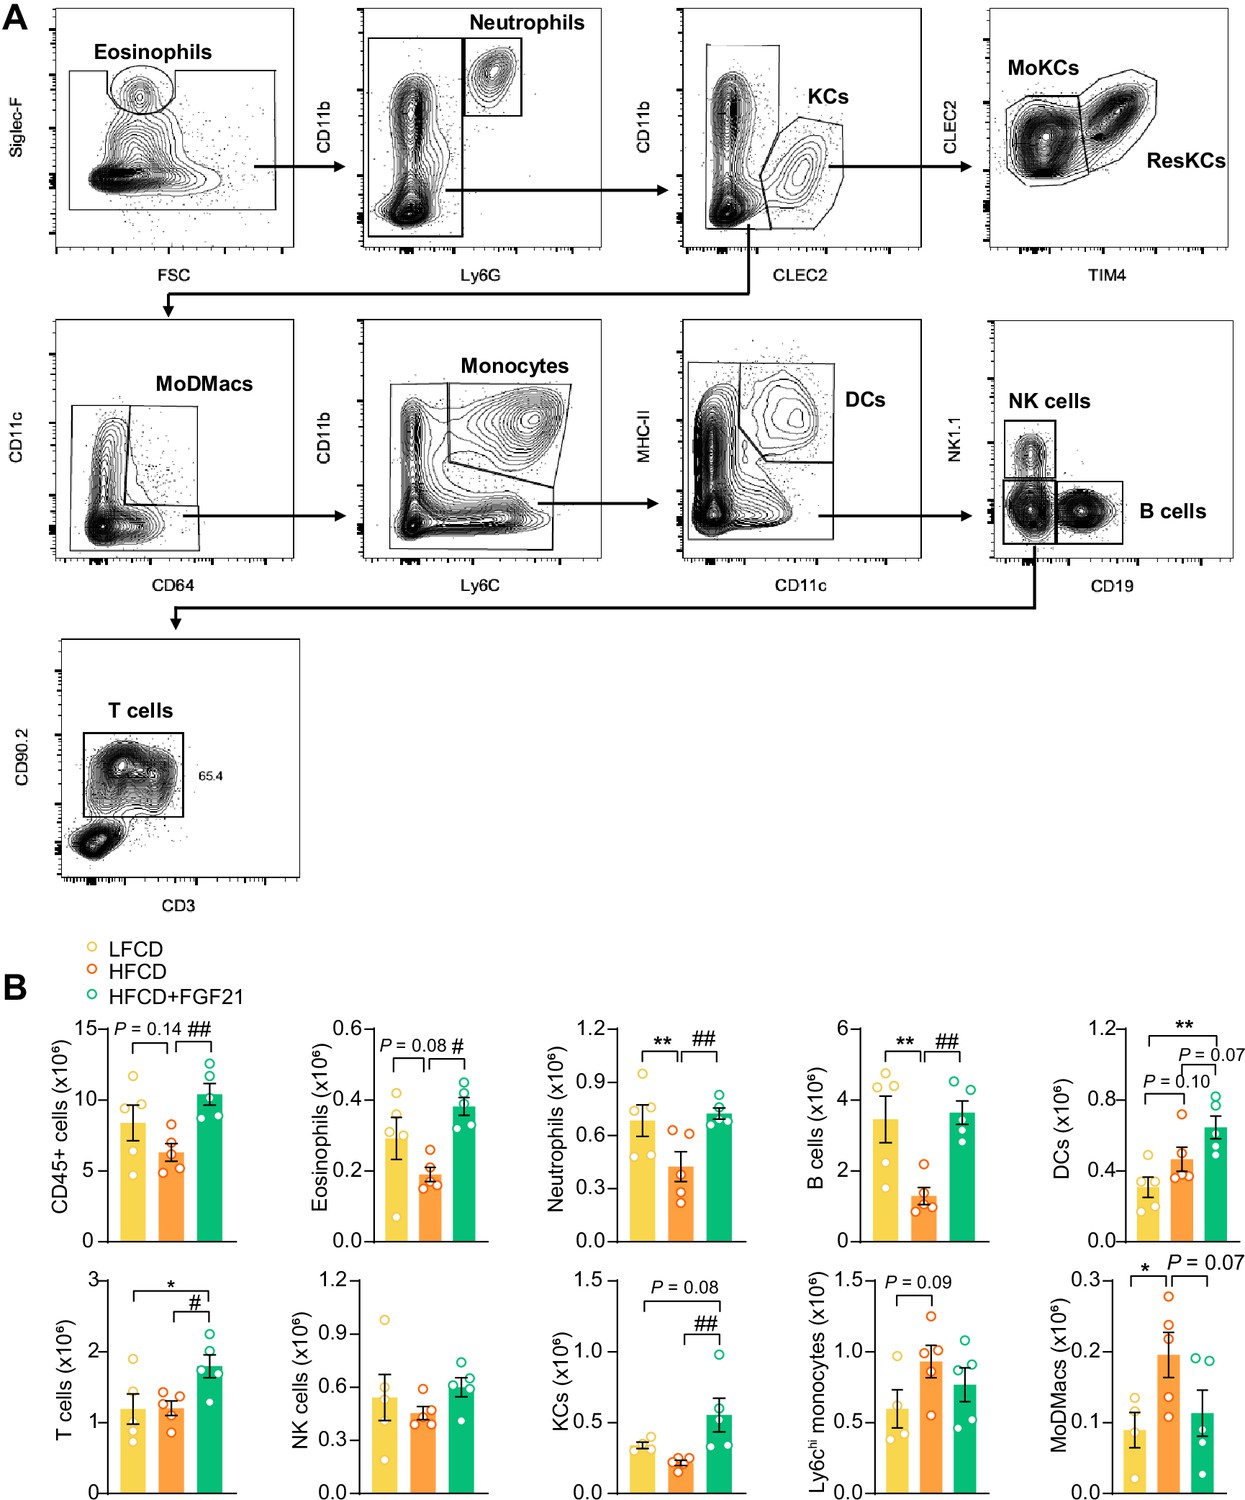
Fibroblast growth factor 21 (FGF21) modulates the hepatic immune cell pool.
(A) Flow cytometry gating strategy. (B) After 23 weeks of treatment, CD45+ cells were isolated from the liver, and the number of CD45+ cells, eosinophils, neutrophils, B cells, dendritic cells (DCs), T cells, natural killer (NK) cells, total Kupffer cells (KCs), Ly6Chi monocytes, and monocyte-derived macrophages (MoDMacs) was assessed. Data are shown as mean ± SEM (n=4–5 per group). Differences were assessed using one-way ANOVA followed by a Fisher’s LSD test. *p<0.05, **p<0.01, compared with the low-fat low-cholesterol diet (LFCD) group. #p<0.05, ##p<0.01, compared with the high-fat high-cholesterol diet (HFCD) group.
-
Figure 6—figure supplement 1—source data 1
Fibroblast growth factor 21 (FGF21) modulates the hepatic immune cell pool.
- https://cdn.elifesciences.org/articles/83075/elife-83075-fig6-figsupp1-data1-v2.xlsx
Figure 6—figure supplement 2
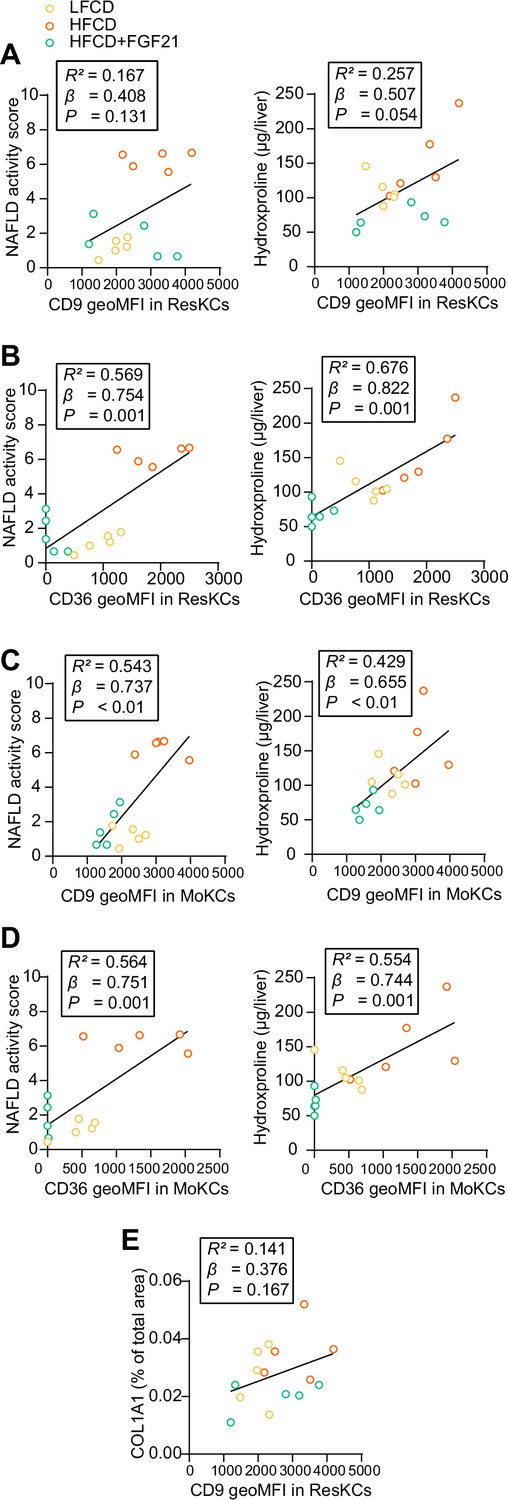
CD36hi resident Kupffer cells (ResKCs) as well as CD36hi/CD9hi monocyte-derived KCs (MoKCs) positively correlate with nonalcoholic fatty liver disease (NAFLD) activity score and liver fibrosis.
NAFLD activity scores and liver hydroxyproline levels were plotted against the expression of (A) CD9 and (B) CD36 in ResKCs as well as (C) CD9 and (D) CD36 in MoKCs. (E) Hepatic expression of collagen type 1α 1 (COL1A1) was plotted against the expression of CD9 in ResKCs. Linear regression analyses were performed. Data are represented as mean ± SEM (n=5 per group).
-
Figure 6—figure supplement 2—source data 1
CD36hi resident Kupffer cells (ResKCs) as well as CD36hi/CD9hi monocyte-derived KCs (MoKCs) positively correlate with nonalcoholic fatty liver disease (NAFLD) activity score and liver fibrosis.
- https://cdn.elifesciences.org/articles/83075/elife-83075-fig6-figsupp2-data1-v2.xlsx
Author response image 1
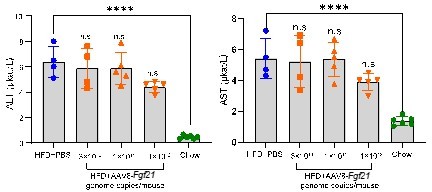
Acute effects of AAV8-FGF21 administration on plasma ALT/AST levels in mice.
C57BL/6 mice were fed a high-fat diet (HFD) for 40 weeks, after which these mice (n = 4-5) were treated with either PBS or various doses of AAV8-FGF21 vectors (3 × 10¹⁰, 1 × 10¹¹ and 1 × 10¹² genome copies/mouse). After 8 days of AAV8-FGF21 interventions, these mice were terminated, and plasma samples were collected for ALT and AST measurement. Data are shown as mean ± SD. Differences were assessed using one-way ANOVA followed by a Tukey post-test. ****P < 0.0001, compared with the Chow group.
Author response image 2
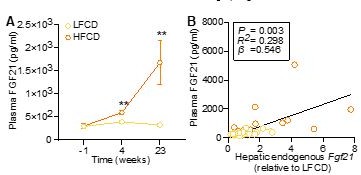
HFCD increases endogenous FGF21 levels.
(A) Plasma endogenous FGF21 levels were measured before (at week -1; pooled samples, n = 6 per group) and after (at week 4, pooled samples, n = 6 per group; week 23, n = 12-16 per group) AAV8-null administration. (B) Plasma endogenous FGF21 levels (week 23) were plotted against the expression of hepatic endogenous FGF21 expression. Data are shown as mean ± SEM. (A) Differences were assessed using student t-test.(B) Linear regression analyses were performed.**P < 0.01, compared with the LFCD group.
Tables
Appendix 1—table 1
List of polymerase chain reaction primer sequences used in mRNA expression analysis.
| Gene | Forward primer (5’–3’) | Reverse primer (5’–3’) |
|---|---|---|
| Abcg5 | GAGCTGCAGAGGATGATTGCT | AGCCACCCTGGTCTTGGA |
| Acta2 | CCTGACGGGCAGGTGATC | ATGAAAGATGGCTGGAAGAGAGTCT |
| Actb | AACCGTGAAAAGATGACCCAGAT | CACAGCCTGGATGGCTACGTA |
| Adgre1 | CTTTGGCTATGGGCTTCCAGTC | GCAAGGAGGACAGAGTTTATCGTG |
| Adipoq | CTCCACCCAAGGGAACTTGT | TAGGACCAAGAAGACCTGCATC |
| Apob | GCCCATTGTGGACAAGTTGATC | CCAGGACTTGGAGGTCTTGGA |
| Ccl2 | GCATCTGCCCTAAGGTCTTCA | TTCACTGTCACACTGGTCACTCCTA |
| Cd36 | GCAAAGAACAGCAGCAAAATC | CAGTGAAGGCTCAAAGATGG |
| Col1a1 | GAGAGAGCATGACCGATGGATT | TGTAGGCTACGCTGTTCTTGCA |
| Cpt1a | GAGACTTCCAACGCATGACA | ATGGGTTGGGGTGATGTAGA |
| Ctgf | GGCCTCTTCTGCGATTTCG | CCATCTTTGGCAGTGCACACT |
| Cyp7a1 | CAGGGAGATGCTCTGTGTTCA | AGGCATACATCCCTTCCGTGA |
| Cyp8b1 | GGACAGCCTATCCTTGGTGA | CGGAACTTCCTGAACAGCTC |
| Cyp27a1 | TCTGGCTACCTGCACTTCCT | CTGGATCTCTGGGCTCTTTG |
| Codon-optimized Fgf21 | GCCCACCTGGAGATCAGGGAGGA | GGCAGGAAGCGCACAGGTCCCCAG |
| Fgf21 | GGGGTCATTCAAATCCTGGGTGTCA | ACACATTGTAACCGTCCTCCAGCAG |
| Fgfr1 | AGAGTCCAAGAGTAAAAGCAGC | CTTCCGAGGTTCAGCTCTCC |
| Fgfr2 | GCTATAAGGTACGAAACCAGCAC | GGTTGATGGACCCGTATTCATTC |
| Fgfr4 | TCCATGACCGTCGTACACAAT | ATTTGACAGTATTCCCGGCAG |
| Il1b | GCAACTGTTCCTGAACTCAACT | ATCTTTTGGGGTCCGTCAACT |
| Klb | TGTTCTGCTGCGAGCTGTTAC | TACCGGACTCACGTACTGTTT |
| Mttp | CTCTTGGCAGTGCTTTTTCTCT | GAGCTTGTATAGCCGCTCATT |
| Pgc1a | TGCTAGCGGTTCTCACAGAG | AGTGCTAAGACCGCTGCATT |
| Ppara | ATGCCAGTACTGCCGTTTTC | GGCCTTGACCTTGTTCATGT |
| Rplp0 | GGACCCGAGAAGACCTCCTT | GCACATCACTCAGAATTTCAATGG |
| Tgfb1 | TTGCCCTCTACAACCAACACAA | GGCTTGCGACCCACGTAGTA |
| Tnfa | AGCCCACGTCGTAGCAAACCAC | TCGGGGCAGCCTTGTCCCTT |
-
Abcg5, ATP-binding cassette transporter G member 5; Acta2, actin α2; Actb, β-actin Adgre1, adhesion G protein-coupled receptor E1; Adipoq, adiponectin; Apob, apolipoprotein B; Ccl2, C–C motif chemokine ligand 2; Cd36, cluster of differentiation 36; Col1a1, collagen type 1α1; Cpt1a, carnitine palmitoyl transferase 1α; Ctgf, connective tissue growth factor; Cyp7a1, cholesterol 7α-hydroxylase; Cyp8b1, sterol 12α-hydroxylase; Cyp27a1, sterol 27-hydroxylase; Fgf21, exogenous fibroblast growth factor; Fgfr, fibroblast growth factor receptor; Il1b, interleukin-1β; Klb, β-Klotho; Pgc1a, peroxisome proliferator-activated receptor gamma coactivator 1α; Ppara, peroxisome proliferator-activated receptor α; Rplp0, ribosomal protein lateral stalk subunit p0; Tgfb1, transforming growth factor-β; Tnfa, tumor necrosis factor α.
Appendix 1—table 2
List of antibodies and other reagents used for flow cytometry analyses.
| Target | Clone | Conjugate | Source | Catalog number |
|---|---|---|---|---|
| CD3 | 17A2 | APC/Fire-810 | BioLegend | 100267 |
| CD4 | RM4-5 | APC | eBioscience | 17-0042-83 |
| CD8 | RPA-T8 | PE-Cy5 | BD Biosciences | 561951 |
| CD9 | MZ3 | PerCP-Cy5.5 | BioLegend | 124817 |
| CD11b | M1/70 | PE-Cy7 | eBioscience | 25-0112-82 |
| CD11c | HL3 | V450 | BD Biosciences | 560521 |
| CD19 | 1D3 | BV480 | BD Biosciences | 566107 |
| CD36 | HM36 | PE | BioLegend | 102606 |
| CD45 | 30-F11 | BV785 | BioLegend | 103149 |
| CD64 | X54-5/7.1 | PE-DAZZLE594 | BioLegend | 139320 |
| CD90.2 | 30-H12 | Alexa Fluor 700 | BioLegend | 105319 |
| CLEC2 | 17D9 | FITC | Bio-Rad | MCA5700 |
| F4/80 | BM8 | BV711 | BioLegend | 123147 |
| Ly6C | HK1.4 | APC-Cy7 | BioLegend | 128025 |
| Ly6G | 1A8 | BV650 | BioLegend | 127641 |
| MHC-II | M5/114.15.2 | BV750 | BD Biosciences | 747458 |
| MHC-II | M5/114.15.2 | Alexa Fluor 700 | Thermo Fisher | 56-5321-82 |
| NK1.1 | PK136 | PerCP-Cy5.5 | BioLegend | 108727 |
| Siglec-F | E50-2440 | PE | BD Biosciences | 552126 |
| Siglec-F | E50-2440 | BV605 | BD Biosciences | 740388 |
| TIM4 | 54 (RMT4-54) | PerCP-eFluor710 | Thermo Fisher | 46-5866-82 |
| XCR1 | ZET | BV421 | BioLegend | 148216 |
| Other reagents | ||||
| Zombie NIR Fixable Viability Kit | BioLegend | 423106 | ||
| True-Stain Monocyte Blocker | BioLegend | 426103 | ||
| Brilliant Stain Buffer Plus | BD Biosciences | 566385 | ||
Additional files
Download links
A two-part list of links to download the article, or parts of the article, in various formats.
Downloads (link to download the article as PDF)
Open citations (links to open the citations from this article in various online reference manager services)
Cite this article (links to download the citations from this article in formats compatible with various reference manager tools)
FGF21 protects against hepatic lipotoxicity and macrophage activation to attenuate fibrogenesis in nonalcoholic steatohepatitis
eLife 12:e83075.
https://doi.org/10.7554/eLife.83075


