β-cell intrinsic dynamics rather than gap junction structure dictates subpopulations in the islet functional network
- Department of Bioengineering, University of Colorado Anschutz Medical Campus, United States
- Barbara Davis Center for Childhood Diabetes, University of Colorado Anschutz Medical Campus, United States
- Centre for Systems Modelling and Quantitative Biomedicine, University of Birmingham, United Kingdom
- Department of Biomedical Informatics, University of Colorado Anschutz Medical Campus, United States
Figures
Figure 1 with 2 supplements
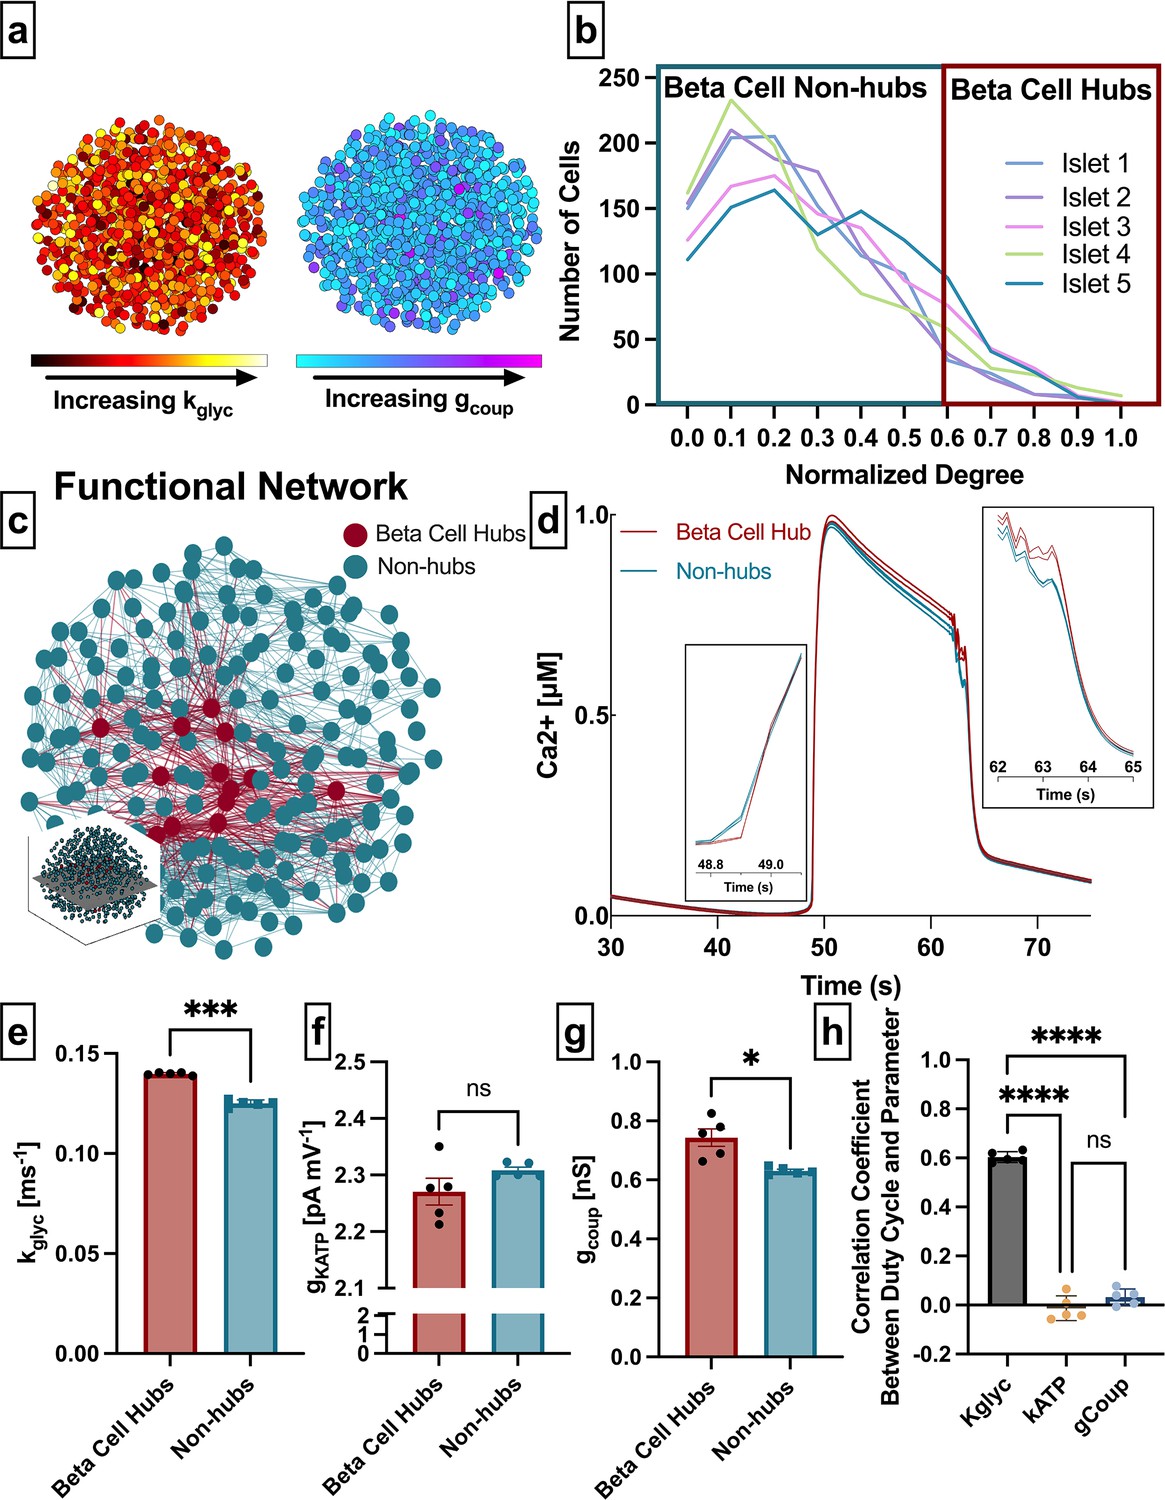
Analysis of parameters underlying functionally connected cells from the Cha-Noma model, representing fast oscillations.
(a) Schematic of 1000 β-cell computational model, with cells false-colored by heterogeneity in rate of glucokinase, kglyc (left) and gap junction conductance, gcoup (right) parameter values. (b) Distribution of functional connections (edges), determined from functional network analysis. Colors show five simulated islets. Hub cells (red outline) are any cell with >60% of maximum number of links. (c) Two-dimensional slice of the simulated islet, with lines (edges) representing functional connections between synchronized cells. Hub cells indicated in red. Slice is taken from middle of islet (see inset). (d) Representative [Ca2+] time course of a hub (red) and non-hub (blue). (e) Average rate of glucose metabolism (kglyc) values compared between hubs and non-hubs in a Cha-Noma simulated islet. Each data point represents the averaged values for a single islet. Effect size was 2.85. (f) As in e for maximum conductance of ATP-sensitive potassium channel (gKATP). Effect size was 0.31. (g) As in e for gap junction conductance (gcoup). Effect size was 0.82. (h) Pearson correlation coefficient between duty cycle and kglyc, gKATP, and gcoup for all cells. Significance in e–g was determined by paired Student’s t-test. *p ≤ 0.05 and ***p ≤ 0.001. In e–g each data point corresponds to the average value over a single simulated islet. Error bars represent s.e.m.
Figure 1—figure supplement 1
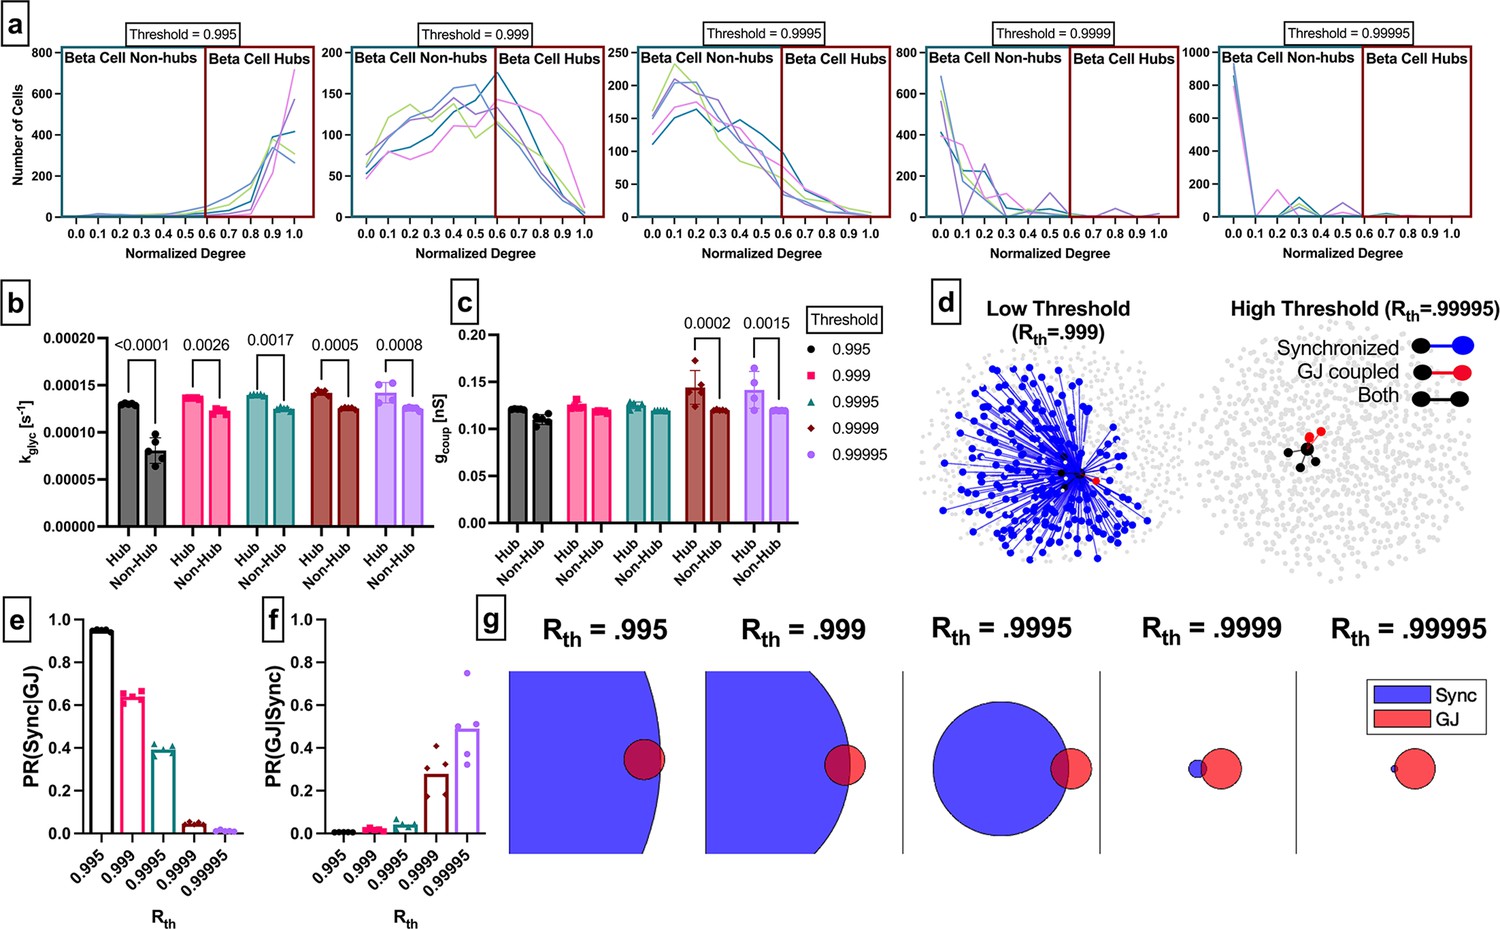
Functional network sensitivity to threshold in Cha-Noma model.
(a) Degree distribution of five simulated islets with five different thresholds. (b) kglyc comparing hubs and non-hubs across five different thresholds. (c) gcoup comparing hubs and non-hubs across five different thresholds. Significance is assessed using Tukey’s multiple comparisons. (d) Islet with representative cell connections calculated by a lower threshold (Rth=0.999, right) and higher threshold (Rth=0.99995, left). Synchronized cell pairs are shown in blue, gap junction pairs are shown in red, and both are shown in black. (e) Probability of a synchronized cell pair given gap junction for five thresholds. (f) Probability of gap junction given synchronization for the five thresholds. (g) Venn diagrams for the probability of synchronization (blue) and gap junction connection (red) with the overlapping area representing cell pairs that were both synchronized and gap junction coupled.
Figure 1—figure supplement 2
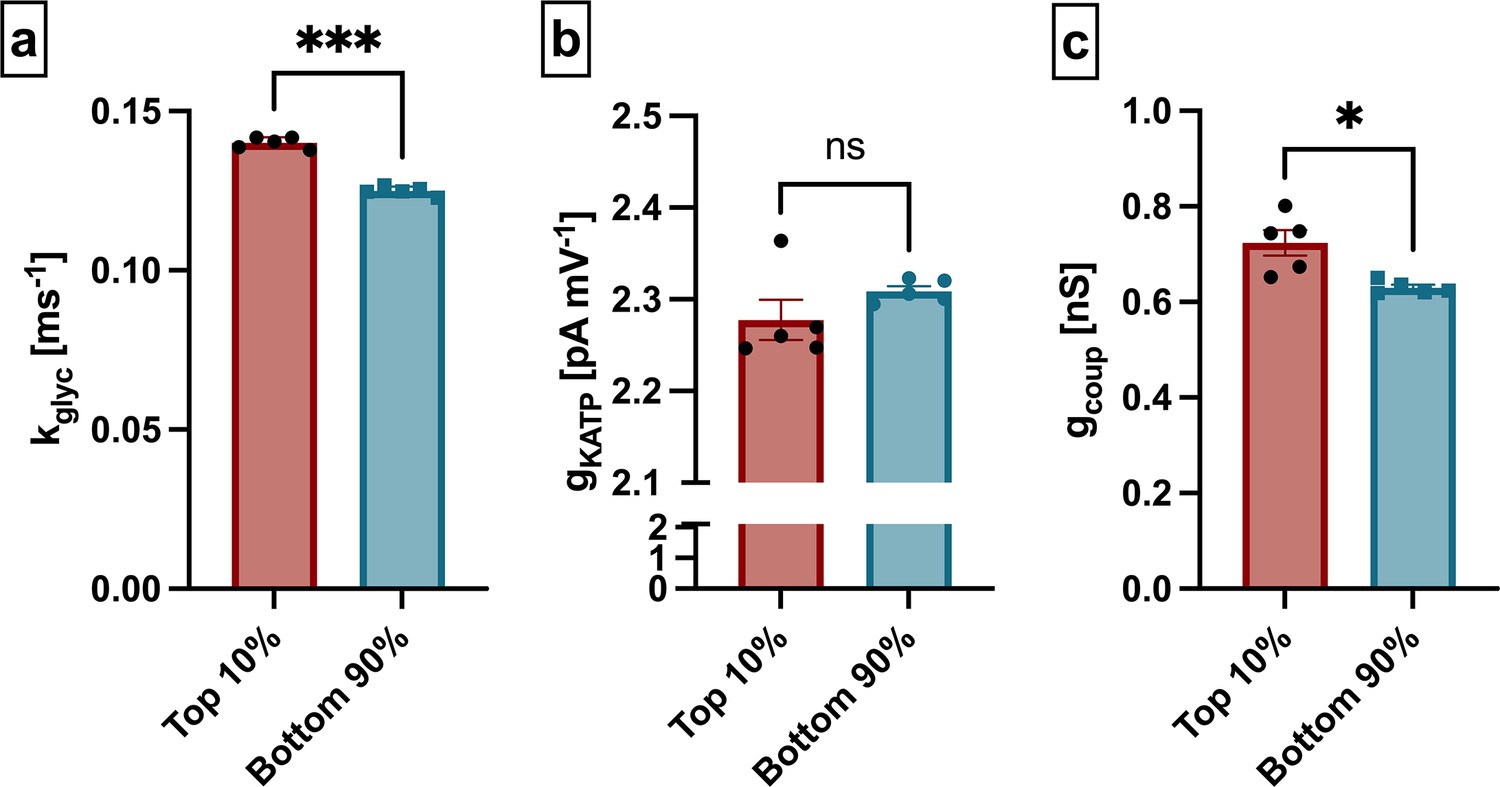
Functional network dependence with alternative hub cell definition in Cha-Noma model.
Hubs can be alternatively defined as the 10% of cells with the highest number of functional connections. (a) kglyc comparing alternatively defined hubs and non-hubs. (b) gKATP comparing alternatively defined hubs and non-hubs. (c) gcoup comparing alternatively defined hubs and non-hubs. Significance was determined by paired Student’s t-test. *p≤0.05 and ***p≤0.001. Each data point corresponds to the average value over a single simulated islet.
Figure 2 with 2 supplements

Analysis of parameters underlying functionally connected cells from the integrated oscillator model, representing slow oscillations.
(a) Two-dimensional slice of the simulated islet from slow simulation, with lines (edges) representing functional connections between synchronized cells. Hub cells indicated in red. Slice is taken from middle of islet (see inset). (b) Distribution of functional connections (edges), determined from functional network analysis. Colors show five simulated islets. Hub cells (red outline) are any cell with >60% of maximum number of links. (c) Representative [Ca2+] time course of a hub (red) and non-hub (blue) from slow islet simulation. (d) Average rate of glucokinase (kglyc) values compared between hubs and non-hubs in a slow simulated islet, retrospectively analyzed. Each data point represents the averaged values for a whole islet. Effect size was 0.65. (e) As in d for maximum conductance of ATP-sensitive potassium channel (gKATP). Effect size was 1.27. (f) As in d for gap junction conductance (gcoup). Effect size was 2.94. (g) Pearson correlation coefficient between duty cycle and kglyc, gKATP, and gcoup for all cells. (h) As in d but for fast model with 260 cells. (i) As in e but for fast model with 260 cells. (j) As in f but for fast model with 260 cells. Significance in d–j was determined by paired Student’s t-test. *p≤0.05 and **p≤0.01. In d–j each data point corresponds to the average value over a single simulated islet. Error bars represent s.e.m.
Figure 2—figure supplement 1

Functional network sensitivity to threshold in integrated oscillator model (IOM).
(a) Average rate of glucose metabolism (kglyc) values compared between hubs and non-hub in IOM simulated islet determined using threshold 0.999999998. There were on average 18 hubs. This threshold is lower than that used in Figure 2. Each data point represents the averaged values for a single islet. (b) As in a for maximum conductance of ATP-sensitive potassium channel (gKATP). (c) As in a for gap junction conductance (gcoup). (d) Average rate of glucose metabolism (kglyc) values compared between hubs and non-hubs in IOM simulated islet determined using threshold 0.9999999995. There were on average 11 hubs. This threshold is higher than that used in Figure 2. Each data point represents the averaged values for a single islet. (e) As in d for maximum conductance of ATP-sensitive potassium channel (gKATP). (f) As in d for gap junction conductance (gcoup).
Figure 2—figure supplement 2

Functional network dependence with alternative hub cell definition in integrated oscillator model.
Hubs can be alternatively defined as the 10% of cells with the highest number of functional connections. (a) kglyc comparing alternatively defined hubs and non-hubs. (b) gKATP comparing alternatively defined hubs and non hubs. (c) gcoup comparing alternatively defined hubs and non-hubs. Significance was determined by paired Student’s t-test. ***p≤0.001. Each data point corresponds to the average value over a single simulated islet.
Figure 3 with 2 supplements
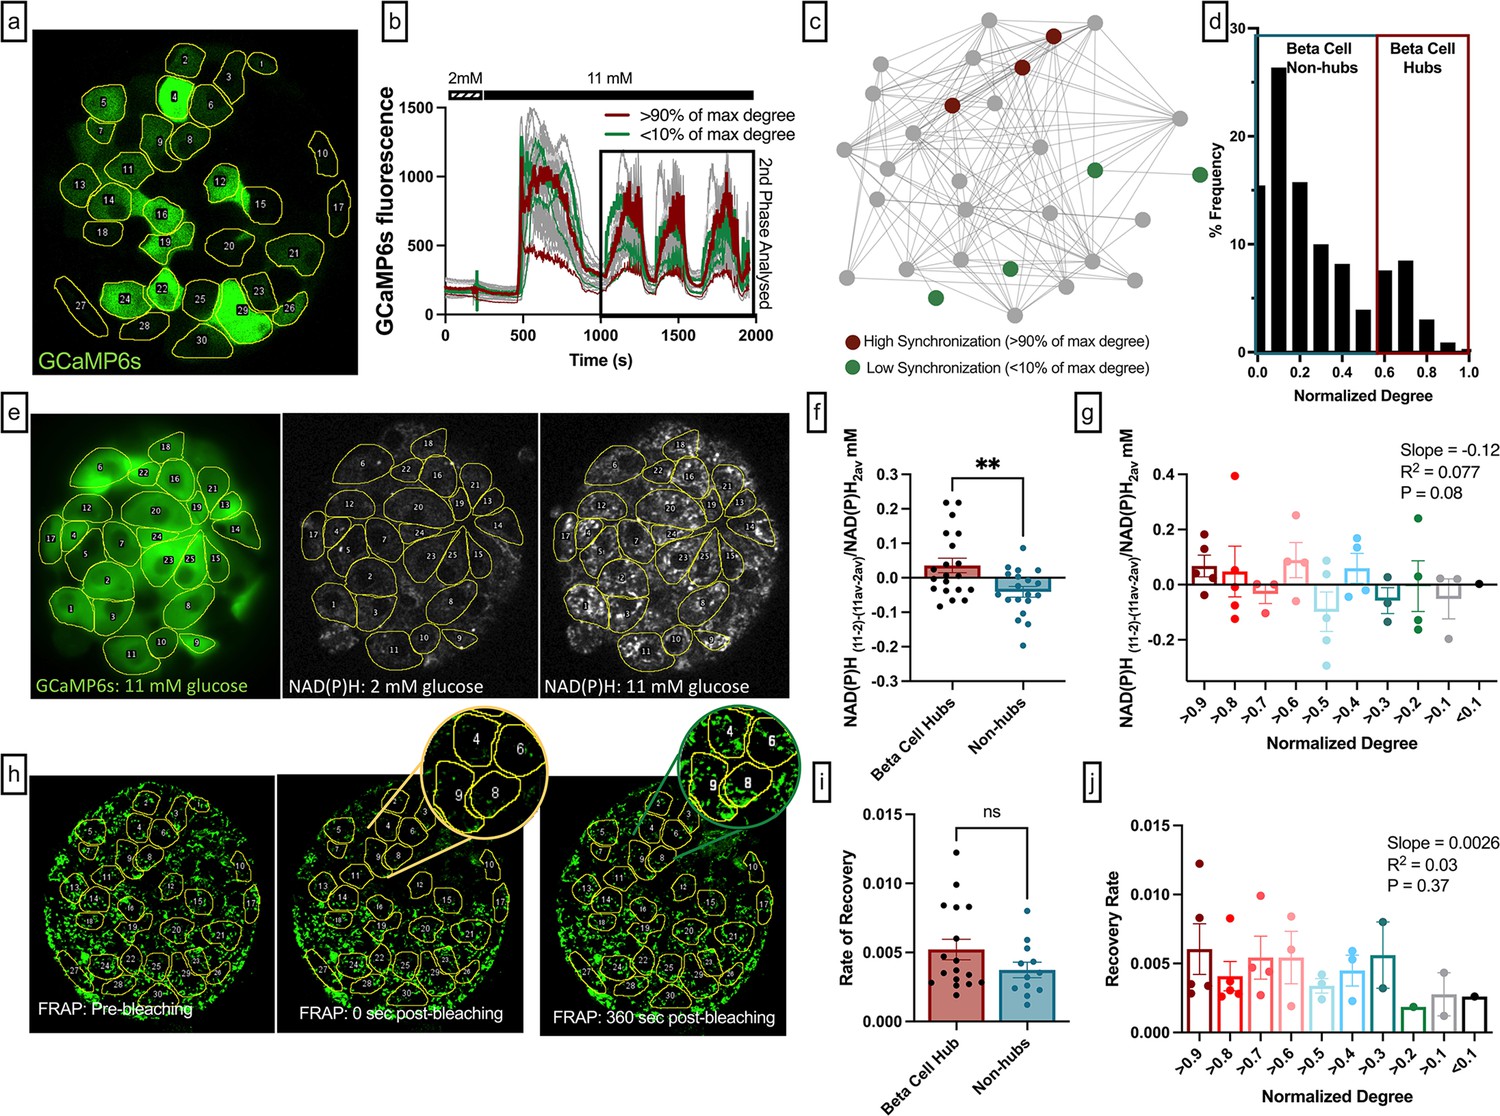
Experimental comparison between the functional network from slow β-cell oscillations, NAD(P)H activity, and coupling conductance.
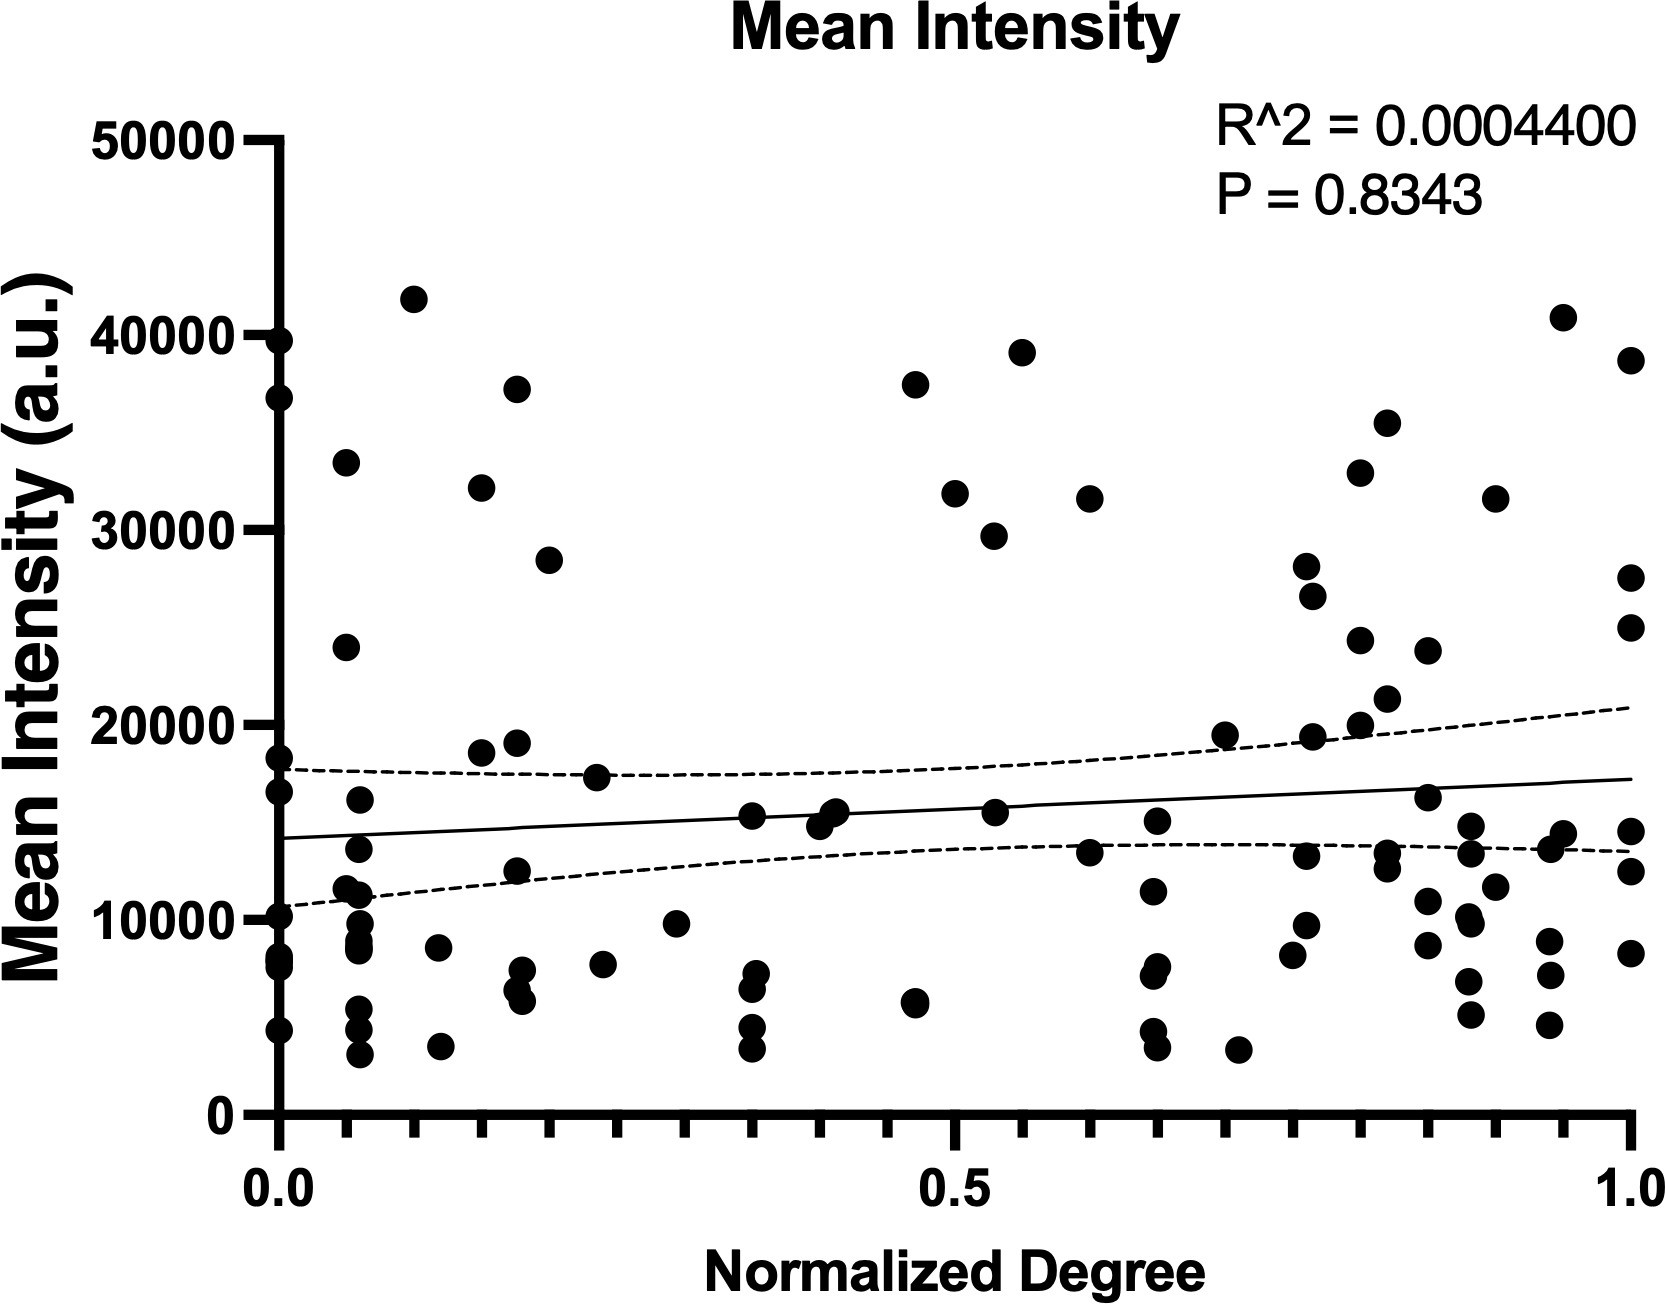
(a) Mouse pancreatic islet expressing fluorescent calcium indicator GCaMP6s in β-cells. Glucose level 11 mM. (b) GCamp6s time traces recorded at 2 and 11 mM glucose. Red curves represent dynamics of the most coordinated cells. These cells had highest number of edges, i.e., normalized degree >0.9. Green curves represent dynamics of the least coordinated cells, i.e., normalized degree <0.1, the rest of the cells are shown in gray. Only second phase (shown in black box) was used for functional network analysis. (c) Ca2+-based functional network of the islet shown in (e). Red dots represent most coordinated cells, and green dots – least coordinated cells which had at least 1 edge. (d) Degree distribution of all 11 analyzed islets. Threshold of Rth = 0.9 was used to filter the Pearson-based coordination matrix and obtain the functional network. (e) Left: Mouse pancreatic islet expressing fluorescent calcium indicator GCaMP6s. Glucose level 11 mM. Middle: NAD(P)H autofluorescence of the islet and the same cell layer, recorded at 2 mM glucose. Right: NAD(P)H autofluorescence recorded at 11 mM glucose. (f) Change of the NAD(P)H levels in each cell in response to glucose elevation, with respect to the islet average change. Metabolic activity here is compared between β-cell hubs and non-hubs. (g) Change in NAD(P)H levels in response to glucose elevation, with respect to the islet average change: here comparison is made for the most coordinated cells (normalized degree >0.9) with the less coordinated cells (normalized degree >0.8, >0.7, >0.6, …,<0.2, <0.1). Linear regression resulted in a trending relationship between normalized degree and NAD(P)H with slope of –0.126 (p=0.079). (f, g) represent n=5 islets with a total of 131 cells. Each dot represents the average NAD(P)H level for cells with respective degrees in an islet. (h) Rhodamine-123 fluorescence of the islet and the same cell layer as in (a), recorded immediately before photobleaching of the top half of each islet (left, red), immediately after photobleaching (middle, yellow) and 360 s after the photobleaching (right, green). (i) Fluorescence recovery after photobleaching (FRAP) recovery rate (s–1) between β-cell hubs and non-hubs. (j) FRAP recovery rate (s–1) in each of the photobleached cells: here the comparison is made for the most coordinated cells (normalized degree >90%) with the less coordinated cells (normalized degree >80, >70, >60, …<20,<10%). Linear regression resulted in a non-significant relationship between normalized degree and recovery rate (p=0.29). (i, j) shows results from 9 islets. Data points represent the average recovery rate for cells with respective degrees in an islet. **p≤0.01. In all panels, error bars represent s.e.m.
Figure 3—figure supplement 1
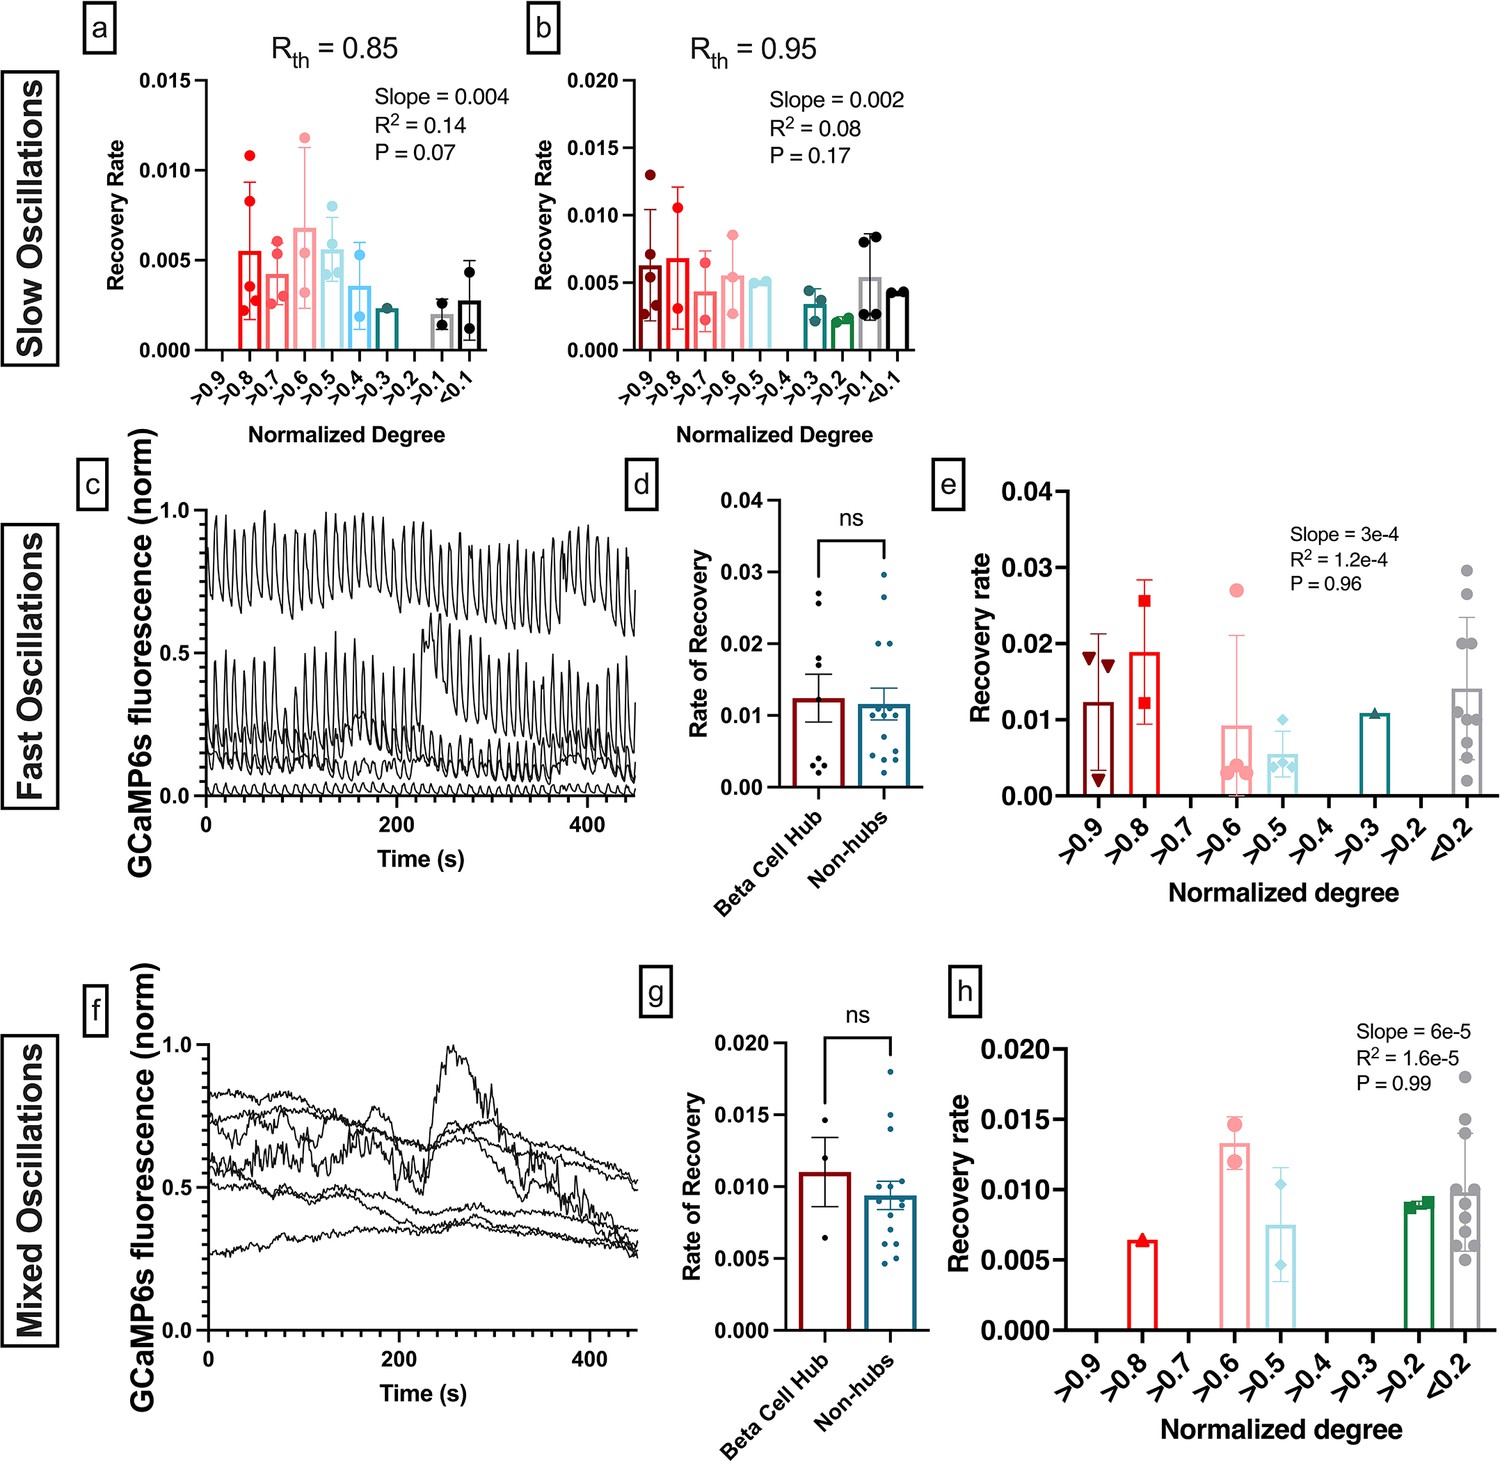
Experimental results for fast and mixed oscillations reveal no relationship between gap junction conductance and functional degree.
(a) Recovery rate vs. normalized degree for functional network synchronization threshold 0.85. (b) Recovery rate vs. normalized degree for functional network synchronization threshold 0.95. (c) Example time course of calcium oscillations in fast oscillations. (d) Fluorescence recovery after photobleaching (FRAP) recovery rate separated by hubs and non-hubs. (e) FRAP recovery rate (s–1) in each of the photobleached cells: here the comparison is made for the most coordinated cells (normalized degree >90%) with the less coordinated cells (normalized degree >80, >70, >60, …<20, <10%). (d, e) show results from 4 islets. (f) As in c for mixed oscillations. (g) As in d for mixed oscillations. (h) As in e for mixed oscillations. (f, h) show results from 4 islets. Significance in d, g was determined by unpaired two-tailed t-test. Significance and slope in d, g were determined by linear regression.
Figure 3—figure supplement 2
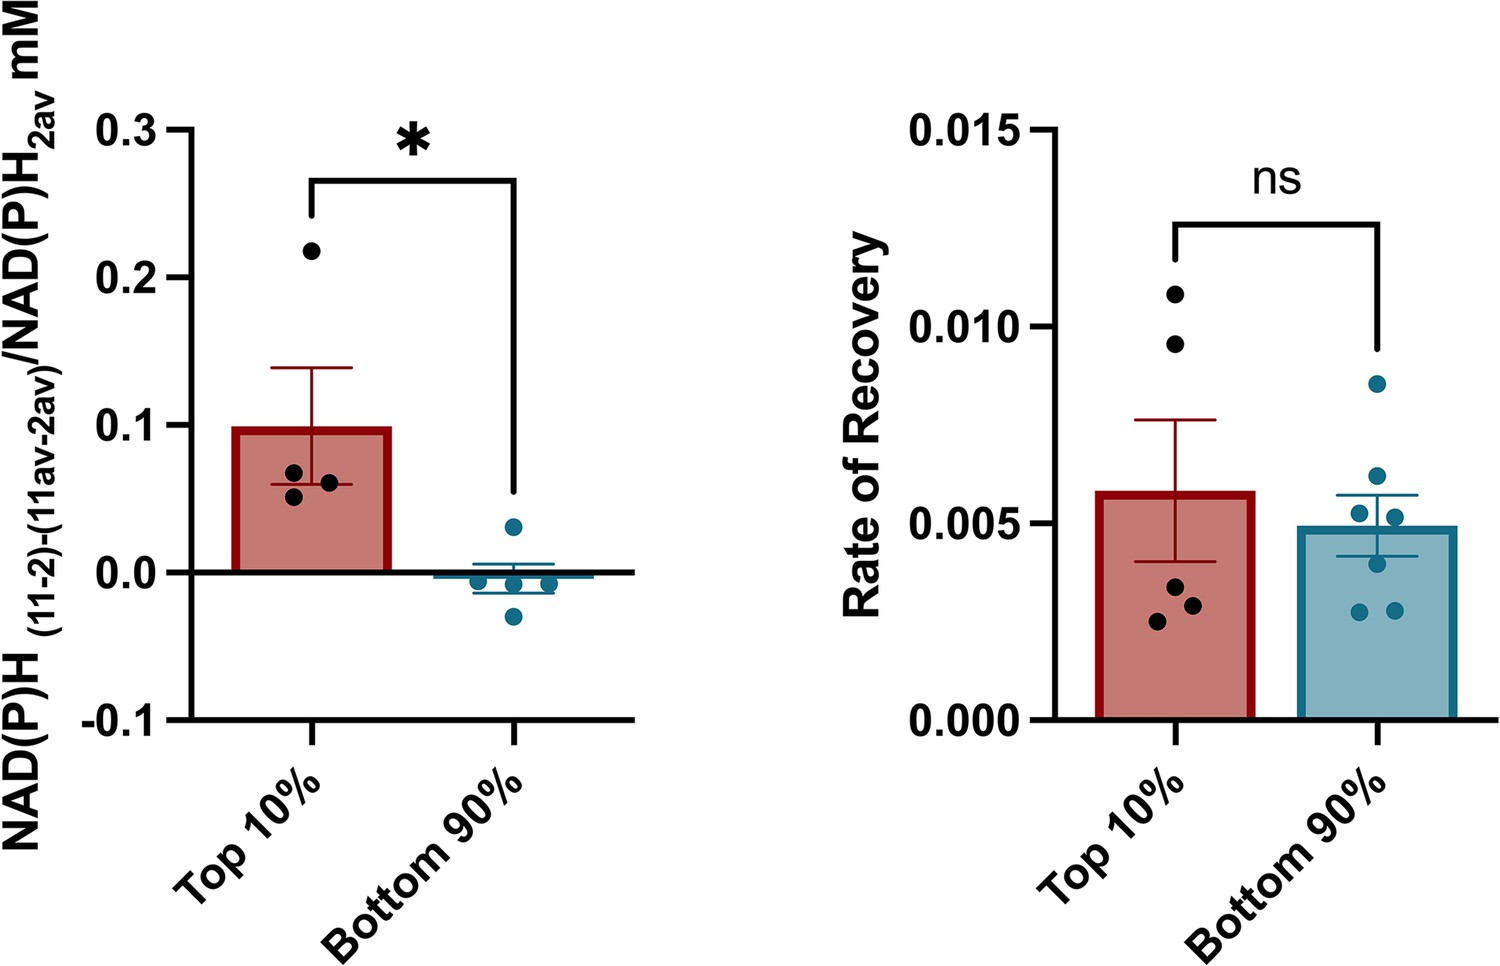
Experimental results with alternative hub cell definition.
Hubs can be alternatively defined as the 10% of cells with the highest number of functional connections. (a) Change of the NAD(P)H levels compared between β-cell hubs and non-hubs. Change in NAD(P)H is calculated in each cell in response to glucose elevation, and expressed with respect to the islet average change. (b) Fluorescence recovery after photobleaching (FRAP) recovery rate (s–1) between β-cell hubs and non-hubs. Data points represent the average recovery rate for cells with respective degrees in an islet. Significance was determined by unpaired two-tailed t-test. *p≤0.05. One identified outlier in panel a (value = –0.23, Grubbs’ test) was excluded from the comparison.
Figure 4

Comparison of functional connections, gap junctions, and glucose metabolism in the simulated islet.
(a) Functional connections and structural connections for a representative highly connected β-cell hub, average cell, and low connected cell. Blue cells and edges indicate cells determined as ‘synchronized’ via functional network analysis. Red cells are GJ coupled. Black cells are both GJ coupled and synchronized. (b) Probability that a cell is synchronized given it is gap junction coupled, or vice versa, that a cell is gap junction coupled given it is synchronized. (c) Venn diagram showing overlap between the synchronized cells and gap junction coupled cells within the simulated islet. (d) Functional connections and metabolic connections for a β-cell hub and a cell with averaged synchronization. Blue cells and edges indicate cells determined as ‘synchronized’ via functional network analysis. Green cells and edges indicate cells that have similar kglyc and are within 15% islet from each other. Black cells and edges indicate both synchronized and similar kglyc. (e) Probability that a cell pair is synchronized given it shares a gap junction has similar kglyc. (f) Probability that the cell pair is gap junction coupled has similar kglyc and within 15% of islet distance (Pr=0.0052) , respectively, given the pair is synchronized. (g) Venn diagram showing overlap between the synchronized cells and metabolically similar cells. Shaded area in c and g is proportional to indicated probability. Significance in e and f was determined by a repeated measures one-way ANOVA with Tukey’s multiple comparisons **p≤0.01. In b, e, f each data point corresponds to the average value over a single simulated islet.
Figure 5 with 2 supplements
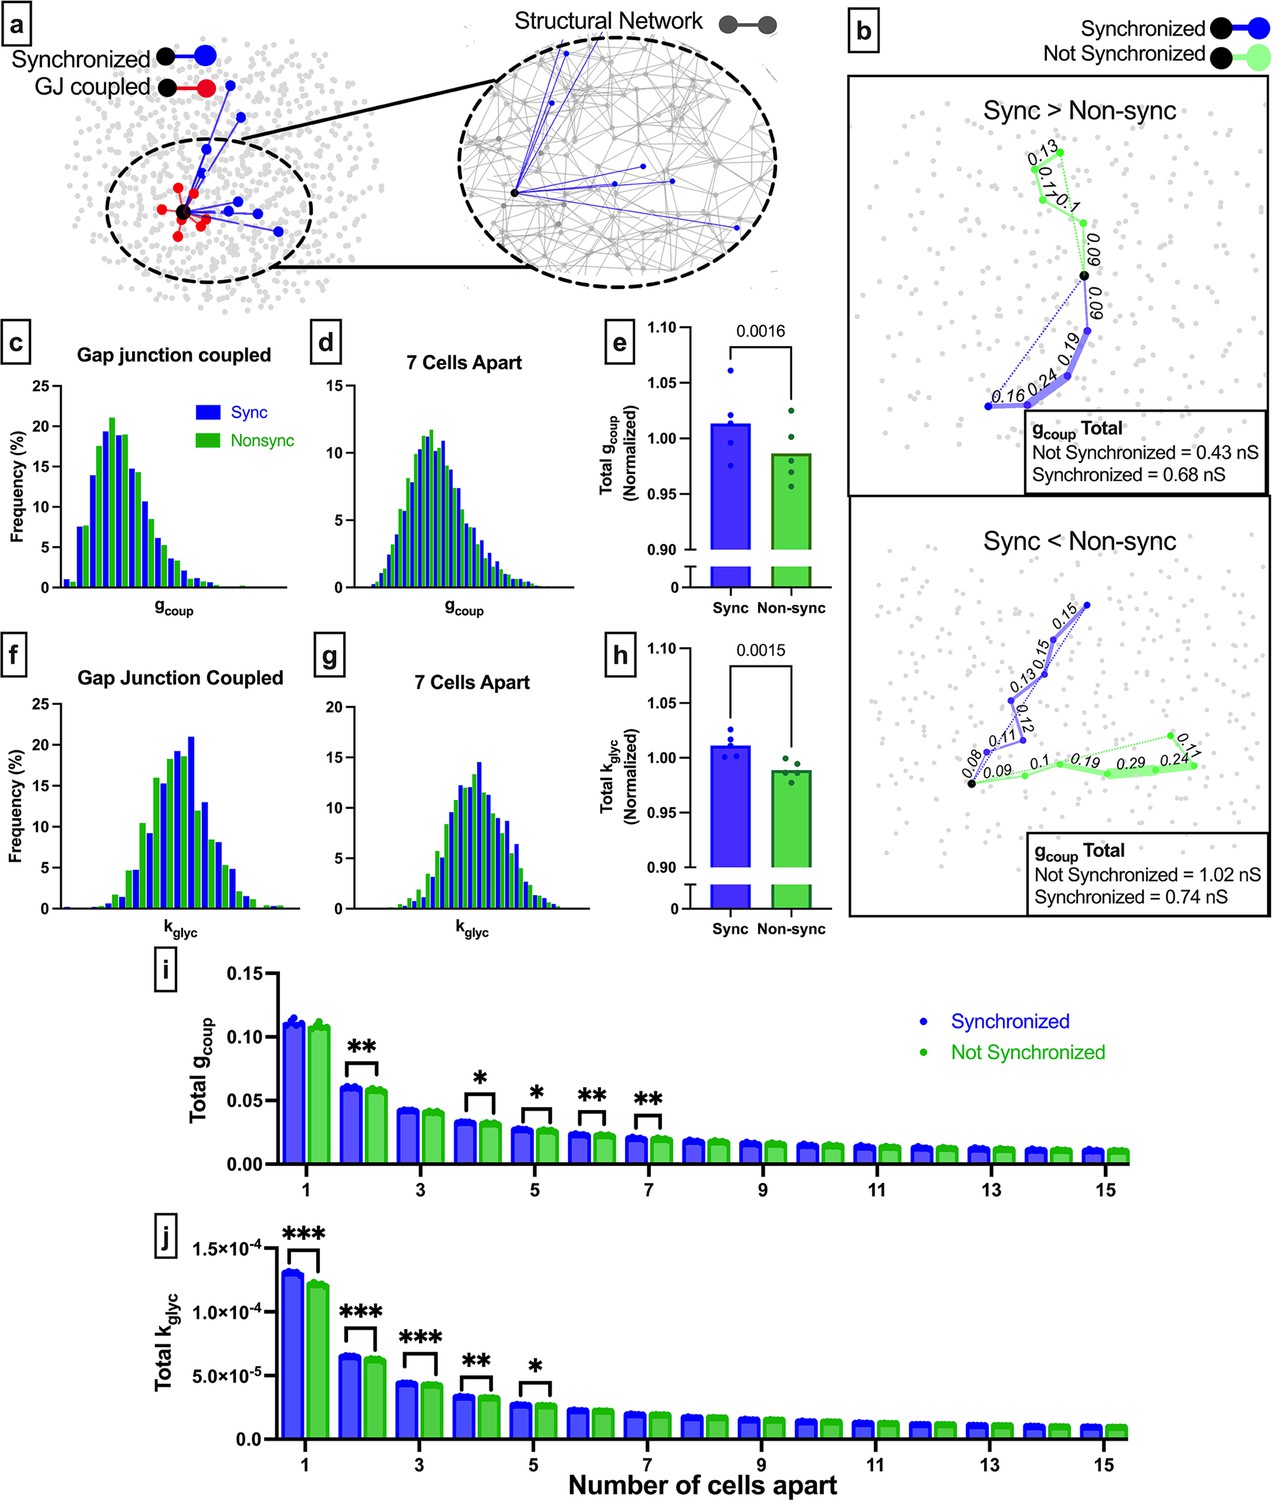
Comparison of long-range functional synchronization, gap junction network, and glucose metabolism in the simulated islet.
(a) Functional connections and gap junction connections for a representative cell (black). Synchronized cells in blue, gap junction coupled cells in red. Inset shows the entire structural network (gray) with functional connections for the same cell shown in blue. (b) Two representative cells (black) and the shortest path to a synchronized cell (blue) and a non-synchronized cell (green). Path is weighted (shown by edge thickness) by gcoup. For the cell on the top panel, the synchronized path has a higher cumulative gap junction conductivity (0.68 nS) than the non-synchronized path (0.43 nS). For the cell on the bottom panel, the synchronized path has a lower cumulative gap junction conductance (0.74 nS) than the non-synchronized path (1.02 nS). (c) Probability distribution of total gcoup for synchronized cells (blue) and non-synchronized cells (green) that are directly connected by gap junctions. (d) As in c for cells pairs that are 7 cells apart. (e) Comparison of the total gcoup, normalized by distance for synchronized cells (blue) and non-synchronized cells (green). Each dot indicates the average resistance for a single simulated islet. (f) As in c but with connections weighted by rate of glucokinase activity (kglyc). (g) As in d but with connections weighted by kglyc. (h) As in e but with connections weighted by kglyc. (i) Total gcoup for synchronized and non-synchronized cells organized by cell distance. (j) As in i but for the network weighted by kglyc. Significance in e, h was assessed by a two-tailed paired t-test, with p-value indicated. Significance in i and j was assessed by paired t-tests with Bonferroni correction. Reported p-values are adjusted. *p≤0.05, **p≤0.01, ***p≤0.001. In (e, h, i, j) each data point corresponds to the average value for synchronized/non-synchronized cell pairs (e, h) or respective number of cells apart over a single simulated islet.
Figure 5—figure supplement 1
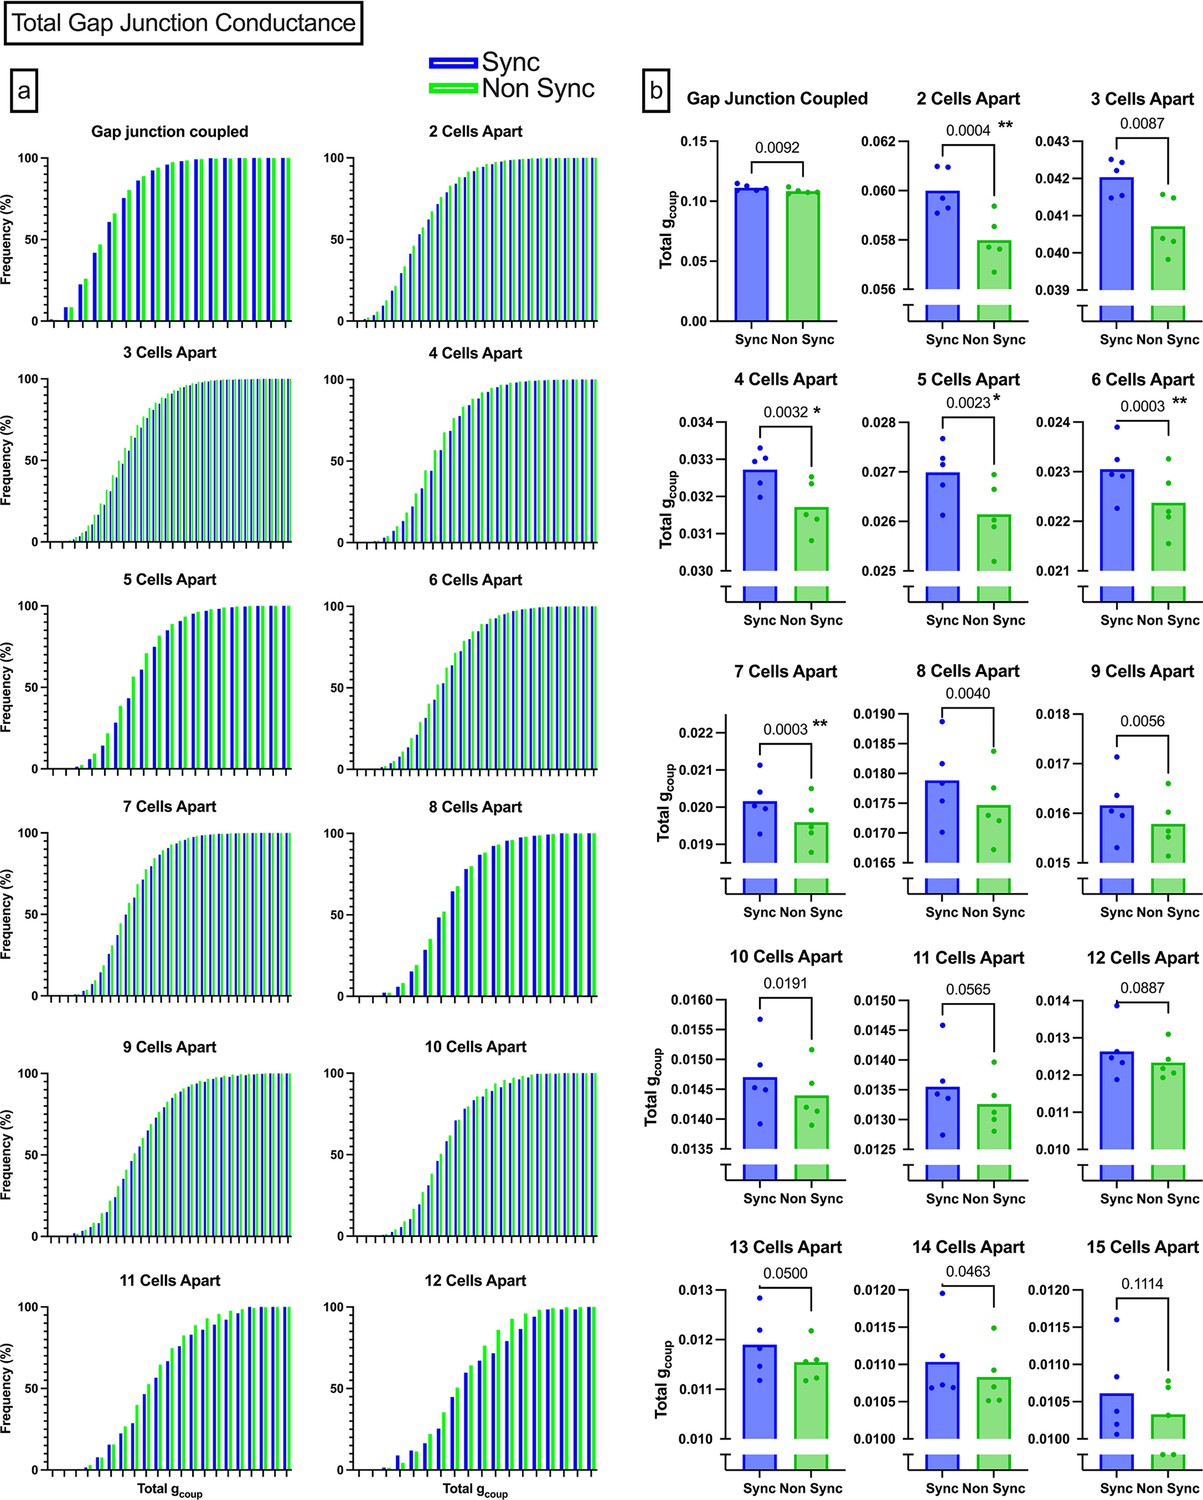
Paths that maximized gap junction conductivity.
(a) Cumulative distribution functions of total conductance between two cells from 1 to 12 cells apart. Synchronized CDF is shown in blue, non-synchronized CDF is shown in green. (b) Bar charts comparing the average conductance for synchronized and non-synchronized cells. p-Values are not corrected, but significance (denoted by asterisks) is determined using a Bonferroni-corrected paired t-test. Since there were 15 cell distances, significance threshold was set at α=0.003.
Figure 5—figure supplement 2

Paths that maximized metabolic rate.
(a) Cumulative distribution functions of total kglyc between two cells from 1 to 12 cells apart. Synchronized CDF is shown in blue, non-synchronized CDF is shown in green. (b) Bar charts comparing the average conductance for synchronized and non-synchronized cells. p-Values are not corrected, but significance (denoted by asterisks) is determined using a Bonferroni-corrected paired t-test. Since there were 15 cell distances, significance threshold was set at α=0.003.
Figure 6 with 1 supplement
Experimental islet functional networks are influenced by changes in the structural network.
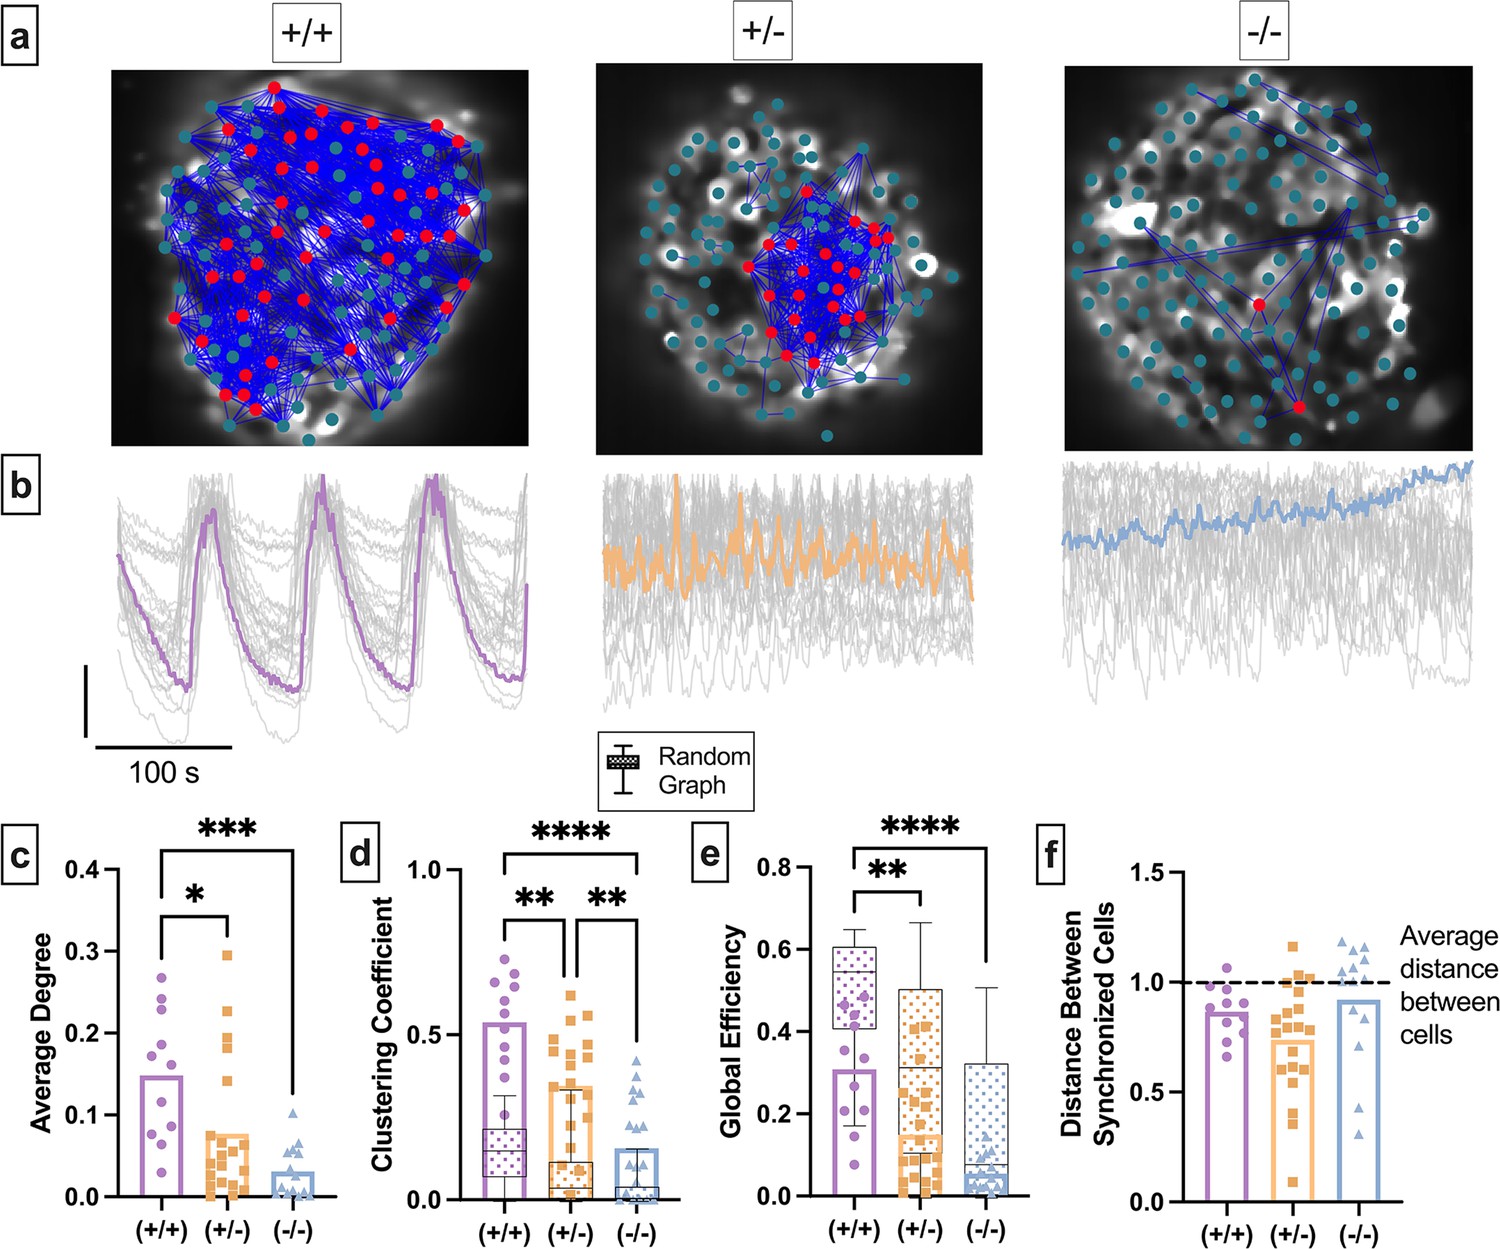
(a) Representative images of Cx36+/+ islet (left), heterozygous Cx36+/- islet (middle), and homozygous islet (right), overlaid with a synchronization network. Dot signifies a cell, blue lines represent functional network edges that connect synchronized cells. Red cells are β-cell hubs. (b) Oscillations in [Ca2+] of corresponding islet in a. Gray lines represent time course for each cell, colored line represents mean islet time course. (c) Normalized degree of functional network between cell pairs for each islet in the Cx36+/+, Cx36+/-, Cx36-/- mice. (d) Clustering coefficient of the functional network for each islet in the Cx36+/+, Cx36+/-, Cx36-/- mice. Overlaid is the box and whisker plot of 1000 random networks per islet. (e) As in d for global efficiency. (f) Average distance between synchronized cells normalized to average distance between all cells in islet. Dashed line shows average distance between cells. Adjusted p-values: *p≤0.05, **p≤0.01, ***p≤0.001 For c–d, each dot represents an islet.
Figure 6—figure supplement 1
Alternative network metrics for calcium islets from Cx36KO (Cx36 knockout) mice.
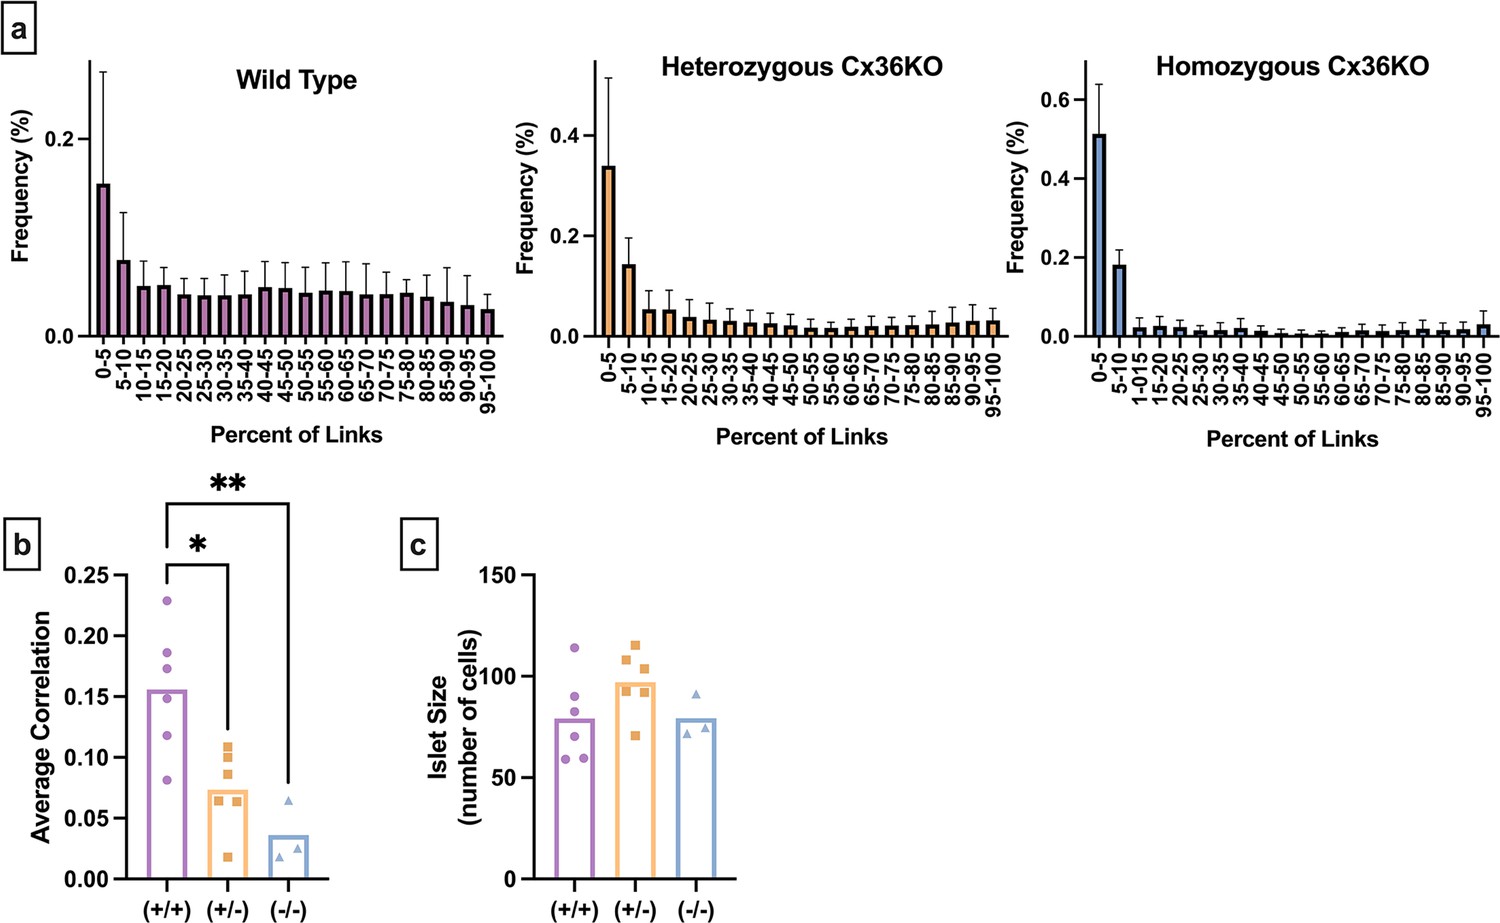
(a) Averaged degree distribution histograms for all islets analyzed. Error bars indicate standard deviation. Purple (top) histogram shows the distribution of connections for wild-type (Cx36+/+) islets. Orange (middle) shows the distribution of connections for heterozygous Cx36 knockout (Cx36+/-) islets. Blue (right) shows the distribution of connections for homozygous Cx36 knockout (Cx36-/-) islets. (b) Average Pearson cross-correlation coefficient, between all islet in the islet. (c) Number of cells in each islet. Significance or lack thereof is determined by an ordinary one-way ANOVA and Tukey’s multiple comparison test. *p≤0.05, **p≤0.01.
Figure 7 with 1 supplement
Simulated islet functional networks are influenced by changes in the structural network.
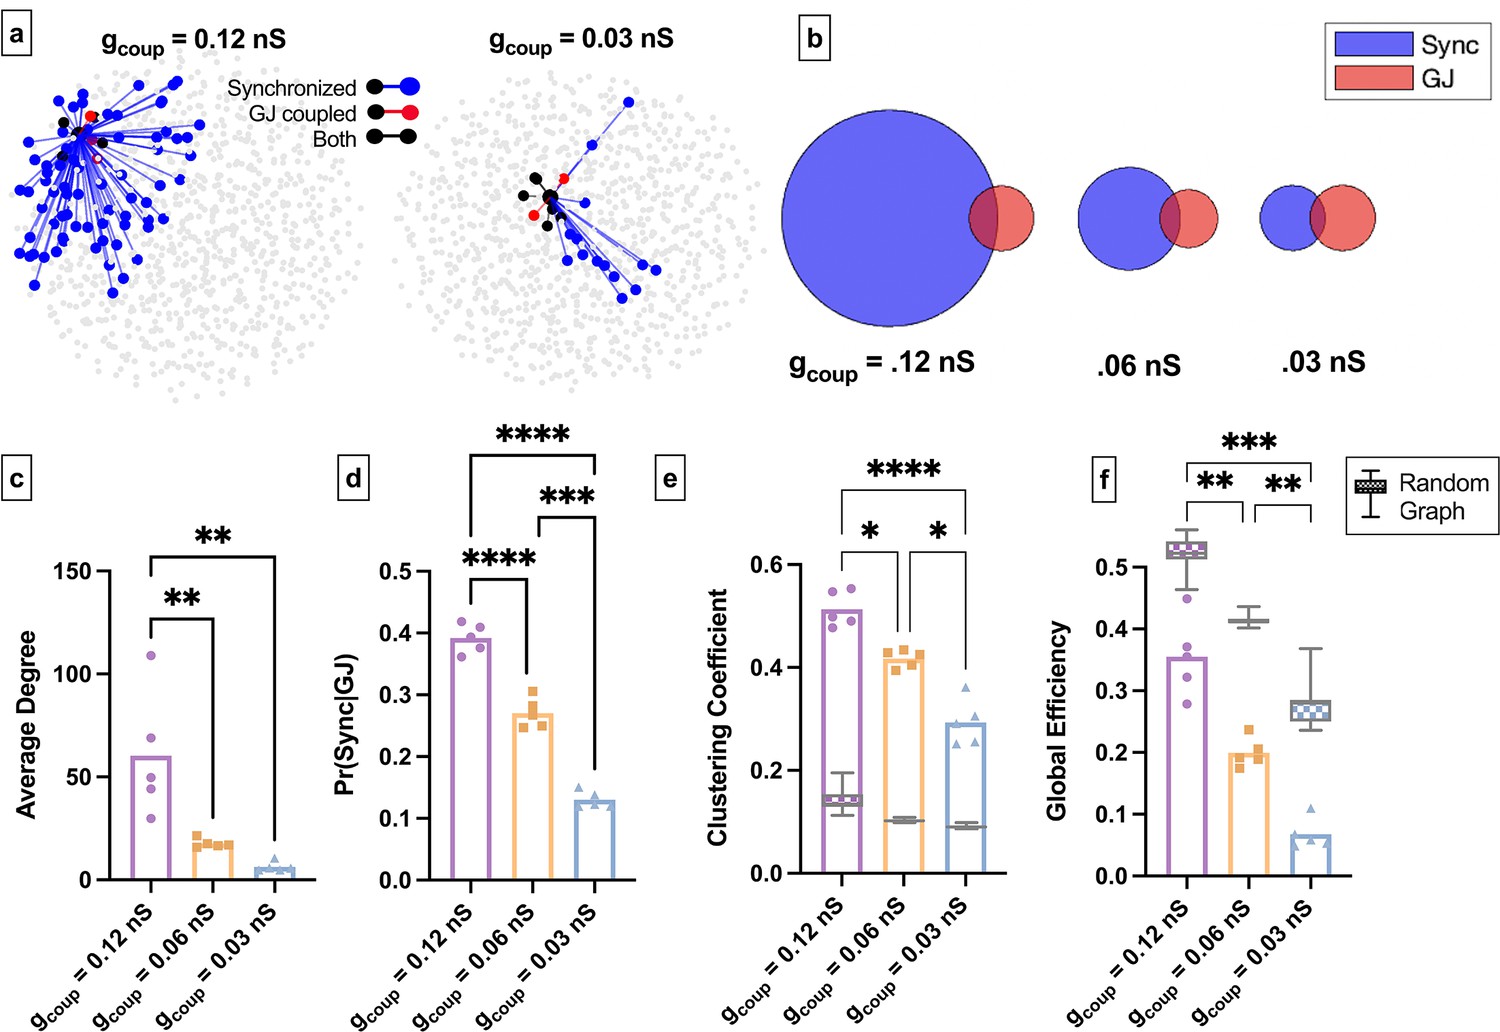
(a) Functional connections and structural connections in simulated islets of hub cells for high and low gap junction conductance. Blue cells and edges indicate cells determined as ‘synchronized’ via functional network analysis. Red cells are GJ coupled. Black cells are both GJ coupled and synchronized. (b) Venn diagrams of the probability of synchronization and probability of gap junction with the probability of both synchronization and gap junction as the overlapped area. (c) Average degree in the functional network. (d) Probability that two cells are synchronized given they share a gap junction connection. (e) Clustering coefficient for 0.12nS, 0.06nS, 0.03nS , for each simulated islet. Overlaid is the box and whisker plot of 1000 random networks per simulated islet. (f) As in e for global efficiency for 0.12nS, 0.06nS, 0.03nS, for each simulated islet. Adjusted p-values: *p≤0.05 , **p≤0.01, ***p≤0.001. For c–f, each dot represents a simulated islet.
Figure 7—figure supplement 1
Alternative network metrics for simulated islet with gap junction coupling change.
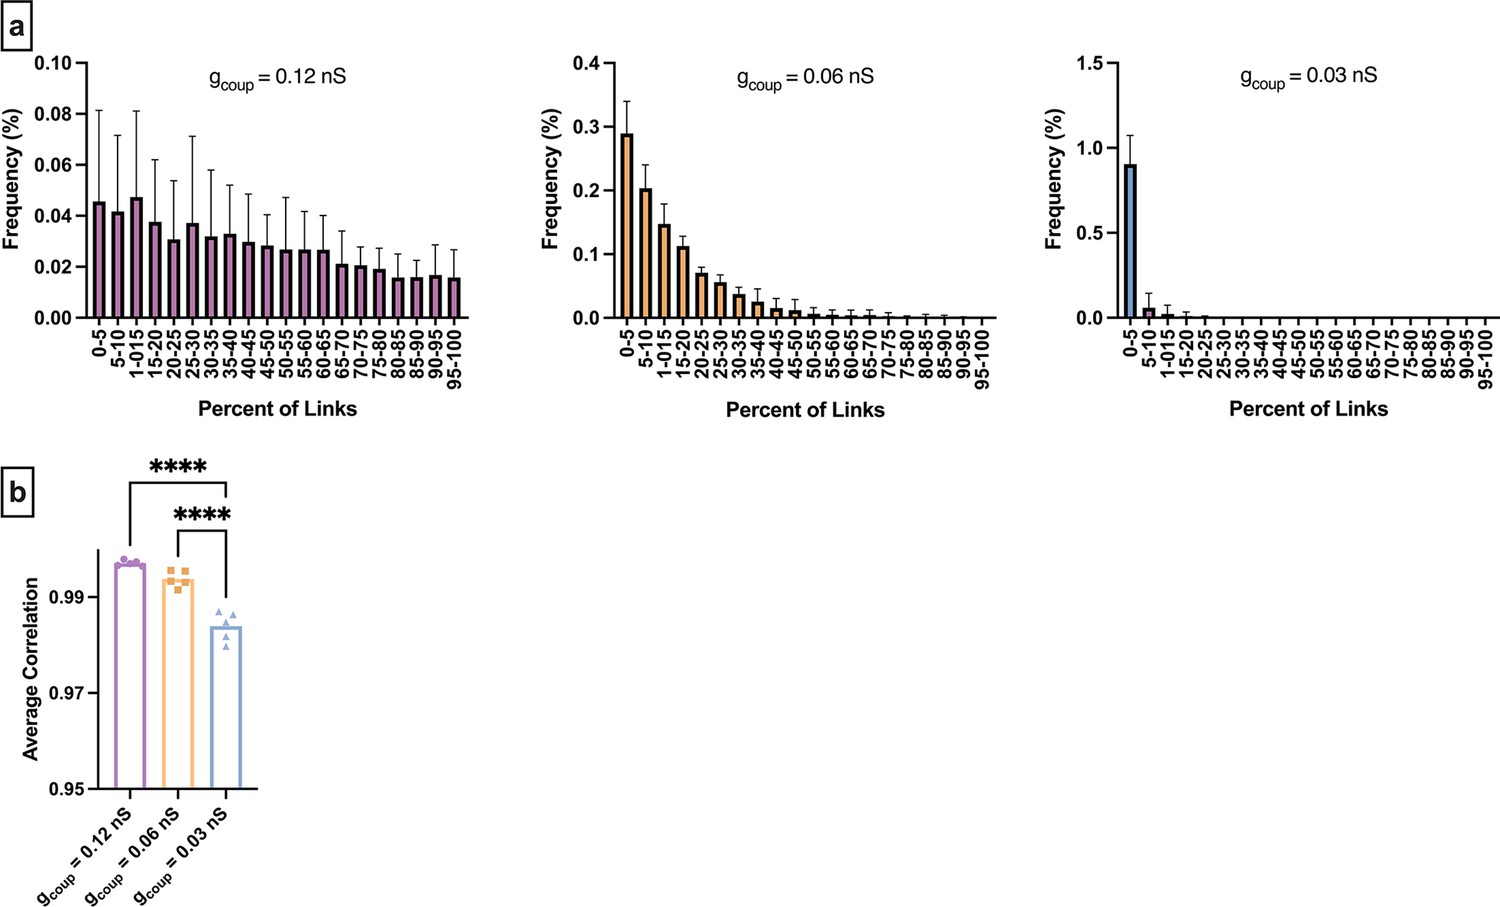
(a) Averaged degree distribution histograms for all islets analyzed. Error bars indicate standard deviation. Purple (top) histogram shows the distribution of connections for fully coupled (0.12 nS) islets. Orange (middle) shows the distribution of connections for half coupled (0.06 nS) islets. Blue (right) shows the distribution of connections for homozygous quarter coupled (0.03 nS) islets. (b) Average Pearson cross-correlation coefficient between all islets in the islet. Significance or lack thereof is determined by an ordinary one-way ANOVA and Tukey’s multiple comparison tests. *p≤0.05, **p≤0.01.
Figure 8
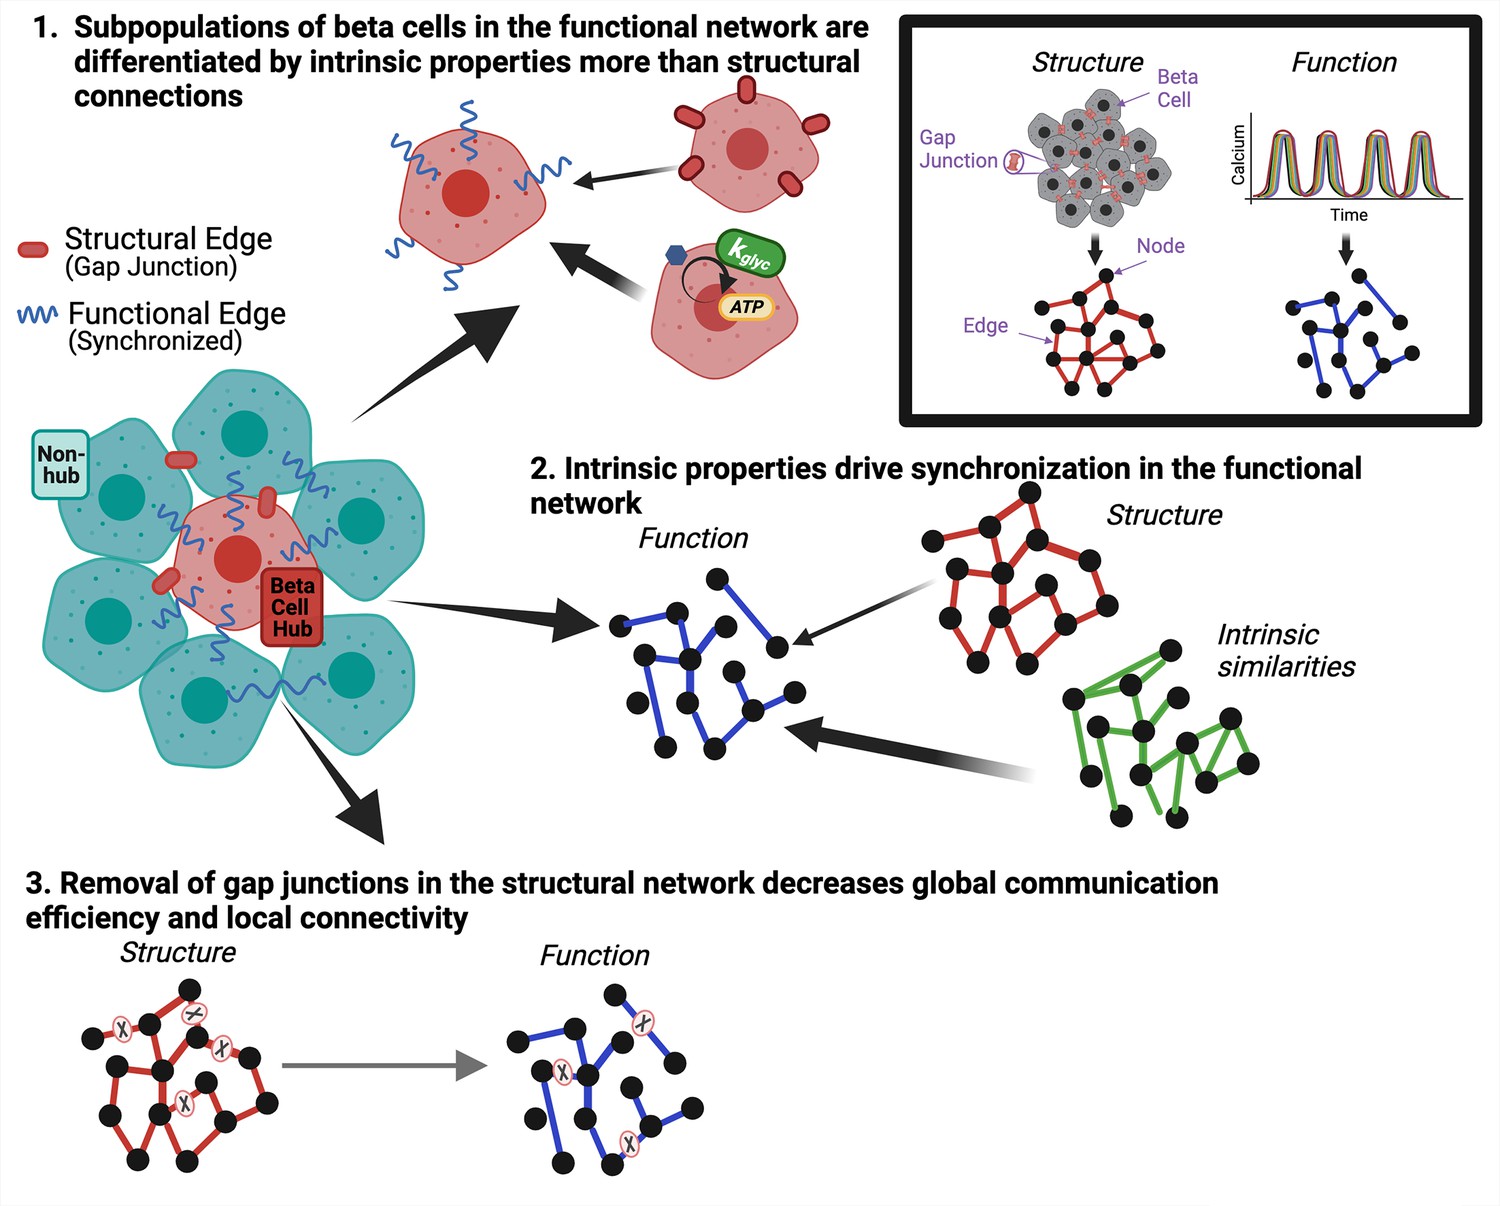
Graphical summary of results.
Graphical summary of results from data. Inset shows how structural gap junctions are translated to structural network and synchronized calcium oscillations are translated to functional network. To answer question 1 we show that subpopulations of β-cells in the functional network are driven by intrinsic properties more than gap junction coupling (top). To answer question 2, we show that intrinsic properties of the β-cells drive synchronization in the functional network (right). To answer question 3, we show that removal of gap junctions in the structural network decreases global communication efficiency and local connectivity (bottom).
Author response image 1

Author response image 2
Tables
Table 1
Essential network statistics and types.
Left: Five network statistics used to quantify the network in this paper. Representative networks show an example of the statistic in red and the rest of the network in blue. Right: Five network types referred to in this paper. Regular, small world, and random networks are all made with the same number of nodes and edges, but different configurations of edges. Scale free network shows three “hub” nodes where node size is proportional to degree.
| Network essentials | |||||
|---|---|---|---|---|---|
| Network statistics | Network types | ||||
| Degree | Number of edges for a given node |  | Regular | A network with ordered connections: high clustering coefficient and long average path length |  |
| Degree distribution | The distribution of the network’s degrees | Small world | A regular network with a few rewired edges: high clustering coefficient and short average path length | 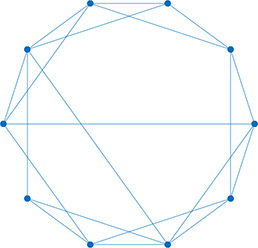 | |
| Clustering coefficient | Likelihood of how often neighbors of a node share connections with each other | 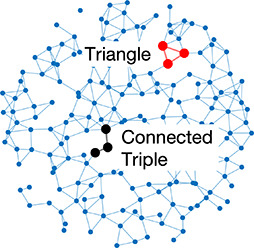 | Random | A network with random connections has low clustering coefficient and short average path length |  |
| Shortest path | Shortest distance between any two nodes | 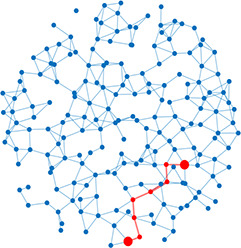 | Scale-free | A network whose degree distribution follows a power law, such that there are a few very highly connected nodes called hubs |  |
| Efficiency | Inverse of the shortest path | Weighted | A network whose edges are weighted by some edge property |  | |
Author response table 1
| UnpairedP-value | Pairedp-value | Shapiro-Wilk Normality Test (Yes = normally distributed)(Hubs/Non-hubs) | Kolmogorov-Smirnov Normality Test(Yes = normally distributed)(Hubs/Non-hubs) | |
|---|---|---|---|---|
| kglyc | <0.0001 | 0.0001 | Yes/Yes | Yes/Yes |
| gcoup | 0.0180 | 0.0147 | Yes/Yes | Yes/Yes |
| gKATP | 0.1602 | 0.1829 | Yes/No | Yes/Yes |
Additional files
Download links
A two-part list of links to download the article, or parts of the article, in various formats.
Downloads (link to download the article as PDF)
Open citations (links to open the citations from this article in various online reference manager services)
Cite this article (links to download the citations from this article in formats compatible with various reference manager tools)
β-cell intrinsic dynamics rather than gap junction structure dictates subpopulations in the islet functional network
eLife 12:e83147.
https://doi.org/10.7554/eLife.83147


