VLA-4 suppression by senescence signals regulates meningeal immunity and leptomeningeal metastasis
- Guangdong Provincial Key Laboratory of Malignant Tumor Epigenetics and Gene Regulation, Medical Research Center, Sun Yat-Sen Memorial Hospital, Sun Yat-Sen University, China
- Breast Tumor Center, Sun Yat-Sen Memorial Hospital, Sun Yat-Sen University, China
- Department of Neurosurgery, Sun Yat-sen University, China
- Department of Medical Oncology, State Key Laboratory of Oncology in South China, Collaborative Innovation Center for Cancer Medicine, Sun Yat-sen University Cancer Center, China
- Department of Immunology, Zhongshan School of Medicine, Sun Yat-Sen University, China
- Department of Infectious Diseases, Third Affiliated Hospital of Sun Yat-sen University, China
- Guangdong Provincial Key Laboratory of Liver Disease Research, the Third Affiliated Hospital, Sun Yat-Sen University, China
Figures
Figure 1 with 1 supplement
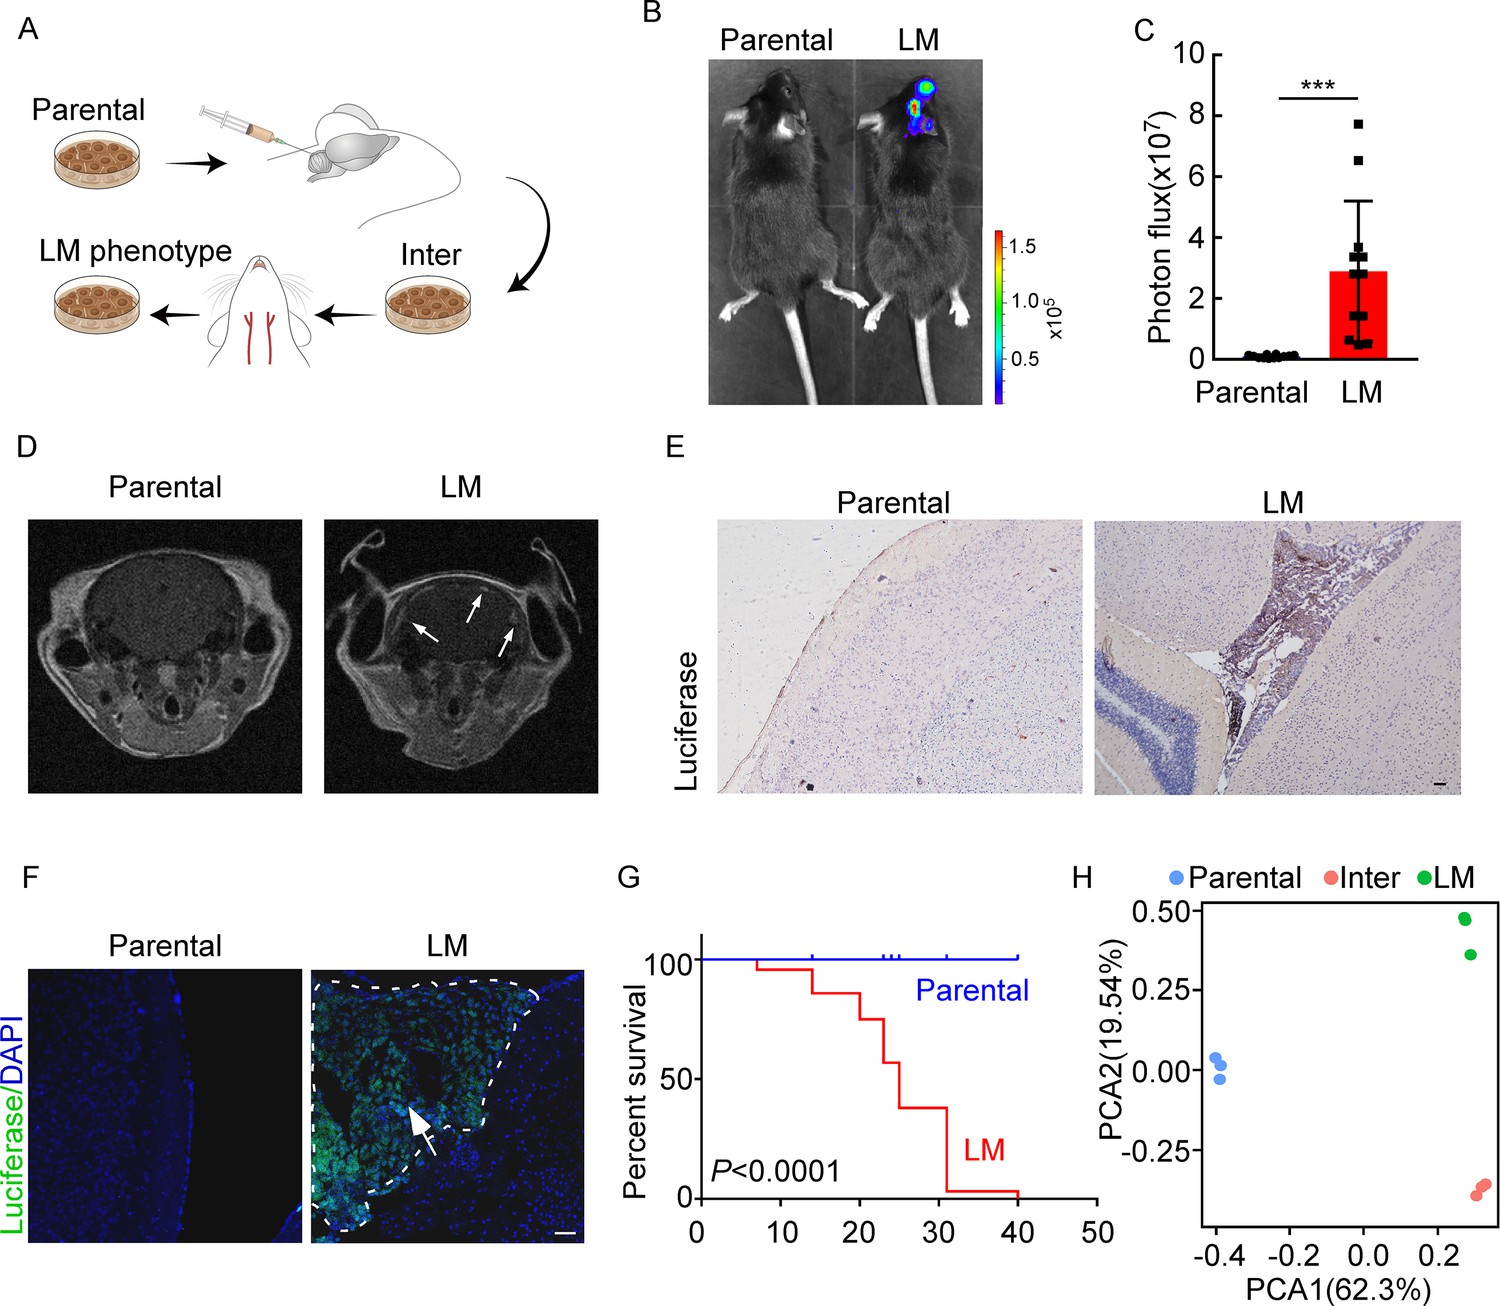
Establishing a model of breast cancer leptomeningeal metastasis (LM).
(A) An illustration showing iterative in vivo selection of LM derivative cell lines. 2 × 10⁴ tumor cells transduced with lentiviral vectors expressing luciferase were injected into the cisterna magna of recipient mice. When LM lesions were detected by IVIS, the mice were euthanized. Cells were collected and cultured before being injected into the other mice. This procedure was carried out three times to generate intermediate (Inter) cells. Next, 1 × 10⁵ Inter cells were inoculated into the intracarotid artery. Mice bearing LM were sacrificed and tumor cells were collected from the meninges and denoted as LM derivatives. (B–G) 1 × 10⁵ EO771 parental or LM-phenotype cells were inoculated into the intracarotid artery of recipient mice. (B, C) Tumor growth was monitored by bioluminescence imaging (BLI) imaging at day 28. Representative BLI images (B) and quantitation (C) are shown (mean ± SD, n = 12 mice per group). ***p<0.001 by two-tailed Student’s t test. (D) MRI at day 28 post-inoculation revealed LM was formed after LM-phenotype cell inoculation. The white arrows indicate metastatic lesions. (E) Neuro-anatomic localization of metastases was determined by immunohistochemical staining. Scale bar = 50 μm. (F) Representative pictures of immunofluorescent staining for LM lesions in mice (luciferase, green; DAPI, blue). The white line indicates the border of the metastatic lesions. Scale bar = 50 μm. (G) Kaplan–Meier plot of overall survival of mice. (H) Principal component analysis (PCA) plots of gene expression data showing a segregation among parental (blue), LM-phenotype (green), and inter (orange) cell lines. Genes with base mean ≥ 50, fold change ≥2 or ≤0.5 and p<0.01 were included for analysis.
-
Figure 1—source data 1
RNA sequencing data generated in Figure 1H.
- https://cdn.elifesciences.org/articles/83272/elife-83272-fig1-data1-v3.zip
Figure 1—figure supplement 1
Establishing a model of leptomeningeal metastasis (LM).
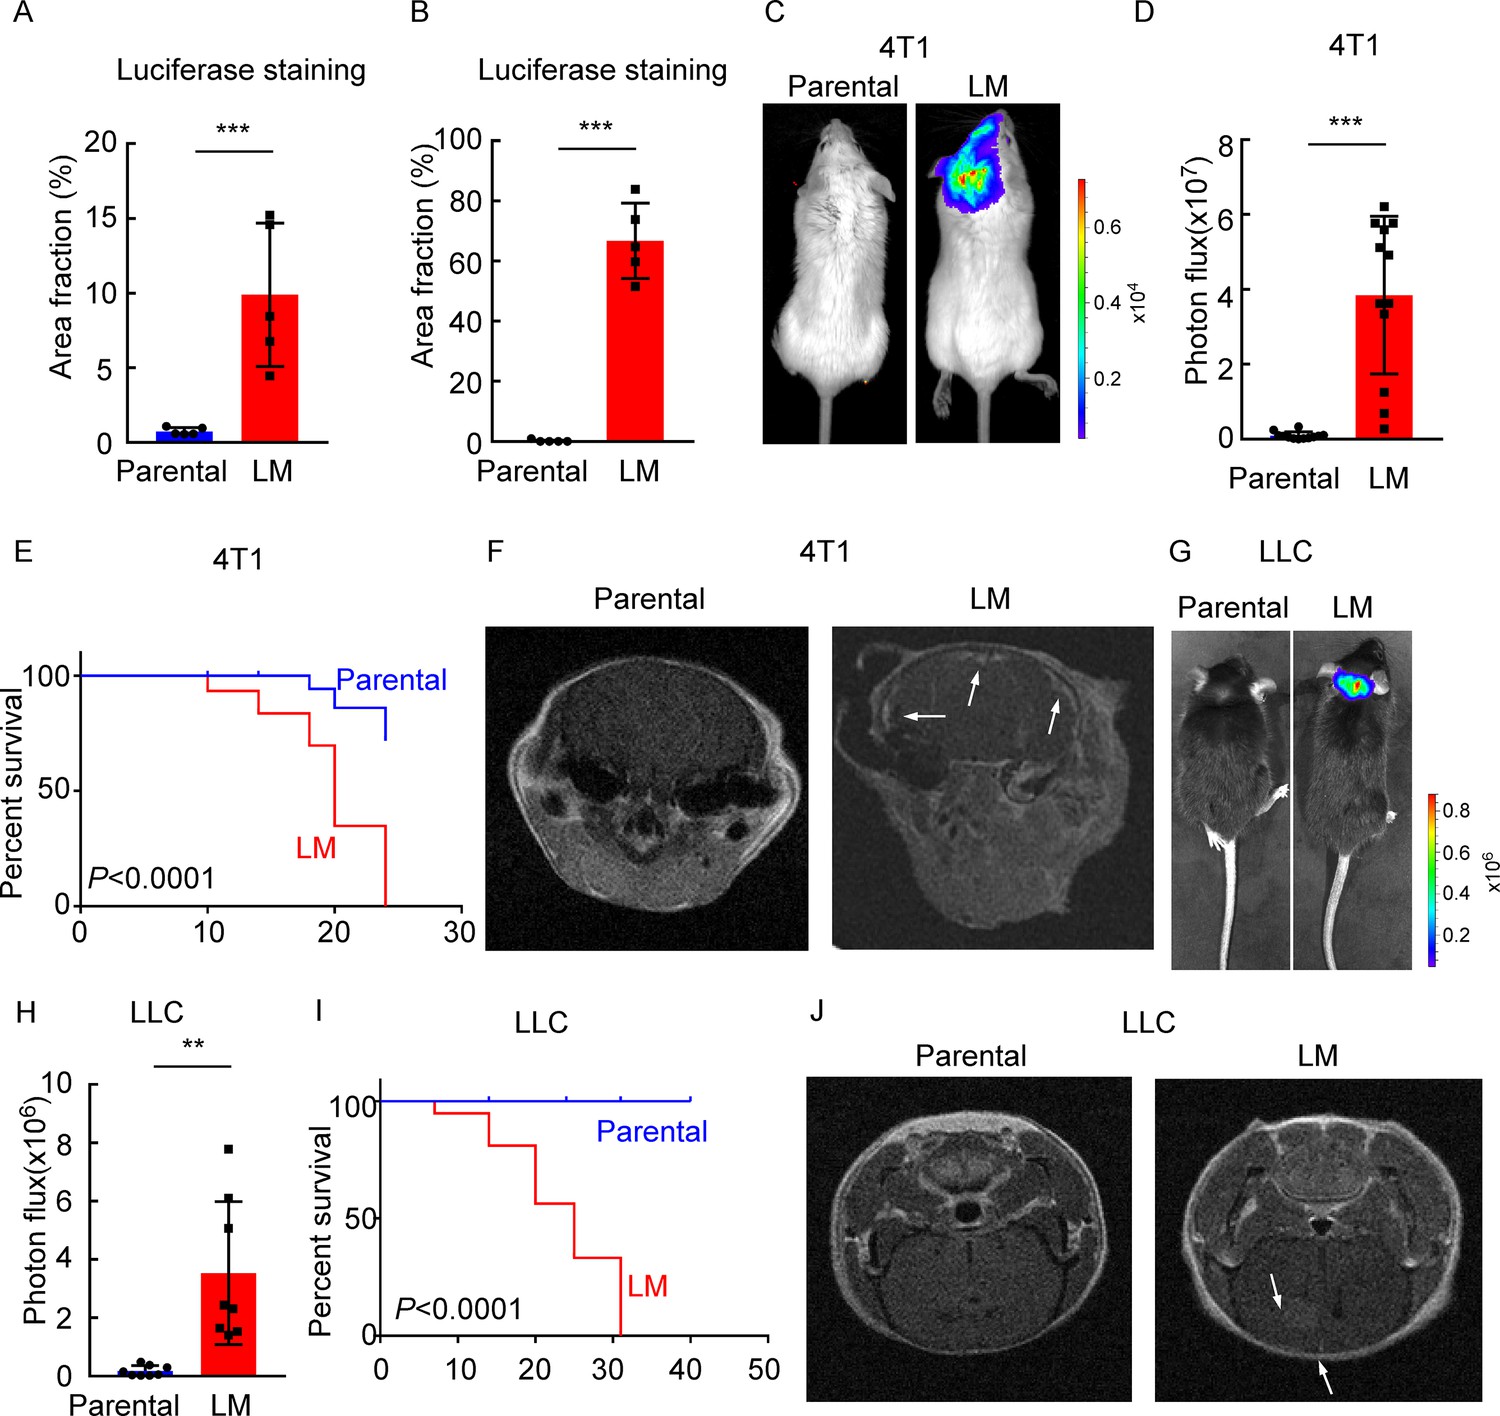
(A) Quantification of Figure 1E (mean ± SD, n = 5 per group). ***p<0.001 by two-tailed Student’s t test. (B) Quantification of Figure 1F (mean ± SD, n = 5 per group). ***p<0.001 by two-tailed Student’s t test. (C–F) 1 × 10⁵ 4T1 parental or LM-phenotype cells were inoculated into the intracarotid artery of recipient mice. (C) Representative bioluminescence imaging (BLI) images are shown. (D) Histogram represents in vivo BLI imaging at day 28 post-injection (mean ± SD, n = 12 per group.). ***p<0.001 by two-tailed Student’s t test. (E) Kaplan–Meier plot of overall survival of mice. (F) MRI at day 28 post-inoculation revealed LM was formed after LM-phenotype cell inoculation. The white arrows indicate metastatic lesions. (G–J) 1 × 10⁵ LLC parental or LM-phenotype cells were inoculated into the intracarotid artery of recipient mice. (G) Representative BLI images are shown. (H) Histogram represents in vivo BLI imaging at day 28 post-injection (mean ± SD, n = 8 per group). **p<0.01 by two-tailed Student’s t test. (I) Kaplan–Meier plot of overall survival of mice. (J) MRI at day 28 post-inoculation revealed LM was formed after LM-phenotype cell inoculation. The white arrows indicate metastatic lesions.
Figure 2 with 1 supplement
CD8+ T cells constrain leptomeningeal metastasis (LM).
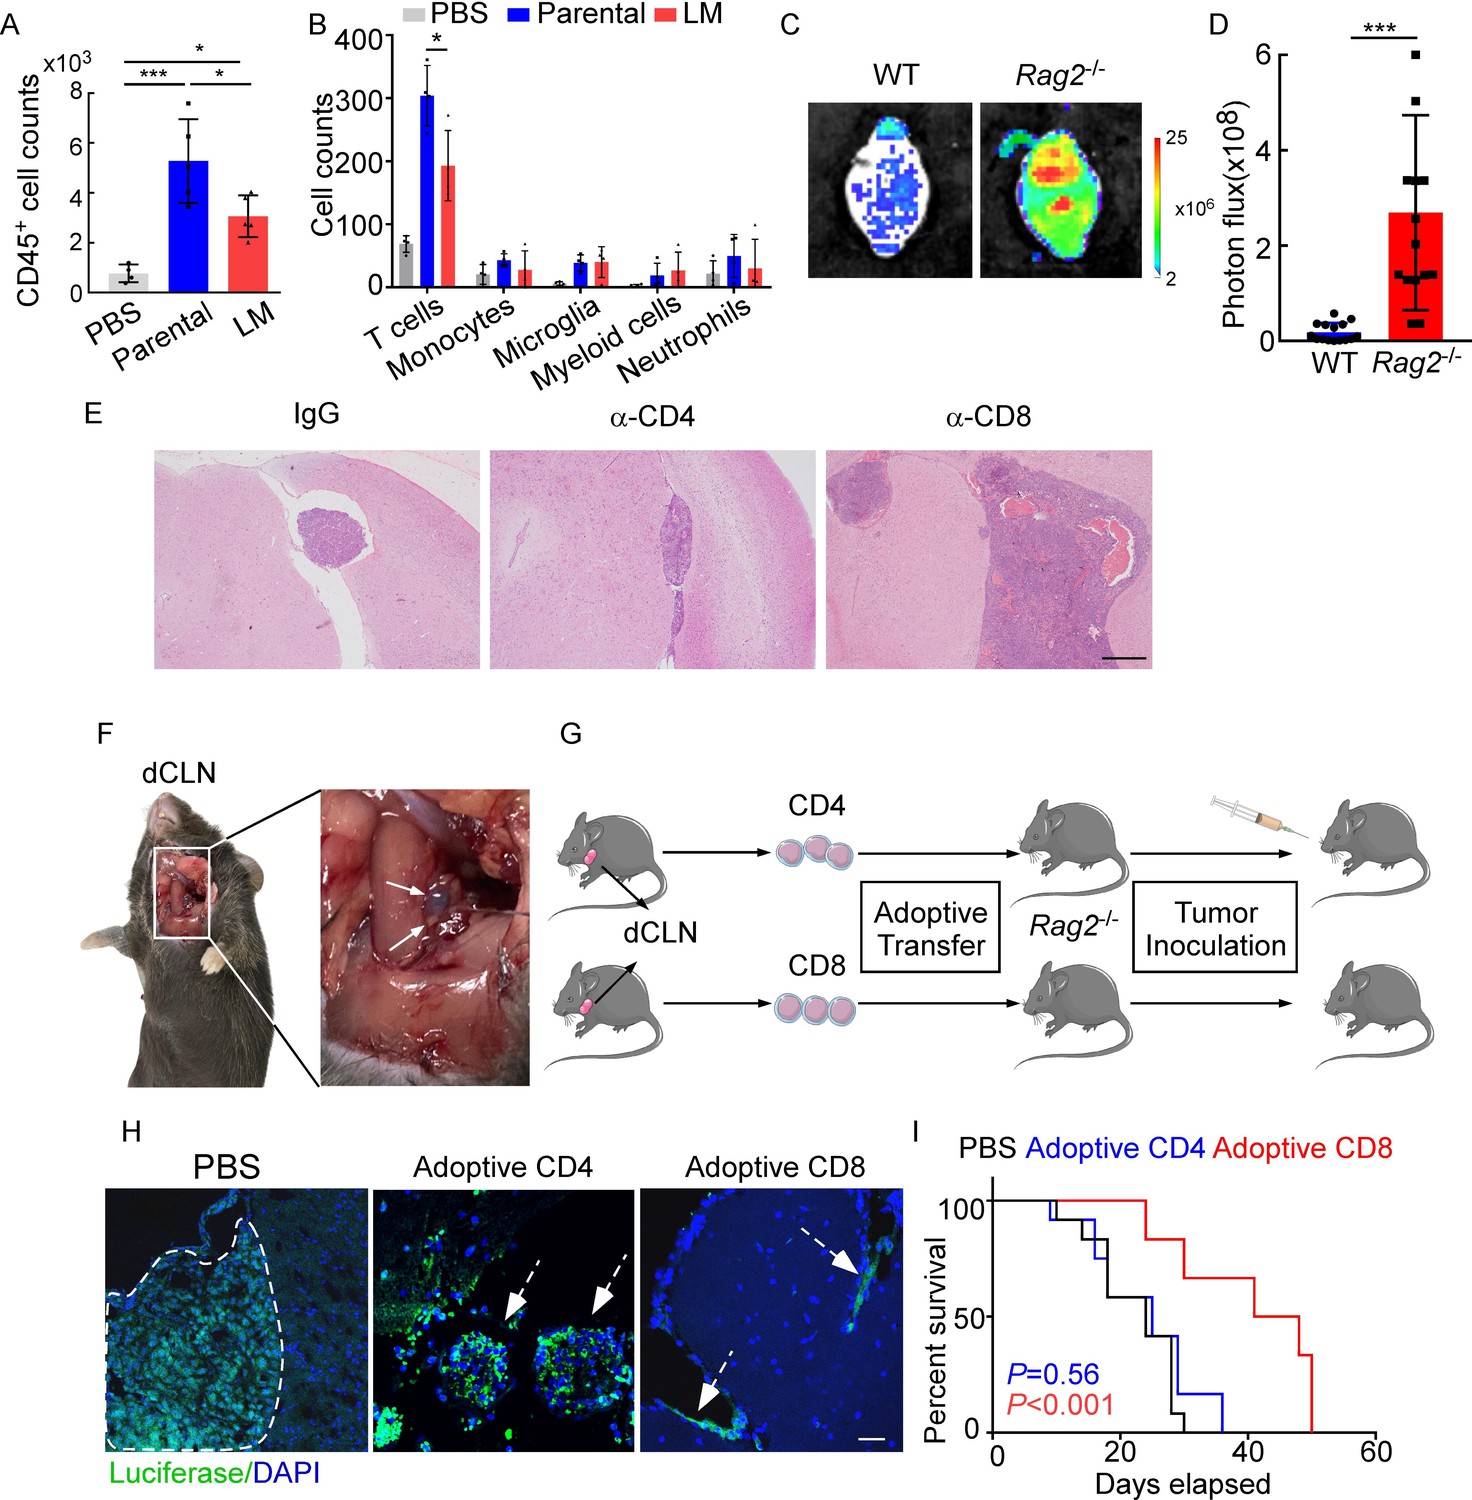
(A–B) PBS, 1 × 10⁵ EO771 parental or LM-phenotype cells were inoculated into the intracarotid artery of recipient mice. (A) Histogram represents the absolute number of meningeal CD45+ immune cells (mean ± SD. PBS n = 4 per group; parental, LM n = 5 per group). *p<0.05, ***p<0.001 by one-way ANOVA with Tukey’s multiple-comparison test. (B) Histogram represents the absolute number of diverse meningeal immune cells mice (mean ± SD, n = 4 per group). *p<0.05 by one-way ANOVA with Tukey’s multiple-comparison test. (C, D) 1 × 10⁵ EO771 LM-phenotype cells were injected into the intracarotid artery of wild type C57BL/6 (WT) or Rag2-/- mice. Representative images (C) and quantitation (D) for tumor growth monitored by bioluminescence imaging (BLI) at day 28 post-injection (mean ± SD, n = 12 per group.). ***p<0.001 by two-tailed Student’s t test. (E) 1 × 10⁵ LM-phenotype cells were inoculated into the intracarotid artery of WT C57BL/6 mice treated with IgG, anti-CD4 (α-CD4), or anti-CD8 neutralizing antibodies (α-CD8), respectively. Representative images for intracranial tumor lesions are shown. Scale bar = 20 μm. (F) Evans blue was injected into the cisterna magna of WT C57BL/6 mice. The presence of dye in deep cervical lymph nodes (dCLNs) was detected after 30 min. Representative images of the Evans blue accumulation in the dCLN. The white arrowhead points to the dCLN. (G–I) CD4+ and CD8+ T cells were isolated from dCLNs of WT mice injected with EO771 cells and adoptively transferred into Rag2-/- mice, followed by the inoculation of LM-phenotype cells. (G) Schematics of the adoptive cell transfer model in immunocompetent mice. (H) Representative immunofluorescence staining for LM lesions in mice with indicated treatment (luciferase, green; DAPI, blue). The white line and arrows indicate the border of the metastatic lesions. Scale bar = 50 μm. (I) Kaplan–Meier plots of overall survival of mice with indicated treatment. Black, PBS (n = 12); blue, adoptive transfer of CD4+ T cells (n = 12, p=0.56 compared with mice treated with PBS); red, adoptive transfer of CD8+ T cells (n = 12, p<0.001 compared with mice treated with PBS).
Figure 2—figure supplement 1
CD8+ T cells play a role in constraining intracranial tumor growth.
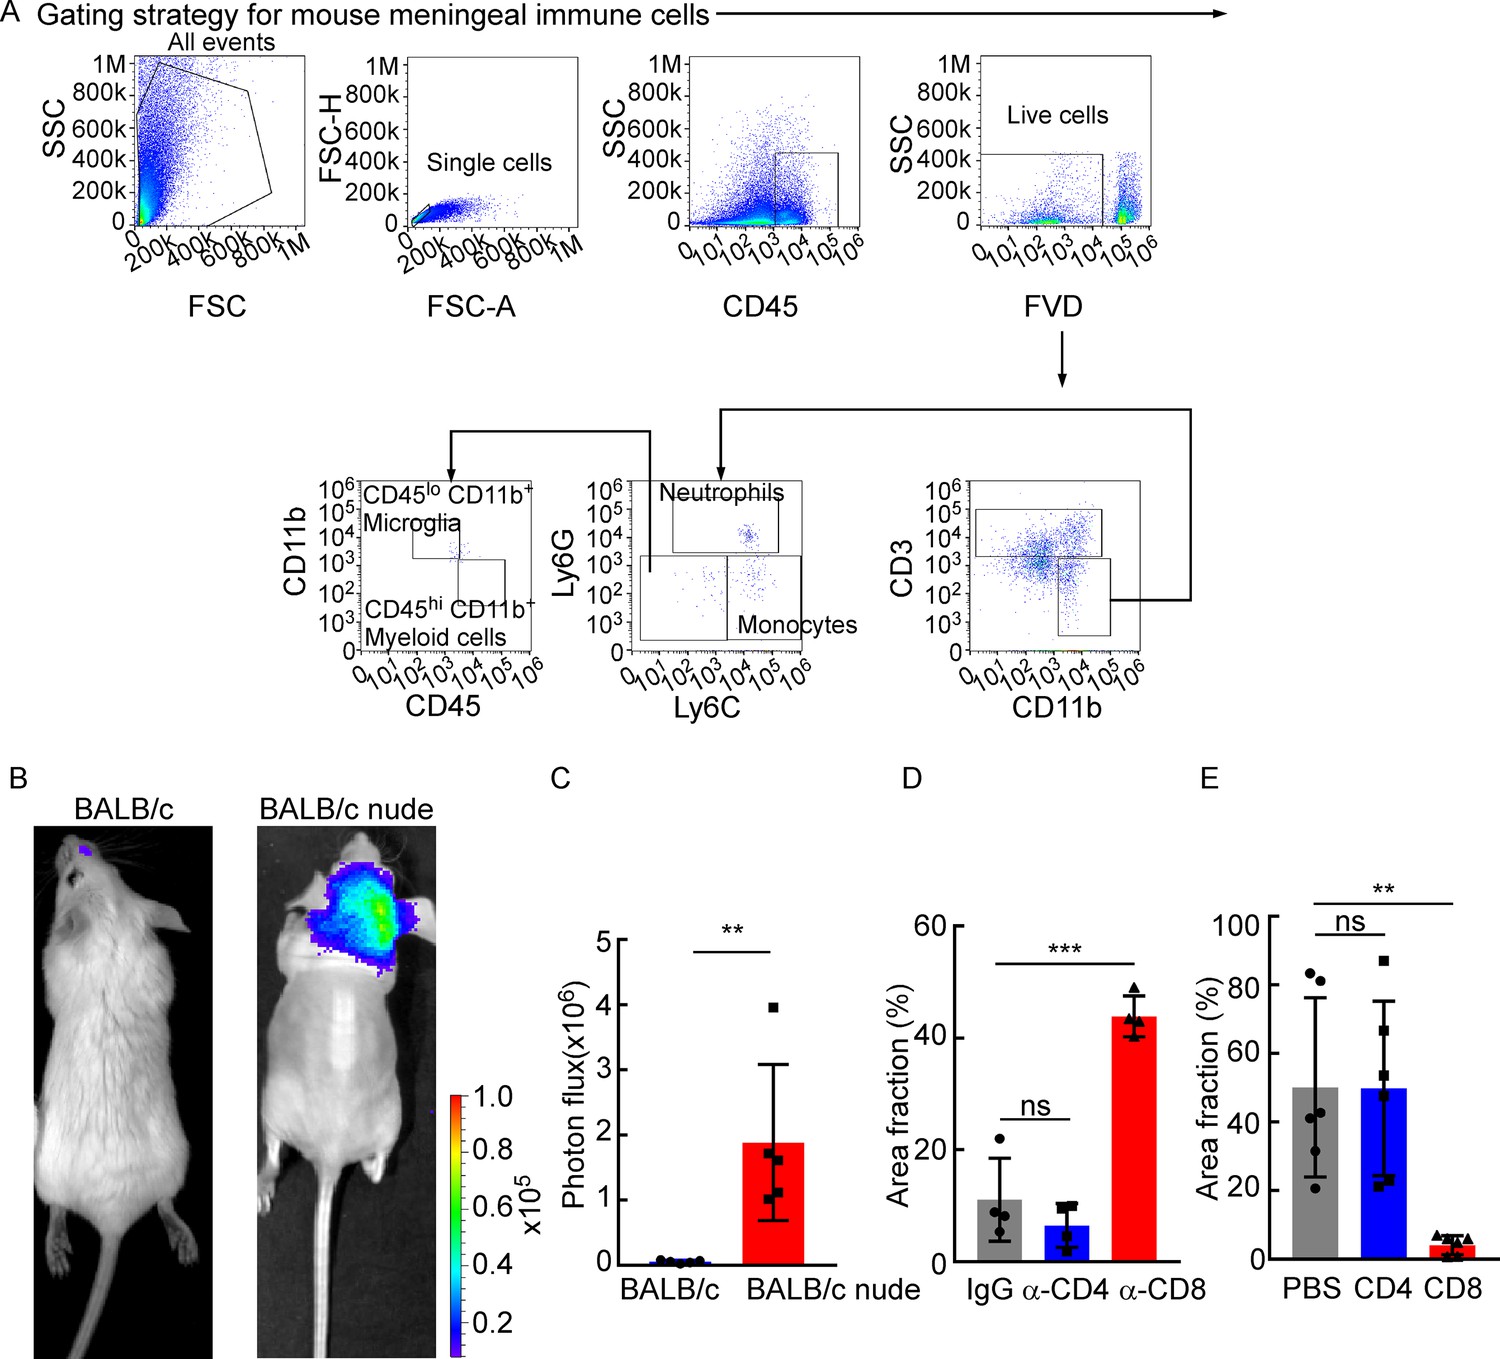
(A) The gating strategy for mouse meningeal immune cells in Figure 2A and B. (B, C) 5 × 10⁴ 4T1 leptomeningeal metastasis (LM)-phenotype cells were injected into the intracarotid artery of wild type BABL/c or BALB/c nude mice. (B) Representative bioluminescence images (BLI) for tumor growth of wild type BALB/c and BALB/c nude mice monitored by BLI . (C) Histogram represents in vivo BLI imaging at day 28 post-injection (mean ± SD, n = 5 per group). **p<0.01 by two-tailed Student’s t test. (D) Comparison of tumor area in Figure 2E (H&E, mean ± SD, n = 4 per group). ns, not significant, ***p<0.001 by one-way ANOVA with Tukey’s multiple-comparison test. (E) Comparison of tumor area in Figure 2H (IF, mean ± SD, n = 6 per group). ns, not significant, **p<0.01 by one-way ANOVA with Tukey’s multiple-comparison test.
Figure 3 with 1 supplement
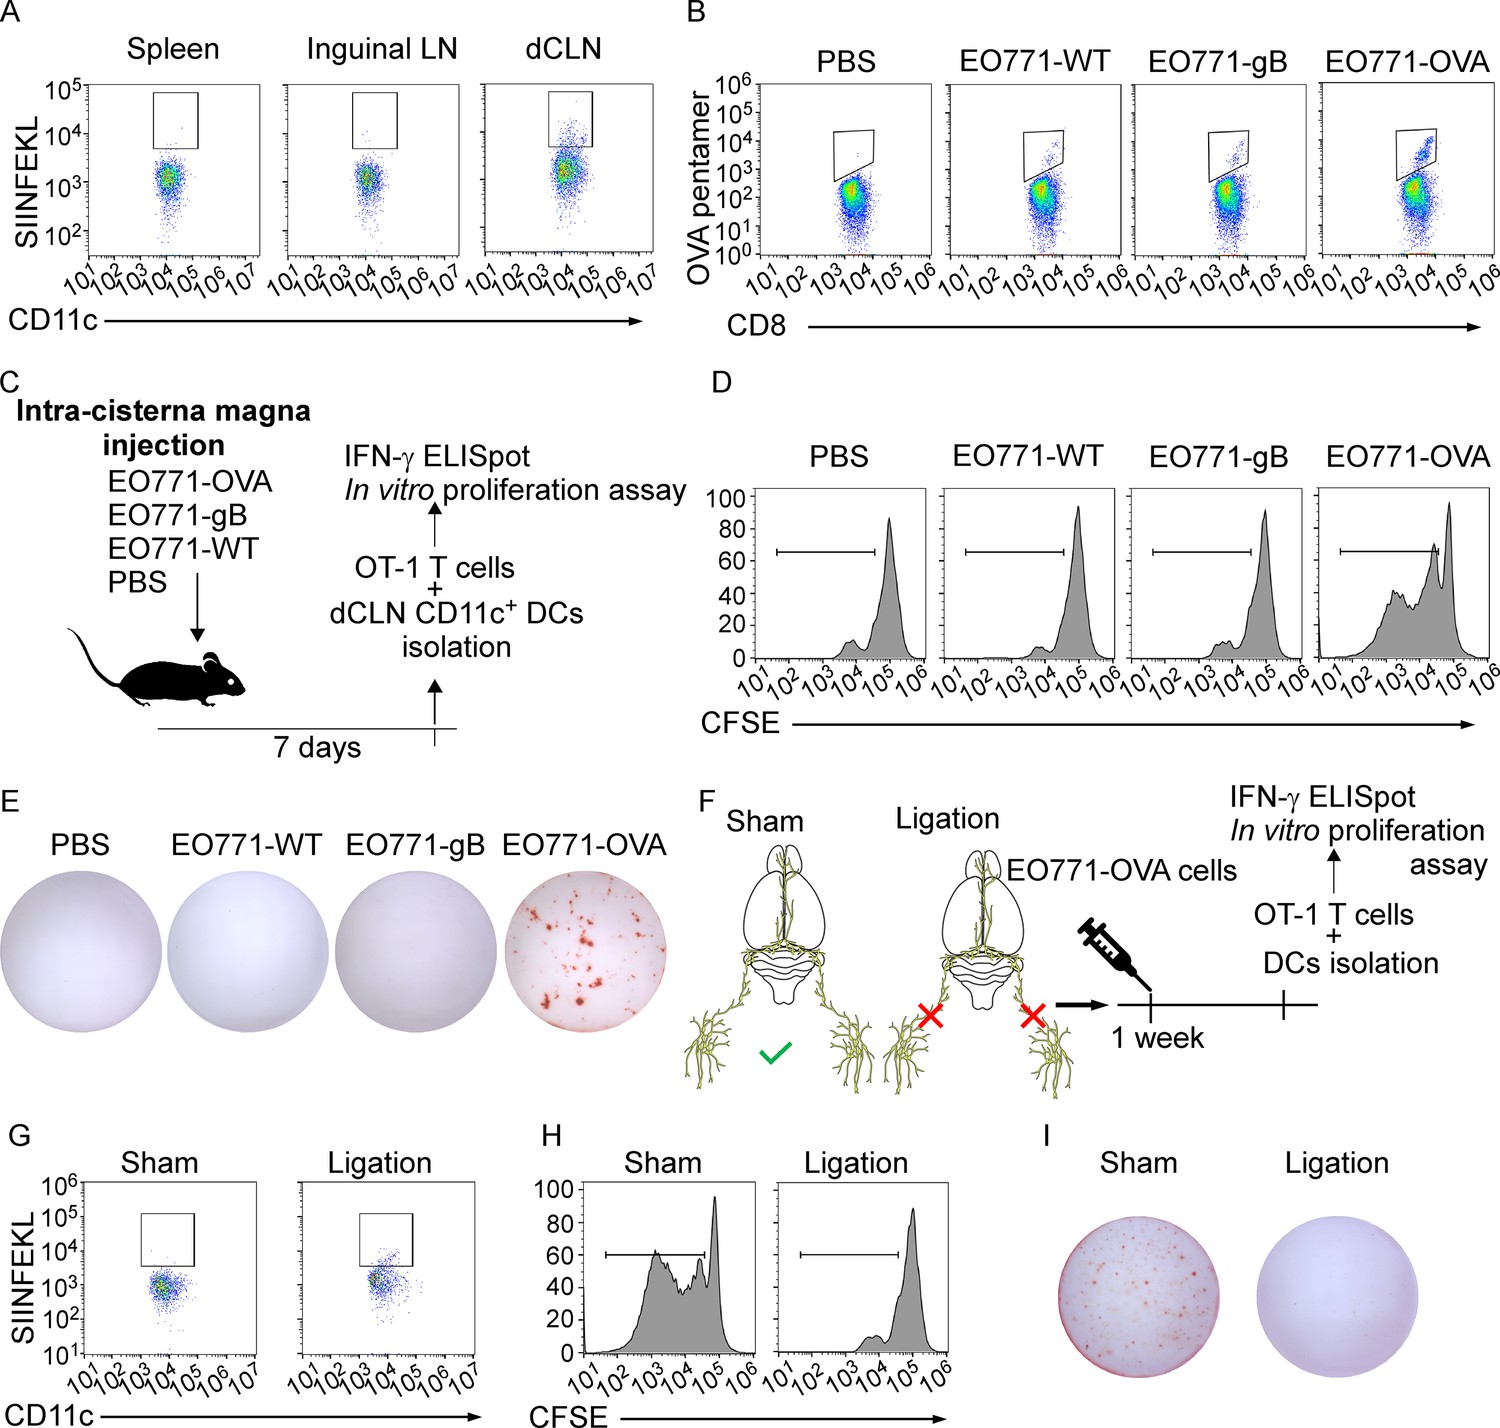
Deep cervical lymph nodes (dCLNs) generate tumor-specific CD8+ T cells against leptomeningeal metastasis (LM).
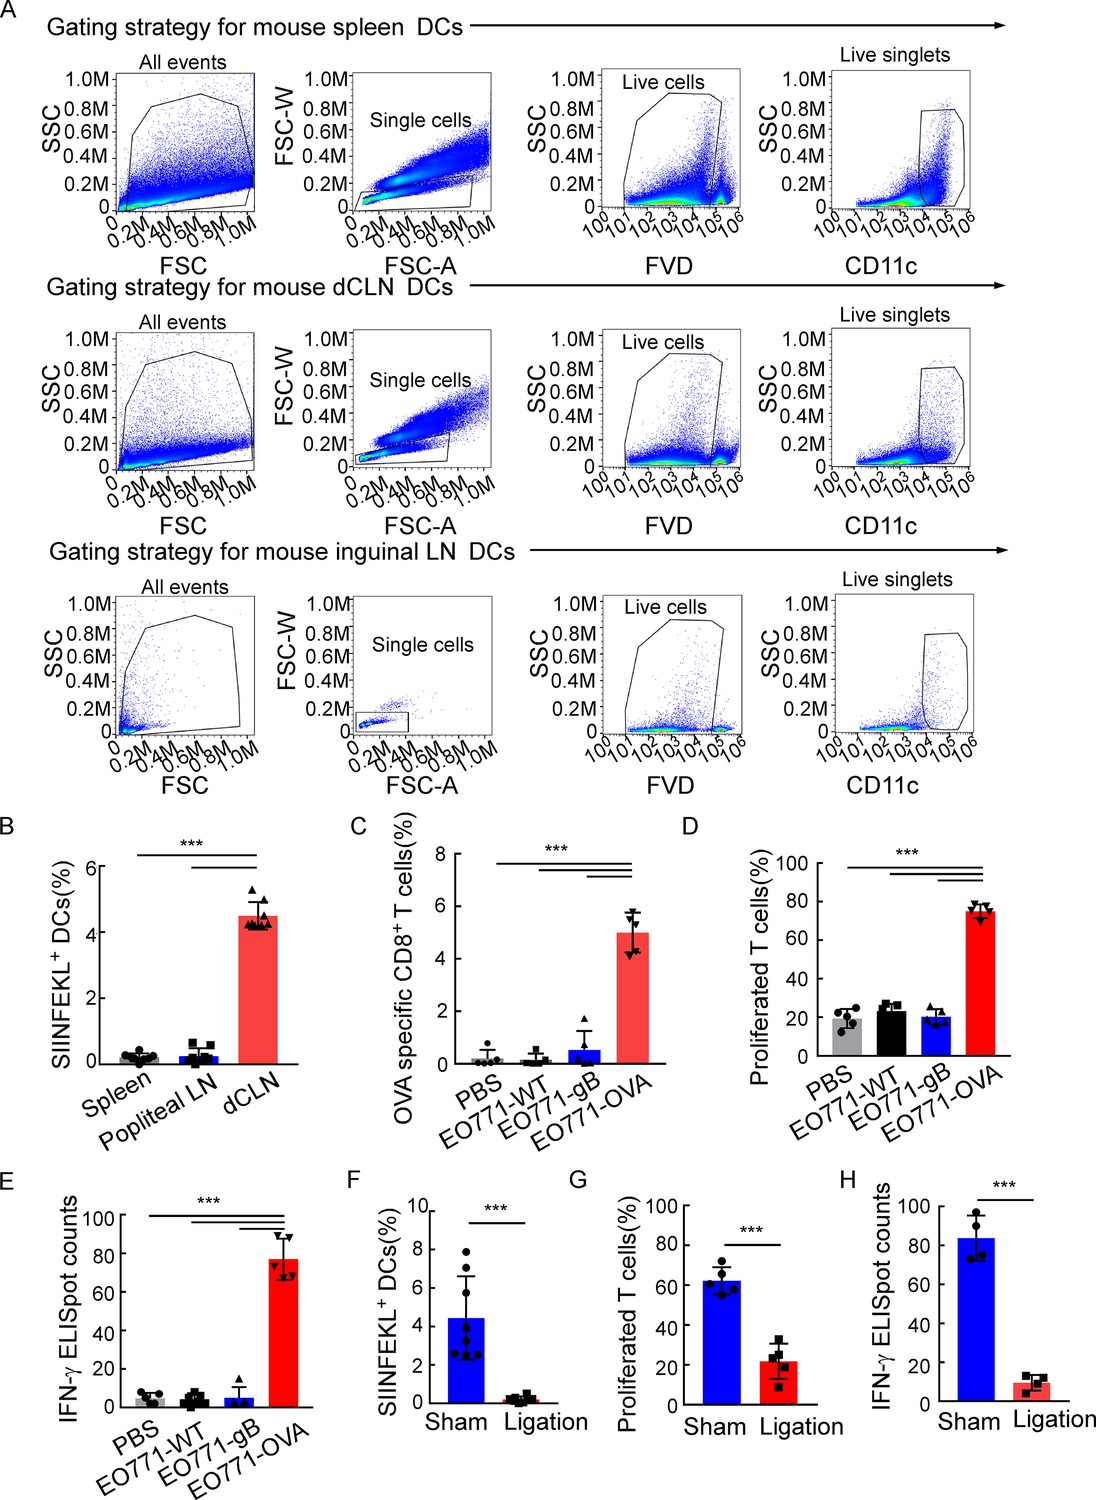
(A) Dendritic cells (DCs) from spleen, inguinal lymph nodes (LNs), and dCLNs were isolated 7 days after intra cisterna magna EO771-OVA cell injection, and later analyzed for SIINFEKL presentation (n = 8 per group). (B) PBS, EO771, and EO771 expressed with gB (EO771-gB) and OVA (EO771-OVA) were injected into C57BL/6 mice. CD8+ T cells from LNs were isolated and later analyzed for ovalbumin (OVA) pentamer expression. (C) Schematics of animal experiments detecting the generation of tumor-specific CD8+ T cells in vitro. PBS, EO771, and EO771-gB and EO771-OVA were injected into C57BL/6 mice. DCs were subsequently isolated from dCLNs, and then co-cultured with OT-1 T cells in vitro. (D) Representative histogram of CFSE dilution of OT-1 T cells co-cultured with CD11c+ cells isolated from dCLNs of mice with indicated treatment for 60 hr. (E) Representative images of IFN-γ ELISpot data of OT-1 T cells co-cultured with CD11c+ cells isolated from dCLNs of mice with indicated treatment for 60 hr. (F) Schematics of animal experiments illustrating dCLNs generate tumor-specific CD8+ T cells against LM. Surgical ligation of the lymphatics afferent to the dCLNs was performed. A week after the surgery, sham or ligation group was inoculated with EO771-OVA cells. DCs were subsequently isolated from dCLNs, and then co-cultured with OT-1 T cells in vitro. (G) Representative histogram of SIINFEKL expression on CD11c+ cells isolated from dCLNs of mice with indicated treatment. (H) Representative histogram of CFSE dilution of OT-1 T cells co-cultured with CD11c+ cells isolated from dCLNs of mice with indicated treatment for 60 hr. (I) Representative images of IFN-γ ELISpot data of OT-1 T cells co-cultured with CD11c+ cells isolated from dCLNs of mice with indicated treatment for 60 hr.
Figure 3—figure supplement 1
Deep cervical lymph nodes (dCLNs) generate antigen-specific CD8+ T cells against leptomeningeal metastasis (LM).
(A) The gating strategy for mouse dendritic cells (DCs) in Figure 3A. (B) Quantification of Figure 3A (mean ± SD, n = 8 per group). ***p<0.001 by one-way ANOVA with Tukey’s multiple-comparison test. (C) Quantification of Figure 3B (mean ± SD, n = 5 per group). ***p<0.001 by one-way ANOVA with Tukey’s multiple-comparison test. (D) Quantification of Figure 3D (mean ± SD, n = 5 per group). ***p<0.001 by one-way ANOVA with Tukey’s multiple-comparison test. (E) Quantification of Figure 3E (mean ± SD, n = 5 per group). ***p<0.001 by one-way ANOVA with Tukey’s multiple-comparison test. (F) Quantification of Figure 3G (mean ± SD, n = 8 per group). ***p<0.001 by two-tailed Student’s t test. (G) Quantification of Figure 3H (mean ± SD, n = 5 per group). ***p<0.001 by two-tailed Student’s t test. (H) Quantification of Figure 3I (mean ± SD, n = 4 per group). ***p<0.001 by two-tailed Student’s t test.
Figure 4 with 1 supplement
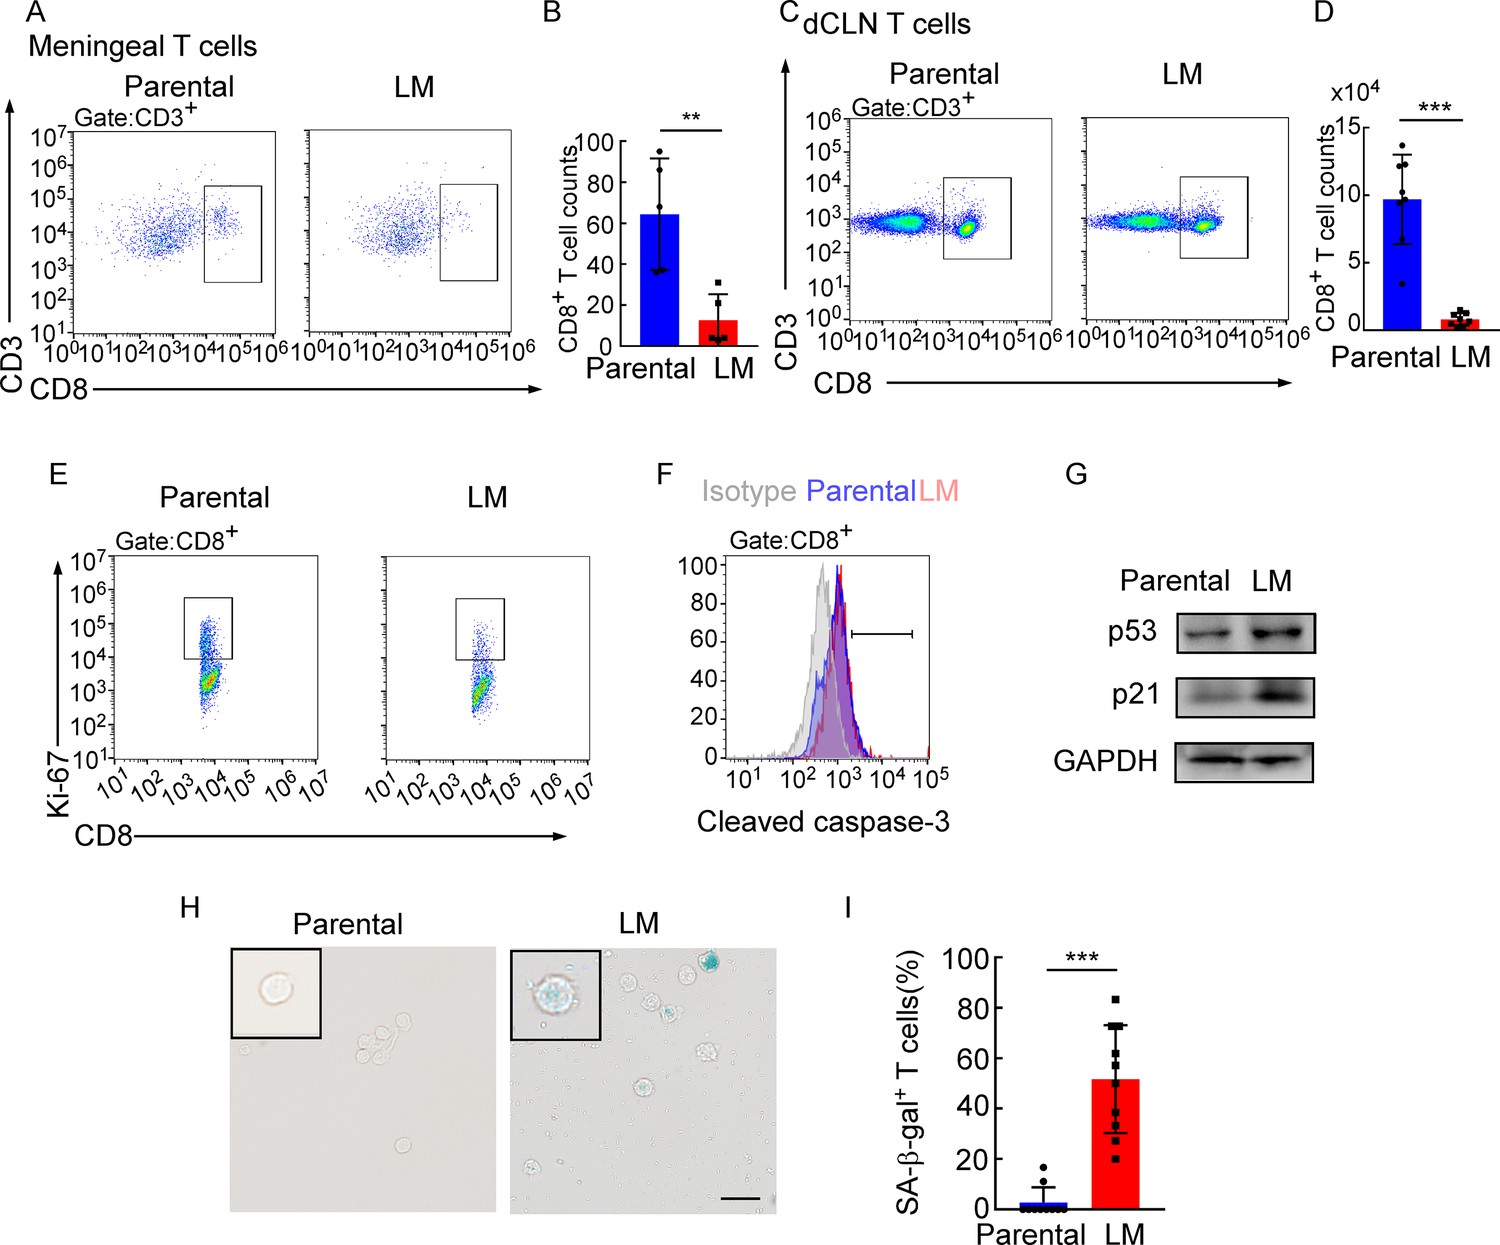
Deep cervical lymph node (dCLN) CD8+ T cells exhibit senescence in leptomeningeal metastasis (LM).
(A–I) 1 × 10⁵ EO771 parental or LM-phenotype cells were inoculated into the intracarotid artery of recipient mice. (A, B) T cells in the meninges were isolated from mice injected with EO771 parental and LM-phenotype cells and analyzed by flow cytometry. Representative images (A) and quantitation (B) of meningeal CD8+ T cells in gated CD3+ T cells are shown (mean ± SD, n = 5 per group). **p<0.01 by two-tailed Student’s t test. (C, D) T cells in the dCLNs were isolated from mice injected with EO771 parental and LM-phenotype cells and analyzed by flow cytometry. Representative images (C) and quantitation (D) of dCLN CD8+ T cells in gated CD3+ T cells are shown (mean ± SD, n = 8 per group). ***p<0.001 by two-tailed Student’s t test. (E) Representative images of proliferative capacity of CD8+ T cells isolated from dCLNs, as determined by flow cytometry for the percentages of Ki-67+ cells (n = 4 per group). (F) Representative histogram of apoptosis of CD8+ T cells isolated from dCLNs, as determined by flow cytometry for the percentages of cleaved caspase-3+ cells. Gray, isotype; blue, parental; red, LM. (G) Representative immunoblots for p53 and p21 in CD8+ T cells isolated from dCLNs. (H, I) Representative images (H) and quantitation (I) of SA-β-gal staining in CD8+ T cells isolated from dCLNs. Scale bar = 20 μm (mean ± SD, n = 10 per group). ***p<0.001 by two-tailed Student’s t test.
-
Figure 4—source data 1
Raw data of Western Blots in Figure 4G.
- https://cdn.elifesciences.org/articles/83272/elife-83272-fig4-data1-v3.zip
Figure 4—figure supplement 1
Meningeal CD8+ T cells that show cell cycle arrest undergo senescence instead of apoptosis under leptomeningeal metastasis (LM).
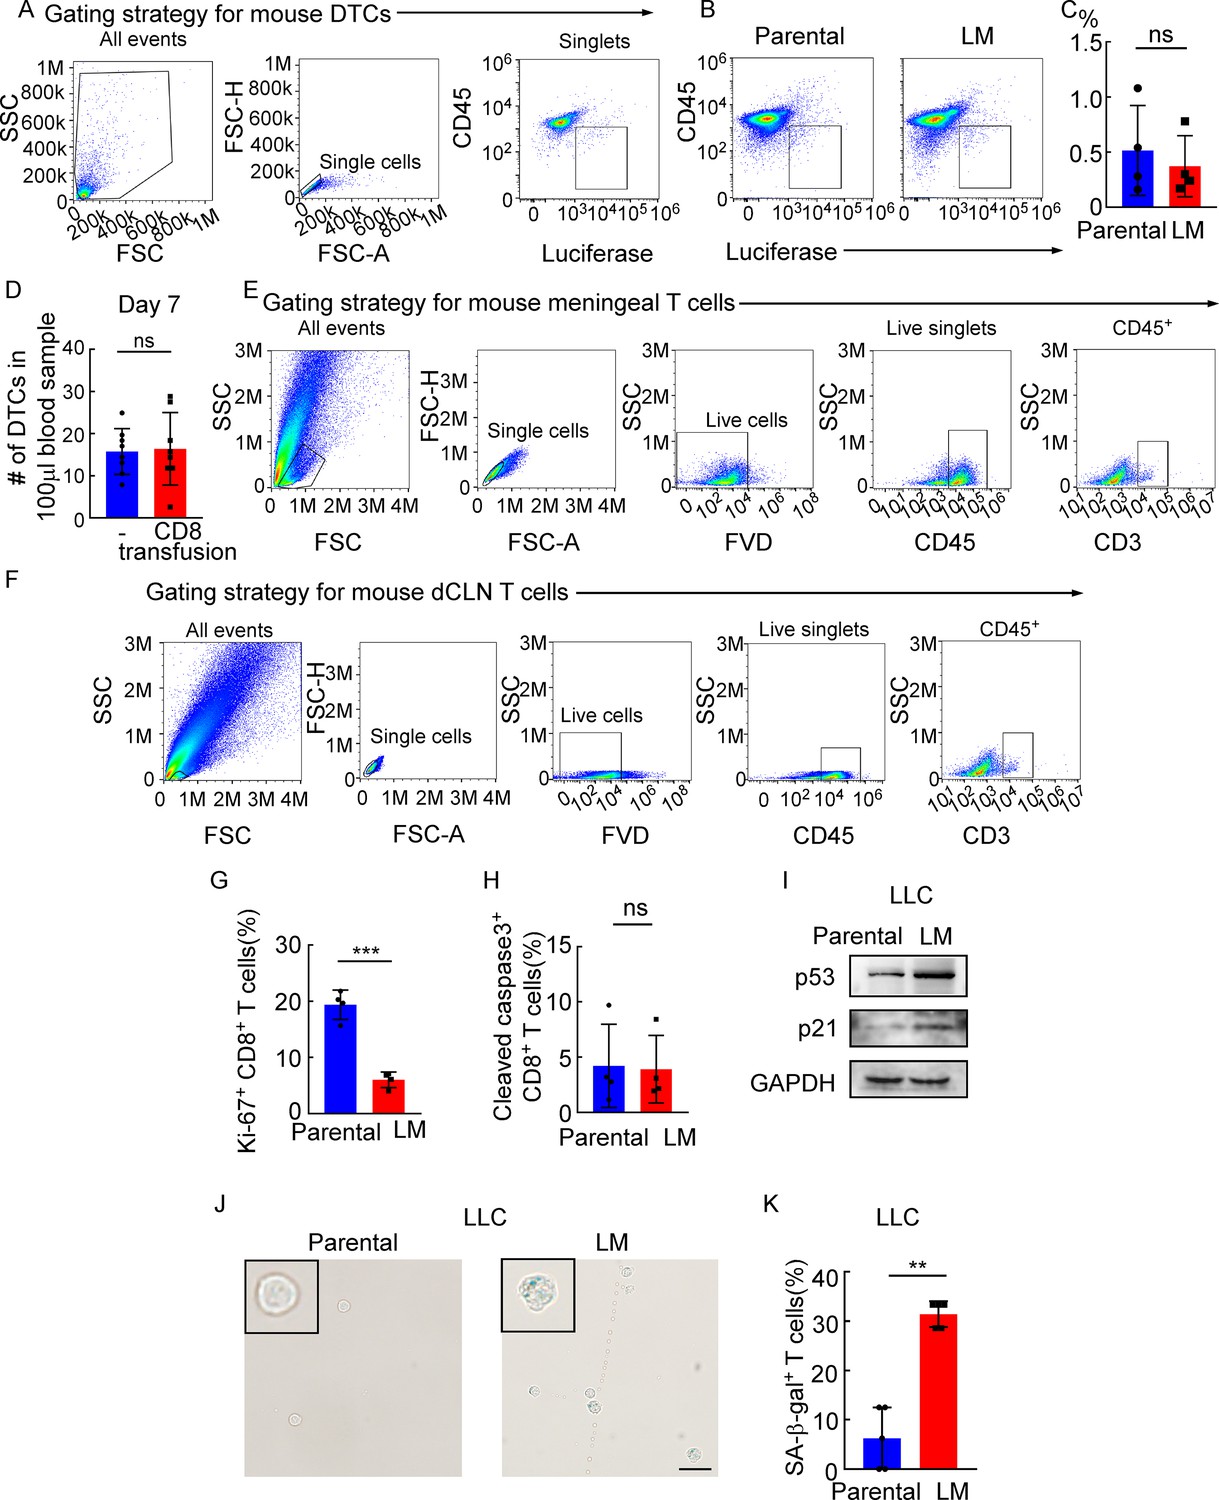
(A) The gating strategy for mouse disseminated tumor cells (DTCs) in (B). (B) DTCs from mice injected with EO771 parental or LM cells analyzed by flow cytometry (DTCs defined as CD45-luciferase+). (C) Quantification of (B) (mean ± SD, n = 4 per group). ns, not significant by two-tailed Student’s t test. (D) Histogram indicates the number of DTCs of 100 μl peripheral blood in Rag2-/- mice without or with CD8+ T cell transfusion. ns, not significant (mean ± SD, n = 8 per group) by two-tailed Student’s t test. (E) The gating strategy for mouse CD3+ T cells in Figure 4A. (F) The gating strategy for mouse CD3+ T cells in Figure 4C. (G) Quantification of Figure 4E (mean ± SD, n = 4 per group). ***p<0.001 compared with dCLN Parental-CD8+ T cells by two-tailed Student’s t test. (H) Quantification of Figure 4F (mean ± SD, n = 4 per group). ns not significant compared with dCLN Parental-CD8+ T cells by two-tailed Student’s t test. (I–K) 1 × 10⁵ LLC parental or LM-phenotype cells were inoculated into the intracarotid artery of recipient mice. (I) Representative immunoblots for p53 and p21 in CD8+ T cells isolated from dCLNs. (J) Representative images of SA-β-gal staining in CD8+ T cells isolated from dCLNs. Scale bar = 20 μm. (K) Histogram indicates the proportion of senescent CD8+ T cells isolated from mice with indicated treatment (mean ± SD, n = 5 per group). **p<0.01 compared with dCLN Parental-CD8+ T cells by two-tailed Student’s t test.
-
Figure 4—figure supplement 1—source data 1
Raw data of Western Blots in Figure 4—figure supplement 1I.
- https://cdn.elifesciences.org/articles/83272/elife-83272-fig4-figsupp1-data1-v3.zip
Figure 5 with 1 supplement
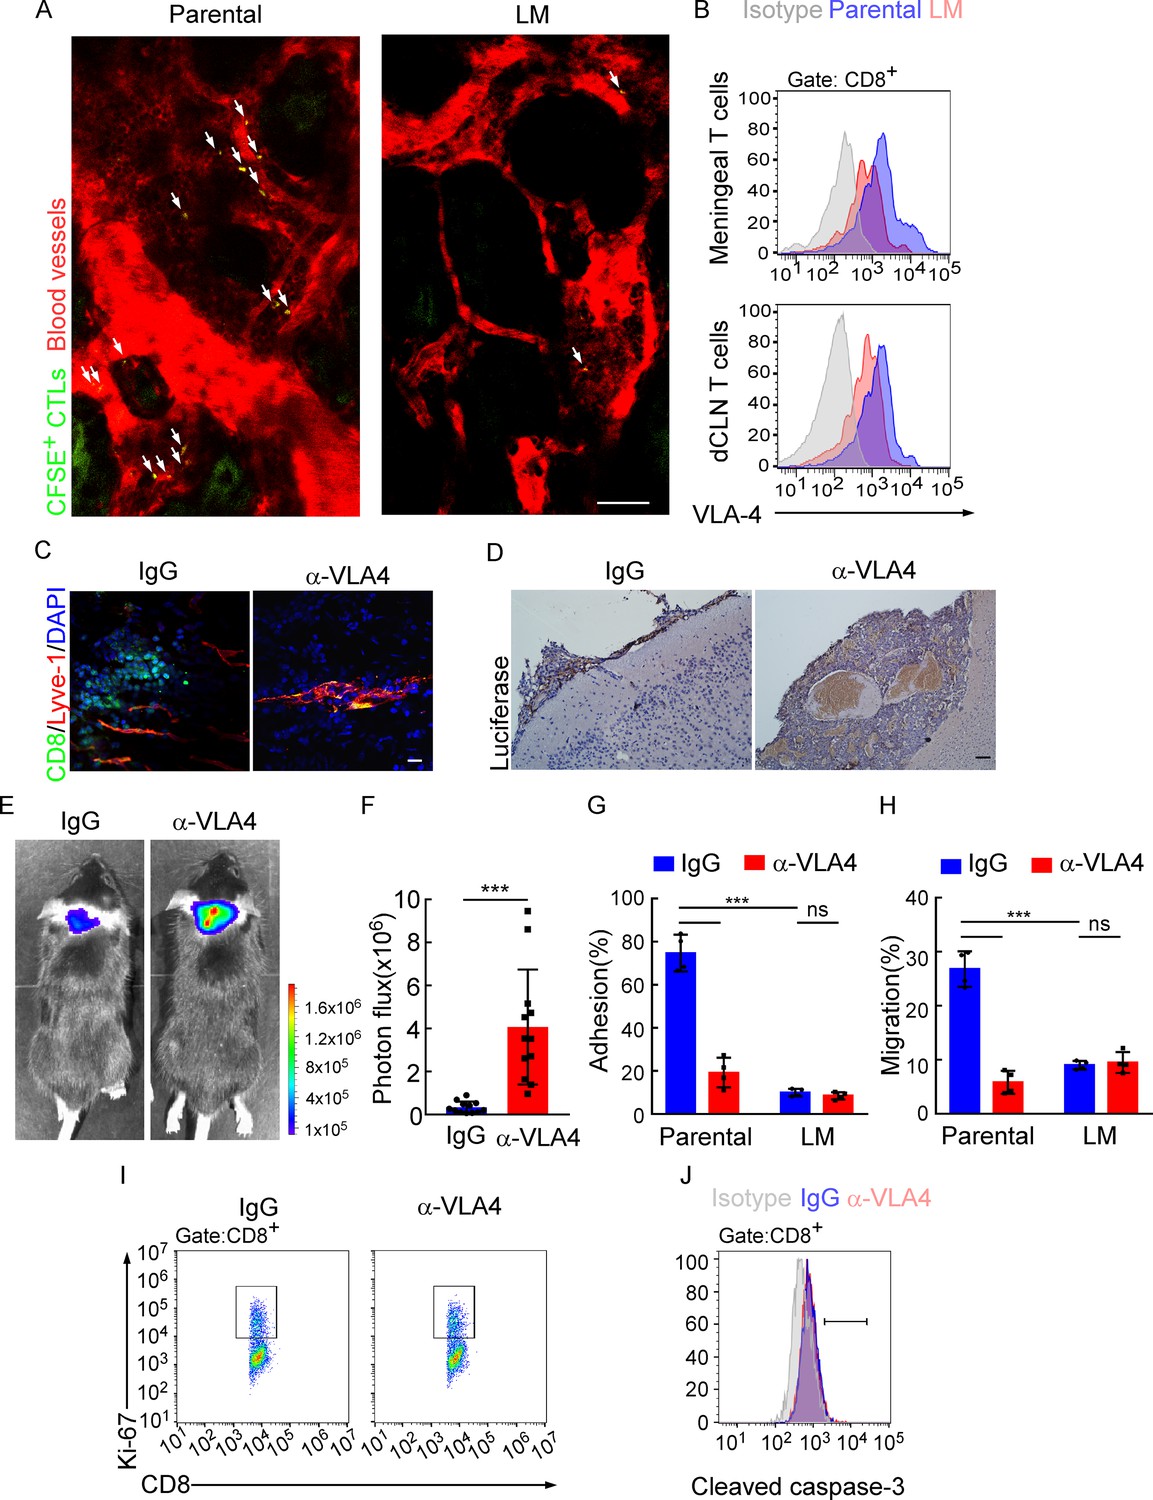
Downregulation of VLA-4 in senescent CD8+ T cells impairs their trafficking to meninges.
(A) CD8+ T cells were isolated from the deep cervical lymph nodes (dCLNs) of mice injected with parental and leptomeningeal metastasis (LM)-phenotype cells, respectively, stained with CFSE, and subsequently transferred to the recipient mice. 24 hr after T cell transfusion, two-photon imaging was used to reveal the in vivo migration of CFSE-labeled CTLs to meninges. Visualization of the vasculature by i.v. injection of rhodamine-dextran (red). The location of CFSE+ T cells (green) is marked by a white arrowhead. Scale bar, 50 μm. (B) T cells in the meninges and dCLNs were isolated from mice injected with parental and LM-phenotype cells. Flow cytometry analysis of VLA-4 expression in CD8+ T cells isolated from meninges (top) or dCLNs (bottom) of mice receiving parental or LM-phenotype cells. Gray, isotype; blue, Parental-CD8+ T cells; red, LM-CD8+ T cells. (C–F) C57BL/6 mice pretreated with IgG or α-VLA-4 antibodies were injected with parental EO771-luc cells via intracarotid artery. (C) Representative immunofluorescent images of meningeal CD8+ T cells from C57BL/6 mice with indicated treatment in whole-mount meninges. Scale bar = 50 μm. Red, Lyve-1; green, CD8; blue, DAPI. (D) Representative IHC images for luciferase to identify LM lesions. Scale bar = 50 μm. (E, F) Representative bioluminescence images (E) and quantitation (F) of metastases in mice with indicated treatment at day 21 post-injection (mean ± SD, n = 12 per group). ***p<0.001 by two-tailed Student’s t test. (G) CD8+ T cells in dCLNs of mice injected with EO771 LM-phenotype cells or parental cells were isolated and tested for their ability to adhere to plate-bound VCAM-1-Ig fusion protein. Histogram shows the number of cells adherent to the bottom of the wells under indicated treatments (mean ± SD, n = 4 per group). ***p<0.001, ns, not significant by two-way ANOVA with Sidak’s multiple-comparison test. (H) CD8+ T cells isolated from mice injected with EO771 LM-phenotype cells or parental cells were treated with IgG or VLA4 neutralizing antibody and later added to the top chamber of in vitro blood–brain barrier model. Histogram indicates the number of migrated CD8+ T cells after IgG or VLA4 antibody treatment(mean ± SD, n = 4 per group). ***p<0.001, ns, not significant by two-way ANOVA with Sidak’s multiple-comparison test. (I) Representative images of proliferative capacity of dCLN CD8+ T cells under indicated treatment, as determined by flow cytometry for the percentages of Ki-67+ cells. (J) Representative histogram of apoptosis of dCLN CD8+ T cells under indicated treatment, as determined by flow cytometry for the percentages of cleaved caspase-3+ cells. Gray, isotype; blue, IgG antibody; red, VLA-4 antibody.
Figure 5—figure supplement 1
Downregulated VLA-4 in CTLs inhibits their recruitment to meninges and their capacity to control leptomeningeal metastasis (LM).
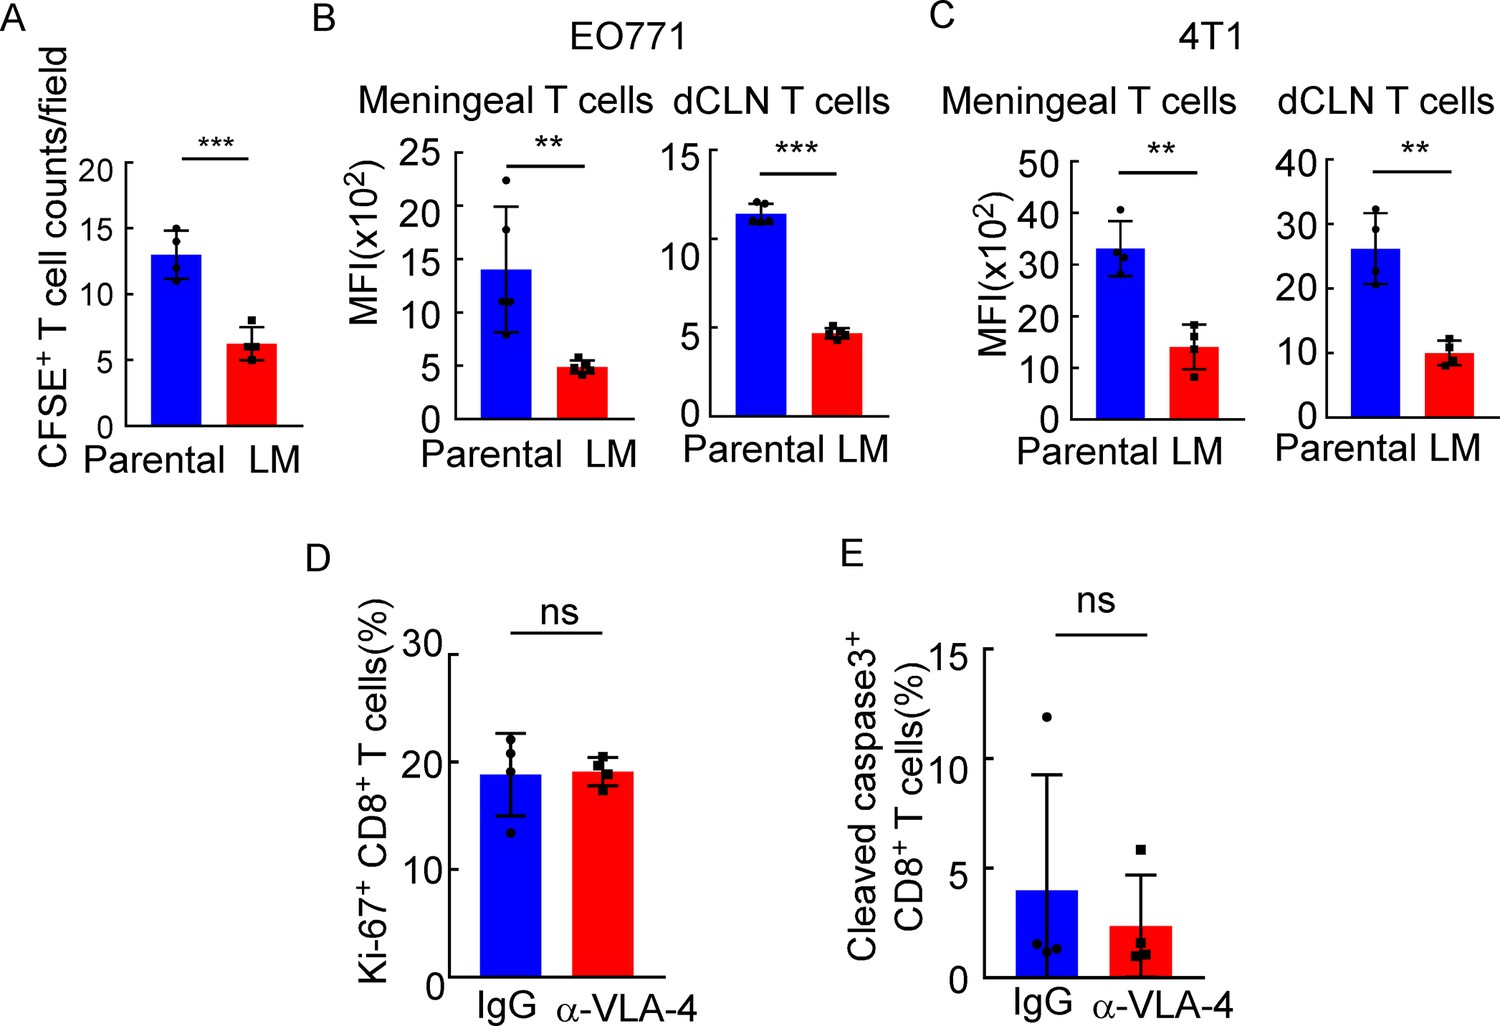
(A) Quantification of Figure 5A (mean ± SD, n = 4 per group). ***p<0.001 compared with meningeal Parental-CD8+ T cells by two-tailed Student’s t test. (B) Quantification of Figure 5B (mean ± SD, n = 5 per group). **p<0.01, ***p<0.001 compared with meningeal/ dCLN Parental-CD8+ T cells by two-tailed Student’s t test. (C) T cells in the meninges and deep cervical lymph nodes (dCLNs) were isolated from mice injected with 4T1 parental and LM-phenotype cells. Flow cytometry analysis of VLA-4 expression in CD8+ T cells isolated from meninges and dCLNs of mice receiving parental or LM-phenotype cells. Histogram indicates the mean fluorescence intensity of anti-VLA-4 staining (mean ± SD, n = 4 per group). **p<0.01 compared with meningeal/dCLN Parental-CD8+ T cells by two-tailed Student’s t test. (D) Quantification of Figure 5I (mean ± SD, n = 4 per group). ns, not significant compared with dCLN T cells from mice injected with IgG by two-tailed Student’s t test. (E) Quantification of Figure 5J (mean ± SD, n = 4 per group). ns, not significant compared with dCLN T cells from mice injected with IgG by two-tailed Student’s t test.
Figure 6 with 1 supplement
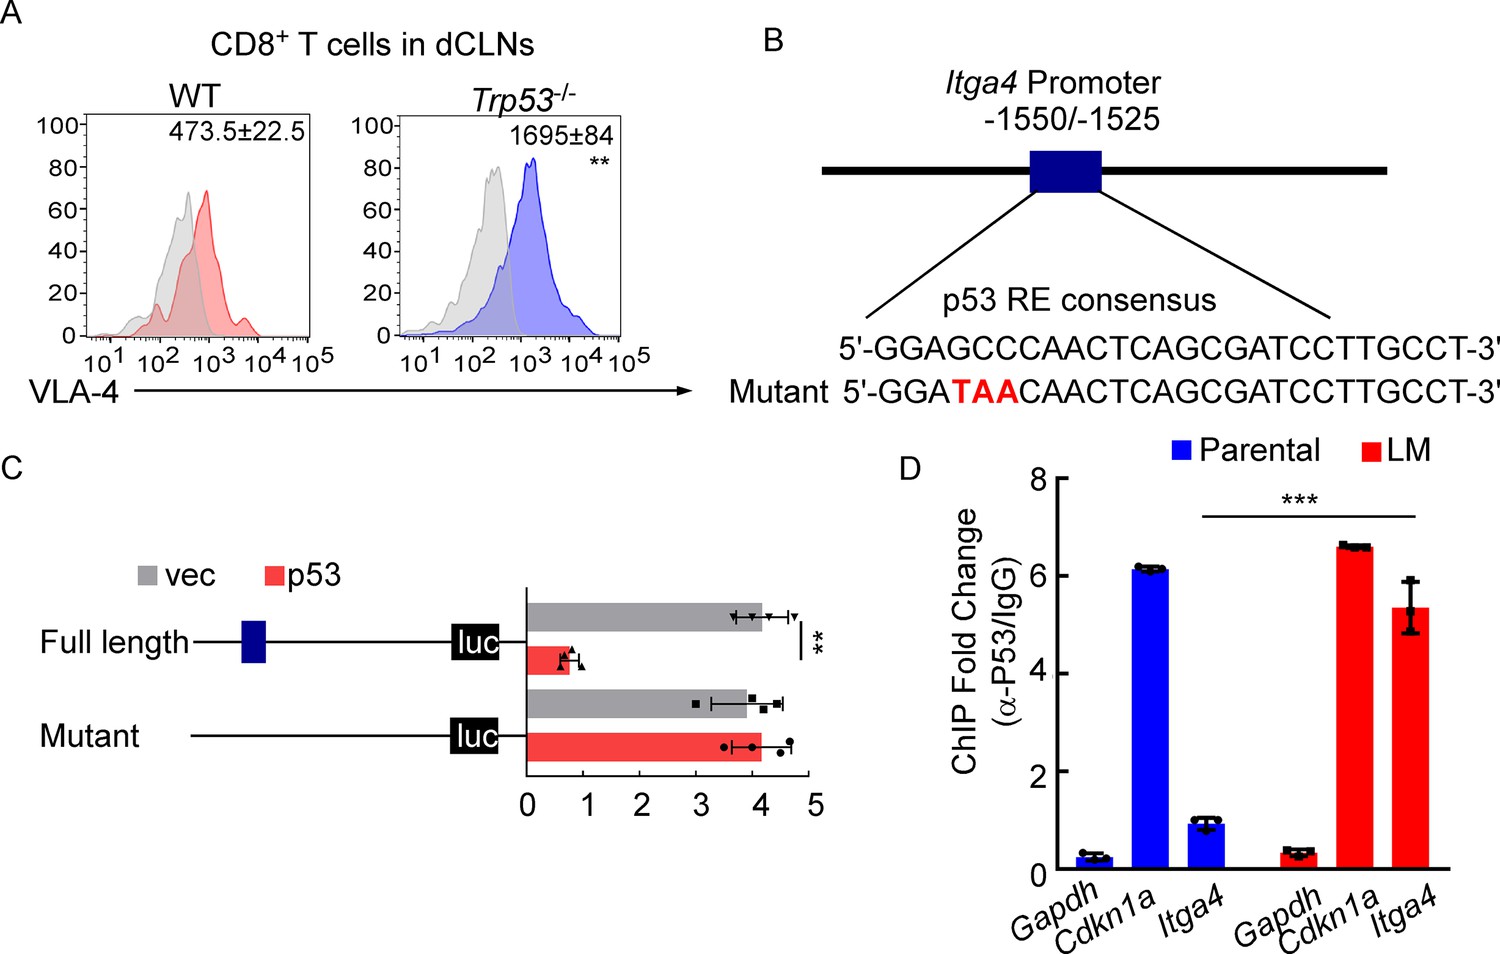
VLA-4 transcription is repressed by p53.
(A) CD8+ T cells were isolated from deep cervical lymph nodes (dCLNs) of wild type (WT) or Trp53-/- mice injected with leptomeningeal metastasis (LM)-phenotype cells. Flow cytometry analysis of VLA-4 expression in CD8+ T cells from dCLNs in WT mice or Trp53-/- mice receiving LM-phenotype cells. Gray, isotype; blue, CD8+ T cells from WT mice; red, CD8+ T cells from Trp53-/mice. Numbers in plot correspond to the mean fluorescent intensity of VLA-4 in CD8+ T cells (mean ± SD, n = 4 per group). **p<0.01 compared with CD8+ T cells from WT mice by two-tailed Student’s t test. (B) A schematic of Itga4 gene promoter. P53 binding site is identified. (C) EL4 cells were transfected with WT or a mutant version in which the putative p53 binding site was mutated with four nucleotides (mutant). Afterward, EL4 cells were transfected with empty vector or P53 overexpression plasmids and harvested for the luciferase activity assay (mean ± SD, n = 4 biologically independent experiments). Results are expressed relatively to control conditions. **p≤0.01 by one-way ANOVA with Tukey’s multiple-comparison test. (D) ChIP was performed with a p53-targeting antibody or a control IgG to assess p53 binding to the Itga4 promoter in CD8+ T cells isolated from mice injected with parental or LM-phenotype cells (mean ± SD, n = 3). Cdkn1a serves as a positive control, Gapdh as a negative control for p53 binding. ***p<0.001 by two-tailed Student’s t test.
Figure 6—figure supplement 1
The role of P53 in leptomeningeal metastasis (LM).
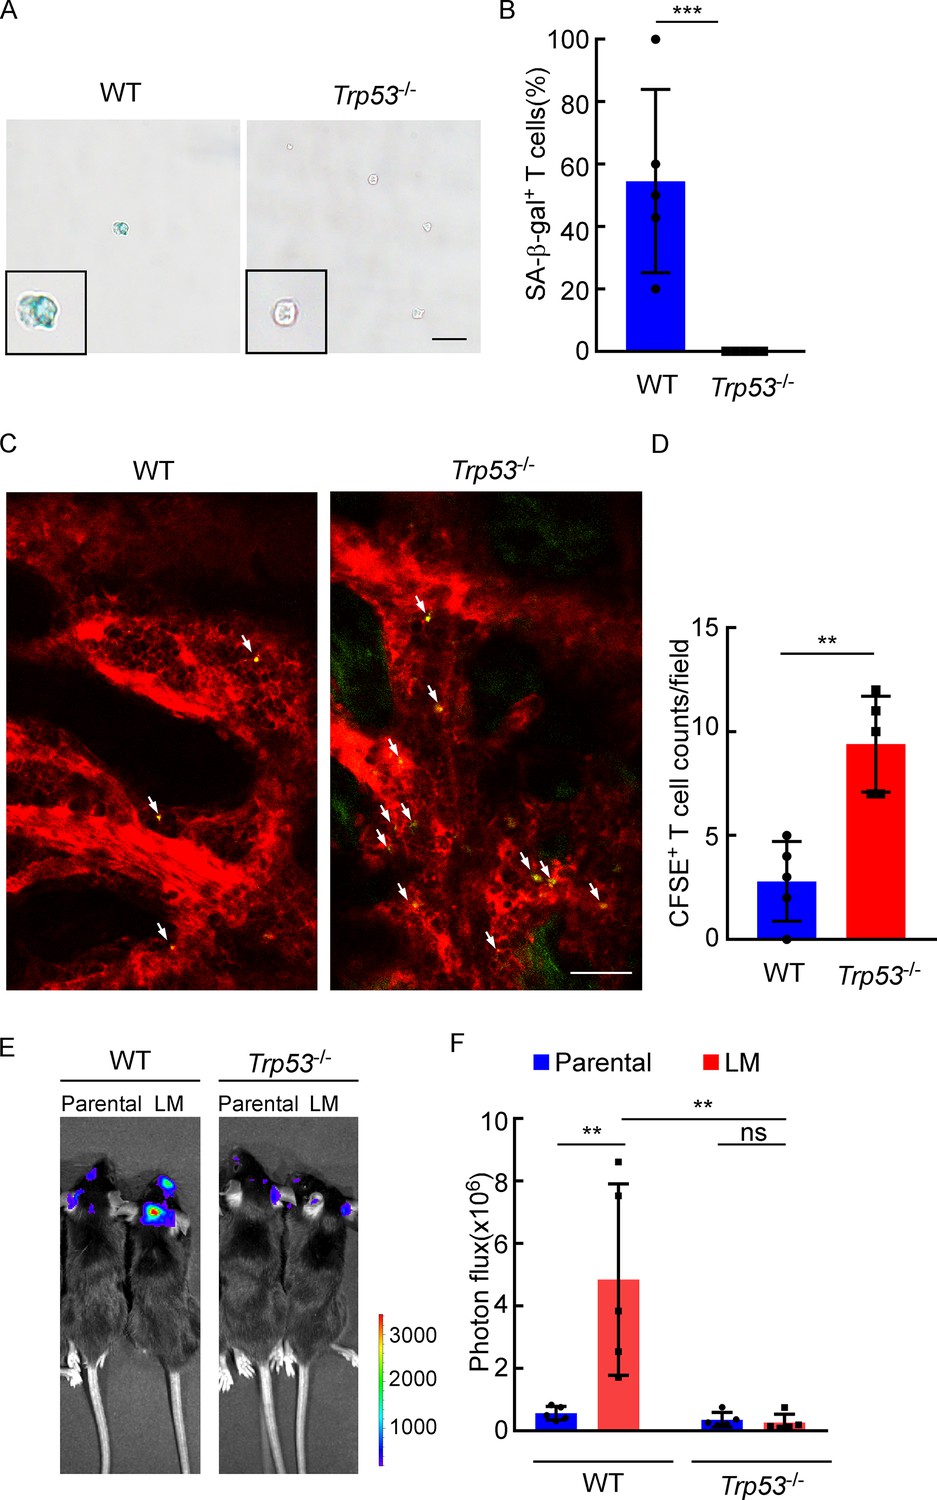
(A, B) Representative images (A) and quantitation (B) of SA-β-gal staining in CD8+ T cells isolated from deep cervical lymph nodes (dCLNs) of wild type (WT) or Trp53-/- mice injected with LM cells. Scale bar = 20 μm (mean ± SD, n = 5 per group). ***p<0.001 compared with dCLN T cells isolated from WT mice by two-tailed Student’s t test. (C, D) Representative two-photon imaging (C) and quantitation (D) of meninges of C57BL/6 or Trp53-/- mice receiving CFSE-labeled T cell transfusion (mean ± SD, n = 5 per group). **p<0.01 by two-tailed Student’s t test. (E, F) Representative images (E) and quantitation (F) for tumor growth of WT C57BL/6 and Trp53-/- mice injected with EO771 parental or LM cells monitored by bioluminescence imaging (BLI) (mean ± SD, n = 5 per group). ns, not significant; **p<0.01 by two-way ANOVA with Tukey’s multiple-comparison test.
Figure 7 with 1 supplement
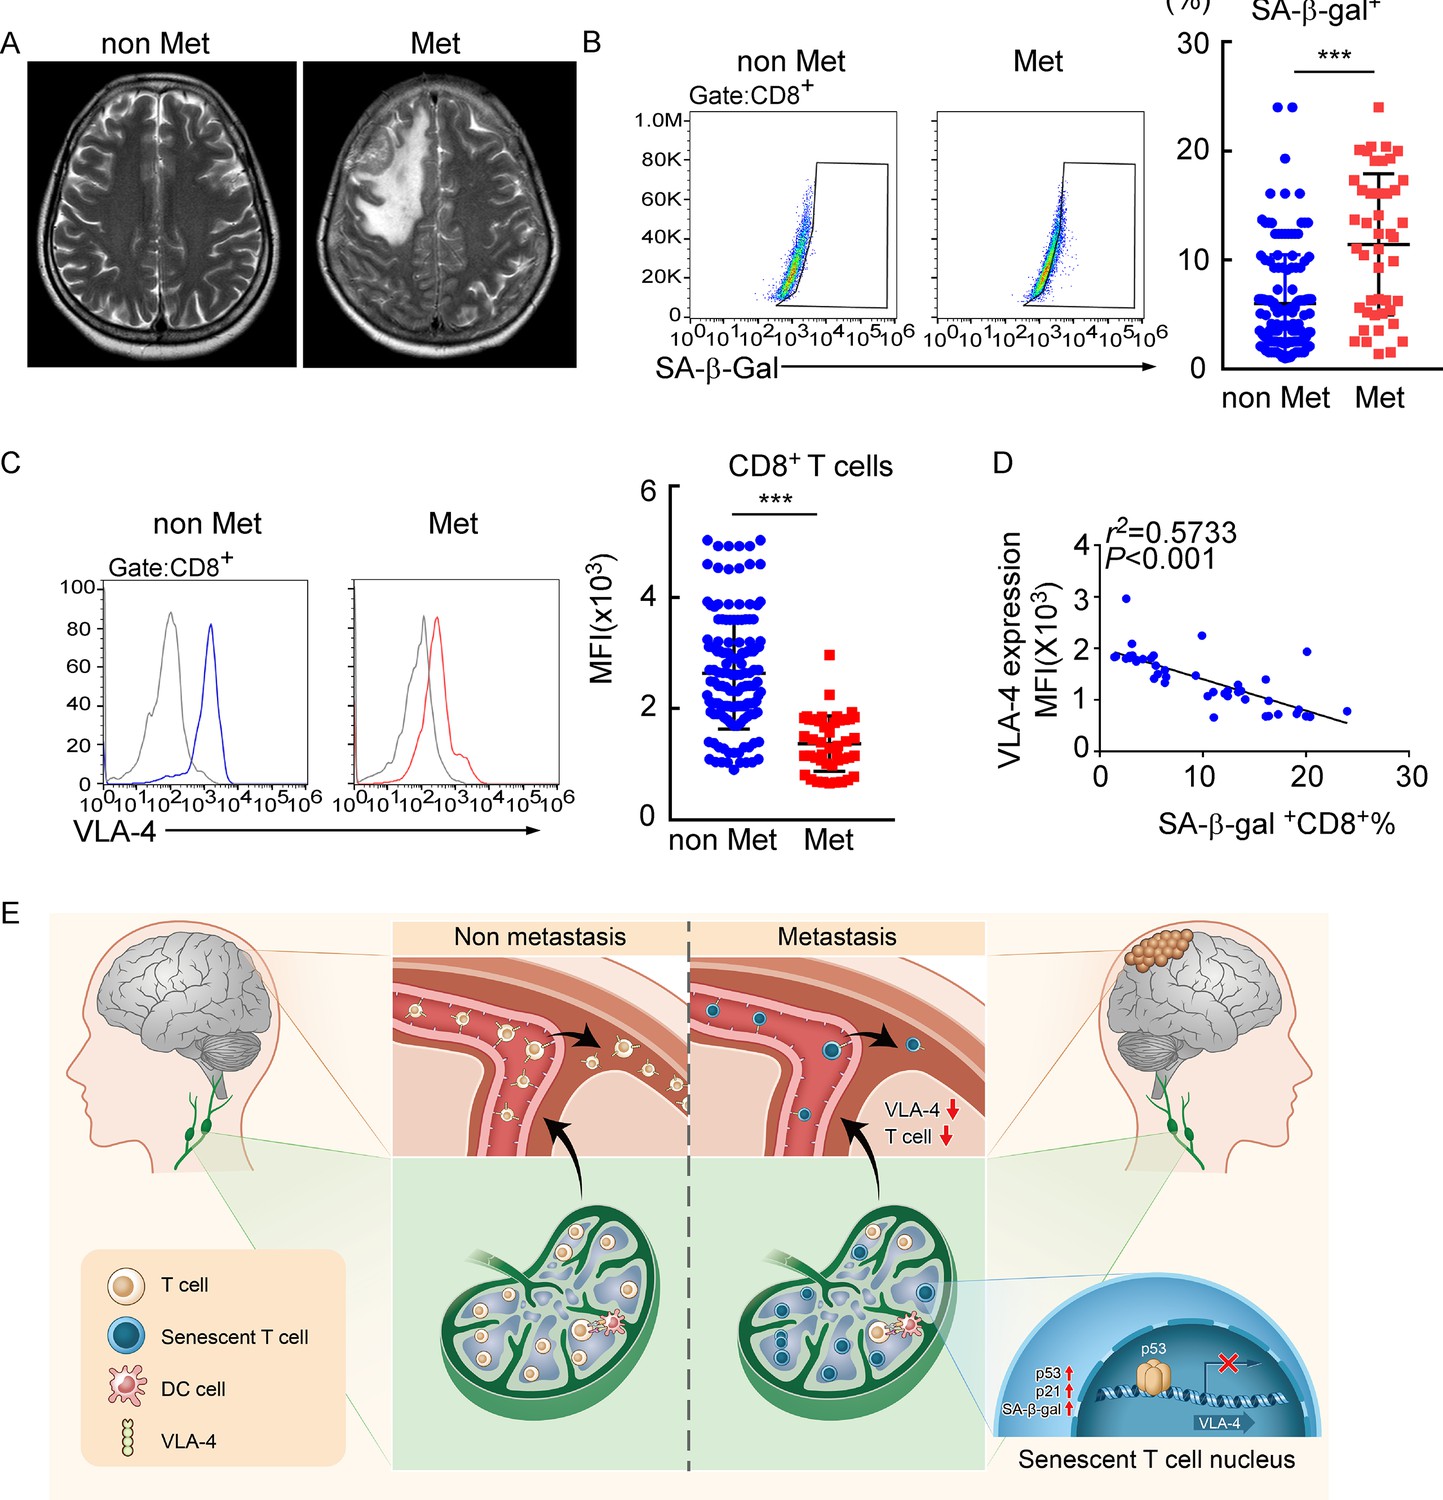
Meningeal CD8+ T cells exhibit VLA-4 downregulation and senescence in human leptomeningeal metastasis (LM).
(A) Representative MRI images of patients with (n = 45) or without LM (n = 145). (B) Representative images for flow cytometry analysis of CD8+SA-β-gal+ T cells from cerebrospinal fluid (CSF) in patients with nonmalignant neurological diseases (n = 145) or LM (n = 45). Bars correspond to the percentages of CD8+SA-β-gal+ T cells. ***p<0.001 by two-tailed Student’s t test. (C) Flow cytometry analysis of VLA-4 expression in CD8+ T cells from CSF in patients of nonmalignant neurological diseases (n = 145) or LM (n = 45). Gray, isotype; blue, CD8+ T cells in patients of nonmalignant neurological diseases; red, CD8+ T cells in LM patients. Bars correspond to the mean fluorescent intensity (MFI) of VLA-4 in CD8+ T cells. ***p<0.001 by two-tailed Student’s t test. (D) The correlation between the percentages of SA-β-gal+CD8+ T cells and VLA-4 levels in CD8+ T cells of LM patients (n = 45, the Pearson’s correlation coefficient r2 value and the p-value are shown). (E) Schematics highlighting the major findings of this study.
Figure 7—figure supplement 1
The relationship between VLA-4 downregulation and senescence in meningeal CD8+ T cells in human leptomeningeal metastasis.
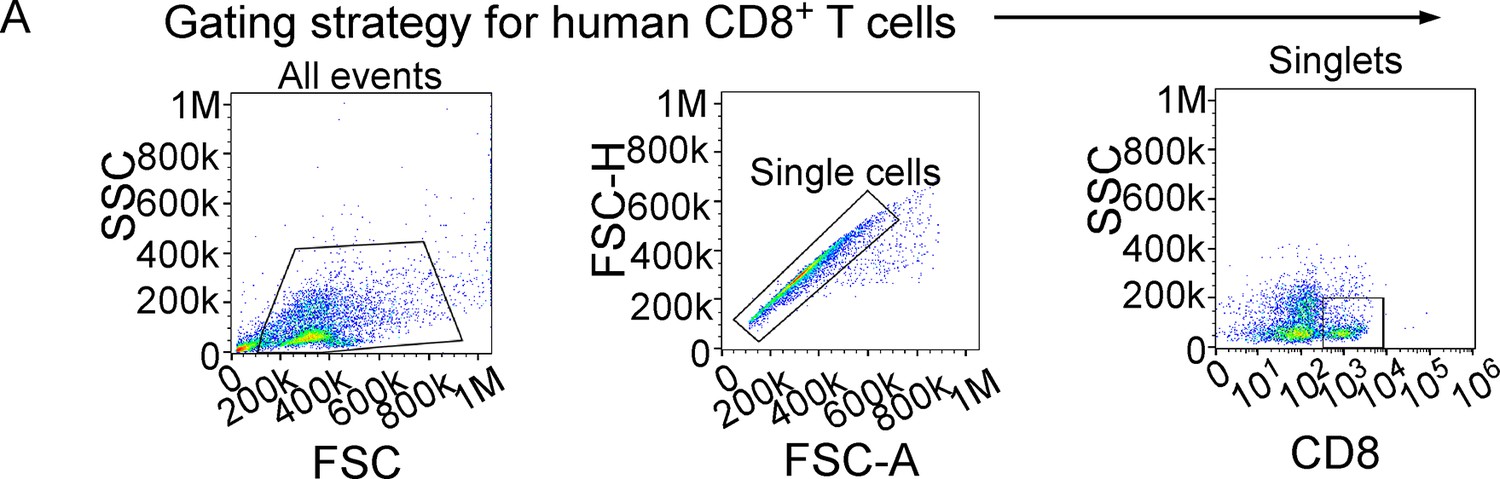
(A) The gating strategy for human CD8+ T cells from cerebrospinal fluid (CSF) in Figure 7B and C.
Additional files
Download links
A two-part list of links to download the article, or parts of the article, in various formats.
Downloads (link to download the article as PDF)
Open citations (links to open the citations from this article in various online reference manager services)
Cite this article (links to download the citations from this article in formats compatible with various reference manager tools)
VLA-4 suppression by senescence signals regulates meningeal immunity and leptomeningeal metastasis
eLife 11:e83272.
https://doi.org/10.7554/eLife.83272


