The Arabidopsis SHORTROOT network coordinates shoot apical meristem development with auxin-dependent lateral organ initiation
- Institute for Developmental Genetics, Heinrich Heine University, Germany
- Centro de Biologia Molecular Severo Ochoa, CSIC-UAM, Cantoblanco, Spain
- Laboratory of Plant Cell and Developmental Biology, Division of Biological and Environmental Sciences and Engineering, 4700 King Abdullah University of Science and Technology, Saudi Arabia
Figures
Figure 1 with 1 supplement
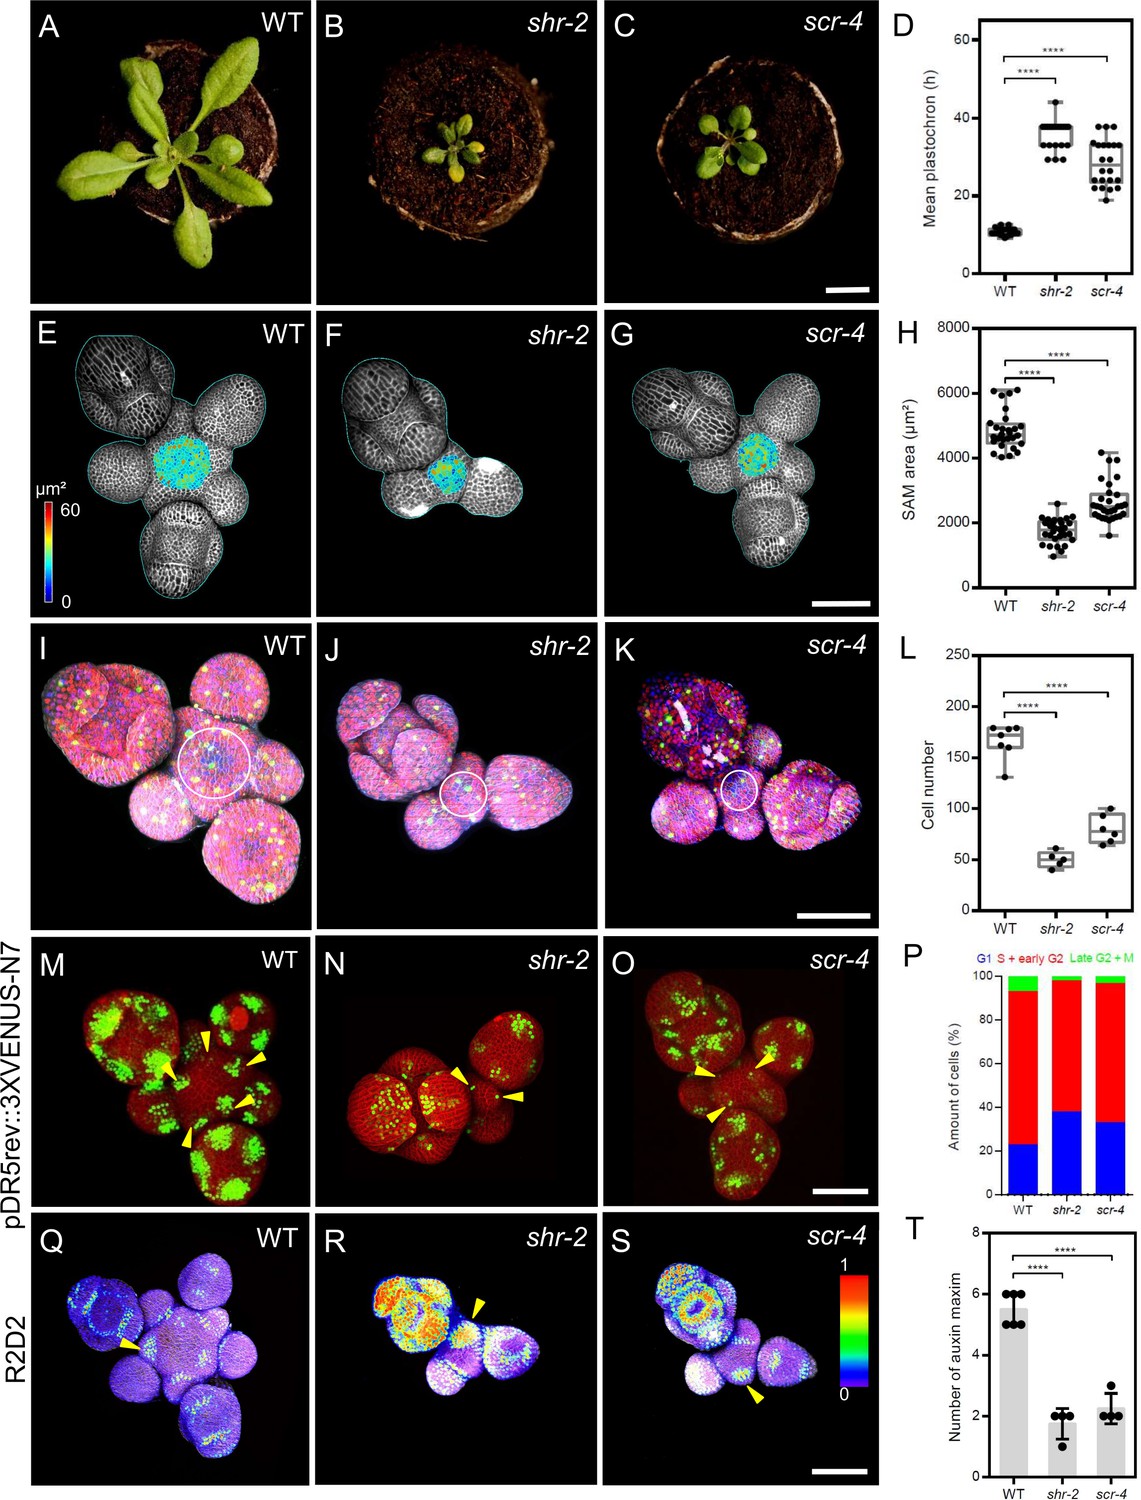
SHR and SCR functions modulate meristem size and auxin signalling in the shoot apical meristem.
(A–C) Top view of 21-day-old rosettes from WT (col-0) (A), shr-2 mutant (B) and scr-4 mutant (C). Scale bar represents 1 cm. (D) Mean flower plastochron in WT (n=21), shr-2 mutant (n=20) and scr-4 mutant (n=22). (E–G) Heat-map quantification of the cell area in the meristem region at 5 weeks after germination from WT (n=7) (E), shr-2 mutant (n=5) (F) and scr-4 mutant (n=6) (G). Cell walls were stained with PI (gray). Scale bar represents 50 µm. (H) Quantification of shoot apical meristem size at 5 weeks after germination from WT (n=28), shr-2 mutant (n=30) and scr-4 mutant (n=30). (I–K) Representative 3D projection of shoot apical meristems at 5 weeks after germination expressing the three PlaCCI markers: pCDT1a:CDT1a-eCFP (blue), pHTR13:pHTR13-mCherry (red), and pCYCB1;1:NCYCB1;1-YFP (green) in WT (n=11) (I), shr-2 mutant (n=4) (J) and scr-4 mutant (n=6) (K). White circles in (I), (J) and (K) mark the meristem region. Cell walls were stained with DAPI (gray). Scale bar represents 50 µm. (L) Quantification of epidermal cell number in the meristem region of WT (n=11), shr-2 mutant (n=4) and scr-4 mutant (n=6). (M–O) Representative 3D projection of shoot apical meristems at 5 weeks after germination expressing the auxin response reporter pDR5rev:3XVENUS-N7 in WT (Col-0) (n=6) (M), shr-2 mutant (n=4) (N) and scr-4 mutant (n=4) (O). Yellow arrowheads in (M), (N) and (O) show primordia with pDR5rev:3XVENUS-N7 expression. Cell walls were stained with PI (red). Scale bar represents 50 μm. (P) Quantification of cells in different cell cycle phases in the meristem region (area surrounded by white circles in (I), (J) and (K)) of WT (n=11), shr-2 mutant (n=4) and scr-4 mutant (n=6). (Q–S) Representative 3D projection of shoot apical meristems at 5 weeks after germination expressing the auxin input sensor R2D2 showing DII/mDII ratio intensity in WT (Col-0) (n=4) (Q), shr-2 mutant (n=4) (R) and scr-4 mutant (n=3) (S). Yellow arrowheads in (Q), (R) and (S) show primordia with low auxin. Cell walls were stained with DAPI (gray). Scale bar represents 50 μm. (T) Quantification of auxin maxima in WT (n=6), shr-2 mutant (n=4) and scr-4 mutant (n=4). Asterisks indicate a significant difference (∗∗∗∗p<0.0001: Statistically significant differences were determined by Student’s t-test). Error bars display SD.
Figure 1—figure supplement 1

The shr and scr mutants phenotypes.
(A–D) Plant phenotypes of 42-day-old WT (n>30) (A), shr-2 mutant (n>35) (B), scr-3 mutant (n>30) (C) and scr-4 mutant (n>30) (D). Scale bars represent 1 cm. (A’-D’) Top view of 31-day-old inflorescences of WT (n>30) (A’), shr-2 mutant (n>35) (B’), scr-3 mutant (n>30) (C’) and scr-4 mutant (n>30) (D’). Scale bars represent 2 mm. (E and F) Top view of 21-day-old rosettes from WT (col-0) and scr-3 mutant (F). Scale bar represents 1 cm. (G) Mean inflorescence plastochron in WT (n=21) and scr-3 mutant (n=18). (H) Quantification of shoot apical meristem size at 5 weeks after germination from WT (n=28) and scr-3 mutant (n=24). (I and J) Heat-map quantification of the cell area in the meristem region at 5 weeks after germination from WT (n=7) (I) and scr-3 mutant (n=8) (J). Cell walls were stained with PI (gray). Scale bar represents 50 µm. (K) Quantification of the epidermal cell area in the meristem region of WT (n=11), shr-2 mutant (n=4), scr-3 mutant (n=7) and scr-4 mutant (n=6). (K) Quantification of epidermal cell number in the meristem region of WT (n=11) and scr-3 mutant (n=7). (M and N) Representative 3D projection of shoot apical meristems at 5 weeks after germination expressing the three PlaCCI markers: pCDT1a:CDT1a-eCFP (blue), pHTR13:pHTR13-mCherry (red), and pCYCB1;1:NCYCB1;1-YFP (green) in WT (n=11) (M) and scr-3 mutant (n=7) (N). White circles in (M) and (N) mark the meristem region. Cell walls were stained with DAPI (gray). Scale bar represents 50 µm. (O) Quantification of cells in different cell cycle phases in the meristem region (area surrounded by white circles in (M) and (N)) of WT (n=11) and scr-3 mutant (n=7). (P) Example of visualisation and quantification of cells in different cell cycle phases in the meristem region coexpressing the three PlaCCI markers. pCDT1a:CDT1a-eCFP (blue), pHTR13:pHTR13-mCherry (red), and pCYCB1;1:NCYCB1;1-YFP (green) using Imaris. Scale bar represents 10 µm. Asterisks indicate a significant difference (∗∗∗∗p<0.0001: Statistically significant differences were determined by Student’s t-test, ns = no significant difference).
Figure 2 with 2 supplements
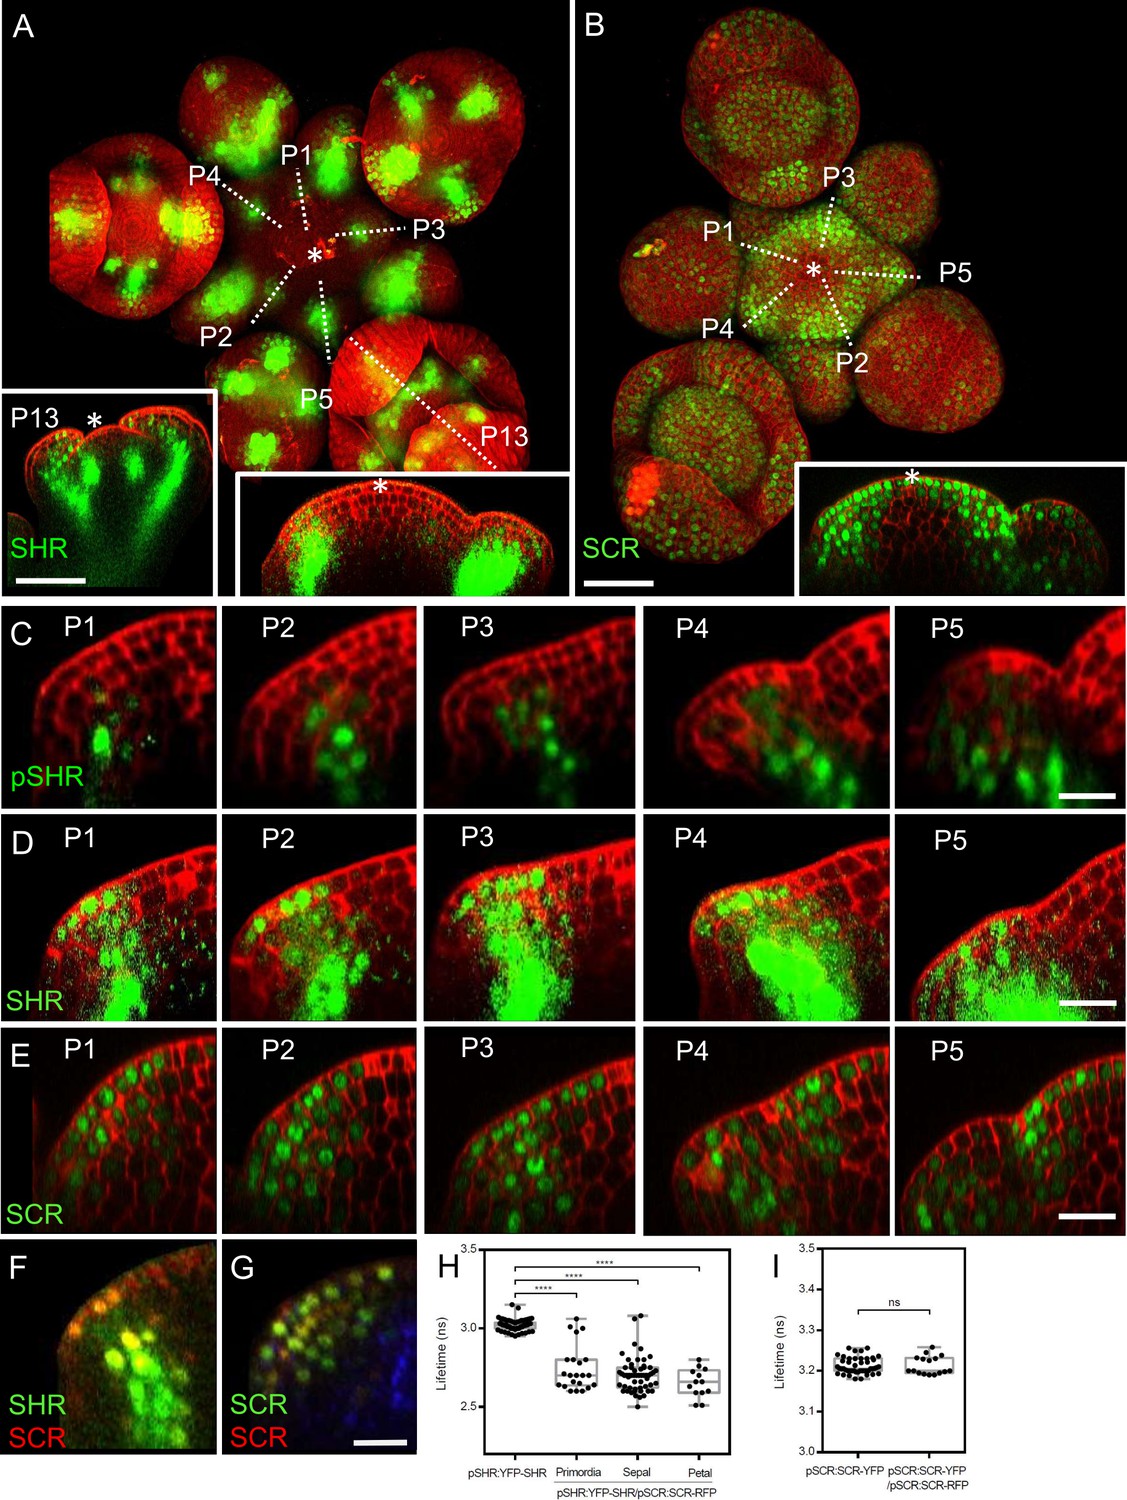
Expression patterns of SHR and SCR in the shoot apical meristem and In vivo FRET–FLIM quantification of SHR–SCR association in the shoot apical meristem.
(A) Representative 3D projection of shoot apical meristem at 5 weeks after germination expressing pSHR:YFP-SHR reporter (green) (n≥6). The lower right inset shows a longitudinal optical section through the middle of the SAM. The lower left inset shows a longitudinal optical section through the middle of primordia 13 (representative section orientation shown by dotted line). Cell walls were stained with DAPI (red). Scale bar represents 50 µm. (B) Representative 3D projection of shoot apical meristem at 5 weeks after germination expressing pSCR:SCR-YFP reporter (green) (n≥10). The lower right inset shows longitudinal optical section through the middle of the SAM. Cell walls were stained with PI (red). Scale bar represents 50 µm. (C) Longitudinal optical sections through the middle of five successive primordia expressing pSHR:ntdTomato reporter (green) (representative section orientation shown by dotted line in Figure 2—figure supplement 1A). Cell walls were stained with DAPI (red). Scale bar represents 20 µm. (D and E) Longitudinal optical sections through the middle of five successive primordia expressing pSHR:YFP-SHR reporter (green) (C) and pSCR:SCR-YFP reporter (green) (D) (representative section orientation shown by dotted line in (A) and (B), respectively). Scale bars represent 20 µm. P=Primordium. (F and G) Longitudinal optical sections through the middle of five successive primordia coexpressing pSHR:YFP-SHR reporter (green) and pSCR:SCR-RFP reporter (red) (F), and pSCR::SCR:YFP reporter (green) and pSCR::SCR:RFP reporter (red) (G). Chlorophyll (blue). Scale bar represents 20 µm. (H) Average lifetime of YFP-SHR when expressed alone (pSHR:YFP-SHR (n =75)), or coexpressed together with SCR-RFP (pSHR:YFP-SHR/pSCR:SCR-RFP) in lateral organ primordia (n=22), sepal primordia (n=55) and petal primordia (n=13) in the shoot meristem. (I) Average lifetime of SCR-YFP when expressed alone (pSCR:SCR-YFP), or coexpressed together with SCR-RFP (pSCR:SCR-YFP/pSCR:SCR-RFP) in shoot meristem. Asterisks indicate a significant difference (∗∗∗∗p<0.0001: Statistically significant differences were determined by Student’s t-test, ns = no significant difference). P=Primordium.
Figure 2—figure supplement 1
The expression pattern of SHR and SCR in the shoot apical meristem.
(A) Representative 3D projection of shoot apical meristem at 5 weeks after germination expressing pSHR:ntdTomato reporter (green). Cell walls were stained with DAPI (red) (n≥5). Scale bar represents 50 µm. (B) Representative 3D projection of shoot apical meristem at 5 weeks after germination expressing pSCR:YFP reporter (green). Cell walls were stained with PI (red) (n≥3). The lower right inset shows an optical longitudinal section through the middle of the SAM. Scale bar represents 50 µm.
Figure 2—figure supplement 2

SHR regulates SCR expression in the shoot apical meristem.
(A and B) Representative 3D projection of shoot apical meristem at 5 weeks after germination coexpressing pSHR:YFP-SHR reporter (green) and pSCR:SCR-RFP reporter (red) (A) (the lower left inset shows a longitudinal optical section through the middle of primordia 10; representative section orientation shown by dotted line) and pSCR::SCR:YFP reporter (green) and pSCR::SCR:RFP reporter (red) (B). Chlorophyll (blue). Scale bars represent 50 µm. (C) Representative transversal confocal image of shoot apical meristem at 5 weeks after germination coexpressing the pSHR:SHR-YFP reporter (green) and the pSCR:SCR-RFP reporter (red) (n=4). Chlorophyll (blue). The lower right inset shows an optical section view with high magnification of the area surrounded by white dashed rectangle in (C). Scale bar represents 50 µm. (D and E) Representative 3D projection of shoot apical meristems at 5 weeks after germination expressing the pSCR:SCR-YFP reporter (green) in WT (n=5) (D) and shr-2 mutant (n=6) (E). Cell walls were stained with PI (red). Scale bar represents 50 µm. (F and G) Longitudinal optical sections through the middle of primordia shown by dotted line in (D) and (E) respectively. Yellow arrowheads in (F) and (G) show primordia with SCR-YFP expression. Scale bar represents 20 µm. (K) Intensity plot profile of SHR-YFP (green) signal and the SCR-RFP (red) signal in the area crossed by white dashed line in (C) inset. (L and M) Quantification of SCR-YFP signal intensity in the meristem center (L) (area surrounded by white dashed circles in (D) and (E)) and in the primordia (M). (N) Quantitative real-time PCR analysis showing the relative expression levels of SCR in WT and shr-2 mutant SAMs. The expression level in Col-0 is set to 1. Expression levels were normalized using AT4G34270 and AT2G28390. Asterisks indicate a significant difference (∗∗∗∗p<0.0001: Statistically significant differences were determined by Student’s t-test, ns = no significant difference). Error bars display SD.
Figure 3 with 2 supplements
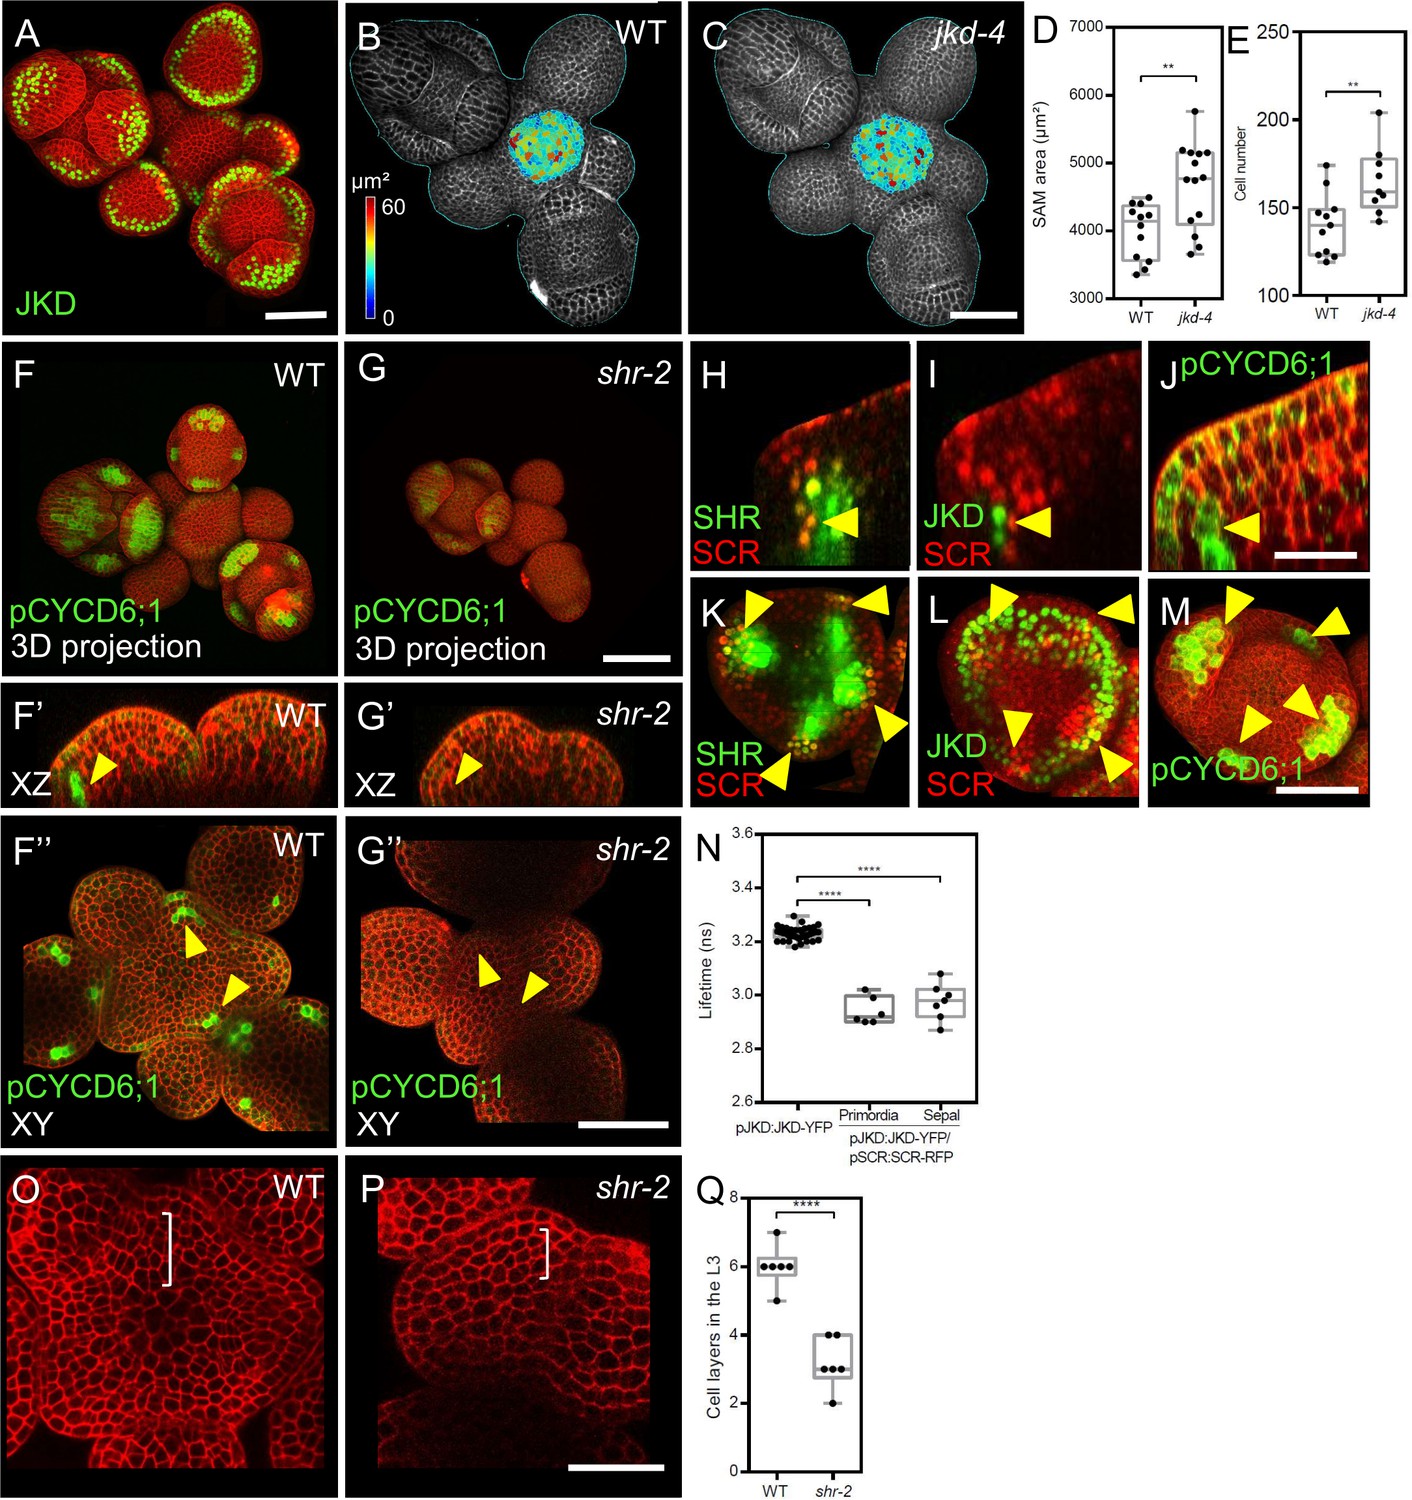
JKD functions and expression pattern in the shoot apical meristem.
SHR regulates CYCD6;1 expression in the shoot apical meristem. (A) Representative 3D projection of shoot apical meristems at 5 weeks after germination expressing pJKD:JKD-YFP reporter (green) (n≥20). Cell walls were stained with PI (red). Scale bar represents 50 µm. (B and C) Heat-map quantification of the cell area in the meristem region at 5 weeks after germination from WT (B) (n=10) and jkd-4 mutant (C) (n=10). Cell walls were stained with PI (gray). Scale bar represents 50 µm. (D) Quantification of shoot apical meristem size at 5 weeks after germination from WT (n=12) and jkd-4 mutant (n=14). (E) Quantification of epidermal cell number in the meristem region of WT (B) (n=10) and jkd-4 mutant (C) (n=10). (F and G) Representative 3D projection of shoot apical meristems at 5 weeks after germination expressing pCYCD6;1:GFP reporter (green) in WT (n=5) (F) and shr-2 mutant (n=6) (G). cell walls were stained with PI (red). Scale bar represents 50 µm. (F’and G’) Longitudinal optical sections of (F) and (G) respectively. (F’’ and G’’) Transversal optical sections of (F) and (G) respectively. Scale bar represents 50 µm. (H–J) lateral organ primordia showing coexpression of pSHR:SHR-YFP reporter (green) and pSCR::SCR-RFP reporter (red) (H), pJKD:JKD-YFP reporter (green) and pSCR::SCR-RFP reporter (red) (I) and pCYCD6;1-GFP reporter (green) (J). Scale bar represents 20 µm. (K–M) Florescence meristem stage 4 of flower development showing coexpression of pSHR:SHR-YFP reporter (green) and pSCR::SCR-RFP reporter (red) (K), pJKD:JKD-YFP reporter (green) and pSCR::SCR-RFP reporter (red) (L) and pCYCD6;1-GFP reporter (green) (M). Scale bar represents 20 µm. (N) Average lifetime of JKD-YFP when expressed alone (pJKD:JKD-YFP (n =38)), or coexpressed together with SCR-RFP (pJKD:JKD-YFP/pSCR:SCR-RFP) in lateral organ primordia (n=6) and sepal primordia (n=7) in the shoot meristem. (O and P) Transversal optical sections of the inflorescence apex at 5 weeks after germination from WT (O) and shr-2 mutant (P). Scale bar represents 20 µm. (Q) Quantitative comparison of cell files within the L3 in optical sections of the inflorescence apex from WT (n=6) and shr-2 mutant (n=6). Asterisks indicate a significant difference (∗∗∗∗p<0.0001; ∗∗p<0.001: Statistically significant differences were determined by Student’s t-test,).
Figure 3—figure supplement 1
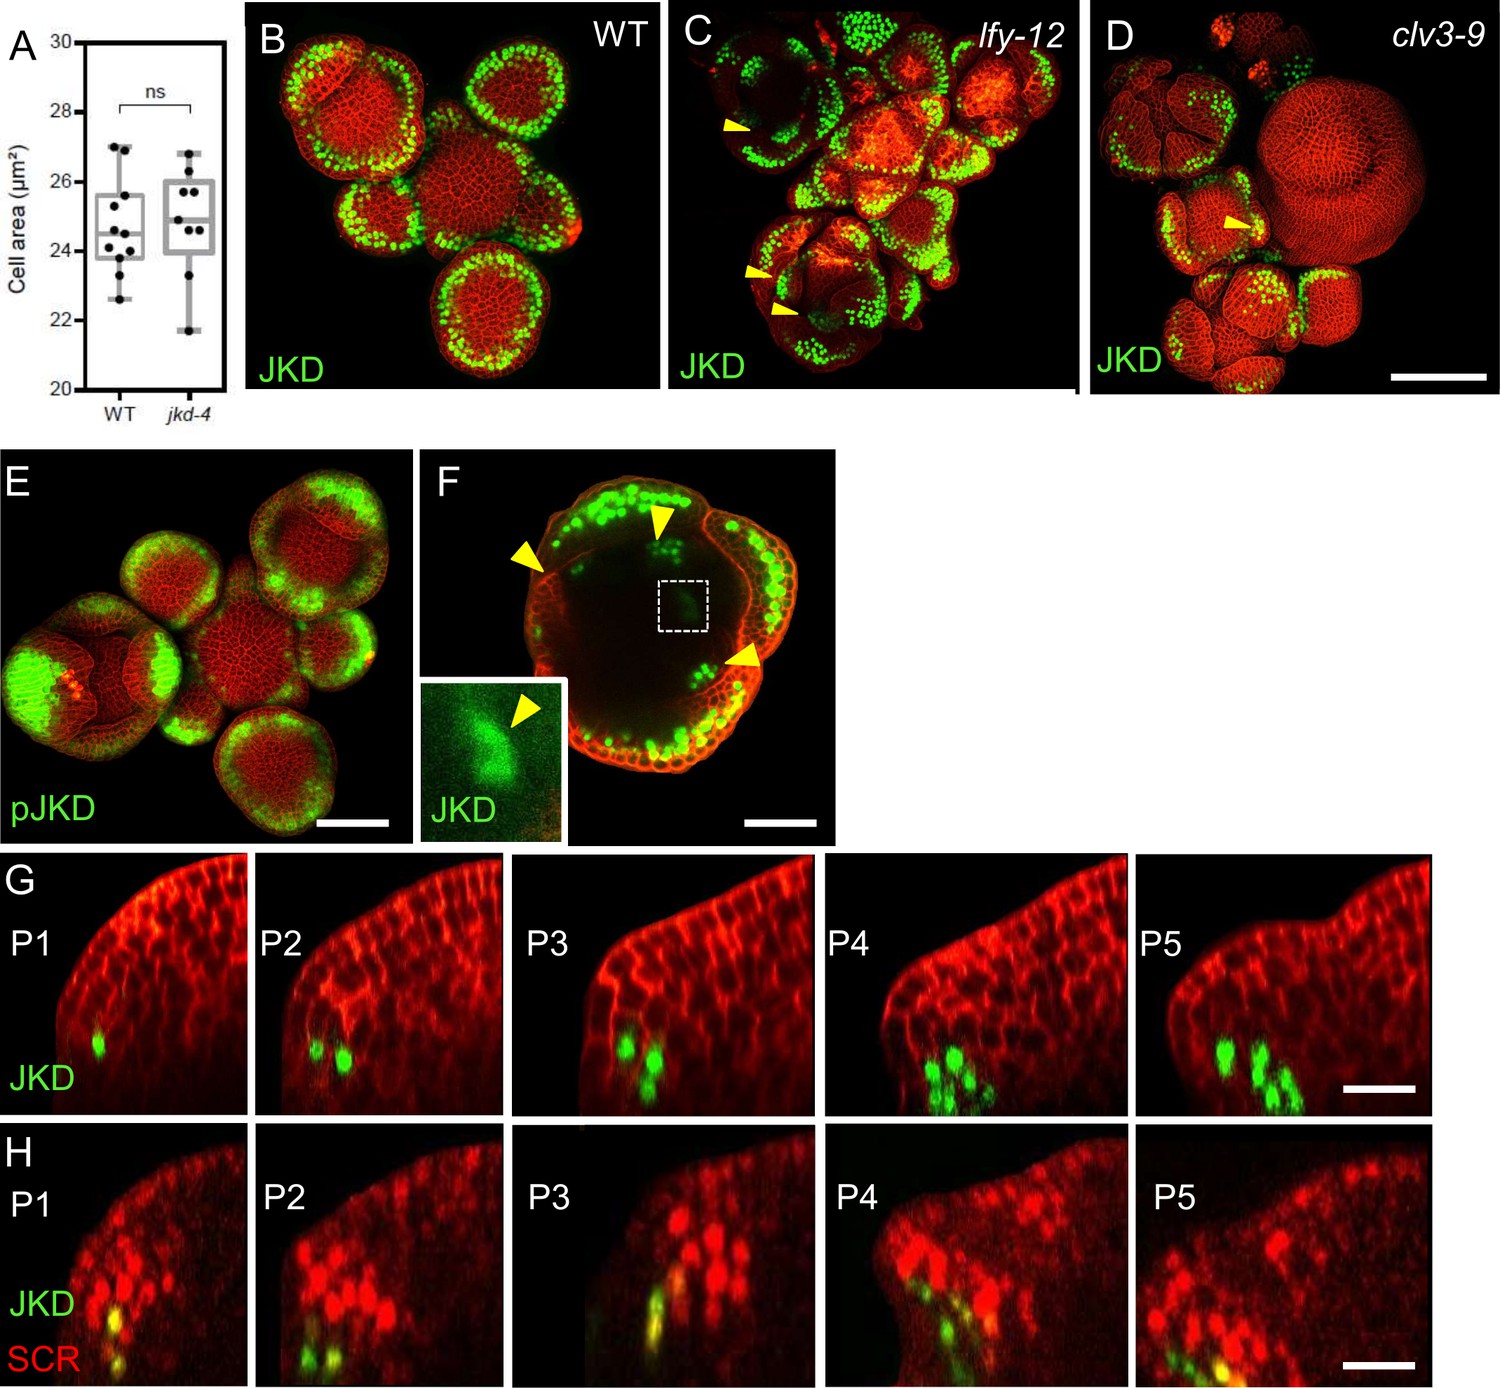
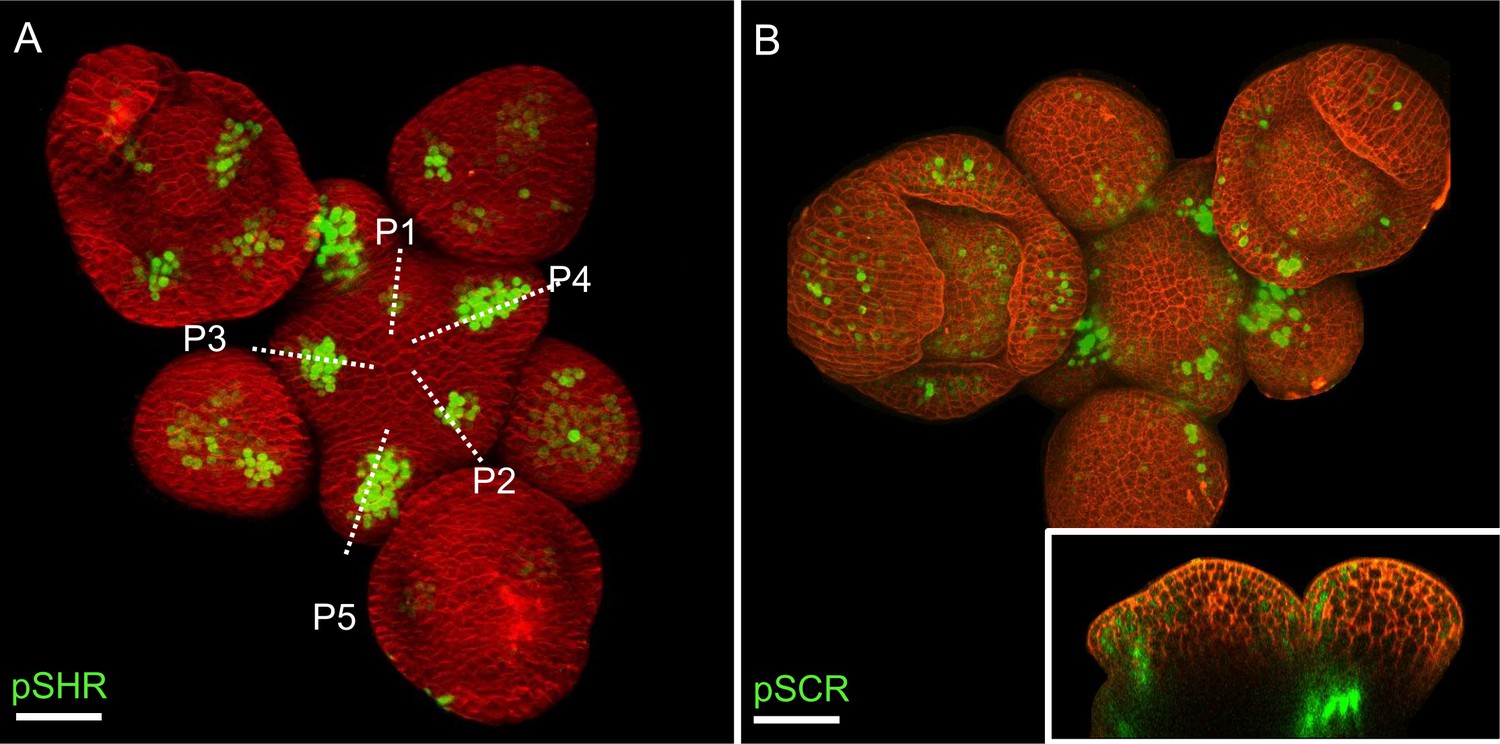
The expression pattern of JKD in lfy and clv3 mutant shoot apical meristems and colocalization of the expression of JKD and SCR in the shoot apical meristem.
(A) Quantification of the epidermal cell area in the meristem region of WT (n=10) and jkd-4 mutant (n=10). (B–D) Representative 3D projection of shoot apical meristems at 5 weeks after germination expressing pJKD:JKD-YFP reporter (green) in WT (B), lfy-12 mutant (C) and clv3-9 mutant (D). Cell walls were stained with PI (red). Scale bar represents 50 µm. difference. Statistically significant differences were determined by Student’s t-test, ns = no significant. (E) Representative 3D projection of shoot apical meristems at 5 weeks after germination expressing pJKD:YFP-RFP reporter (green) (n≥4). Cell walls were stained with PI (red). Scale bar represents 50 µm. (F) Transversal optical through the primordia 16 from inflorescence apex of pJKD:JKD-YFP reporter (green). Yellow arrowheads show petal primordia with pJKD:JKD-YFP expression. The lower left inset shows an optical view with high magnification of area surrounded by white dashed rectangle. Cell walls were stained with PI (red). Scale bar represents 20 µm. (G) Longitudinal optical sections through the middle of five successive primordia expressing pJKD:JKD-YFP reporter (green). Cell walls were stained with PI (red). Scale bar represents 20 µm. (H) Longitudinal optical sections through the middle of five successive primordia coexpressing pJKD:JKD-YFP reporter (green) and pSCR:SCR-RFP reporter (red). Scale bar represents 20 µm. Statistically significant differences were determined by Student’s t-test, ns = no significant difference. P=Primordium.
Figure 3—figure supplement 2
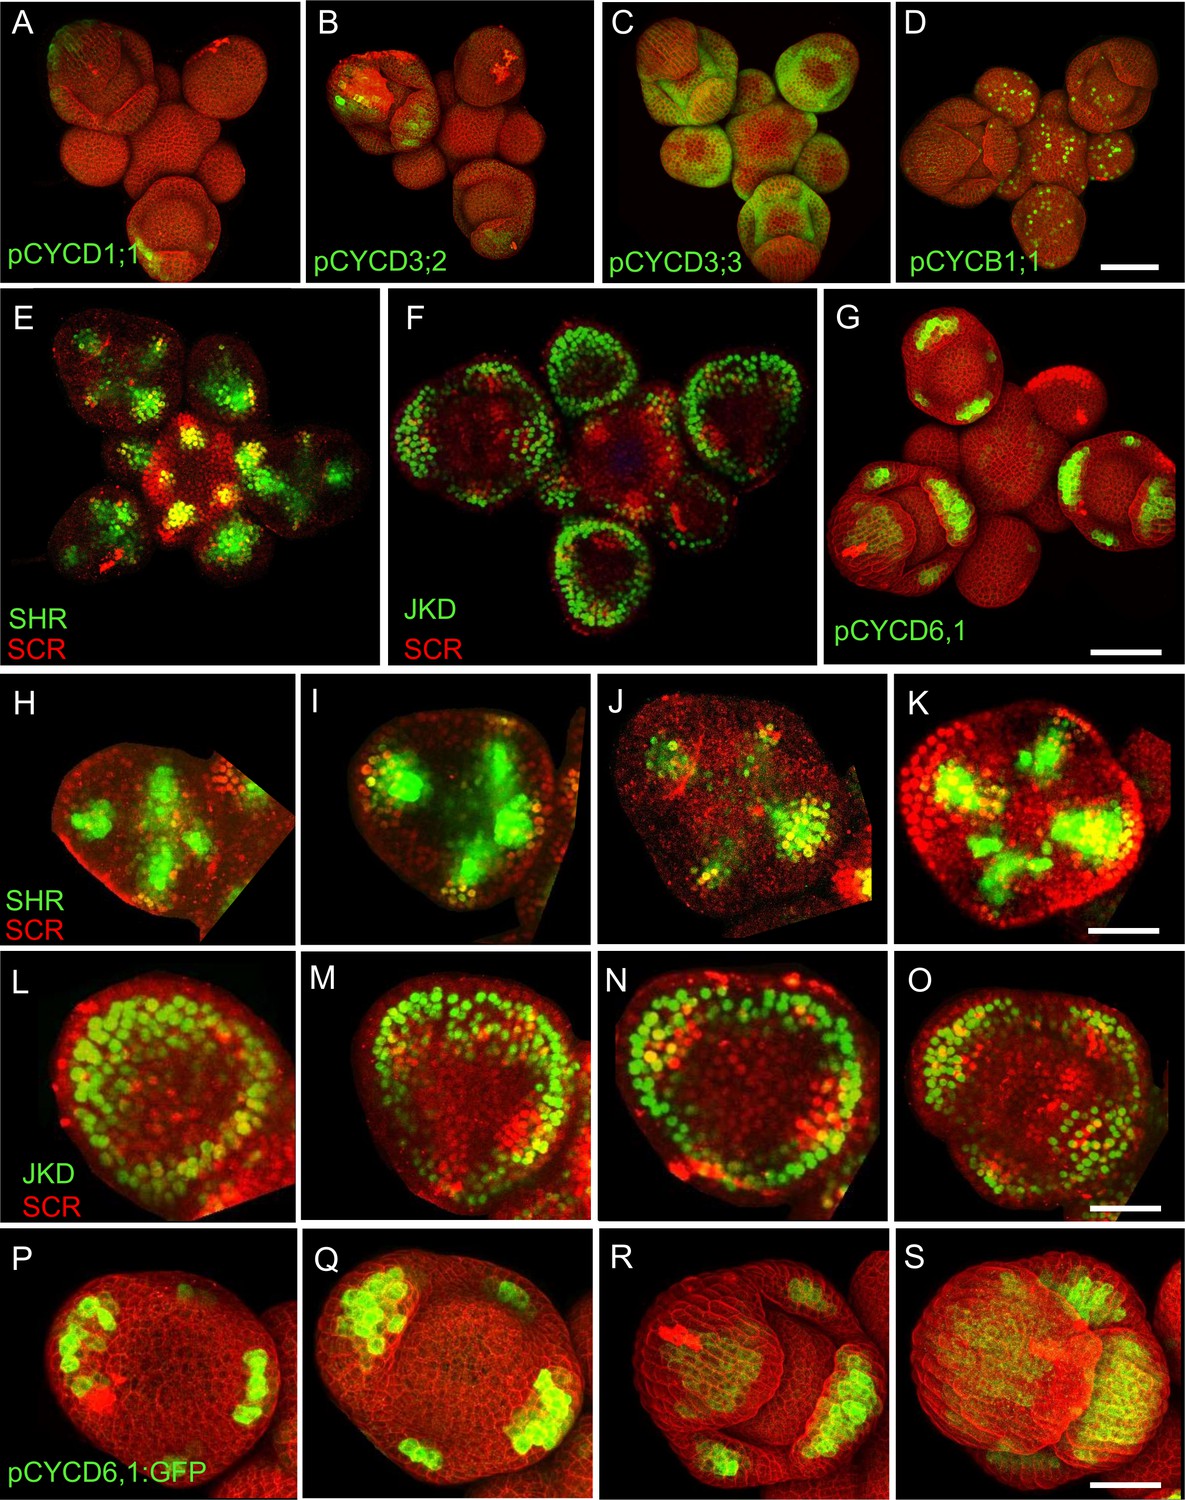
The colocalization of the expression patterns of SHR, SCR, JKD and CYCD6;1 in the shoot apical meristem.
(A–D) Representative 3D projection of shoot apical meristem at 5 weeks after germination expressing pCYCD1;1-GFP reporter (green) (A), pCYCD3;2-GFP reporter (green) (B), pCYCD3;3-GFP reporter (green) (C) and pCYCB1;1:CYCB1;1-GFP reporter (green) (D). Cell walls were stained with PI (red). Scale bar represents 50 µm. (E and F) Representative 3D projection of shoot apical meristems at 5 weeks after germination coexpressing pSHR:SHR-YFP reporter (green) and pSCR:SCR-RFP reporter (red) (E) and pJKD:JKD-YFP reporter (green) and pSCR:SCR-RFP reporter (red) (F). (G) Representative 3D projection of shoot apical meristems expressing pCYCD6;1:GFP (green) reporter (n≥5). Cell walls were stained with PI (red). Scale bar represents 50 µm. (H–S) Expression of SHR, SCR, JKD and CYCD6;1 during early stages of flower development. Expression is observed at the sepal primordia in the florescence meristem stage 3 (H, L and P), stage 4 (I, M and Q), stage 5 (J, N and R) and stage 6 (K, O and S). Scale bars represent 20 µm.
Figure 4 with 9 supplements
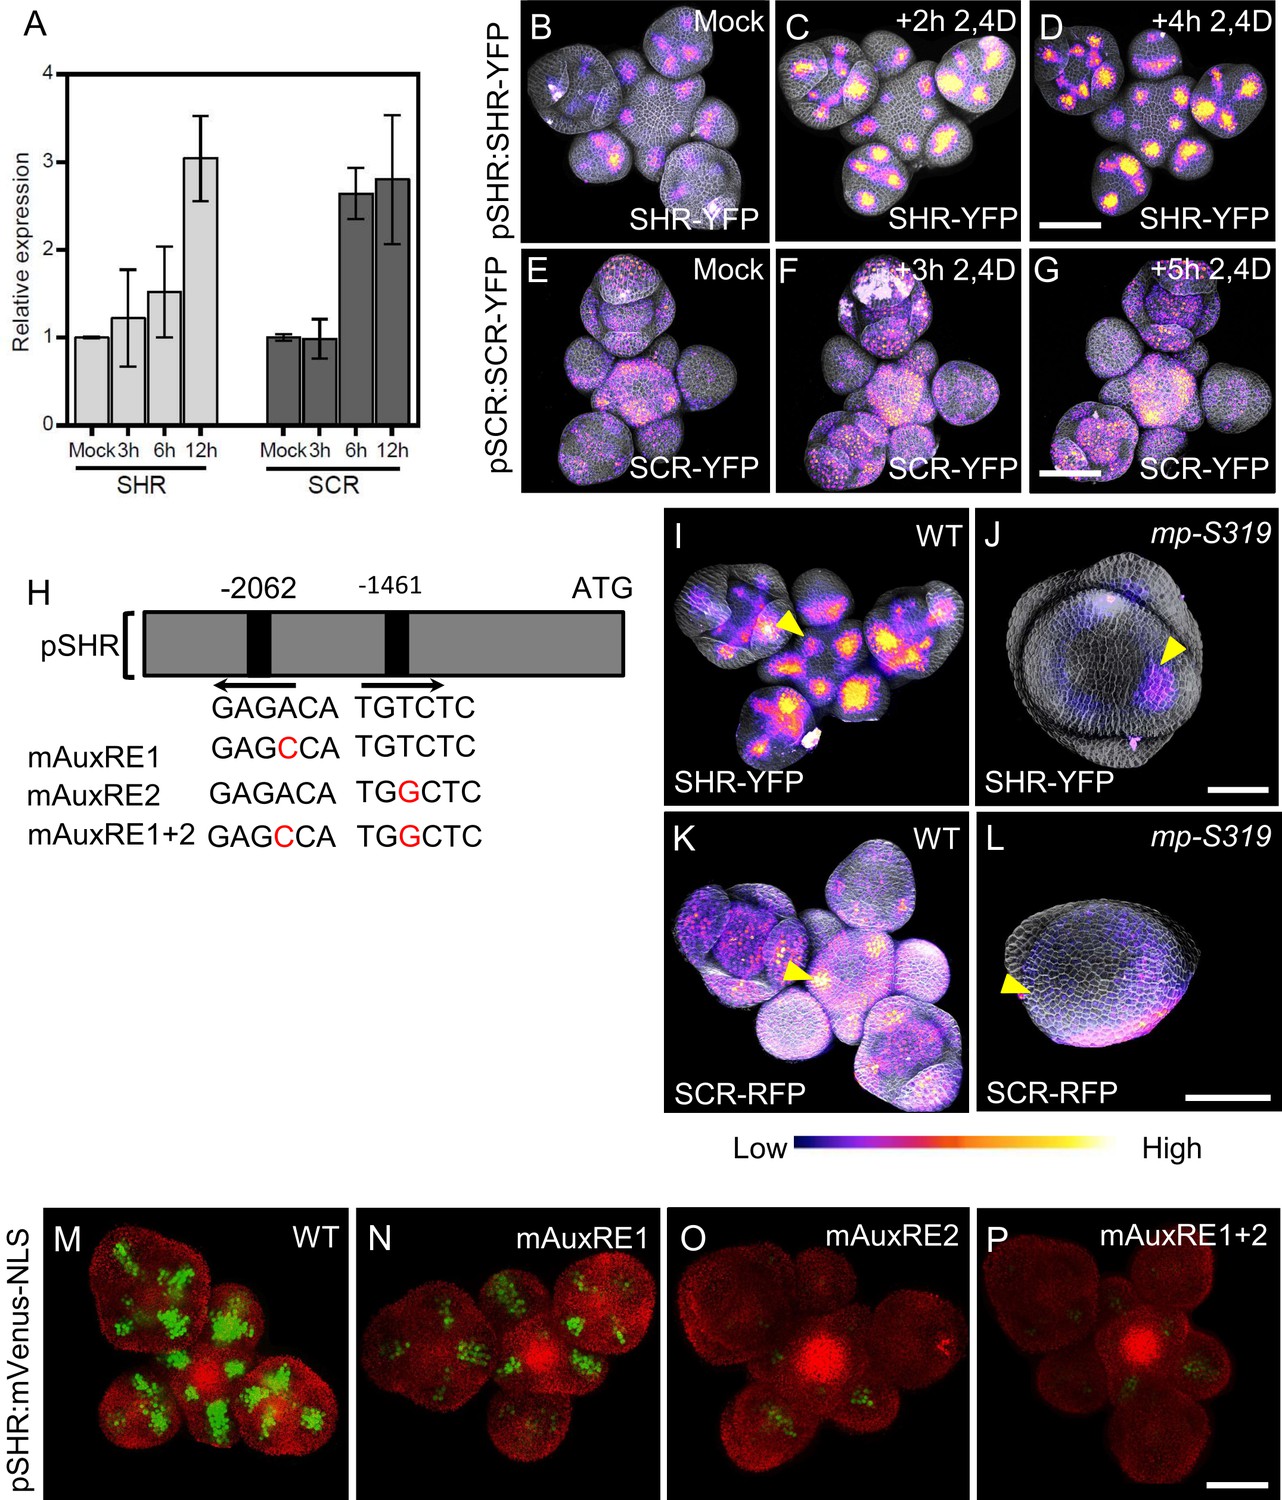
MP Regulates SHR and SCR expression in the shoot apical meristem.
(A) Quantitative real-time PCR analysis showing the relative expression levels of SHR and SCR expression in response to auxin (10 µm IAA) in WT shoot apical meristems. The expression level in Col-0 is set to 1 and error bars show standard deviation. Expression levels were normalized using AT4G34270 and AT2G28390. (B–D) Representative 3D projection of shoot apical meristems at 5 weeks after germination expressing pSHR:SHR-YFP reporter (magenta) in mock (B) (n=4), after 2 hours 10 µM 2,4D treatment (n=3) (C) and after 4 hours 10 µM 2,4D treatment (n=3) (D). Fluorescence intensities were coded blue to yellow corresponding to increasing intensity. Cell walls were stained with PI (gray). Scale bar represents 50 µm. (E–G) Representative 3D projection of shoot apical meristems at 5 weeks after germination expressing pSCR:SCR-YFP reporter (magenta) mock (E) (n=4), after 3 hours 10 µM 2,4D treatment (n=2) (F) and after 5 hours 10 µM 2,4D treatment (n=2) (G). Fluorescence intensities were coded blue to yellow corresponding to increasing intensity. Cell walls were stained with PI (gray). Scale bar represents 50 µm. (H) Schematic representation of the SHR promoter. The positions of two auxin response elements are shown. Overview of mutated promoter versions of pSHR. AuxREs were mutated and multiple combinations of these mutated motifs were combined into a single promoter. The original AuxRE sequence GAGACA was mutated to GAGCCA (mAuxRE1), the original AuxRE sequence TGTCTC was mutated to TGGCTC (mAuxRE2). (I and J) Representative 3D projection of shoot apical meristems at 5 weeks after germination expressing pSHR:SHR-YFP reporter (magenta) in WT (n=4) (I) and mp-S319 mutant (n=3) (J). Yellow arrowheads in (I) and (J) indicate the region where flower primordia initiate and pSHR:SHR-YFP expression. Fluorescence intensities were coded blue to yellow corresponding to increasing intensity. Cell walls were stained with PI (gray). Scale bar represents 50 µm. (K and L) Representative 3D projection of shoot apical meristems at 5 weeks after germination expressing pSCR:SCR-RFP reporter (magenta) in WT (n=4) (K) and mp-S319 mutant (n=4) (L). Yellow arrowheads in (K) and (L) indicate the region where flower primordia initiate and pSCR:SCR-RFP expression. Fluorescence intensities were coded blue to yellow corresponding to increasing intensity. Cell walls were stained with DAPI (gray). Scale bar represents 50 µm. (M–P) Representative 3D projection of shoot apical meristems at 5 weeks after germination expressing mVenus-NLS under the control of the wild-type SHR promoter (n≥6) (M), and under the control of the SHR promoter with mutations in AuxRE motifs mAuxRE1 (n≥5) (N) mAuxRE2 (O) and mAuxRE1 + 2 (n≥5) (P); Chlorophyll (red). Scale bar represents 50 µm.
Figure 4—figure supplement 1

The expression patterns of SHR, SCR, MP and PIN1 in the shoot apical meristem.
(A and B) Representative 3D projection of shoot apical meristems at 5 weeks after germination coexpressing pSCR:SCR-YFP reporter (green) and pSHR:ntdTomato reporter (red) (A) and the pMP:MP-GFP (green) and pSHR:ntdTomato (red) reporters (B). Cell walls were stained with DAPI (gray). Scale bar represents 50 µm. (C) Representative 3D projection of shoot apical meristems at 5 weeks after germination expressing pPIN1:PIN1-GFP reporter (green). Scale bar represents 50 µm. (D–F) Longitudinal optical sections through the middle of five successive primordia (representative section orientation shown by dotted line in (A), (B) and (C) respectively). Scale bars represent 20 µm.
Figure 4—figure supplement 2
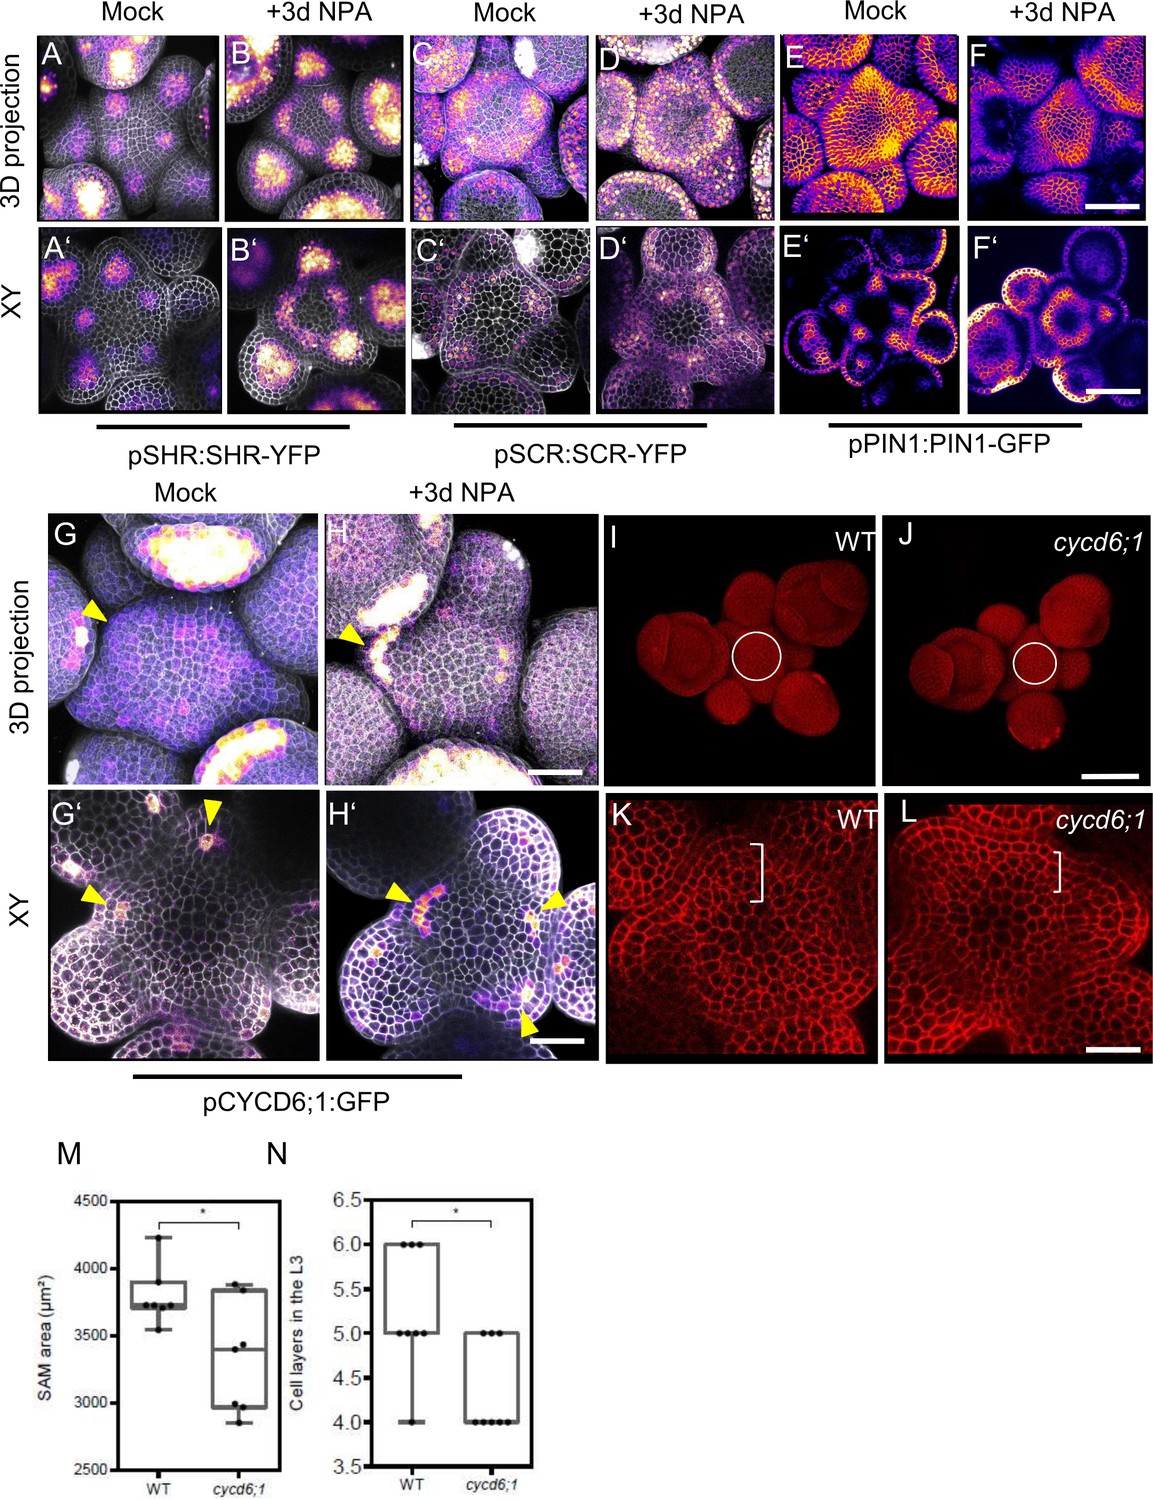
CYCD6;1 expression responds to auxin.
(A and B) Representative 3D projection of shoot apical meristems at 5 weeks after germination expressing pSHR:SHR-YFP reporter (magenta) three days after mock (n≥6) (A) or 100 µM NPA treatment (n≥6) (B). (A’ and B’) Transversal optical sections of (A) and (B), respectively. (C and D) Representative 3D projection of shoot apical meristems at 5 weeks after germination expressing pSCR:SCR-YFP reporter (magenta) 3 days after mock (n≥6) (C) or 100 µM NPA treatment (n≥6) (D). (C’ and D’) Transversal optical sections of (C) and (D), respectively. (E and F) Representative 3D projection of shoot apical meristems at 5 weeks after germination expressing pPIN1:PIN1-GFP reporter (magenta) 3 days after mock (n≥3) (E) or 100 µM NPA treatment (n≥3) (F). (E’ and F’) Transversal optical sections of (E) and (F) respectively. (G and H) Representative 3D projection of shoot apical meristems at 5 weeks after germination expressing pCYCD6;1:GFP reporter (magenta) 3 days after mock (n≥3) (G) or 100 µM NPA treatment (n≥6) (H). (G’ and H’) Transversal optical sections of (G) and (H), respectively. Yellow arrowheads in (G), (H), (G’) and (H’) show primordia with pCYCD6;1:GFP expression. Cell walls were stained with DAPI (gray). Scale bars represent 50 µm. (I and J) Representative 3D projection of shoot apical meristems at 5 weeks after germination from WT (n=8) (I) and cycd6;1 mutant (n=8) (J). (K and L) Transversal optical sections of the inflorescence apex at 5 weeks after germination from WT (K) and cycd6;1 mutant (L). (M) Quantification of shoot apical meristem size at 5 weeks after germination from WT (n=8) and cycd6;1 mutant (n=8). (N) Quantitative comparison of cell files within the L3 in optical sections of the inflorescence apex from WT (n=9) and shr-2 mutant (n=9). Scale bars represent 20 µm. Asterisks indicate a significant difference (∗p<0.01: Statistically significant differences were determined by Student’s t-test, ns = no significant difference).
Figure 4—figure supplement 3
MP Regulates SHR and SCR expression in the shoot apical meristem.
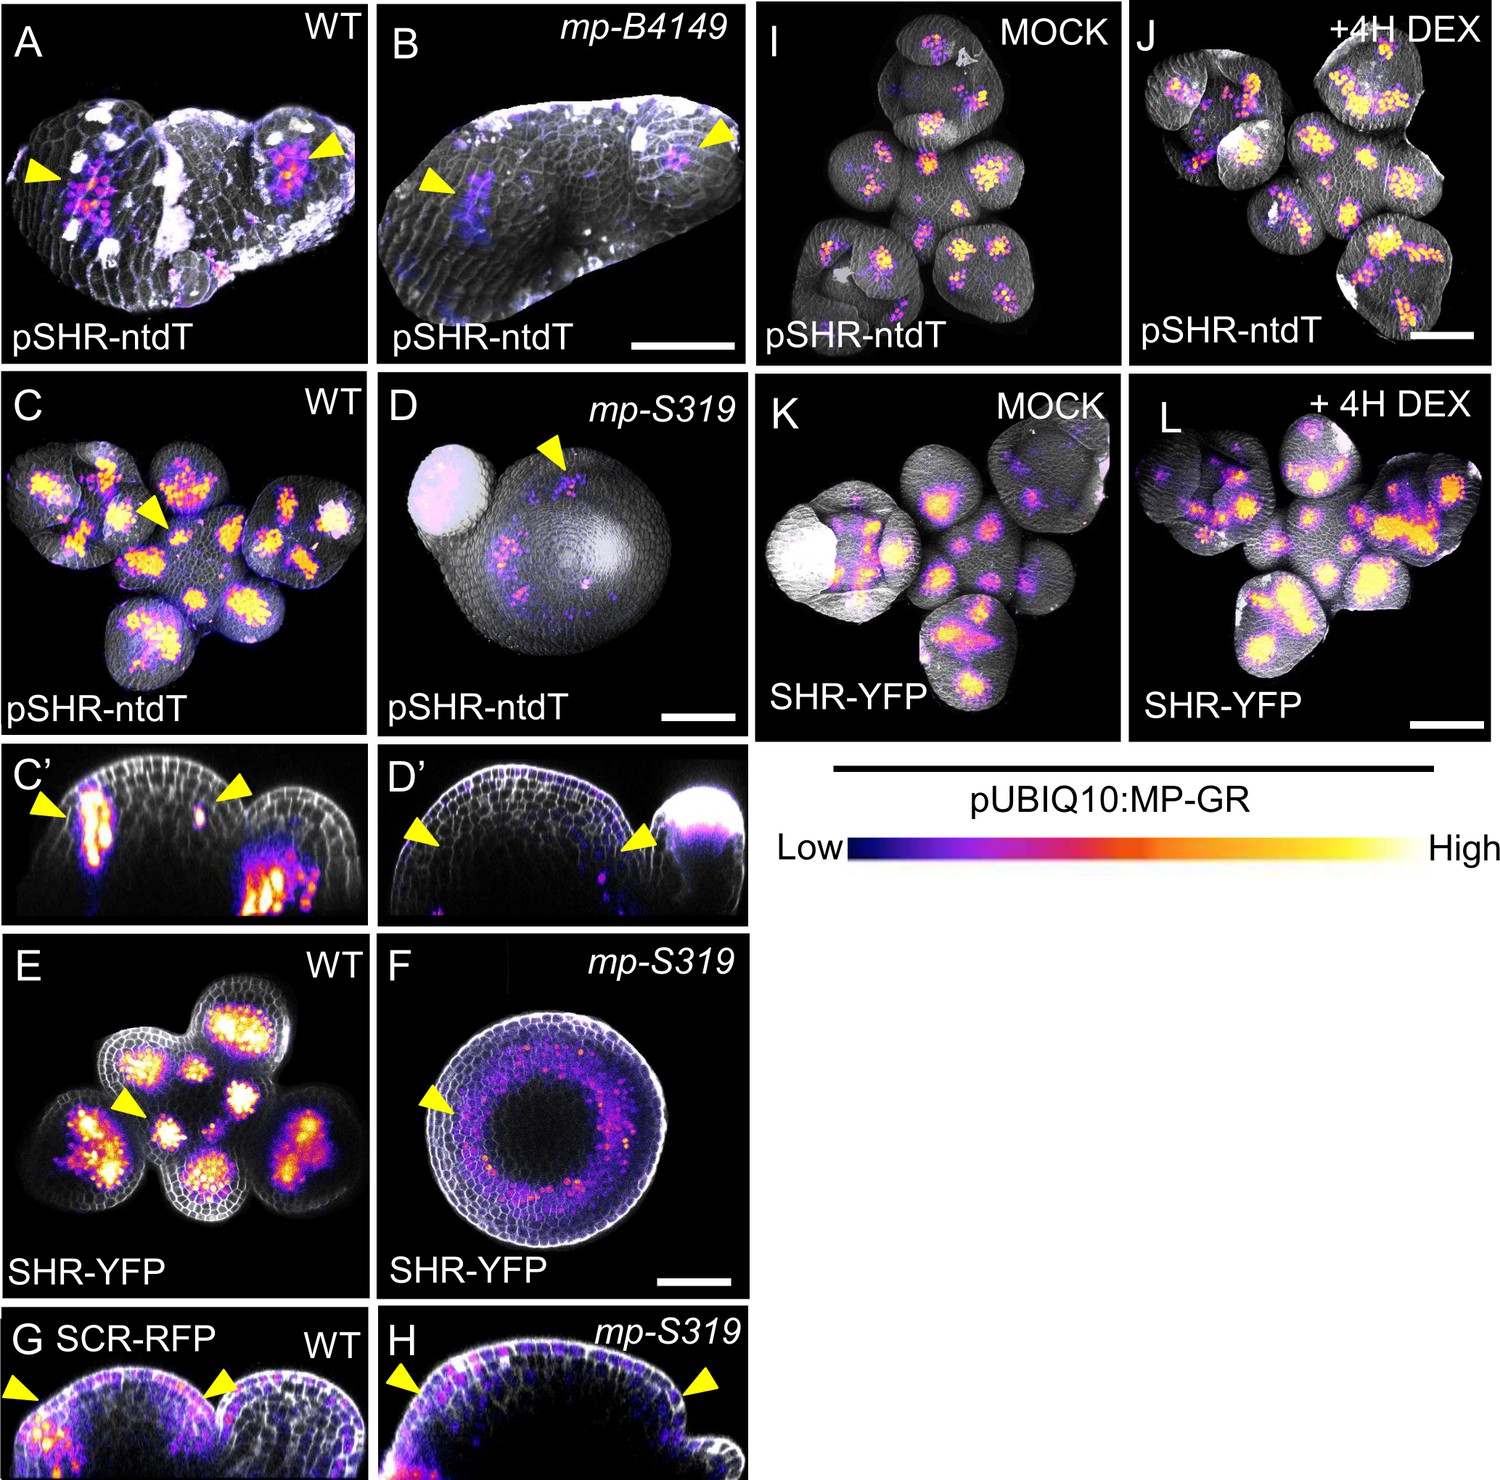
(A and B) Representative 3D projection of shoot apical meristems at 7 days after germination expressing pSHR-ntdTomato reporter (magenta) in WT (n=4) (A) and mp-B4149 (n=4) (B) mutant vegetative meristems. Yellow arrowheads in (A) and (B) indicate the region where flower primordia initiate and pSHR-ntdTomato expression. Fluorescence intensities were coded blue to yellow corresponding to increasing intensity. Cell walls were stained with DAPI (gray). Scale bar represents 50 µm. (C and D) Representative 3D projection of shoot apical meristems at 5 weeks after germination expressing pSHR-ntdTomato reporter (magenta) in WT (n=5) (C) and mp-S319 mutant (n=5) (D). (C’and D’) Longitudinal optical section of (C) and (D) respectively. Yellow arrowheads in (C), (D), (C’) and (D’) indicate the region where flower primordia initiate and pSHR-ntdTomato expression. Fluorescence intensities were coded blue to yellow corresponding to increasing intensity. Cell walls were stained with DAPI (gray). Scale bar represents 50 µm. (E and F) Transversal optical section of shoot apical meristems at 5 weeks after germination expressing pSHR:SHR-YFP reporter (magenta) in WT (n=4) (E) and mp-S319 mutant (n=3) (F). Yellow arrowheads in (E) and (F) indicate the region where flower primordia initiate and pSHR:SHR-YFP expression. Fluorescence intensities were coded blue to yellow corresponding to increasing intensity. Cell walls were stained with DAPI (gray). Scale bar represents 50 µm. (G and H) Longitudinal optical section of shoot apical meristems at 5 weeks after germination expressing pSCR:SCR-RFP reporter (magenta) in WT (n=4) (G) and mp-S319 mutant (n=4) (H). Yellow arrowheads in (G) and (H) indicate the region where flower primordia initiate and pSCR:SCR-RFP expression. (I and J) Representative 3D projection of shoot apical meristems at 5 weeks after germination expressing pSHR:ntdTomato reporter (magenta) in pUBIQ10:MP-GR plants 4 hr after mock (I) (n=4) and 4 hr after DEX treatment (J) (n=4). Cell walls were stained with DAPI (gray). Fluorescence intensities were coded blue to yellow corresponding to increasing intensity. Scale bar represents 50 µm. (K and L) Representative 3D projection of shoot apical meristems at 5 weeks after germination expressing pSHR:SHR-YFP reporter (magenta) in pUBIQ10:MP-GR plants 4 hr after mock (n=5) (K) and 4 hr after DEX treatment (n=5) (L). Cell walls were stained with DAPI (gray). Fluorescence intensities were coded blue to yellow corresponding to increasing intensity. Scale bar represents 50 µm.
Figure 4—figure supplement 4

shr mutant and shr mp-S319 double-mutant phenotypes.
(A–D) Plant phenotypes of 42-day-old WT (A), mp-S319 mutant (B), shr-2 mutant (C) and mp-S319 shr-2 double mutant (D). Scale bars represent 1 cm. (A’–D ’) Top view of 31-day-old inflorescences of WT (A’), mp-S319 mutant (B’), shr-2 mutant (C’) and mp-S319 shr-2 double mutant (D’). Scale bars represent 2 mm. (A’–D ’). Representative 3D projection of shoot apical meristems at 5 weeks after germination from WT (A’’), mp-S319 mutant (B’’), shr-2 mutant (C’’), and mp-S319 shr-2 double mutant (D’’). Cell walls were stained with DAPI (gray). Scale bar represents 50 µm.
Figure 4—figure supplement 5
MP induces the expression of SHR in planta.
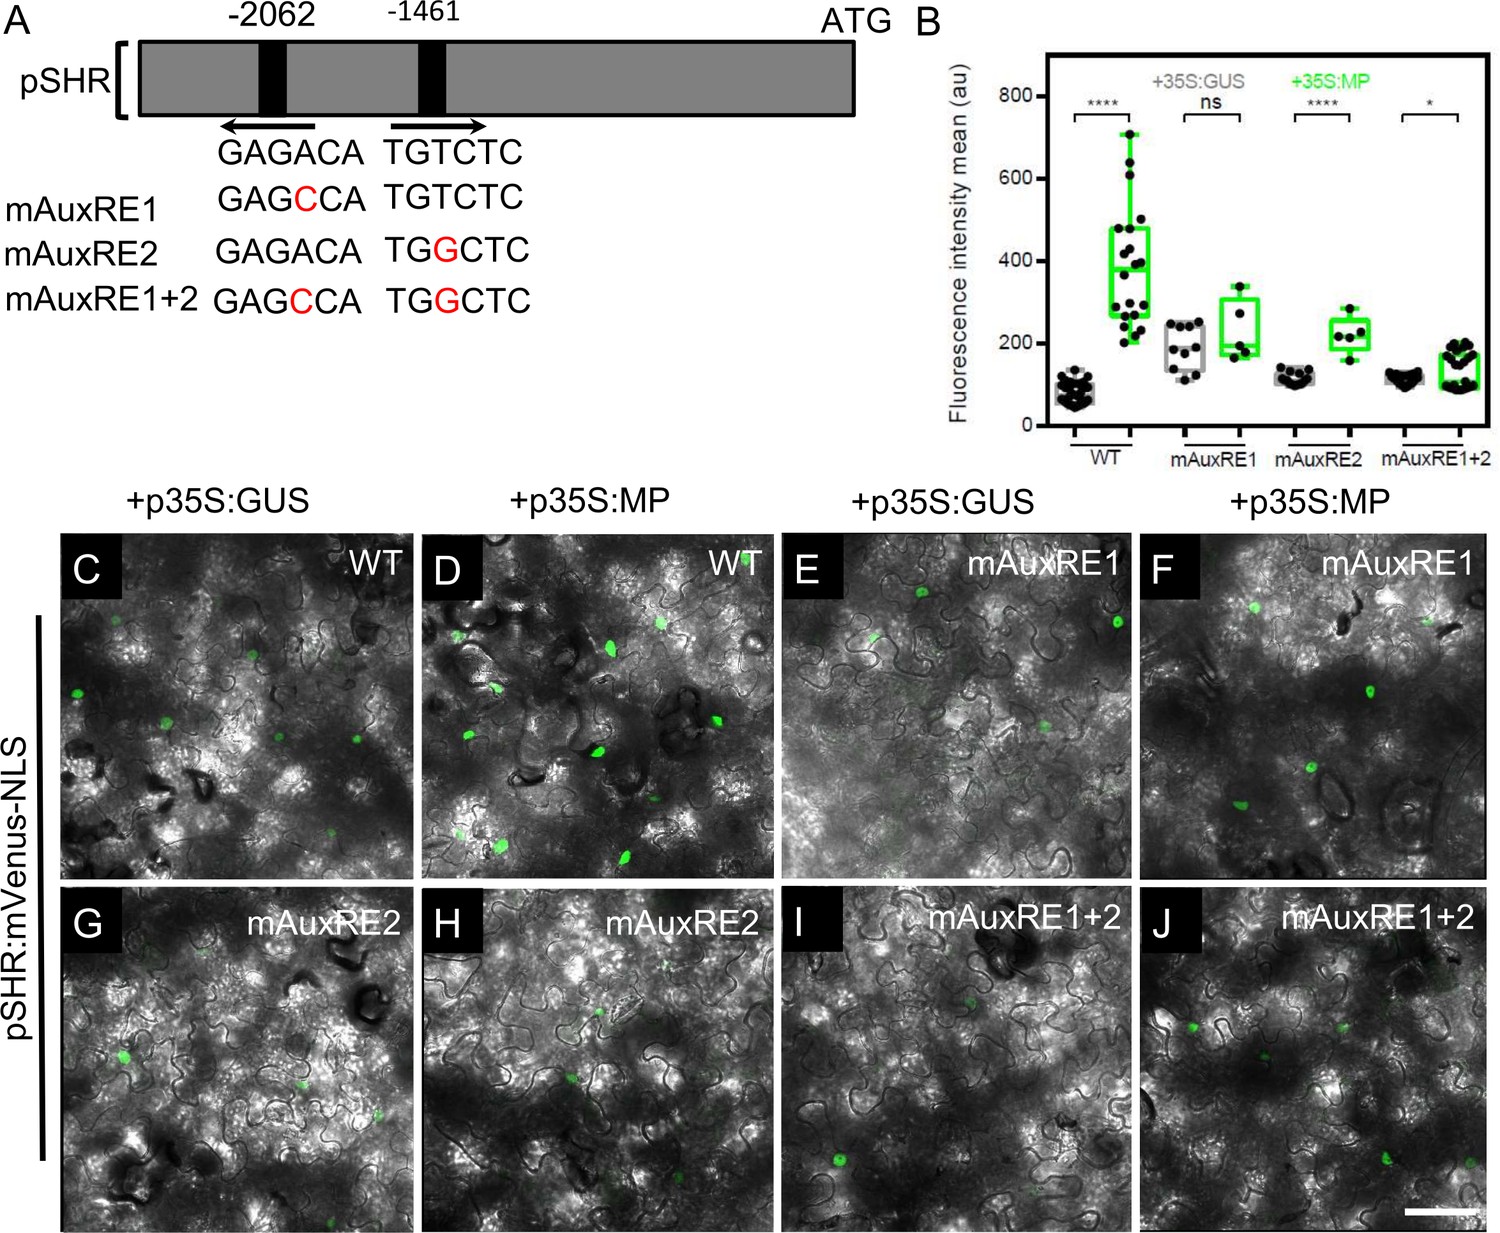
(A) Schematic representation of the SHR promoter. The positions of two auxin response elements are shown. Overview of mutated promoter versions of pSHR. AuxREs were mutated and multiple combinations of these mutated motifs were combined into a single promoter. The original AuxRE sequence GAGACA was mutated to GAGCCA (mAuxRE1), the original AuxRE sequence TGTCTC was mutated to TGGCTC (mAuxRE2). (B) Quantification of mVenus fluorescence signal intensity from leaves transiently transformed with mVenus-NLS under the control of the wild-type SHR promoter or under the control of the SHR promoter with mutations in AuxRE motifs in the presence of p35S:GUS or p35S:MP. (C–J) Leaves transiently transformed with mVenus-NLS under the control of the wild-type SHR promoter (C and D) or under the control of the SHR promoter with mutations in AuxRE motifs, mAuxRE1 (E and F) mAuxRE2 (G and H) and mAuxRE1 + 2 (I and J) together with p35S:MP or p35S:GUS. mVenus fluorescence signals were detected by confocal microscopy. Scale bar represents 50 µm. Asterisks indicate a significant difference (∗∗∗∗p<0.0001; *p<0.01: Statistically significant differences were determined by Student’s t-test, ns = no significant difference).
Figure 4—figure supplement 6
MP Regulates SHR expression in the shoot apical meristem.
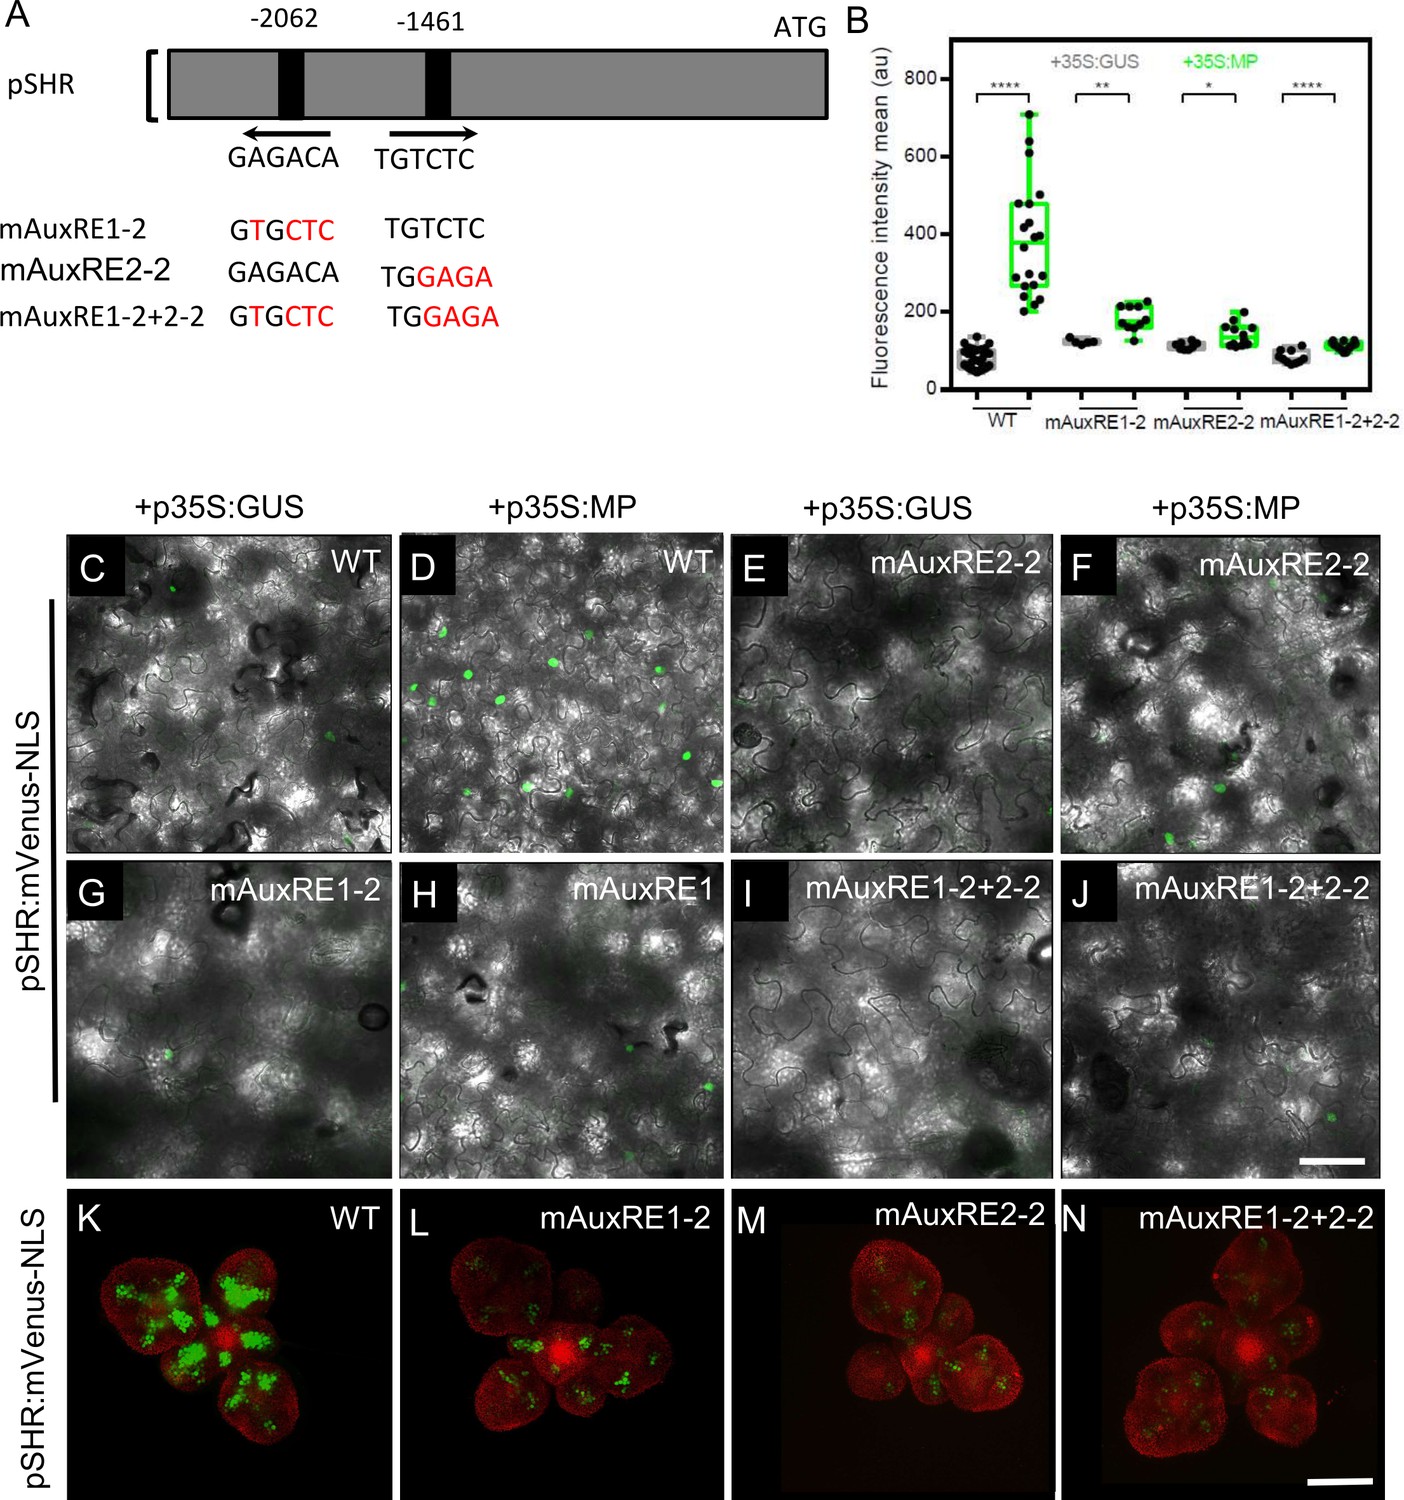
(A) Schematic representation of the SHR promoter. The positions of two auxin response elements are shown. Overview of mutated promoter versions of pSHR. AuxREs were mutated and multiple combinations of these mutated motifs were combined into a single promoter. The original AuxRE sequence GAGACA was mutated to GTGCTC (mAuxRE1), the original AuxRE sequence TGTCTC was mutated to TGGAGA (mAuxRE2-2). (B) Quantification of mVenus fluorescence signal intensity from leaves transiently transformed with mVenus-NLS under the control of the wild-type SHR promoter or under the control of the SHR promoter with mutations in AuxRE motifs in the presence of p35S:GUS or p35S:MP. (C-J) Leaves transiently transformed with mVenus-NLS under the control of the wild-type SHR promoter (C and D) or under the control of the SHR promoter with mutations in AuxRE motifs, mAuxRE1-2 (E and F) mAuxRE2-2 (G and H) and mAuxRE1-2+2-2 (I and J) together with p35S:MP or p35S:GUS. mVenus fluorescence signals were detected by confocal microscopy. Scale bar represents 50 µm. (K–N) Representative 3D projection of shoot apical meristems at 5 weeks after germination expressing mVenus-NLS under the control of the wild-type SHR promoter (K), and under the control of the SHR promoter with mutations in AuxRE motifs mAuxRE1-2 (L) mAuxRE2-2 (M) and mAuxRE1-2+2-2 (N); Chlorophyll (red). Scale bar represents 50 µm. Asterisks indicate a significant difference (∗∗∗∗p < 0.0001; ∗∗p < 0.001; ∗p < 0.01: Statistically significant differences were determined by Student's t-test).
Figure 4—figure supplement 7
MP induces the expression of SHR in planta.
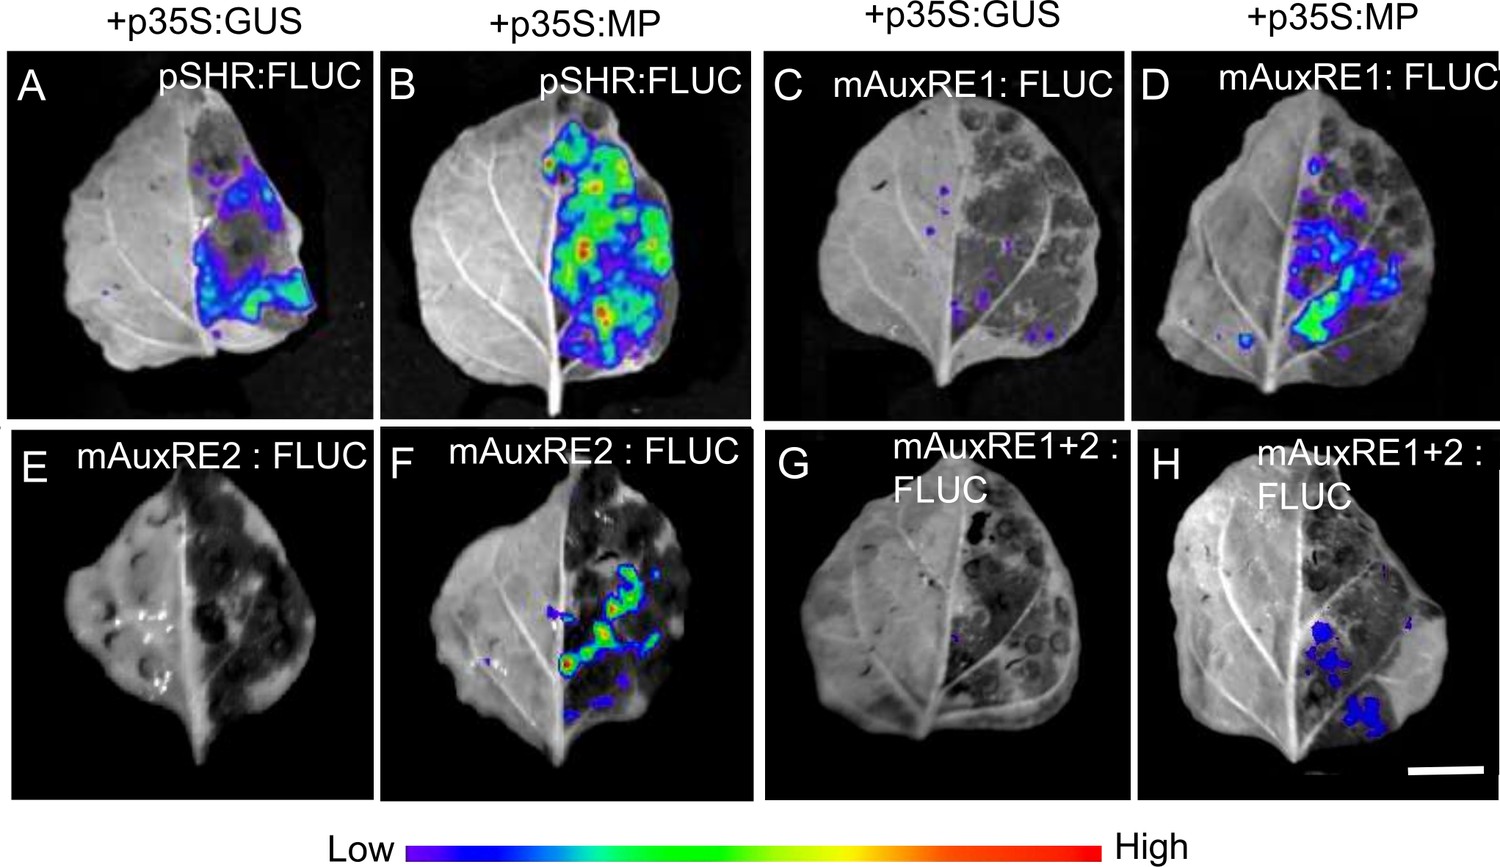
(A-H) Representative images of leaves transformed with pSHR variants pSHR (A and B), mAuxRE1 (C and D), mAuxRE2 (E and F) and mAuxRE1+2 (G and H) driving the reporter gene firefly luciferase (FLUC) together with p35S:MP or p35S:GUS. D-luciferin was used as the substrate of FLUC. No luminescence could be detected without the substrate D-Luciferin. Color code indicate relative signal intensities (red: high; violet: low). Scale bar represents 1 cm.
Figure 4—figure supplement 8

The expression pattern of the different promoter versions of SHR in the root apical meristem.
(A–G) Representative images of root apical meristem at 5 days after germination expressing mVenus-NLS driven by the wild-type SHR promoter (A), and the SHR promoter with mutations in AuxRE motifs mAuxRE1 (B), mAuxRE2 (C), mAuxRE1+2 (D), mAuxRE1-2 (E), mAuxRE2-2 (F), and mAuxRE1-2+2-2 (G). (H) Representative images of 5-d-old root tips that coexpressing the pMP:MP-GFP reporter (green) and pSHR:ntdTomato reporter (red). Cell walls were stained with PI (red). Scale bar represents 50 µm.
Figure 4—figure supplement 9
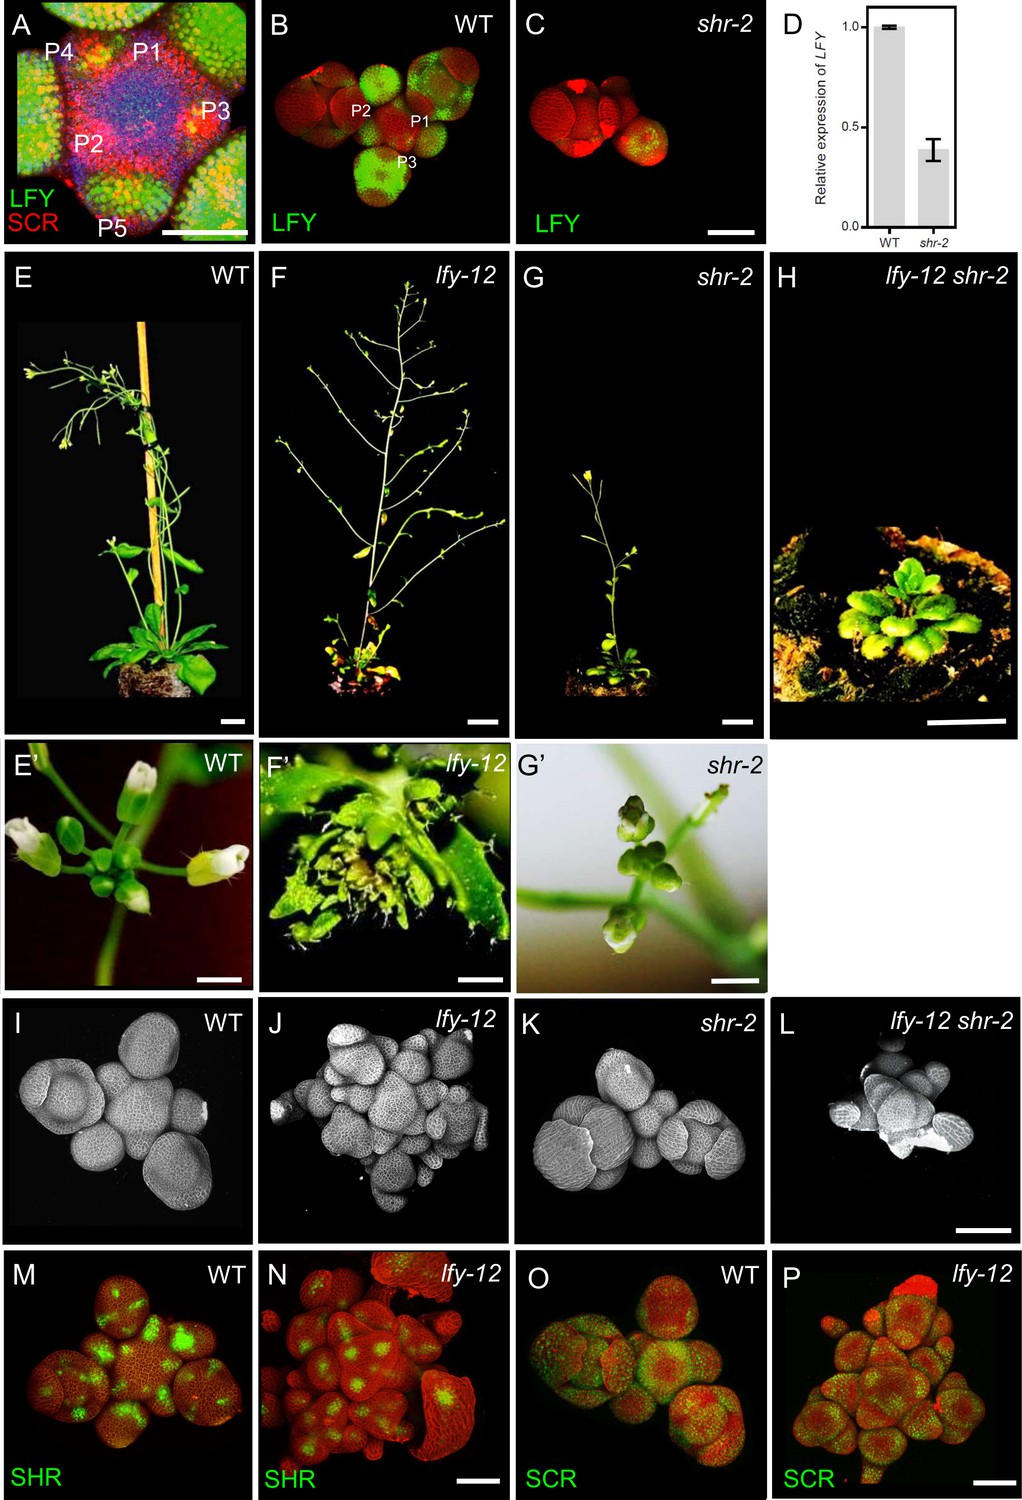
LFY act downstream of SHR in the shoot apical meristem.
(A) Representative 3D projection of shoot apical meristems at 5 weeks after germination coexpressing pLFY:LFY-GFP (green) and pSCR:SCR-RFP (red) reporters. Chlorophyll (blue). Scale bar represents 50 µm. (B and C) Representative 3D projection of shoot apical meristems expressing pLFY:LFY-GFP reporter (green) in WT(n≥3) (L) and shr-2 mutant (n≥3) (M). Cell walls were stained with PI (red). Scale bar represents 50 µm. (D) Quantitative real-time PCR analysis showing the relative expression levels of LFY in WT and shr-2 mutant shoot apical meristems. The expression level in Col-0 is set to 1 and error bars show standard deviation. Expression levels were normalized using At4g34270 and AT2G28390. (E-H) Plant phenotypes of 45-day-old WT (E), lfy-12 mutant (F), shr-2 mutant (G) and lfy-12 shr-2 double mutant (H). Cell walls were stained with PI (gray). Scale bars represent 1 cm. (E’-G’) Top view of 31-day-old inflorescences of WT (E’), lfy-12 (F’) mutant and shr-2 mutant (G’). Scale bars represent 2 mm. (I-L) Representative 3D constraction of shoot apical meristems at 5 weeks after germination from WT (I), lfy-12 mutant (J), shr-2 mutant (K) and lfy-12 shr-2 double mutant (L). Scale bar represents 50 µm. (M and N) Representative 3D projection of shoot apical meristems at 5 weeks after germination expressing pSHR:SHR-YFP reporter (green) in WT (M) and lfy-12 mutant (N). Cell walls were stained with PI (red). Scale bar represents 50 µm. (O and P) Representative 3D projection of shoot apical meristems expressing pSCR:SCR-YFP reporter (green) in WT (O) and lfy-12 mutant (P). Cell walls were stained with PI (red). Scale bar represents 50 µm.
Figure 5 with 4 supplements
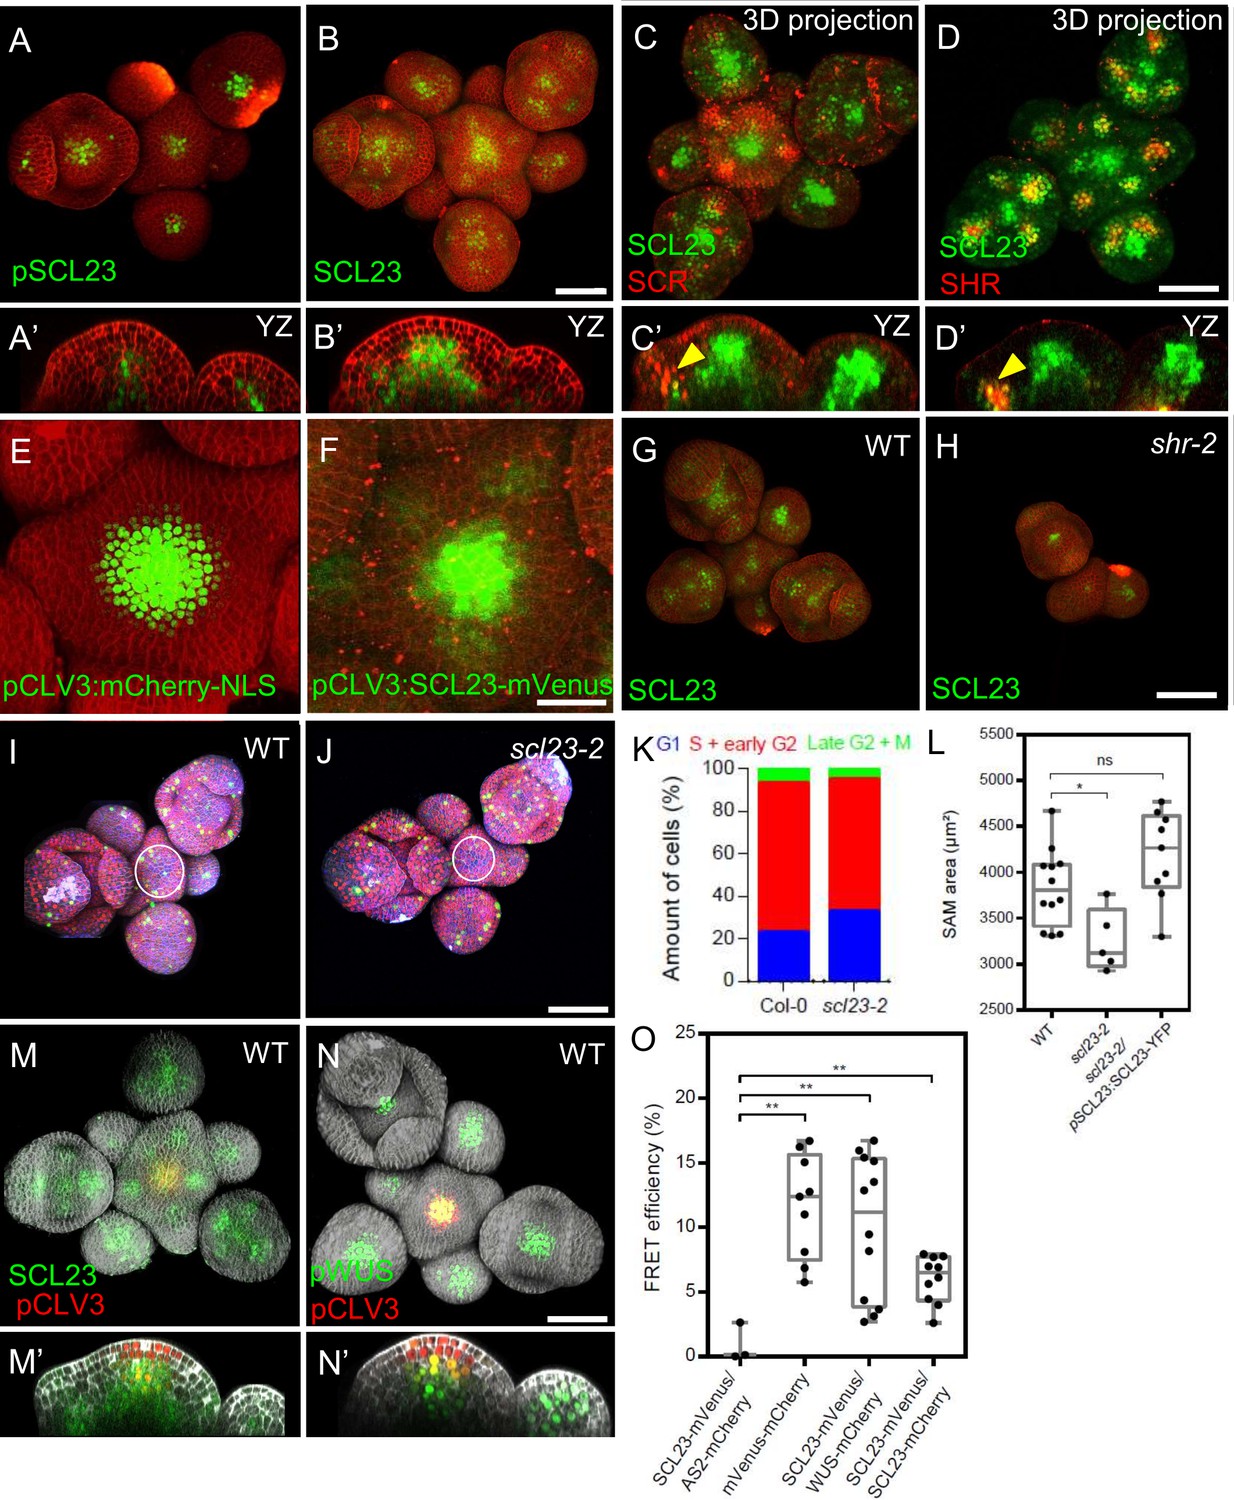
Interplay of SCL23, SCR, SHR, SCL23-WUS Interaction in the Shoot Apical Meristem.
(A and B) Representative 3D projection of shoot apical meristems at 5 weeks after germination expressing pSCL23:H2B-YFP reporter (green) (n≥3) (A) and pSCL23:SCL23-YFP reporter (green) (n≥10) (B). Cell walls were stained with PI (red). Scale bar represents 50 µm. (A’ and B’) Longitudinal optical sections of (A) and (B) respectively. (C and D) Representative 3D projection of shoot apical meristems at 5 weeks after germination meristems coexpressing pSCL23:SCL23-YFP reporter (green) and pSCR:SCR-RFP reporter (red) (n≥3) (C) and pSCL23:SCL23-YFP reporter (green) and pSHR:mScarlet-RFP reporter (red) (n≥3) (D). Cell walls were stained with PI (red). Scale bar represents 50 µm. (C’ and D’) Longitudinal optical sections of (C) and (D) respectively. (E and F) Representative 3D projection of shoot apical meristems at 5 weeks after germination expressing pCLV3-mCherry-NLS reporter (green) (n≥5) (E) and the pCLV3:SCL23-mVenus reporter (green) (n≥4) (F). Cell walls were stained with PI (red). Scale bar represents 50 µm. (G and H) Representative 3D projection of shoot apical meristems at 5 weeks after germination expressing pSCL23:SCL23-YFP reporter (green) in WT (n=4) (G) and shr-2 mutant (n=3) (H). Cell walls were stained with PI (red). Scale bar represents 50 µm. (I and J) Representative 3D projection of shoot apical meristems at 5 weeks after germination from WT (n=11) (I) and scl23-2 (n=5) (J) coexpressing the three PlaCCI markers. pCDT1a:CDT1a-eCFP reporter (blue), pHTR13:pHTR13-mCherry reporter (red) and pCYCB1;1:NCYCB1;1-YFP reporter (green). Cell walls were stained with DAPI (gray). Scale bar represents 50 µm. (K) Quantification of different cell cycle phases of SAM expressing PlaCCI in WT (n=11) and scl23-2 (n=5). Asterisks indicate a significant difference (∗P<0.01: Statistically significant differences were determined by Student’s t-test, ns = no significant difference). (L) Quantification of shoot apical meristem size at 5 weeks after germination from Col-0 (n=12), scl23-2 mutant (n=5) and scl23-2/pSCL23:SCL23-YFP (n=9). (M and N) Representative 3D projection of shoot apical meristems at 5 weeks after germination coexpressing pSCL23:SCL23-YFP (green) and pCLV3-mCherry-NLS reporter (red) (n≥3) (M) and pWUS:3xVenus-NLS reporter (green) and pCLV3-mCherry-NLS reporter (red) (n≥6) (N). Cell walls were stained with DAPI (gray). Scale bar represents 50 µm. (M’ and N’) Longitudinal optical sections of (M) and (N) respectively. (O) FRET efficiency measured in epidermis cells of N. benthamiana between SCL23-mVenus and WUS-mCherry (n=12) or SCL23-mCherry (n=10), compared with the negative control SCL23-mVenus and AS2-mCherry (n=3) and positive control mVenus-mCherry (n=9). Asterisks indicate a significant difference (∗∗p<0.001; ∗p<0.01: Statistically significant differences were determined by Student’s t-test, ns = no significant difference).
Figure 5—figure supplement 1
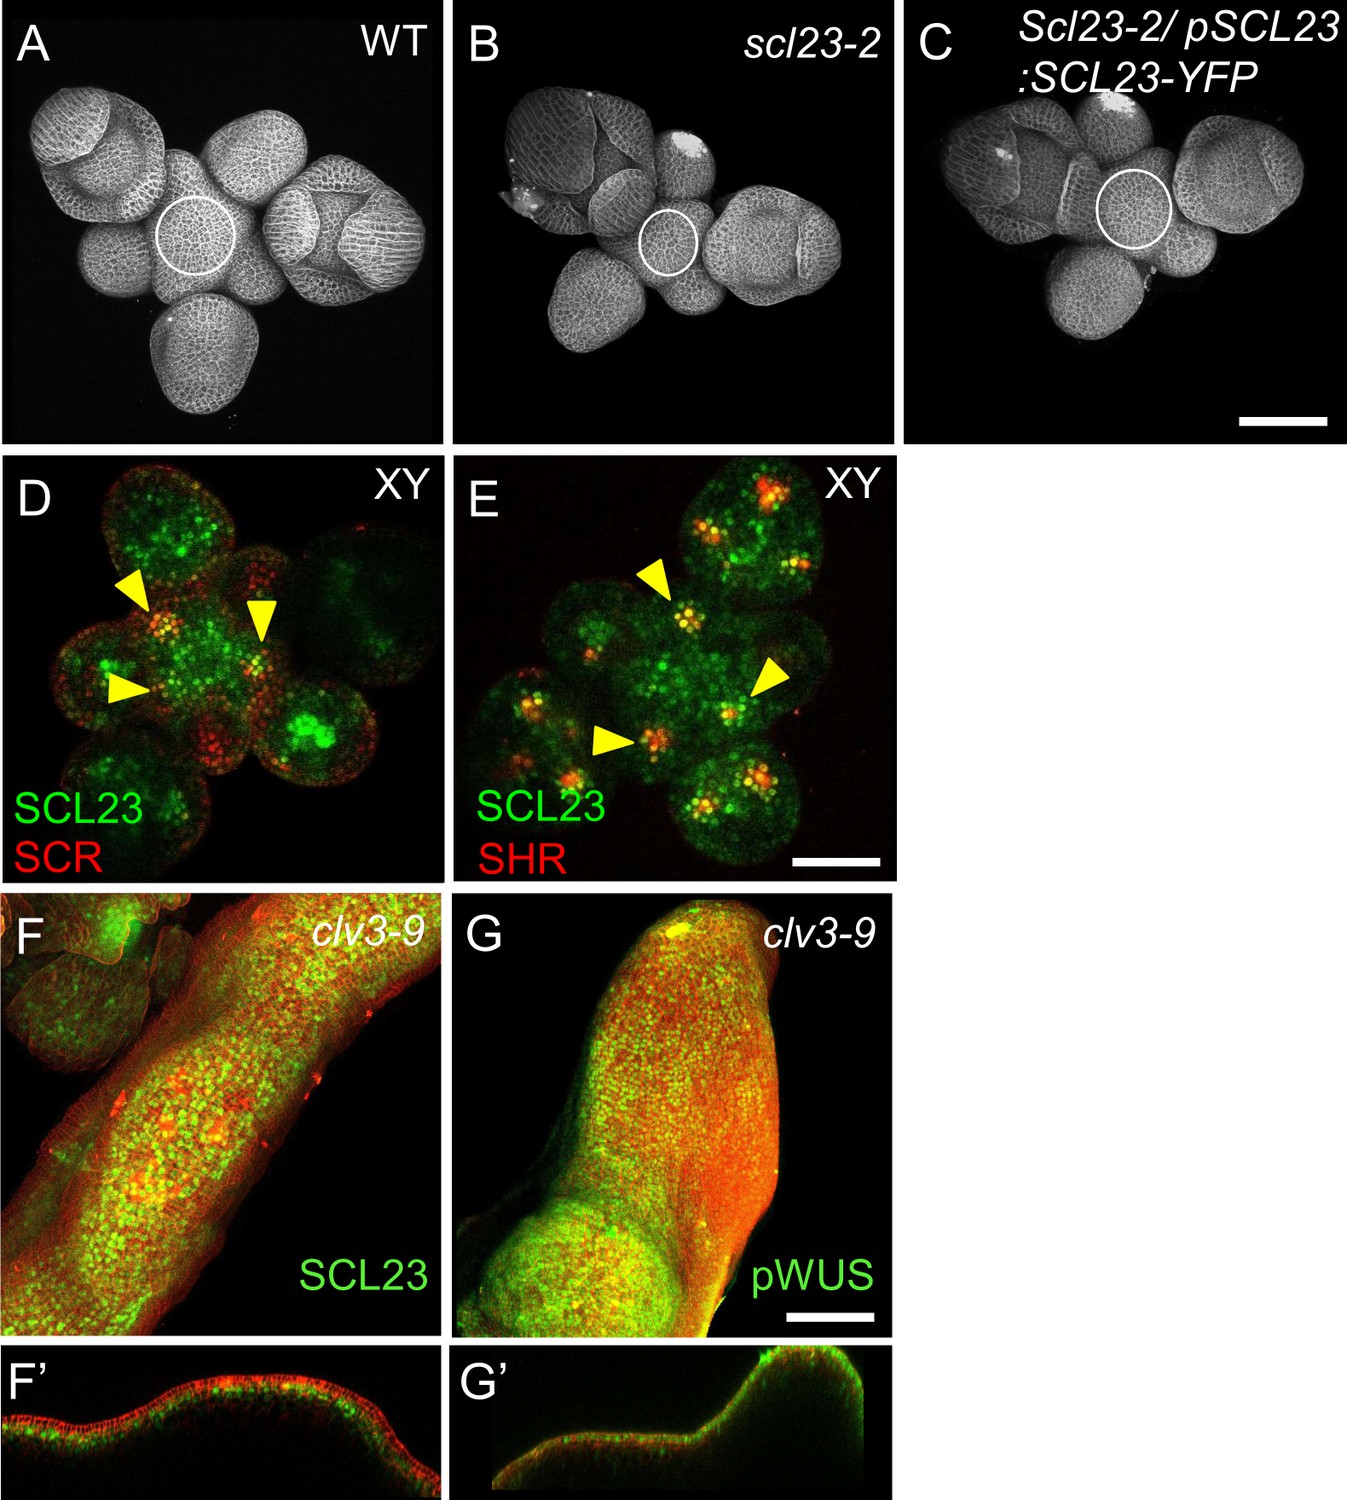
SCL23 and WUS are negatively regulated by the CLV pathway in the shoot apical meristem.
(A–C) Representative 3D projection of shoot apical meristems at 5 weeks after germination from WT (A), scl23-2 mutant (B) and scl23-2/pSCL23:SCL23-YFP (C). Cell walls were stained with PI (gray). Scale bar represents 50 µm. (D and E) Transversal optical sections of shoot apical meristems at 5 weeks after germination meristems coexpressing pSCL23:SCL23-YFP reporter (green) and pSCR:SCR-RFP reporter (red) (n≥3) (D) and pSCL23:SCL23-YFP reporter (green) and pSHR:mScarlet-RFP reporter (red) (n≥3) (E). Yellow arrowheads in (E) indicates the region where both pSCL23:SCL23-YFP reporter (green) and pSHR:mScarlet-SHR reporter (red) expression overlap. Yellow arrowheads in (D) indicates the region where both pSCL23:SCL23-YFP reporter (green) and pSCR:SCR-RFP reporter (red) expression overlap. Scale bar represents 50 µm. Representative 3D projection of shoot apical meristems at 5 weeks after germination expressing pSCL23:SCL23-YFP reporter (green) in clv3-9 mutant (n≥3) (F) and pWUS:3xVenus-NLS reporter (green) in clv3-9 mutant (n≥3) (G). (F’ and G’) Longitudinal optical sections of (F) and (G), respectively. Cell walls were stained with PI (red). Scale bar represents 50 µm.
Figure 5—figure supplement 2

Mutant combinations of shr, scr, and scl23.
(A–H) Top view of 21-day-old rosettes of WT (A), scl23-2 mutant (B), shr-2 mutant (C), scr-3 mutant (D), scr-3 shr-2 double mutant (E), scl23-2 shr-2 double mutant (F), scl23-2 scr-3 double mutant (G), scr-3 shr-2 scl23-2 triple mutant (H). Scale bars represent 1 cm. (A’–H ) Plant phenotypes of 6 weeks old WT (A’), scl23-2 mutant (B’), shr-2 mutant (C’), scr-3 mutant (D’), scr-3 shr-2 double mutant (E’), scl23-2 shr-2 double mutant (F’), scl23-2 scr-3 double mutant (G’), scr-3 shr-2 scl23-2 triple mutant (H’). Scale bars represent: 2 cm (A’ and B’), 1 cm (C’-H’).
Figure 5—figure supplement 3

Overexpression of SHR, SCR, and SCL23 in the SAM.
(A–D) Representative 3D projection of shoot apical meristems at 5 weeks after germination expressing p35S:SHR-GFP reporter (green) (A), p35S:SCR-GFP reporter (green) (B), pUBIQ10:SCL23-mVenus reporter (green) (C) and pRPS5A:SCL23-mVenus reporter (green) (D). Cell walls were stained with PI (red). Scale bar represents 50 µm. (E) Top view of the inflorescence apex coexpressing the p35S:SCR-GFP reporter (green) and the pSCR:SCR-RFP reporter (red). Cell walls were stained with DAPI (gray). Scale bar represents 50 µm.
Figure 5—figure supplement 4
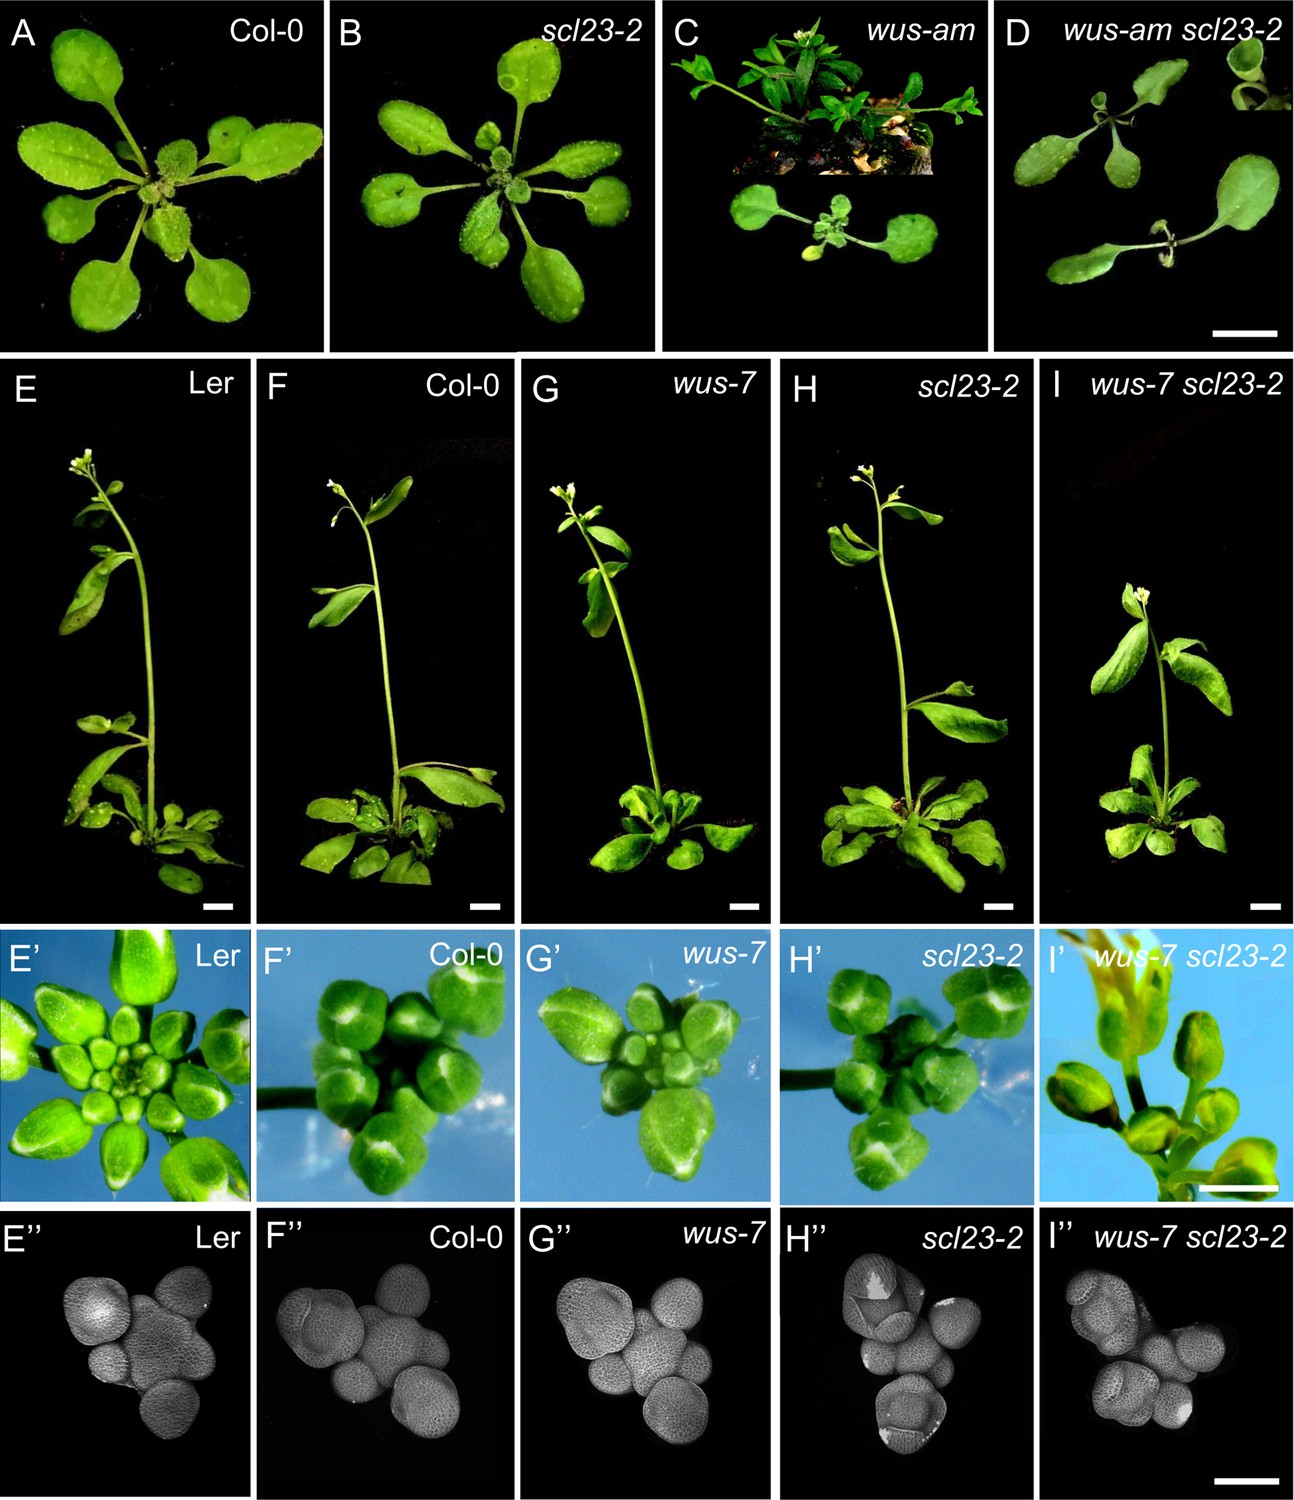
WUS and SCL23 cooperatively control shoot stem cell homeostasis in the shoot apical meristem.
(A–D) Top view of 21-day-old rosettes of Col-0 (A), scl23-2 mutant (B), wus-am mutant (C) and scl23-2 wus-am double mutant (D). Scale bar represents 1 cm. (E–I) plant phenotypes of 36 old L.er (E), Col-0 (F), scl23-2 mutant (G), wus-7 mutant (H) and scl23-2 wus-7 double mutant (I). Scale bars represent 1 cm. (E’–I) Top view of 35-day-old inflorescences of Ler (E’), Col-0 (F’), scl23-2 mutant (G’), wus-7 mutant (H’) and scl23-2 wus-7 double mutant (I’). Scale bar represents 2 mm. (E’’–I) Representative 3D projection of shoot apical meristems at 5 weeks after germination from Ler (E’’), Col-0 (F’’), scl23-2 mutant (G’’), wus-7 mutant (H’’) and scl23-2 wus-7 double mutant (I’’). Cell walls were stained with PI (gray). Scale bar represents 50 µm.
Figure 6 with 1 supplement
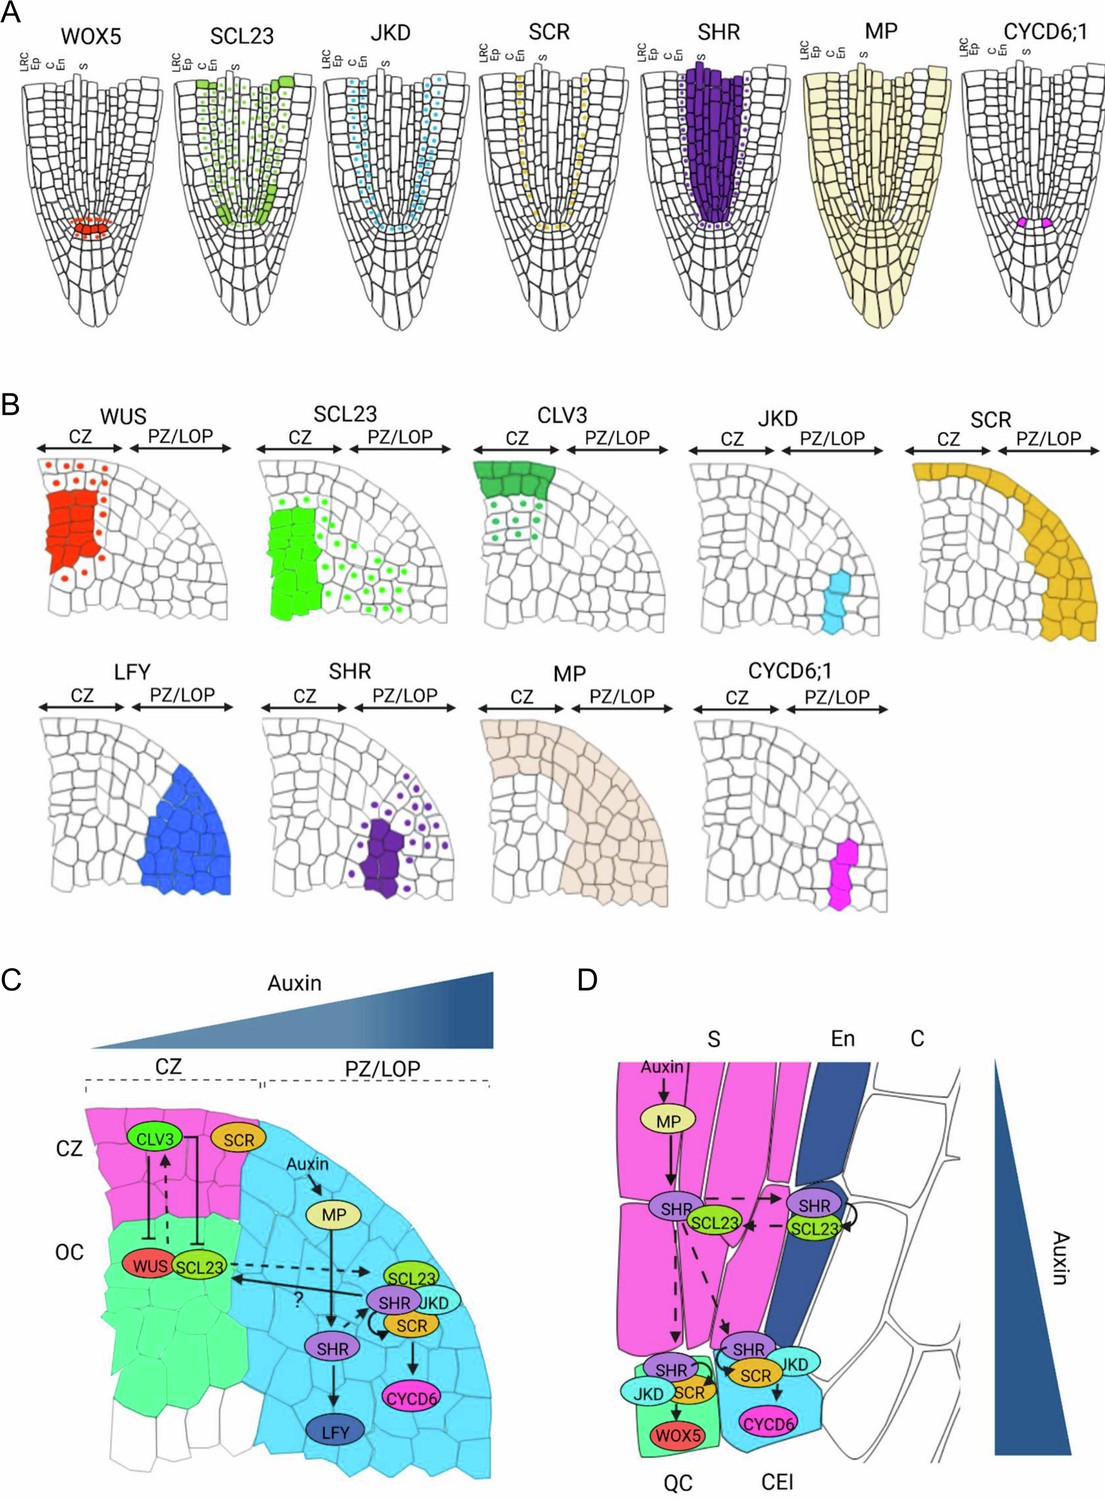
Proposed model for SHR-SCR-SCL23-JKD regulatory network function in the SAM and the RAM.
(A and B) Schematic representation of observed expression patterns of WUS, SCL23, CLV3, JKD, SCR, LFY, SHR, MP and CYCD6;1 in the SAM (A) and WOX5, SCL23, JKD, SCR, SHR MP and CYCD6;1 in the RAM (B). Cells expressing a gene are fully coloured, while presence of mobile proteins is indicated by a coloured nucleus. (C and D) Schematic molecular models for SHR-SCR-SCL23-JKD gene regulatory network function in the SAM (C) and the RAM (D), genes with genetic and/or biochemical interactions are indicated. Lines with arrows depict positive regulation, line with arrows with a question mark depict indirect positive regulation, line with bars depict negative regulation and dashed arrows indicate cell-to-cell movement. Overlap between circles describe protein–protein interactions. (C) SHR transcription is regulated by MP in the PZ/LOP (blue region). In the PZ/LOP, SHR activates SCR transcription. The SHR-SCR-SCL23-JKD protein complex induces periclinal cell division that leads to the outgrowth of lateral organ primordia through the activation of CYCD6;1 expression in the PZ/LOP. SHR also regulates the expression of LFY in the PZ/LOP, leading to lateral organ initiation. In the organizing center (green region), SCL23 interacts with WUS to maintain stem cell homeostasis in the central zone (CZ) (pink region) where CLV3 is expressed. (D) In the RAM, SHR is transcribed in the stele (pink region), and the proteins move outwards to the CEI (blue cell). In the CEI, SHR activates SCR and SCL23 expression, and SHR, SCR and JKD together form a protein complex to induce formative cell divisions via activation of CYCD6;1 expression. High levels of auxin in the CEI also contribute to CYCD6;1 activation. In the QC (green box), the SHR-SCR-JKD protein complex positively regulates expression of WOX5. CZ = Central zone. OC = Organizing center. PZ/LOP = Peripheral zone/lateral organ primordia, CEI = Cortex/endodermis initial, S=Stele. QC = Quiescent center.
Figure 6—figure supplement 1
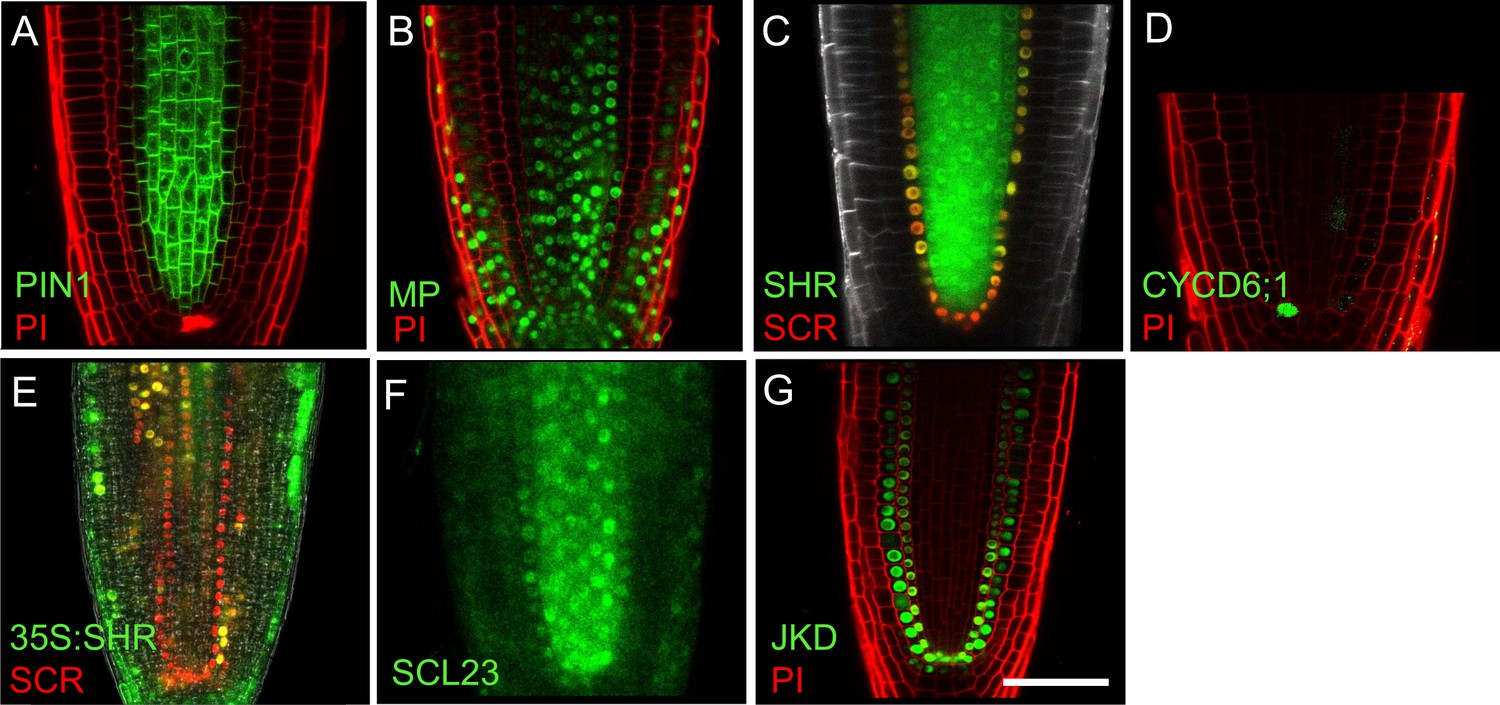
Overlapping expression patterns of PIN1, MP, SHR, SCR, CYCD6;1, SCL23 and JKD in the RAM.
(A–D) Representative images of root apical meristem at 5 days after germination expressing, pPIN1:PIN1-GFP reporter (green) (A), pMP:MP-GFP reporter (green) (B), pSHR:YFP-SHR reporter (green) and pSCR:SCR-RFP reporters (red) (C), pCYCD6;1:GFP reporter (green) (D), p35S:SHR-GFP reporter (green) and pSCR:SCR-RFP reporter (red) (E), pSCL23:SCL23-YFP reporter (green) (F) and pJKD:JKD-YFP reporter (green) (G). Cell walls were stained with PI (red) in (A) (B) (D) (G) or DAPI (gray) in (C). Scale bar represents 50 µm.
Tables
Table 1
Enzymes used in this study.
| Enzyme | Producer |
|---|---|
| BSA1 (ECORI) | Thermo Fisher Scientific, Braunschweig, Germany |
| Pfuµltra High-Fidelity DNA polymerase | Agilent, Santa Clara, USA |
| Phusion High-Fidelity DNA Polymerase | Thermo Fisher Scientific, Braunschweig, Germany |
| T4-Ligase | Thermo Fisher Scientific, Braunschweig, Germany |
| Taq-DNA-Polymerase | Made in the lab according to Pluthero, 1993 |
| Universal SYBR Green Supermix | Bio-Rad |
Table 2
Primers used for cloning.
| Purpose | Primer | Sequence |
|---|---|---|
| SHR promoter cloning | EB-pSHR-F | AAAGGTCTCAACCTGAAGCAGAGCGTGGGGTTTC |
| EB-pSHR-R | TTTGGTCTCATGTTTTTTAATGAATAAGAAAATGAATAGAAGAAAGGGGG | |
| EB-pSHR-BsaI-site-F | GTTCAAAAGTGGTCCCTTCTCTCTC | |
| EB-pSHR-BsaI-site-R | GAGAGAGAAGGGACCACTTTTGAAC | |
| SHR CDS cloning | EB-SHR-CDS-F | AAAGGTCTCAGGCTTAATGGATACTCTCTTTAGACTAGTCAG |
| EB-SHR-CDS-R | TTTGGTCTCACTGACGTTGGCCGCCACGCACTAG | |
| SCR CDS cloning | EB-SCR-CDS-F | AAAGGTCTCAGGCTTAATGGCGGAATCCGGCGATTTC |
| EB-SCR-CDS-R | TTTGGTCTCACTGAAGAACGAGGCGTCCAAGCTGAAG | |
| EB-SCR-CDS-BsaI-site-1-F | GCCATTATCAGGGACCTTATCC | |
| EB-SCR-CDS-BsaI-site-1-R | GGATAAGGTCCCTGATAATGGC | |
| EB-SCR-CDS-BsaI-site-2-F | GAAAATGGTATCTGCGTTTCAG | |
| EB-SCR-CDS-BsaI-site-2-R | CTGAAACGCAGATACCATTTTC | |
| JKD CDS cloning | EB-JKD-CDS-F | AAAGGTCTCAGGCTTAATGCAGATGATTCCAGGAGATCC |
| EB-JKD-CDS-R | TTTGGTCTCACTGAACCCAATGGAGCAAACCTTGCG | |
| EB-JKD-CDS-BsaI-site-F | GCCCTTGGTGACCTCACTGG | |
| EB-JKD-CDS-BsaI-site-R | CCAGTGAGGTCACCAAGGGC | |
| SCL23 CDS cloning | EB-SCL23-F | AAAGGTCTCAGGCTTAATGACTACAAAACGCATAGACAG |
| EB-SCL23-R | TTTGGTCTCACTGAATCGAACGGCTGAGATTTCC | |
| MP CDS cloning | EB-MP-GG-F | AAAGGTCTCAGGCTTAATGATGGCTTCATTGTCTT |
| EB-MP-GG-R | TTTGGTCTCACTGATGAAACAGAAGTCTTAAGATC | |
| pSHR site-directed mutagen-esis | EB-pSHRΔmAuxRE1-F | CTTTGTATCGAGCCAAACGAG |
| EB-pSHRΔmAuxRE1-R | CTCGTTTGGCTCGATACAAAG | |
| EB-pSHRΔmAuxRE2-F | TTCACATGGCTCTATGTTACTATG | |
| EB-pSHRΔmAuxRE1-R | CATAGTAACATAGAGCCATGTGAA | |
| EB-pSHRΔmAuxRE1-2-F | CTTTGTATCGAGCCAAACGAG | |
| EB-pSHRΔmAuxRE1-2-R | CTCGTTGTGCTCGATACAAAG | |
| EB-pSHRΔmAuxRE2-2-F | ATATTCACATGGGAGTATGTTACTATGTAAATG GTG ACC | |
| EB-pSHRΔmAuxRE2-2-R | GGTCACCATTTACATAGTAACATACTCCCATGTGAATAT |
Table 3
Primers used for qRT-PCR.
| Primer name | Sequence |
|---|---|
| EB-RT-SHR-F | GATATCGAGTTTCCGACGGT |
| EB-RT-SHR-R | CGAAGCAAACCCTAAACCAT |
| EB-RT-SCR-F | GTAACCCAAATCTCGGTGCT |
| EB-RT-SCR-R | TTGCTGTTGTGGAGGAGAAG |
| EB-RT-JKD-F | ATCAACCTGGCACTCCAGA |
| EB-RT-JKD-R | GCAGATCTCGCACACGAAT |
| EB-RT-LFY-F | TGATGCTCTCTCCCAAGAAGA |
| EB-RT-LFY-R | CTTGACCTGCGTCCCAGTA |
| EB-SAND-F | AACTCTATGCAGCATTTGATCCACT |
| EB-SAND-R | TGATTGCATATCTTTATCGCCATC |
| EB-TIP41-F | GTGAAAACTGTTGGAGAGAAGCAA |
| EB-TIP41-R | TCAACTGGATACCCTTTCGCA |
Table 4
Primers used for genotyping.
| Primer name | Sequence |
|---|---|
| EB-scl23-2-LP | ATGACTACAAAACGCATAGACAG |
| EB-scl23-2-RP | TTTGGTCTCACTGAATCGAACGGC |
| LBb1.3 | ATTTTGCCGATTTCGGAAC |
| mp-S319-LP | CCTGGAAACTGATGAGCTGAC |
| mp-S319-RP | CCTTCTTCACTCATCTGCTGG |
| LBb1.3 | ATTTTGCCGATTTCGGAAC |
| jkd-4-F | GGATGAAAGCAATGCAAAACA |
| jkd-4-R | AATGTCGGGATGATGAACTCC |
| RB | TCAAACAGGATTTTCGCCTGCT |
| scr-4F | CTGCTTCACCTACTGTATGGG |
| scr-4R | GGGTCAGAGGAAGAGGAAGG |
| Restriction enzyme: Eco57M which should not cut in the mutant | |
| shr-2-R | AAATCGAACTTGCGAATTCCT |
| shr-2-L | CGCTCAACGAGCTCTCTTCT |
| shr-2ins | CAGCAAGACAAGATGGGTCA |
| wus-7-F | CCGACCAAGAAAGCGGCAACA |
| wus-7-R | AGACGTTCTTGCCCTGAATCTTT |
| Restriction enzyme: XmNI which should cut in the mutant |
Table 5
Entry plasmids used in this study.
| Name | Description | Backbone | Reference |
|---|---|---|---|
| pSHR | SHR promoter 2.5 Kb upstream from transcription start | pBlunt | This study |
| SHR CDS | SHR coding sequence | pGGC000 | This study |
| SCL23 CDS | SCL23 coding sequence | pGGC000 | This study |
| linker NLS (pGGD007) | NUCLEAR LOCALIZATION SIGNAL | pGGD000 | Lampropoulos et al., 2013 |
| mVenus (pRD43) | mVenus | pGGD000 | Rebecca Burkhart |
| FLUC | Firefly luciferase | pGGC000 | Greg Denay |
| mVenus (pRD42) | mVenus | pGGC000 | Rebecca Burkhart |
| GUS (pGGC051) | coli ß-GLUCURONIDASE | pGGC000 | Lampropoulos et al., 2013 |
| MP CDS | MP coding sequence | pGGC000 | This study |
| 35 S promoter (pGGA004) | Cauliflower mosaic virus 35 S promoter | pGGA000 | Lampropoulos et al., 2013 |
| RPS5A promoter (pGGA012) | RIBOSOMAL PROTEIN 5 A promoter | pGGA000 | Lampropoulos et al., 2013 |
| UBIQ10 promoter (pGGA006) | UBIQUITIN10 promoter | pGGA000 | Lampropoulos et al., 2013 |
| d-dummy (pGGD002) | d-dummy | pGGD000 | Lampropoulos et al., 2013 |
| tCLV3 | CLV3 terminator 1257 bp downstream of transcription stop | pGGE000 | Jenia Schlegel |
| UBQ10 terminator (pGGE009) | UBQ10 terminator | pGGE000 | Lampropoulos et |
| BastaR (pGGF008) | pNOS:BastaR:tNOS | pGGF000 | Lampropoulos et al., 2013 |
| GR (pRD64) | Hormone-binding domain of the glucocorticoid receptor | pGGD000 | Rebecca Burkhart |
| pCLV3 | CLV3 promoter 1480 bp upstream from transcription start | pGGA000 | Jenia Schlegel |
| mega-element (pGGB002) | Omega- element | pGGB000 | Lampropoulos et al., 2013 |
Table 6
Destination plasmids used in this study.
| Name of construct | Promoter | N-Tag | CDS | C-Tag | Terminator | Resistance |
|---|---|---|---|---|---|---|
| pCLV3:SCL23-mVenus | pCLV3 | Ω- element (pGGB002) | SCL23 CDS | mVenus | tCLV3 | BastaR (pGGF008) |
| pRPS5A:SCL23-mVenus | pRPS5A | Ω- element (pGGB002) | SCL23 CDS | mVenus | tUBQ10 (pGGE009) | BastaR (pGGF008) |
| pUBIQ10:SCL23-mVenus | pUBIQ10 | Ω- element (pGGB002) | SCL23 CDS | mVenus | tUBQ10 (pGGE009) | BastaR (pGGF008) |
| pUBIQ10:MP-GR | pUBIQ10 | Ω- element (pGGB002) | MP CDS | GR | tUBQ10 (pGGE009) | BastaR (pGGF008) |
| p35S:GUS | p35S | Ω- element (pGGB002) | GUS | d-dummy (pGGD002) | tUBQ10 (pGGE009) | BastaR (pGGF008) |
| p35S:MP | p35S | Ω- element (pGGB002) | MP CDS | d-dummy (pGGD002) | tUBQ10 (pGGE009) | BastaR (pGGF008) |
| pSHR:mV-NLS | pSHR | Ω- element (pGGB002) | mVenus | linker NLS (pGGD007) | tUBQ10 (pGGE009) | BastaR (pGGF008) |
| pSHRΔmAuxRE1:mV-NLS | pSHRΔmAuxRE1 | Ω- element (pGGB002) | mVenus | linker NLS (pGGD007) | tUBQ10 (pGGE009) | BastaR (pGGF008) |
| pSHRΔmAuxRE2:mV-NLS | pSHRΔmAuxRE2 | Ω- element (pGGB002) | mVenus | linker NLS (pGGD007) | tUBQ10 (pGGE009) | BastaR (pGGF008) |
| pSHRΔmAuxRE1+2:mV-NLS | pSHRΔmAuxRE1+2 | Ω- element (pGGB002) | mVenus | linker NLS (pGGD007) | tUBQ10 (pGGE009) | BastaR (pGGF008) |
| pSHRΔmAuxRE1-2:mV-NLS | pSHRΔmAuxRE1-2 | Ω- element (pGGB002) | mVenus | linker NLS (pGGD007) | tUBQ10 (pGGE009) | BastaR (pGGF008) |
| pSHRΔmAuxRE2-2:mV-NLS | pSHRΔmAuxRE2-2 | Ω- element (pGGB002) | mVenus | linker NLS (pGGD007) | tUBQ10 (pGGE009) | BastaR (pGGF008) |
| pSHRΔmAuxRE1−2+2–2:mV-NLS | pSHRΔmAuxRE1−2+2–2 | Ω- element (pGGB002) | mVenus | linker NLS (pGGD007) | tUBQ10 (pGGE009) | BastaR (pGGF008) |
Table 7
Destination plasmids used for luciferase assay.
| Name of construct | Promoter | N-Tag | CDS | C-Tag | Terminator | Resistance |
|---|---|---|---|---|---|---|
| pSHR:FLUC | pSHR | Ω- element (pGGB002) | FLUC | d-dummy (pGGD002) | tUBQ10 (pGGE009) | BastaR (pGGF008) |
| pSHRΔmAuxRE1:FLUC | pSHRΔmAuxRE1 | Ω- element (pGGB002) | FLUC | d-dummy (pGGD002) | tUBQ10 (pGGE009) | BastaR (pGGF008) |
| pSHRΔmAuxRE2:FLUC | pSHRΔmAuxRE2 | Ω- element (pGGB002) | FLUC | d-dummy (pGGD002) | tUBQ10 (pGGE009) | BastaR (pGGF008) |
| pSHRΔmAuxRE1+2:FLUC | pSHRΔmAuxRE1+2 | Ω- element (pGGB002) | FLUC | d-dummy (pGGD002) | tUBQ10 (pGGE009) | BastaR (pGGF008) |
| pSHRΔmAuxRE1-2:FLUC | pSHRΔmAuxRE1-2 | Ω- element (pGGB002) | FLUC | d-dummy (pGGD002) | tUBQ10 (pGGE009) | BastaR (pGGF008) |
| pSHRΔmAuxRE2-2:FLUC | pSHRΔmAuxRE2-2 | Ω- element (pGGB002) | FLUC | d-dummy (pGGD002) | tUBQ10 (pGGE009) | BastaR (pGGF008) |
| pSHRΔmAuxRE1−2+2–2:FLUC | pSHRΔmAuxRE1−2+2–2 | Ω- element (pGGB002) | FLUC | d-dummy (pGGD002) | tUBQ10 (pGGE009) | BastaR (pGGF008) |
Table 8
Mutants used in this study.
| Lines | Reference |
|---|---|
| scr-4 | Fukaki et al., 1998 |
| jkd-4 | Welch et al., 2007 |
| scr-3 | Fukaki et al., 1998 |
| shr-2 | Nakajima et al., 2001 |
| scl23-2 | Lee et al., 2008 |
| wus-7 | Graf et al., 2010 |
| wus-am | From Jan lohmann |
| mp-S319 | Schlereth et al., 2010 |
| mp-B4149 | Weijers et al., 2005 |
| lfy-12 | Huala and Sussex, 1992 |
| clv3-9 | Hobe et al., 2003 |
| cycd6;1 | GABI-Kat line (GK-368E07) Sozzani et al., 2010 |
Table 9
Transgenic lines used in this study.
| Lines | Plant Resistance | Reference |
|---|---|---|
| pSHR:mV-NLS | Basta | This study |
| pSHRΔmAuxRE1:mV-NLS | Basta | This study |
| pSHRΔmAuxRE2:mV-NLS | Basta | This study |
| pSHRΔmAuxRE1+2:mV-NLS | Basta | This study |
| pSHRΔmAuxRE1-2:mV-NLS | Basta | This study |
| pSHRΔmAuxRE2-2:mV-NLS | Basta | This study |
| pSHRΔmAuxRE1−2+2–2:mV-NLS | Basta | This study |
| pCLV3:SCL23-mVenus | Basta | This study |
| pRPS5A:SCL23-mVenus | Basta | This study |
| pUBIQ10:SCL23-mVenus | Basta | This study |
| pUBIQ10:MP-GR | Basta | This study |
| PlaCCI | Kanamycin | Desvoyes et al., 2020 |
| pSHR:mScarlet-SHR | - | This study |
| pSHR:YFP-SHR | Basta | Long et al., 2017 |
| pSCR:SCR-RFP | hyg | Long et al., 2017 |
| pSCR:SCR-YFP | basta | Long et al., 2017 |
| pSHR:SHR-YFP | Basta | Long et al., 2017 |
| pJKD:mRFP-YFP | norf | Long et al., 2017 |
| pJKD:JKD-YFP | Basta | Long et al., 2017 |
| pSCL23:SCL23-YFP | Kanamycin | Long et al., 2015a |
| pSCL23:H2B-YFP | Kanamycin | Long et al., 2015a |
| pCYCD6;1:GFP | Basta | Sozzani et al., 2010 |
| pSCR:H2B-YFP | Kanamycin | Heidstra et al., 2004 |
| pPIN1:PIN1-GFP | Kanamycin | Benková et al., 2003 |
| pSHR:nTdTOMATO | - | Möller et al., 2017 |
| pMP:MP-GFP | Kanamycin | Schlereth et al., 2010 |
| pLFY:LFY-GFP | kanamycin | Wu et al., 2003 |
| R2D2 | kanamycin | Liao et al., 2015 |
| pDR5v2:3xYFP-N7 | Basta | Heisler et al., 2005 |
| pWUS:3xVenus-NLS/pCLV3-mCherry-NLS | Kanamycin | Pfeiffer et al., 2016 |
| pCYCD1,1-GFP | - | Forzani et al., 2014 |
| pCYCD3,2-GFP | - | This study |
| pCYCD3,1-GFP | - | This study |
| pCYCD5,1-GFP | - | This study |
| pCYCD7,1-GFP | - | This study |
| pCYCD2,1-GFP | - | This study |
| pCYCD3,3-GFP | - | Forzani et al., 2014 |
| pCYCB1;1:CYCB1;1-GFP | Kanamycin | Ubeda-Tomás et al., 2009 |
Additional files
Download links
A two-part list of links to download the article, or parts of the article, in various formats.
Downloads (link to download the article as PDF)
Open citations (links to open the citations from this article in various online reference manager services)
Cite this article (links to download the citations from this article in formats compatible with various reference manager tools)
The Arabidopsis SHORTROOT network coordinates shoot apical meristem development with auxin-dependent lateral organ initiation
eLife 12:e83334.
https://doi.org/10.7554/eLife.83334


