The entorhinal-DG/CA3 pathway in the medial temporal lobe retains visual working memory of a simple surface feature
- Surgical Neurology Branch, National Institute of Neurological Disorders and Stroke, United States
- Department of Psychology, University of California, Riverside, United States
- Department of Psychology, University of Maryland, United States
- Center for the Neurobiology of Learning and Memory, School of Biological Sciences, University of California, Irvine, United States
- Department of Psychology, University of Nevada, United States
Figures
Figure 1 with 1 supplement
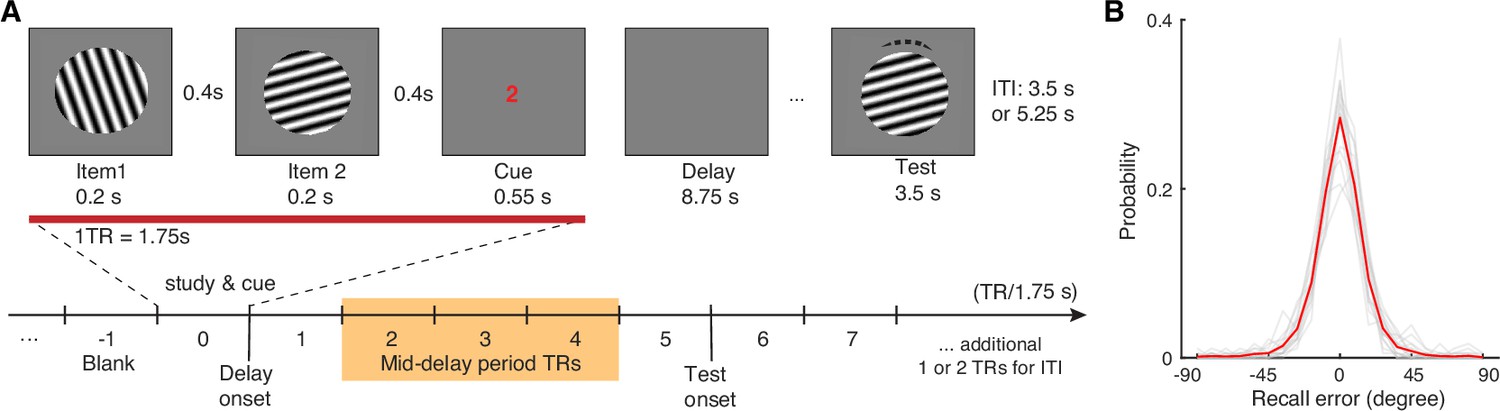
Visual WM task and participants’ task performance.
(A) During fMRI scanning, participants were directed to retain the orientation of a cued grating stimulus from two sequentially presented grating stimuli (item 1 vs 2). After a short retention interval, they tried to reproduce the cued orientation grating as precisely as possible. (B) Participants’ task performance was high and mostly driven by the fidelity of the retained visual WM content. Each gray trace represents a participant’s recall probability in the feature space (−90 to 90 degrees). The red trace represents across-subject average. TR = MR repetition time; ITI = inter-trial interval. The shaded area in (A) highlights the middle 3 TRs of the delay period. See Figure 1—figure supplement 1 for additional details.
Figure 1—figure supplement 1

Behavioral task design and data in the current study across participants.
(A) The cued and uncued items were randomly chosen from the feature space with a constraint that the chosen items on each trial were >20 degrees apart. As a result, the absolute angular distance between the cued and uncued items would also be >20 degrees away with a uniform distribution in a restricted range of angular distance distribution. This task design is helpful to reduce biases in decoding analysis for the cued item (Ester et al., 2015). (B) In the current sample, participants’ responses were close to the cued item, with their recall errors relative to the cued item (i.e. reported item – cued item) centered around 0 degree. By design, this would lead to a dig in the recall error distribution relative to the uncued item (i.e. reported item – uncued item). This data pattern arises due to a randomization procedure of the task. This does not impact our interpretation of the results based on the cued item or the difference score between cued and uncued item across trials, because the relative relationship between cued and uncued items are mostly uniformly distributed across trials (see A). The light gray traces represent each individual participant’s data. The solid red and blue traces represent the means of measures for the cued and uncued items, respectively. The black solid trace represents the mean of the difference between cued and uncued items.
Figure 2 with 2 supplements
The MTL retains item-specific WM information revealed by stimulus-based representational similarity analysis.
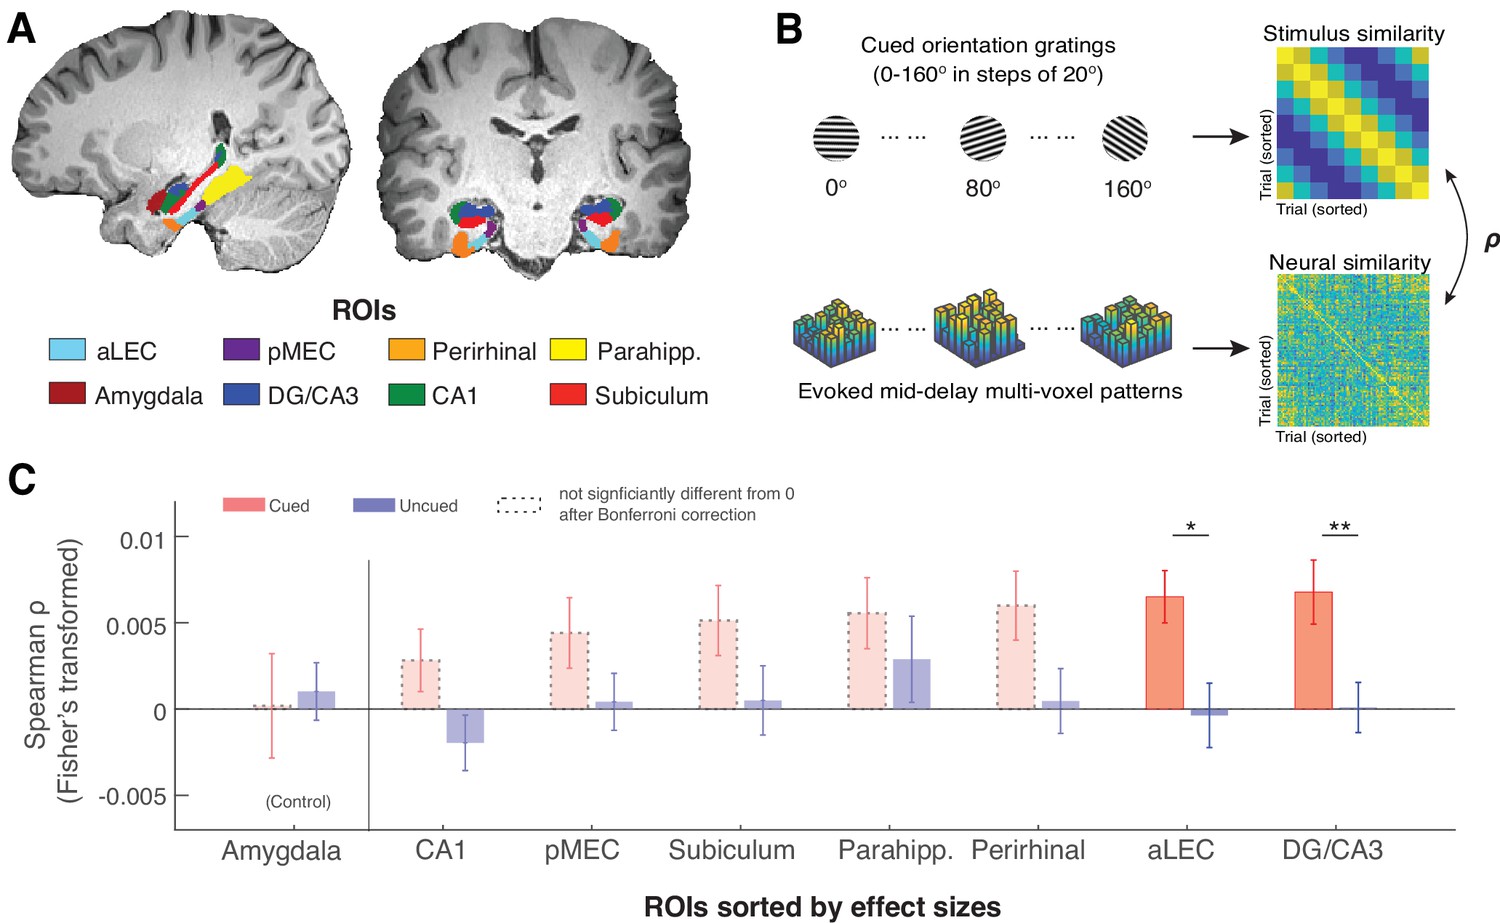
(A) MTL ROIs are parcellated based on previous research (Montchal et al., 2019; Reagh et al., 2017). The amygdala is chosen as an adjacent control region. (B) For each ROI, we examined the extent to which the evoked multi-voxel pattern during the mid-delay period could keep track of the feature values among different WM items. Specifically, we correlated the similarity in evoked neural patterns during the WM delay period separately with the feature similarity of every two cued items and with that of every two uncued items. The rationale is that if a brain region contains item-specific information to allow fine discrimination of different items, the evoked neural patterns should keep track of the feature similarity of these items (Kriegeskorte and Wei, 2021). (C). Across ROIs, we find that this prediction is supported by data from the aLEC and DG/CA3, which show a larger effect size in the association between neural and stimulus similarity patterns based on the cued item as compared with the uncued item. Error bars represent the standard error of the mean (s.e.m.) across participants. *p<0.05 and **p<0.01 for the comparison of the results based on cued versus uncued items; aLEC = anterior-lateral entorhinal cortex; pMEC = posterior-medial entorhinal cortex; parahipp. = parahippocampus. Results from detailed statistical tests are summarized in Supplementary file 1a.
Figure 2—figure supplement 1

Voxel responses in an example ROI (aLEC) for different remembered stimuli from one example subject.
We sorted these voxels based on the magnitude of BOLD response to different orientation stimuli. This analysis only serves illustrative purposes. The reliability of these multi-voxel patterns can be examined based on stimulus-based representational similarity analysis as detailed in the main text.
Figure 2—figure supplement 2

Across-region neural similarity analysis using the combined aLEC-DG/CA3 as an MTL seed region, the superior parietal lobule (SPL) ROI as a benchmark region, and the amygdala as a control region.
(A) Trial-by-trial neural similarity pattern at each TR can be calculated to reflect the representational pattern within a given ROI. The similarity of these neural representational patterns between ROIs, therefore, can inform us whether there is shared variance in the information content represented in different ROIs (Pillet et al., 2019). (B) Because the MTL and SPL both retain information about the cued item (see Figure 3—figure supplement 4), it is expected that their activity patterns evoked by the cued item should be similar to each other, as compared with the similarity between MTL and the amygdala control ROI. (C) We performed the proposed analysis at each TR and normalized the observed neural similarity values using the mean and standard deviation of neural similarity measures at –1 TR across participants. Following this normalization procedure, changes in the neural similarity between ROIs could not be accounted for by intrinsic neural similarity at baseline. This comparison allows us to gauge the extent to which a set of brain regions retains similar information content that is different from the similarity in overall neural signals triggered by the presentation of the same task stimuli (Pillet et al., 2019). We find that the similarity between MTL and SPL activity patterns increases from baseline to WM retention. (D) Critically, this increase is absent in the similarity between MTL and amygdala control ROIs, which is supported by a significant time period (average value in middle 3TRs vs. baseline TR) and ROI (MTL-SPL vs. MTL-Amygdala) interaction effect in neural similarity measures (F(1,15) = 6.38, p<0.05). These results, therefore, suggest that the aLEC-DG/CA3 circuitry in the MTL shares similar information content as that in SPL during WM, which is not simply driven by the similarity of neural signals across regions induced by task stimuli. Error bars represent the standard error of the mean (s.e.m.) across participants. Grey dots in (D) represent data from individual subjects. *p<0.05.
Figure 3 with 6 supplements
The MTL retains item-specific WM information revealed by Inverted Encoding Modeling (IEM).
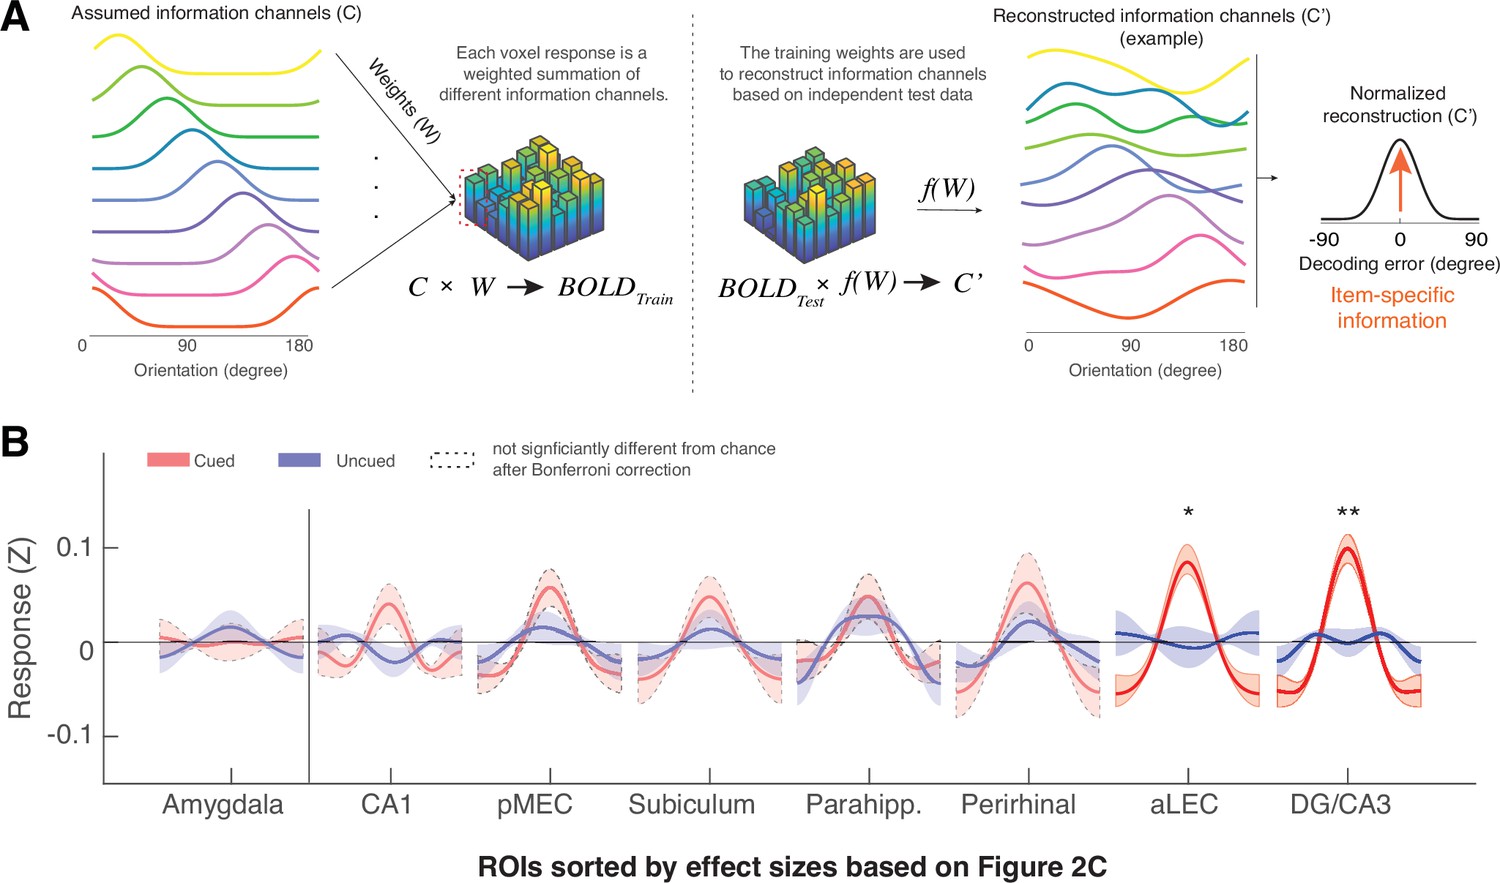
(A) The IEM method assumes that each voxel response in the multi-voxel pattern reflects a weighted summation of different ideal stimulus information channels (C). The weights (W) of these information channels are learned from training data and then applied to independent hold-out test data to reconstruct information channels (C’). After shifting these reconstructed information channels to a common center, the resultant vector length of this normalized channel response reflects the amount of retained information on average (also see Figure 3—figure supplement 1). (B) We find that the BOLD signals from both the aLEC and DG/CA3 contain a significant amount of item-specific information for the cued item, relative to the uncued item. Shaded areas represent the standard error of the mean (s.e.m.) across participants. To retain consistency, we sorted the x-axis (ROIs) based on Figure 2C. *p<0.05 and **p<0.01 for the comparison of the results based on cued versus uncued items; a.u.=arbitrary unit; aLEC = anterior-lateral entorhinal cortex; pMEC = posterior-medial entorhinal cortex; parahipp. = parahippocampus. Results from detailed statistical tests are summarized in Supplementary file 1b.
Figure 3—figure supplement 1
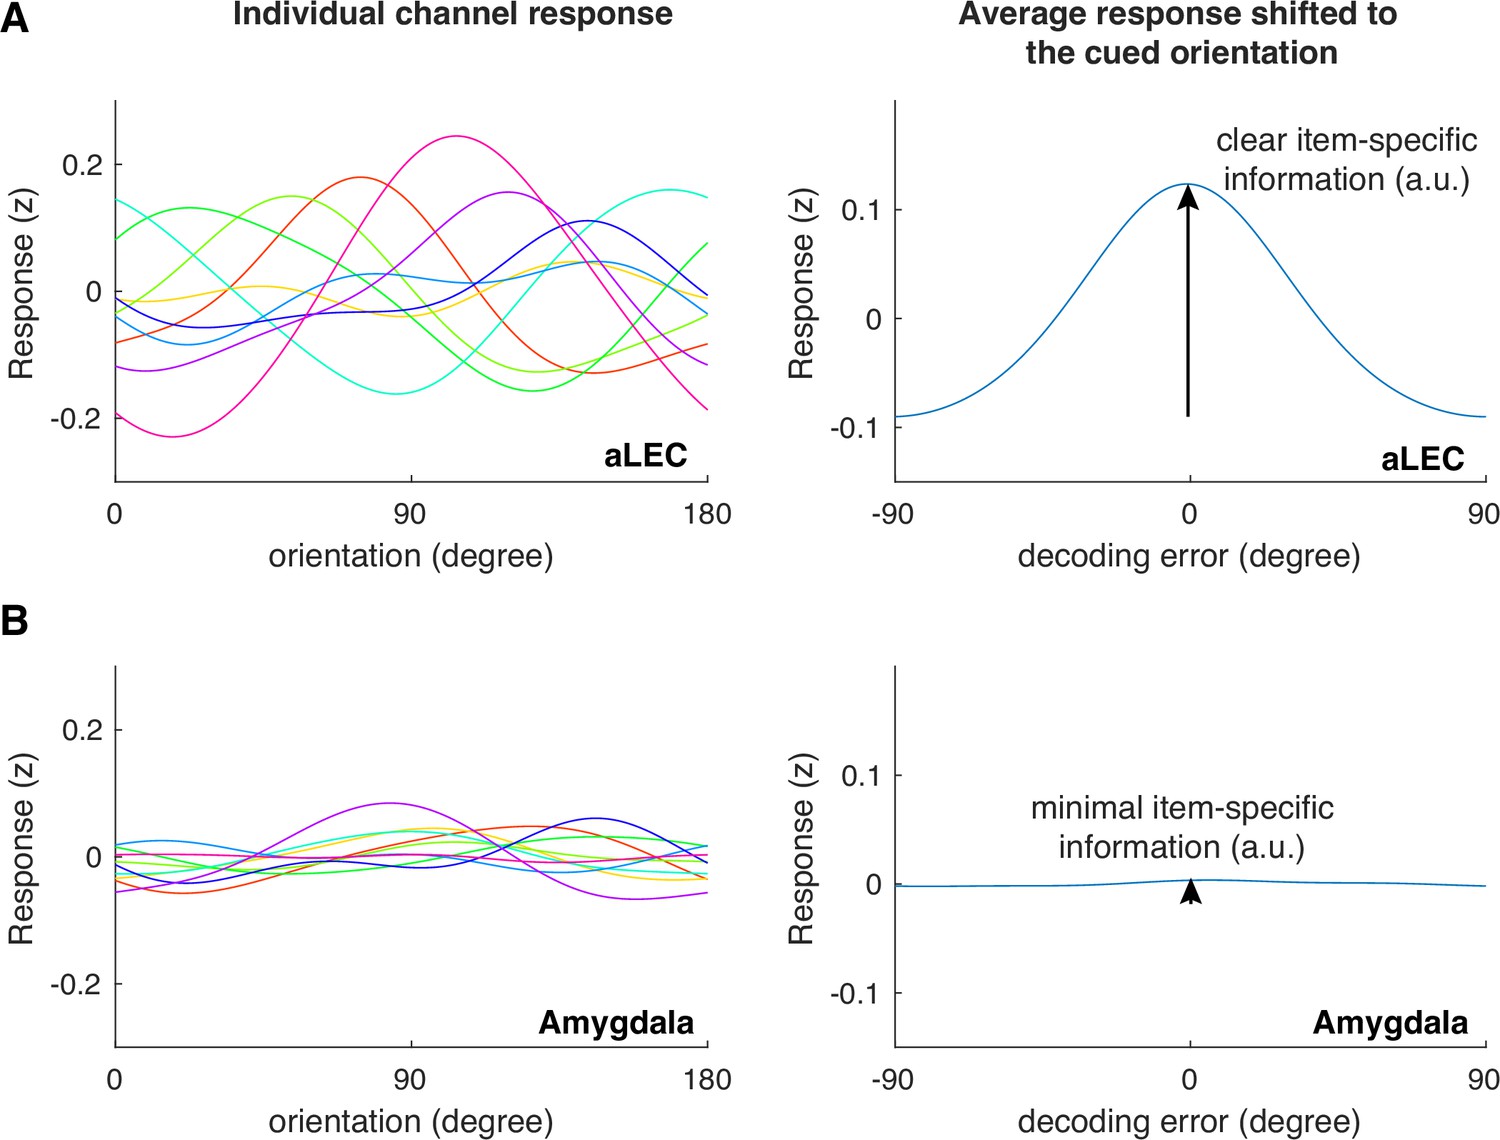
Example channel responses before and after shifting to the cued orientation for aLEC (A) and the amygdala (B).
Based on a level-one-block-out cross-validation approach, we reconstructed the assumed neural channel response model reported in Figure 3B. Before shifting individual channel responses to the cued orientation, it is expected that these tuning responses should show separate peaks across the feature space (left panels). After shifting individual channel responses to the cued orientation, if there is information about the cued orientation assumed by the model, it is expected that the average channel response should peak and center around a 0 degree error (right panels). In cases where information is unrelated to the encoded orientation (e.g. amygdala), the IEM approach is expected to fail to capture and reconstruct meaningful orientation information because the unrelated noise can distort the training weights of the encoding model.
Figure 3—figure supplement 2
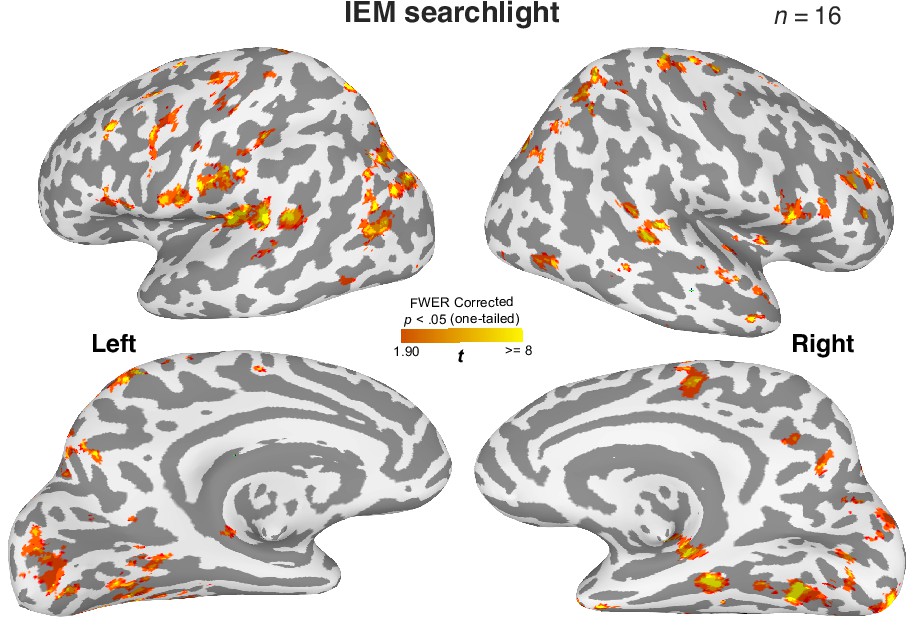
Distributed brain regions retain information about the cued item during WM.
A roving searchlight procedure was combined with the inverted encoding modeling (IEM) to identify brain regions containing item-specific WM content for the cued item (Ester et al., 2015). This analysis shows that distributed brain regions retain decodable item-specific information for the cued orientation, replicating the previous findings (Bettencourt and Xu, 2016; Ester et al., 2015; Harrison and Tong, 2009; Sreenivasan and D’Esposito, 2019). Cluster-based correction for statistical significance: p<0.05 (one-tail) with >400 voxels estimated based on 3dClustSim from AFNI. In this analysis, we have also observed significant clusters of voxels in the MTL. However, this observation is limited to small cortical surface areas. One possibility is that the 8 mm searchlight sphere may have failed to take into account the complex folding structures in the MTL, such that heterogeneous information is included for the decoding analysis. Consequently, the contribution of item-specific WM information in certain MTL voxels can be attenuated. We tested this prediction by aggregating the data from the whole hippocampus across subfields and summarized the findings in Figure 3—figure supplement 4, which supports our prediction.
Figure 3—figure supplement 3

Stimulus-based representational similarity analysis (RSA) and inverted encoding model (IEM) reveal shared item-related variance in the observed neural data.
In both the aLEC and DG/CA3 ROIs, the association between the patterns of the task stimuli and neural responses (RSA) was highly correlated with IEM decoding performance across participants (aLEC: r=0.87, p=0.000012; DG/CA3: r=0.78, p=0.00037), even though these two methods have different assumptions and analytical procedures. This observation suggests that item-specific WM content in MTL regions can be reliably captured by different analytical procedures. The x-axis shows the values of the RSA correlation between trial-by-trial stimulus similarity patterns and observed neural similarity patterns of fMRI BOLD activity. Data on the y-axis reflect the resultant vector length of the normalized reconstructed orientation information channels based on IEM analysis from the same region. Individual points represent the results from individual participants. The solid lines are linear fits of the data, and the dashed lines are 95% confidence intervals of the linear fits.
Figure 3—figure supplement 4

Analyses based on the whole hippocampus, as compared with a benchmark sphere ROI in the posterior parietal cortex (e.g., superior parietal lobule, SPL) and the hippocampal DG/CA3 subfield.
(A) As the posterior parietal cortex has consistently implicated to support visual WM representations (Bettencourt and Xu, 2016; Ester et al., 2015), we identified the local peaks of the bilateral posterior parietal clusters based on the searchlight analysis in Figure 3—figure supplement 2 (MNI coordinate: left, x = –16, y = –64, z=58; Right, x=30, y = –56, z=58) to extract two 8 mm sphere ROIs from the regions. These ROIs fall within the SPL, with their central coordinates close to those from a previous study (Ester et al., 2015) using similar methods (e.g. left, x = –19, y = –63, z=55; right, x=20, y = –58, z=57). For visualization, we plotted one of the spheres in the figure, in combination with the hippocampus (right brain). (B) Raw BOLD signals in each voxel were z-scored over time separated in each block before extracting the trial structures and then averaged for each ROI. Mid-delay 3 TRs are represented by the shaded area in orange. Consistent with the previous observations (Bettencourt and Xu, 2016; Ester et al., 2015; Todd and Marois, 2004), the SPL in the posterior parietal cortex shows robust BOLD modulation during the visual WM task. In contrast, the hippocampus as a whole and its relevant subfield – DG/CA3, do not show the same magnitude of BOLD modulation as the SPL. (C) While both the SPL and DG/CA3 retain precise item-specific information about the cued item relative to the uncued item, the whole hippocampus however does not show this pattern, suggesting that the inclusion of heterogeneous voxels from CA1 and subiculum may affect IEM performance. This is unsurprising because the current IEM analysis did not include additional feature selection procedures, and hence the inclusion of uninformative voxels would make the weights trained from these data less information, compromising the subsequent IEM reconstruction. Error bars or shaded areas represent the standard error of the mean (s.e.m.) across participants. **p.<0.01; a.u.=arbitrary unit.
Figure 3—figure supplement 5
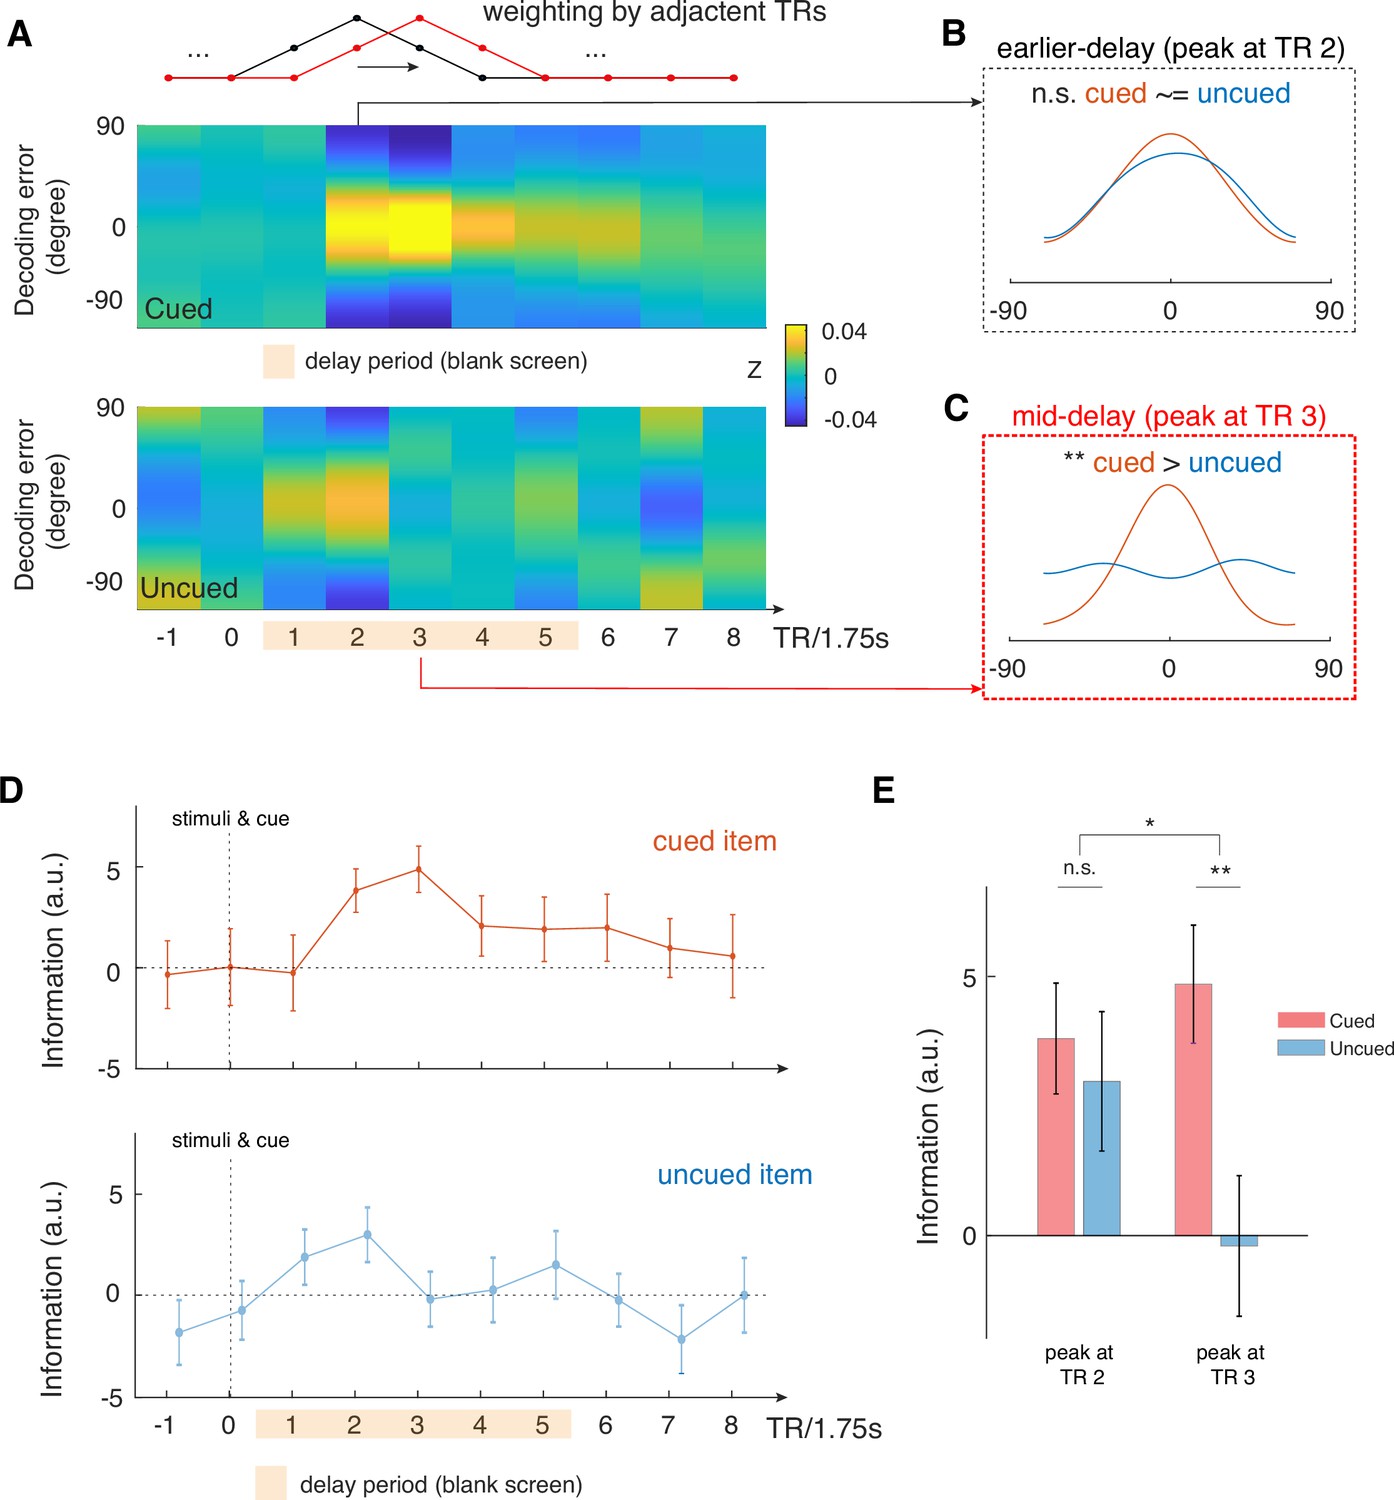
Time-varying IEM analysis shows that mid-delay period activity in aLEC-DG/CA3 contains item-specific information that could not be attributed to perceptual processing alone.
(A) We performed a time-varying IEM analysis for the combined aLEC-DG/CA3 ROI based on raw BOLD signals weighted by adjacent TRs, with a moving window in steps of 1 TR. This analysis was done separately using trial labels of the cued and uncued items. TR 0 contains the presentation of study items and the retro-cue. (B) We find that earlier TR in the delay period (e.g. TR 2) contains information for both the cued and uncued items. (C) Yet, mid-delay period activity (e.g. TR 3,~5.25 s after stimulus offset) contains the most information related to the cued item, but not to the uncued items, suggesting that perceptual processing could not account for these results. (D) Time-varying analysis shows that information related to the cued item increases and peaks at the mid-delay period, with attenuated information throughout the rest of the delay period. In contrast, information related to the uncued item increases after stimulus offset but dissipates afterwards. (E) We observed a significant interaction effect in the reconstructed IEM information between time period (earlier, TR 2 vs. mid-delay, TR 3) and cue condition (cued vs. uncued; F(1, 15)=4.85, p<0.05). These results suggest that there is additional information in the mid-delay activity related to the retrospectively selected item, which could not be accounted for perceptual processing of the presented stimuli. Error bars represent the standard error of the mean (s.e.m.) across participants. *p<0.05; **p<0.01; n.s.=not significant.
Figure 3—figure supplement 6

Modeling results of the hippocampal subfields based on FreeSurfer labels.
In addition to the in-house subfield parcellation, we verified our findings based on the hippocampal subfield labels extracted from each participant’s MRI scan using FreeSurfer 6.0 (https://surfer.nmr.mgh.harvard.edu/fswiki/HippocampalSubfieldsAndNucleiOfAmygdala). In this program, the DG subfield is absorbed by the CA4 label. Despite different quantification methods, our findings of greater item-specific information related to the cued item in the mid-delay TRs remain statistically significant in the DG/CA3 subfield (p<0.001), which is significantly greater than that for the uncued item (p<0.05). In contrast, no significant difference was found for the hippocampal CA1 or subiculum subfield (p’s>0.10). Shaded areas represent the standard error of the mean (s.e.m.) across participants. These results suggest that our observation in the hippocampal DG/CA3 subfield is not limited to a particular subfield parcellation method. *p.<0.05.
Figure 4
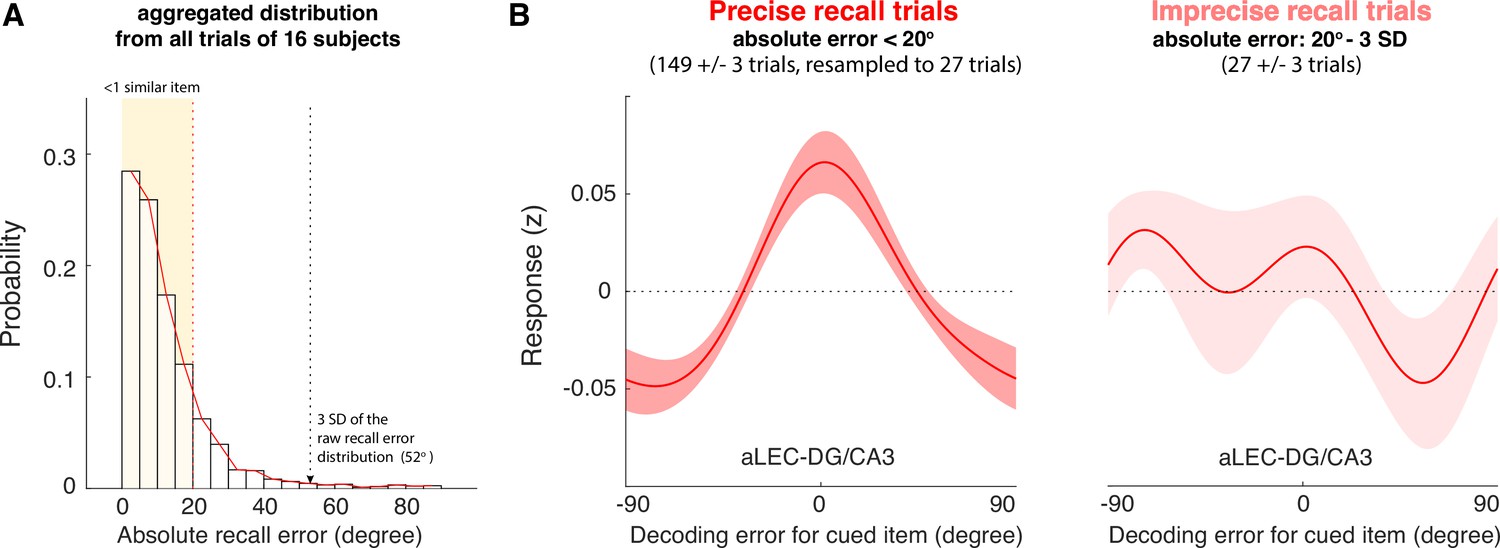
The quality of WM information retained in the aLEC-DG/CA3 pathway is associated with later recall fidelity.
(A) Participants’ performance in the visual WM task is high with most of absolute recall errors falling within the 3 SD of the aggregated recall error distribution. As the angular resolution of the presented orientation grating is at least 20° between any two cued items, for most of the trials, participants’ recall responses are as precise as within one similar item away from the cued item (i.e. absolute recall error <20°). (B) By inspecting the IEM reconstructions for trials with small errors (absolute recall error <20°) and trials with larger errors (absolute recall error: 20° to 3 SD of recall errors), we find that the quality of IEM reconstructions in the combined aLEC-DG/CA3 ROI varies as a function of participants’ recall fidelity. Precise recall trials have yielded better IEM reconstruction quality, even after resampling the same number of trials from the data to control for imbalanced trial counts between small- and larger-error trials. Shaded areas represent the standard error of the mean (s.e.m.) across participants.
Author response image 1
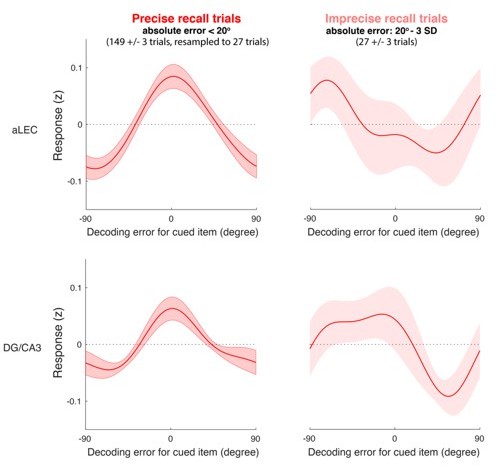
IEM reconstruction based on precise and imprecise recall trials separately for aLEC (top row) and DG/CA3 (bottom row).
Additional files
-
Supplementary file 1
Supporting data tables.
(A) Tests of statistical significance in the neural similarity across trials captured by the similarity of the cued item. (B) Tests of statistical significance in IEM results for the cued item. (C) The number of voxels included for each bilateral ROI in each subject.
- https://cdn.elifesciences.org/articles/83365/elife-83365-supp1-v2.docx
-
MDAR checklist
- https://cdn.elifesciences.org/articles/83365/elife-83365-mdarchecklist1-v2.pdf
Download links
A two-part list of links to download the article, or parts of the article, in various formats.
Downloads (link to download the article as PDF)
Open citations (links to open the citations from this article in various online reference manager services)
Cite this article (links to download the citations from this article in formats compatible with various reference manager tools)
The entorhinal-DG/CA3 pathway in the medial temporal lobe retains visual working memory of a simple surface feature
eLife 12:e83365.
https://doi.org/10.7554/eLife.83365


