Evolutionary divergence in the conformational landscapes of tyrosine vs serine/threonine kinases
- Center for Biophysics and Computational Biology, Temple University, United States
- Department of Chemistry, Temple University, United States
- Department of Physics, Temple University, United States
Figures
Figure 1 with 3 supplements
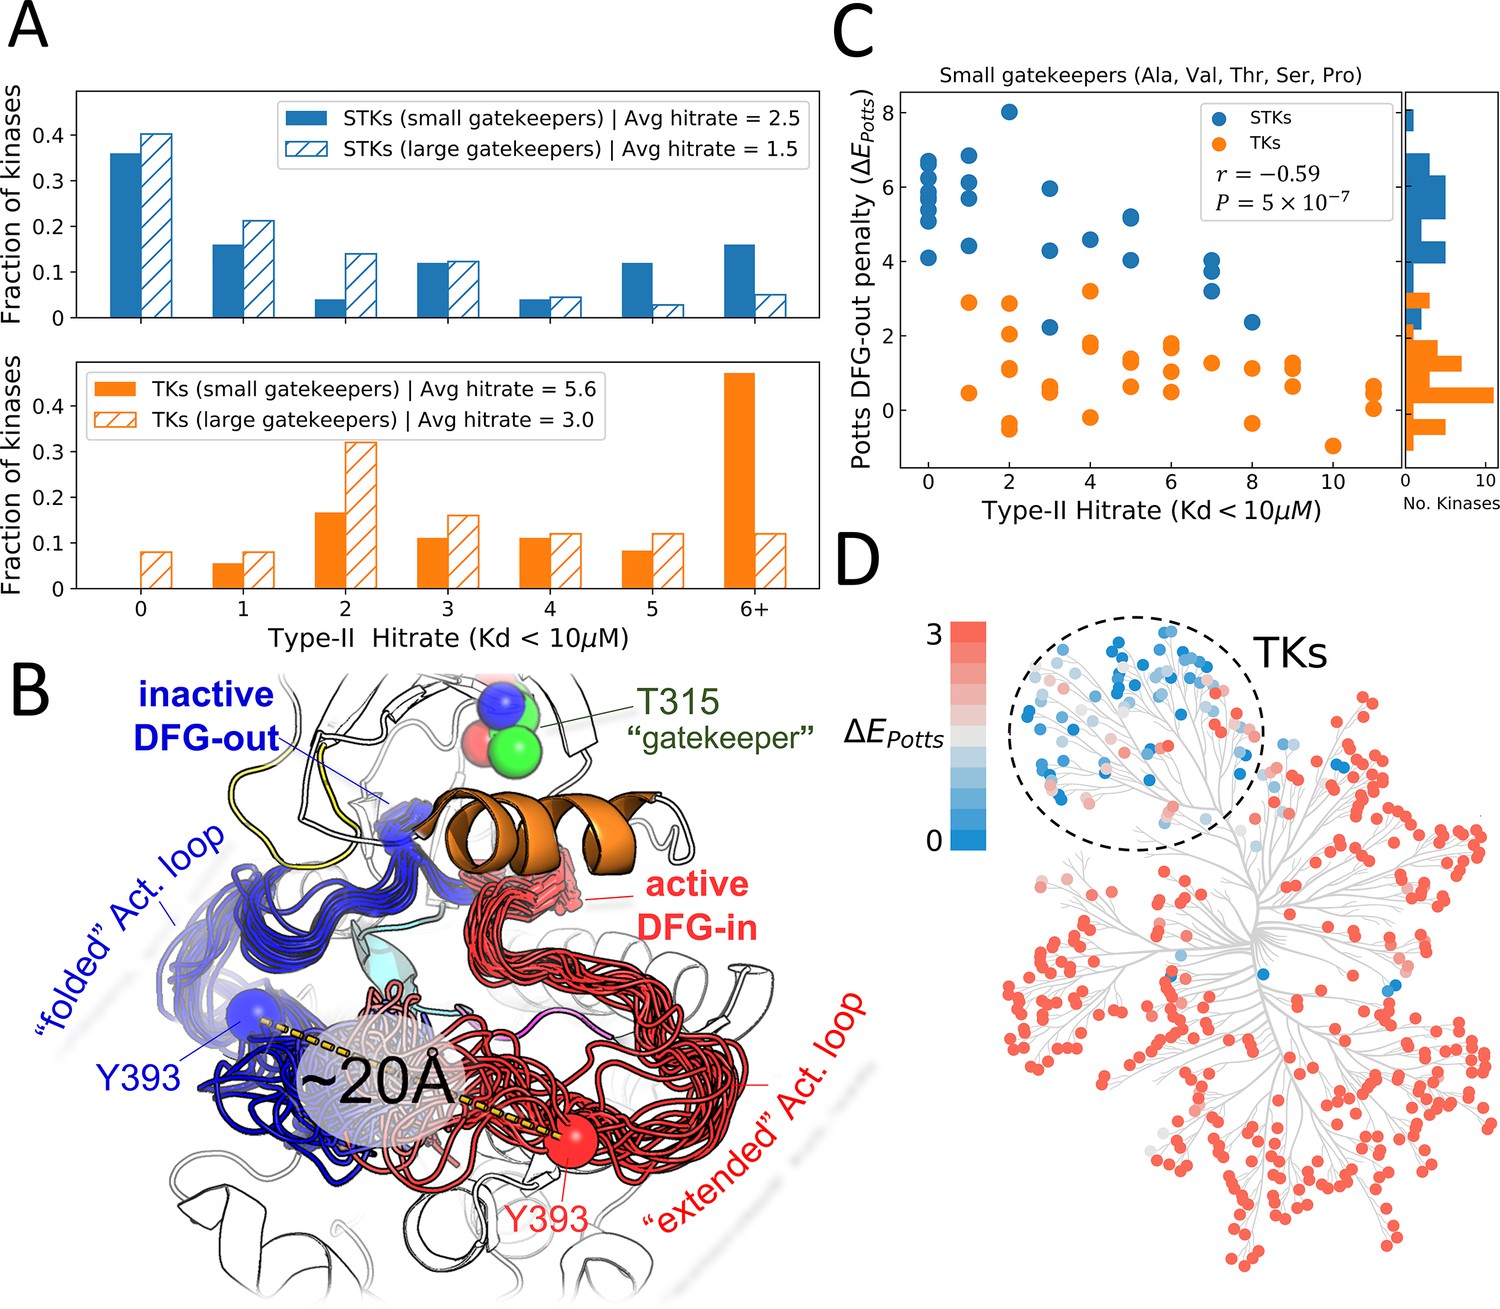
Viewing the conformational landscape of the human kinome.
(A) Hit rate distributions from kinome-wide experimental binding assays with type-II inhibitors for human serine/threonine kinases (STKs; blue, top) and tyrosine kinases (TKs; orange, bottom) with small gatekeepers (solid bars; sidechain volume <110 Å3) and large gatekeepers (hatched bars; sidechain volume >110 Å3). (B) PyMol (pymol, 2015) visualization of two conformational ensembles populated by Abl kinase from recent solution NMR (Nuclear Magnetic Resonance) experiments (Xie et al., 2020). The active DFG-in conformation where the activation loop is ‘extended’ (red, the Protein Data Bank [PDB]: 6XR6) and the inactive classical DFG-out conformation where the activation loop is ‘folded’ (blue, PDB: 6XRG) both exist in the absence of ligands, but there is a free-energy cost to transition between them (Xie et al., 2020). Type-II inhibitors preferentially bind to this folded DFG-out state. (C) Correlation between Potts DFG-out penalty (ΔE Potts) and hit rates for kinases with small gatekeepers only, to control for gatekeeper effects (Pearson correlation of –0.59, p<0.001). (D) Potts DFG-out penalties calculated for the human kinome and plotted using CORAL (Metz et al., 2018); the TK branch appears to have lower penalties relative to the rest of the kinome, which represent STKs. See Figure 1—source data 1 for values of the calculated type-II hit rates and Potts threaded-energy scores over the human kinome.
-
Figure 1—source data 1
Type-II inhibitor hit rates and Potts threaded-energy penalties for DFG-out calculated for tyrosine kinases and serine/threonine kinases from the human kinome.
- https://cdn.elifesciences.org/articles/83368/elife-83368-fig1-data1-v2.csv
Figure 1—figure supplement 1

Conformational landscape of the activation loop derived from the Protein Data Bank (PDB).
(B) Backbone torsions of the first three residues of the activation loop (XDF of the XDFG motif) broadly control folding of the activation loop into autoinhibitory conformations. The XDF dihedral classification (BLAminus, BLBplus, BBAminus, etc.), which informs the positioning of catalytic residues at the activation loop N-terminus, correlates with the spatial trajectory of the first five residues of the activation loop (DFGXXXXX) measured by RMSD (Root Mean Square Deviation) with respect to catalytically primed Aurora A (PDB: 5DNR_A). Plotting the RMSD of the Asp and Phe residues of the DFG motif on the y-axis vs. RMSD of the DFGXXXXX residues on the x-axis captures three major conformational groups – an extended active-like conformation corresponding (circled orange) which is largely represented by the catalytically active BLAminus conformation, a partially folded DFG-in inactive conformation (circled red) which is mostly populated by BLBplus and commonly referred to as Src-like inactive, and the classical, folded DFG-out inactive conformation (circled pink) which is represented by the BBAminus state. (B) Cartoon representation of the three major conformational clusters created in PyMol.
Figure 1—figure supplement 2
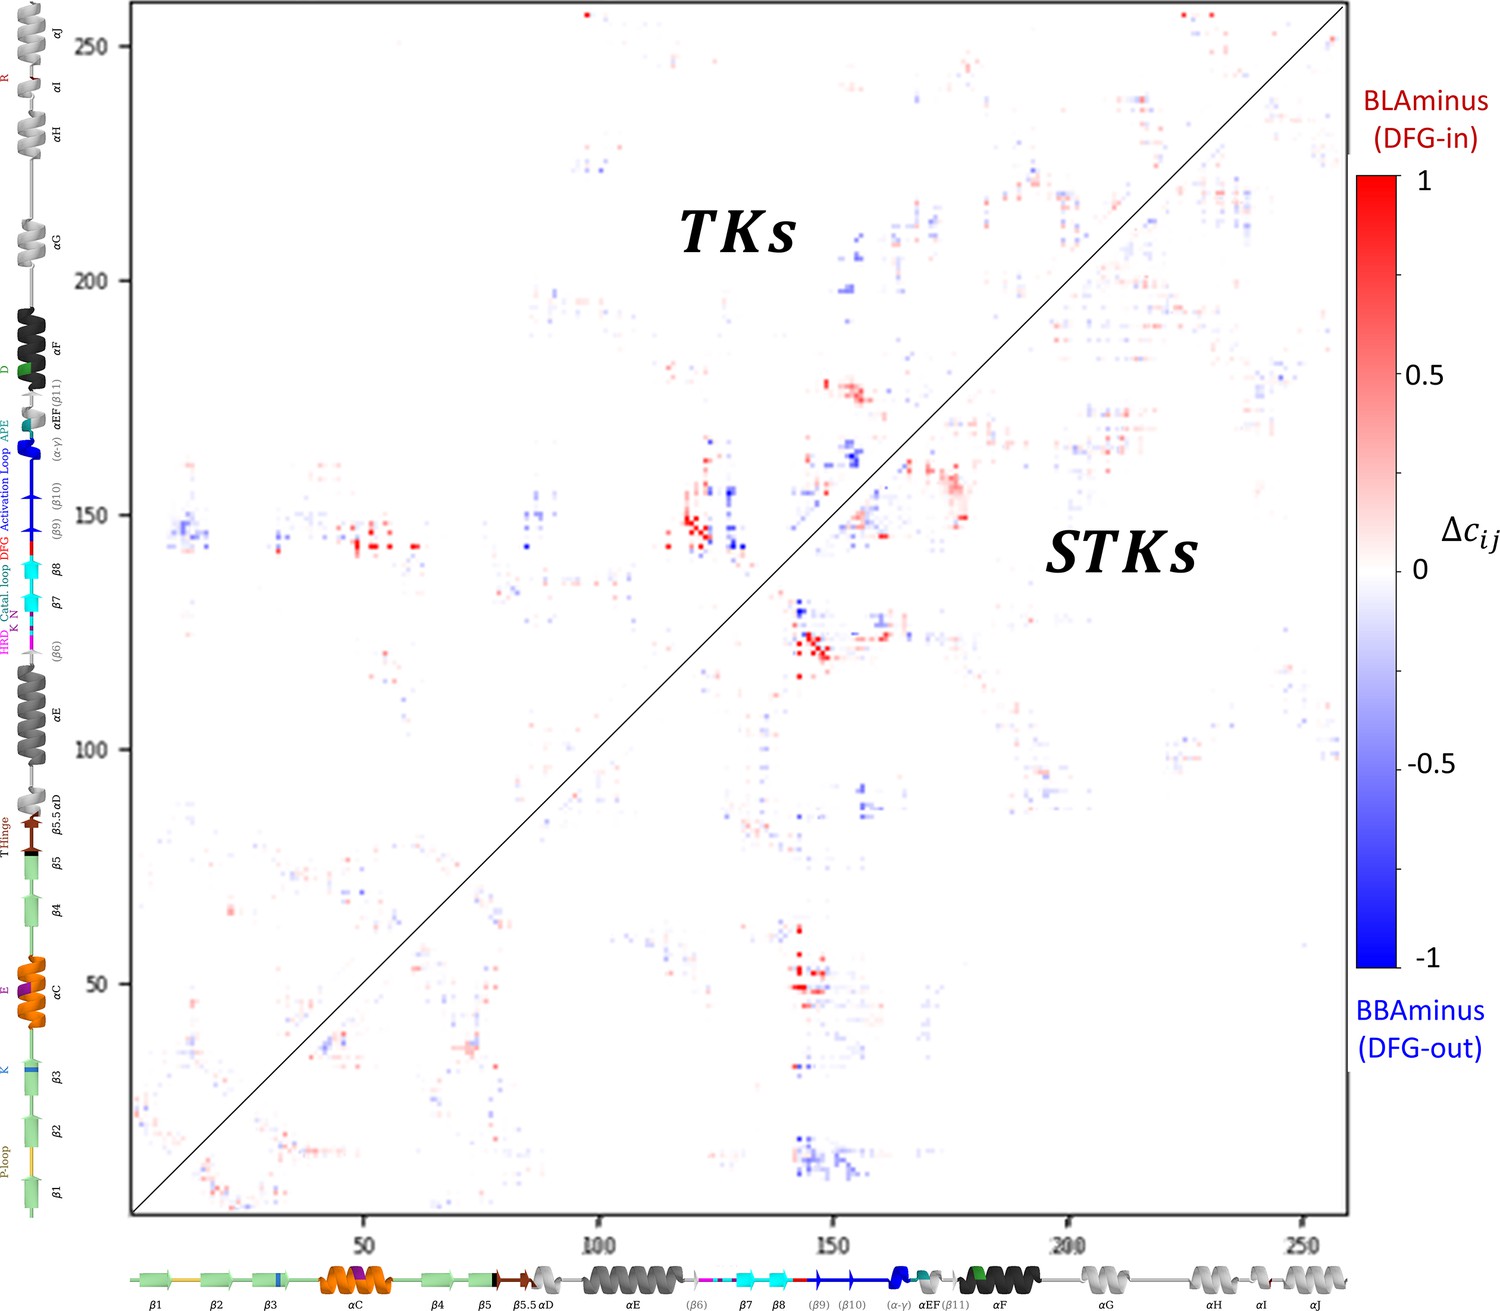
Contact frequency differences between the active DFG-in (BLAminus) and classical DFG-out (BBAminus) conformations.
The contact frequency differences are explicitly involved in the calculation of ΔE Potts (see Methods). The upper triangle depicts the contact frequency difference matrix for kinases annotated in the Protein Data Bank as ‘tyrosine kinases (TKs)’, meanwhile the lower triangle was calculated from kinases annotated as ‘serine/threonine kinases (STKs)’.
Figure 1—figure supplement 3
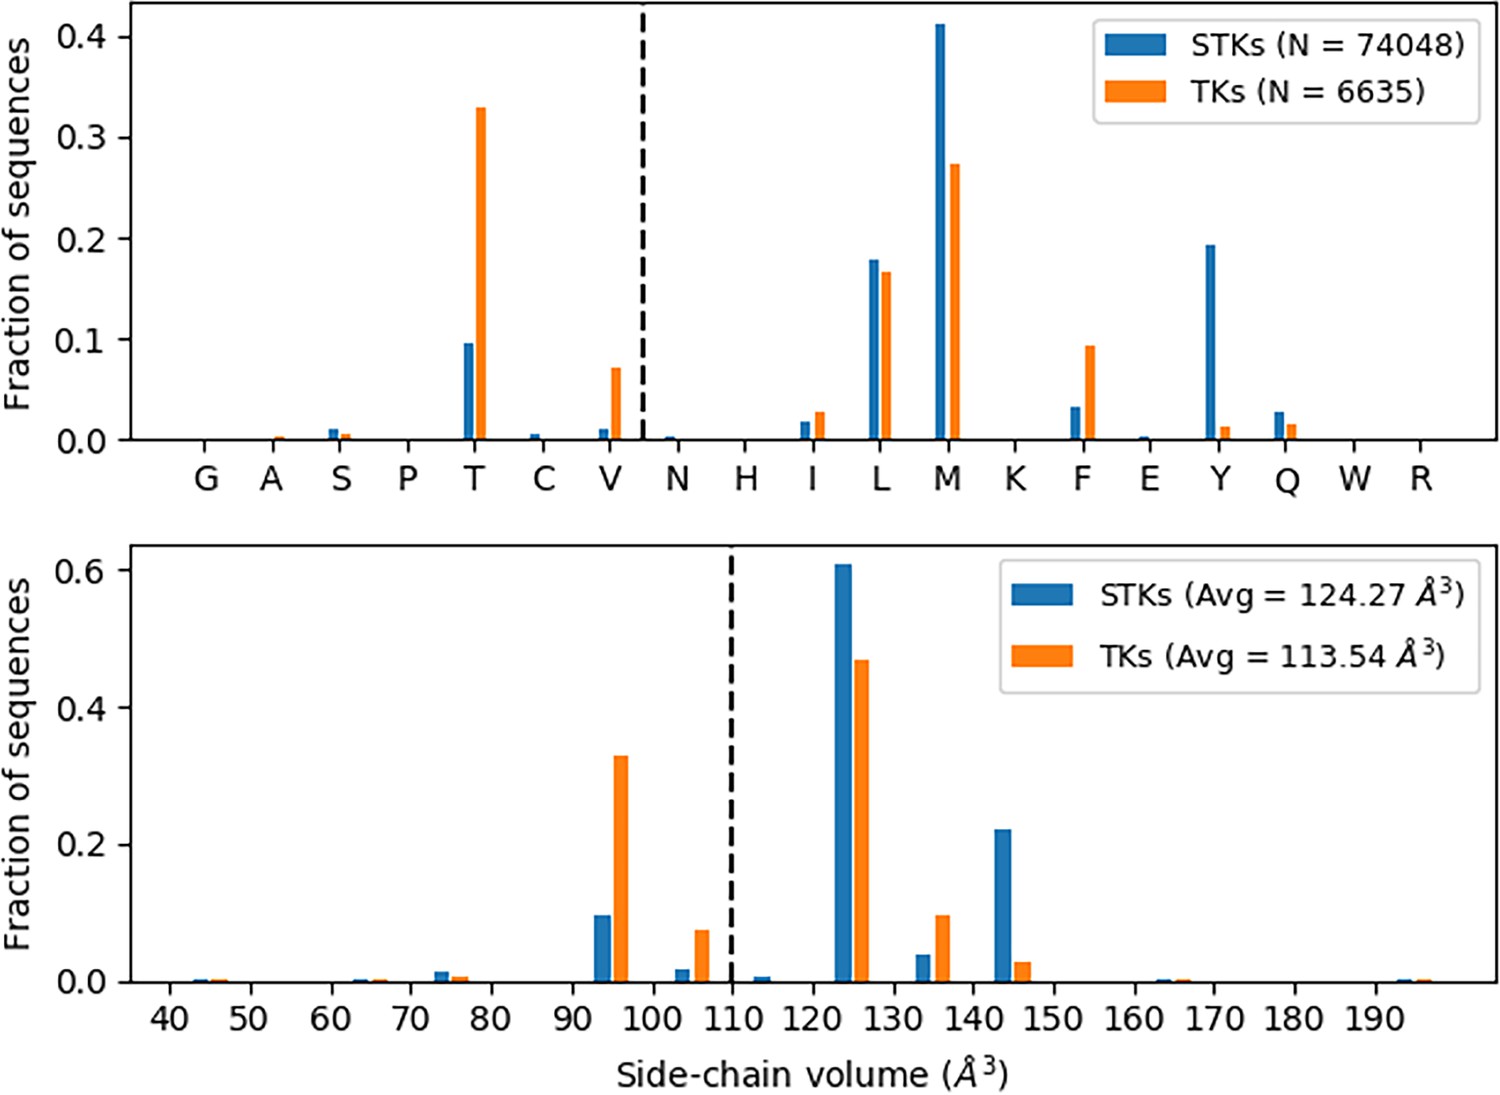
Gatekeeper analysis.
Thousands of serine/threonine kinase (STK) and tyrosine kinase (TK) sequences (see legend) were analyzed to determine the identities of the gatekeeper residues. Distribution of gatekeeper residues (top) with bins ordered (left to right) according to increasing sidechain volume shows that STKs tend to have Met as a gatekeeper, whereas TKs tend to have Thr. Alternatively, one can look at the distribution of gatekeepers in terms of sidechain volume (bottom) which shows TKs have a greater tendency toward small gatekeepers in comparison with STKs.
Figure 2 with 1 supplement
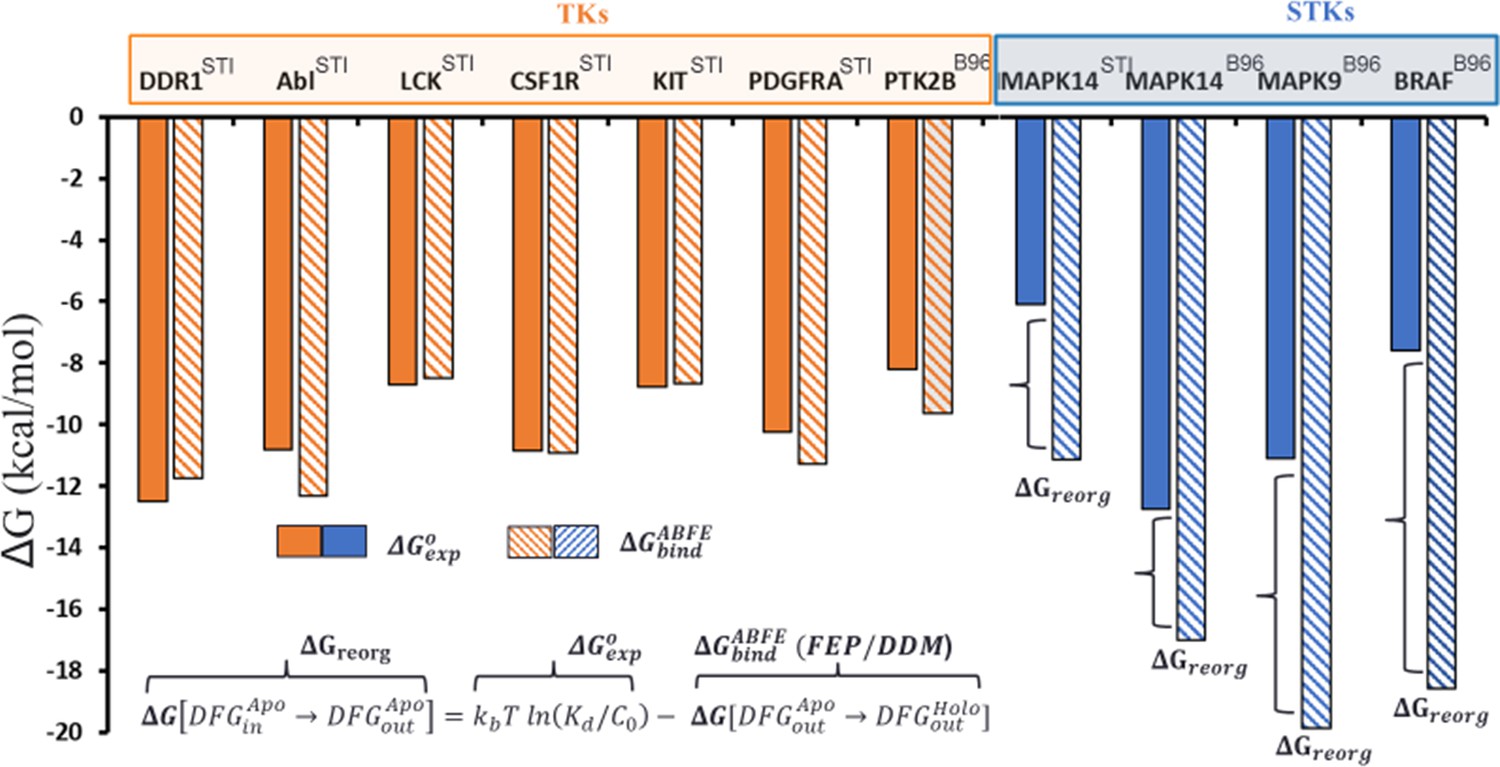
Overview of the conformational landscapes between serine/threonine kinases (STKs) and tyrosine kinases (TKs) from absolute binding free-energy simulations, where we compare ΔGbind (hatched bars) from binding free-energy simulations with ΔGexp (solid bars) for the type-II inhibitors imatinib (the Protein Data Bank [PDB] code: STI) and BIRB-976 (PDB code: B96) vs several TKs (orange) and STKs (blue).
-
Figure 2—source data 1
Absolute binding free-energy results for kinases bound to imatinib and BIRB-796.
- https://cdn.elifesciences.org/articles/83368/elife-83368-fig2-data1-v2.csv
Figure 2—figure supplement 1
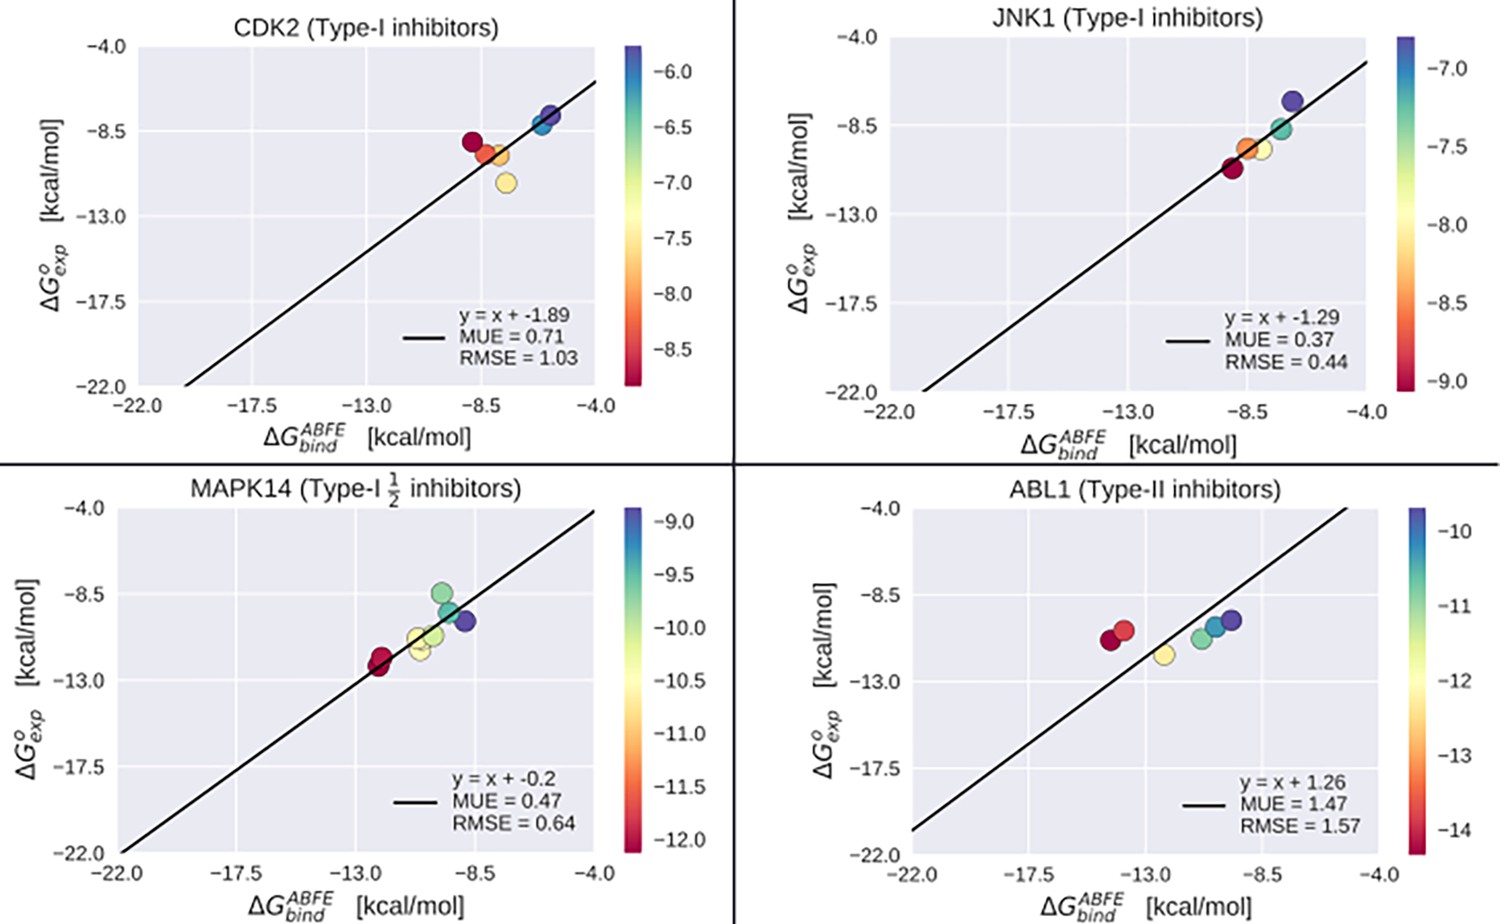
Absolute binding free-energy (ABFE) benchmarking results.
Benchmarking the ABFE results over 26 different co-crystallized inhibitors bound to CDK2, JNK1, MAPK14 in the active state, and ABL1 in the inactive state. Mean unsigned error (MUE) and root mean square error (RMSE) were calculated with respect to the linear model where the intercept of the best-fit regression corresponds to the average difference between ABFE and experiment, and the slope is constrained to one.
Figure 3 with 1 supplement
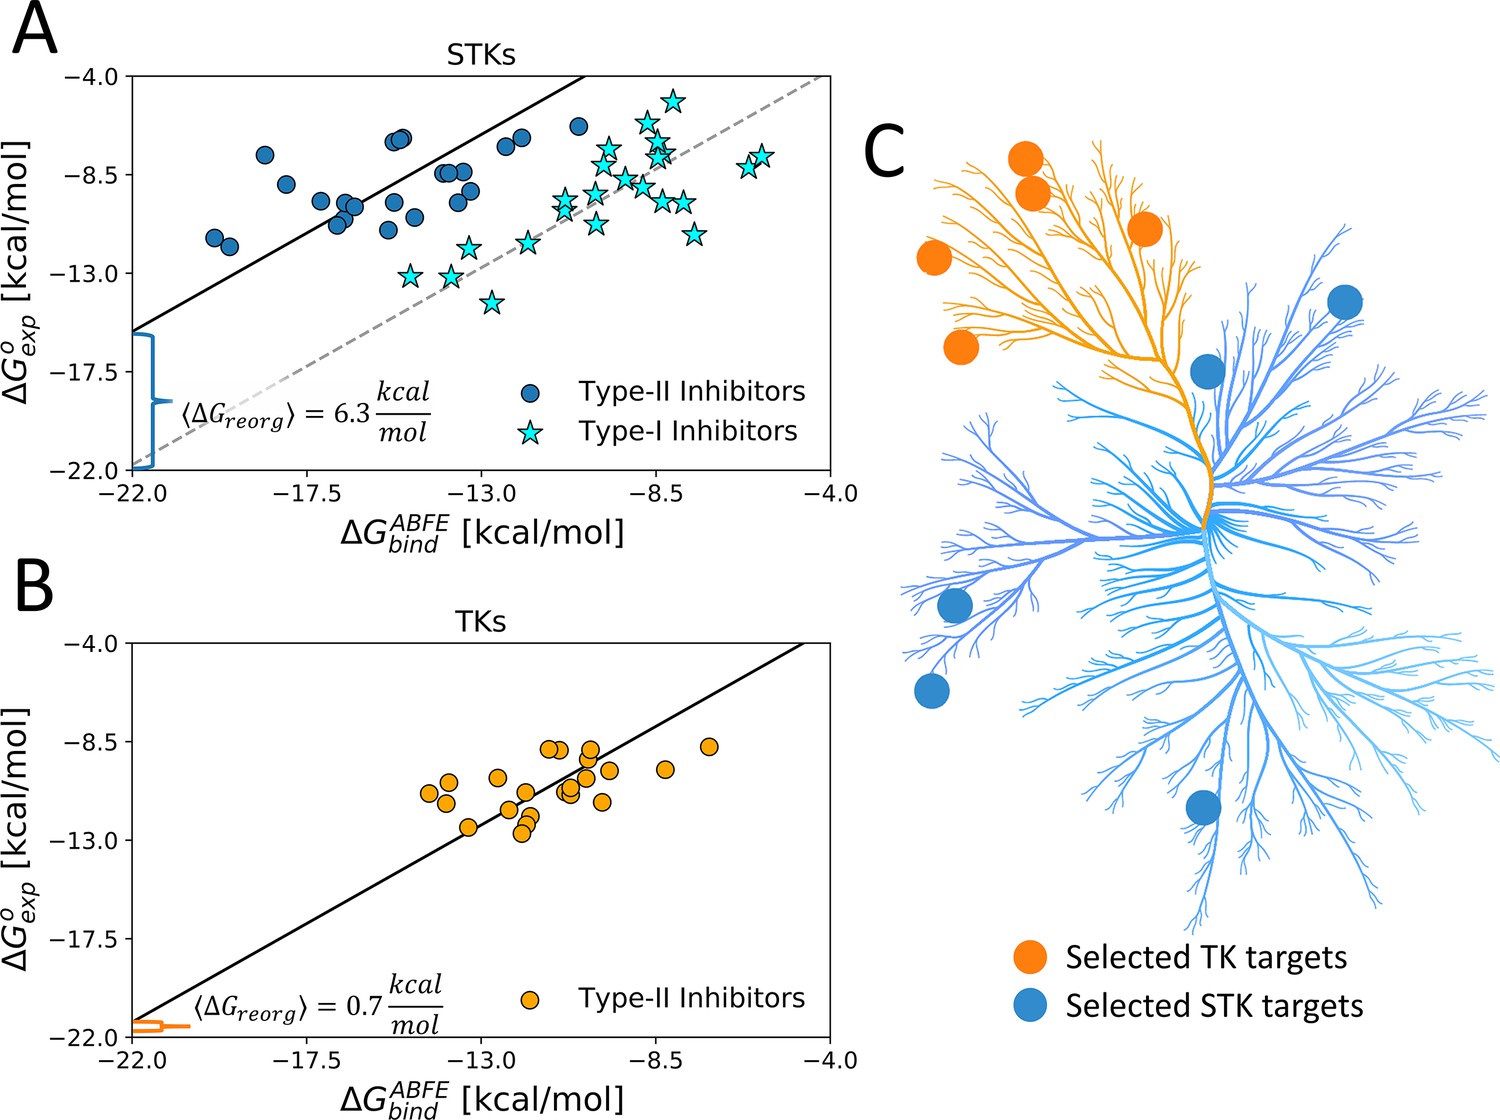
Using type-II inhibitors as tools to probe the conformational landscape of TKs and STKs.
(A) The average ΔGreorg calculated via absolute binding free-energy (ABFE) simulations with 23 type-I (stars) and 23 type-II inhibitors (circles) complexes in the active DFG-in and inactive DFG-out state, respectively, computed from five serine/threonine kinase (STK) targets (Table 1) and (B) computed with 22 type-II inhibitors vs five tyrosine kinase (TK) targets in the DFG-out state (Table 1). (C) Kinome plot created with CORAL (Metz et al., 2018) illustrating the selection of five TKs and five STKs which are detailed in Table 1.
-
Figure 3—source data 1
Absolute binding free-energy results for five tyrosine kinases and five serine/threonine kinases bound to type-II and type-I inhibitors.
- https://cdn.elifesciences.org/articles/83368/elife-83368-fig3-data1-v2.csv
Figure 3—figure supplement 1
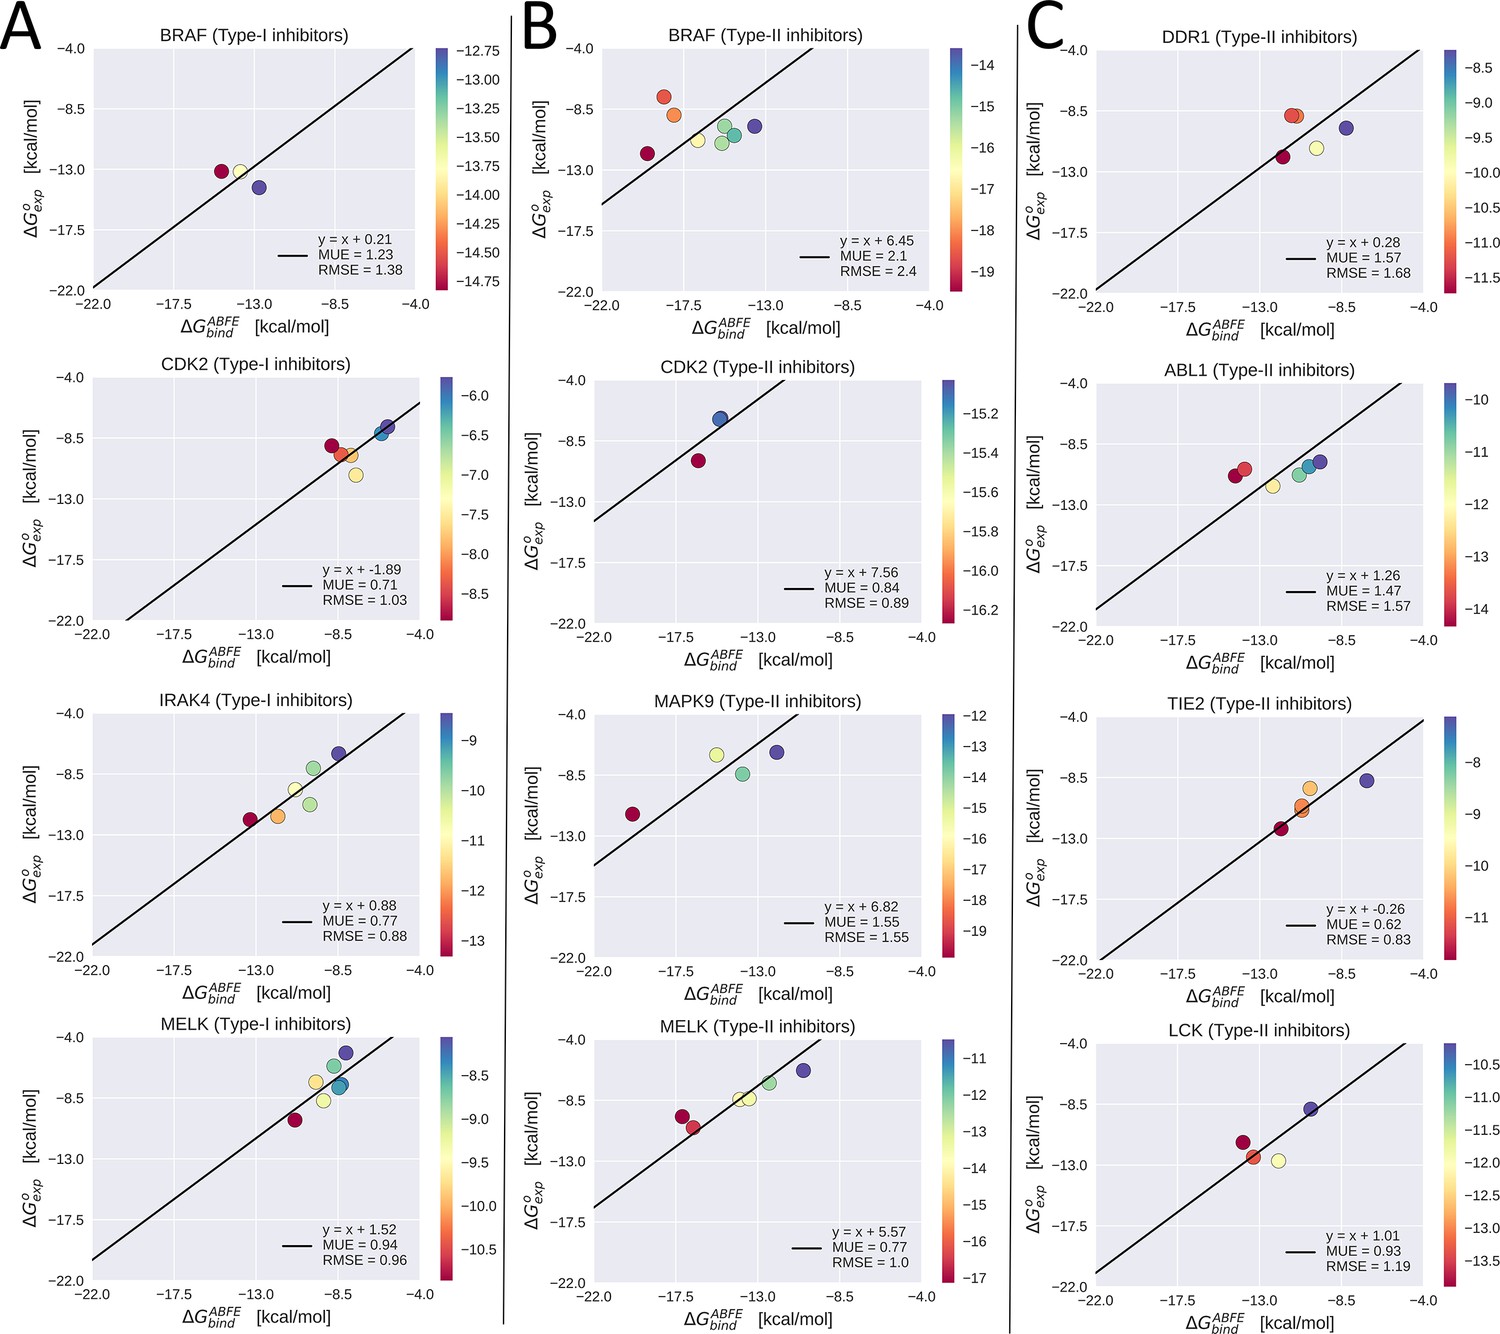
Experimental binding free-energy vs calculated absolute binding free-energy for type-I inhibitors vs serine/threonine kinases (STKs; column A), type-II inhibitors vs STKs (column B), and type-II inhibitors vs tyrosine kinases (TKs; column C).
The linear regression of the data with the slope constrained to one is plotted, which gives the reorganization free energy as the intercept of this line (see legend). Mean unsigned error (MUE) and root mean square error (RMSE) were calculated with respect to this linear model.
Figure 4

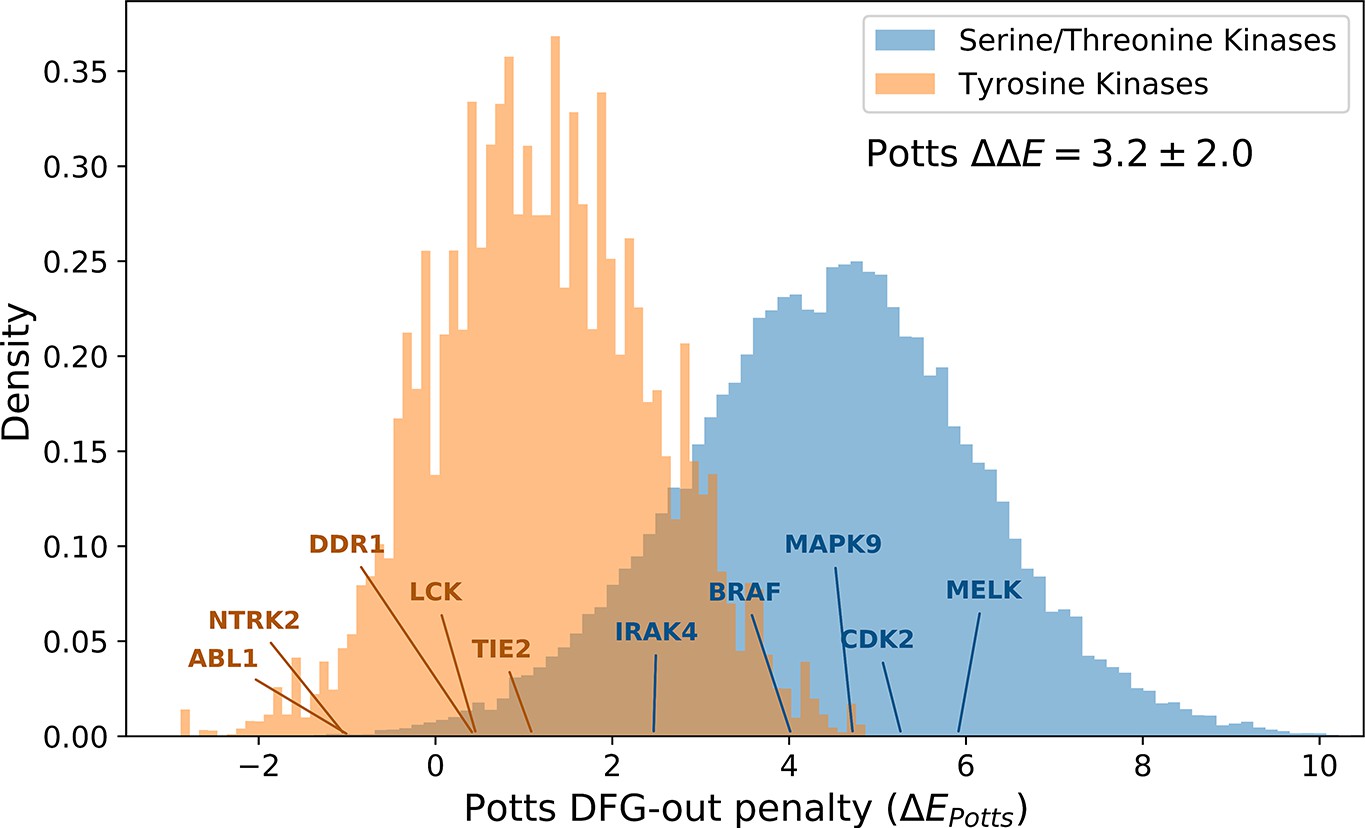
Correlation between ΔEPotts and averaged calculations of ΔGreorg for five tyrosine kinases (TKs) and five serine/threonine kinases (STKs; Table 1).
Figure 5
The distributions of Potts conformational penalties for (orange) 10,345 tyrosine kinases (TKs) from 471 different species and (blue) 210,862 serine/threonine kinases (STKs) from 2713 different species, showing that TKs tend to have smaller energetic penalties on average.
The difference in averages between these distributions is shown (), which we estimate to be ≈4.3 kcal/mol based on the analysis in Figure 4. The probability density was plotted after down-weighting each sequence by the number of times another sequence in the same class (e.g. TKs) is observed within 40% identity (see Methods for details). The effective number of TKs (Neff =1,096) and STKs (Neff =22,893) s the sum totals of their down-weights, which is an unbiased measure of the sequence diversity in each probability distribution.
Figure 6 with 2 supplements
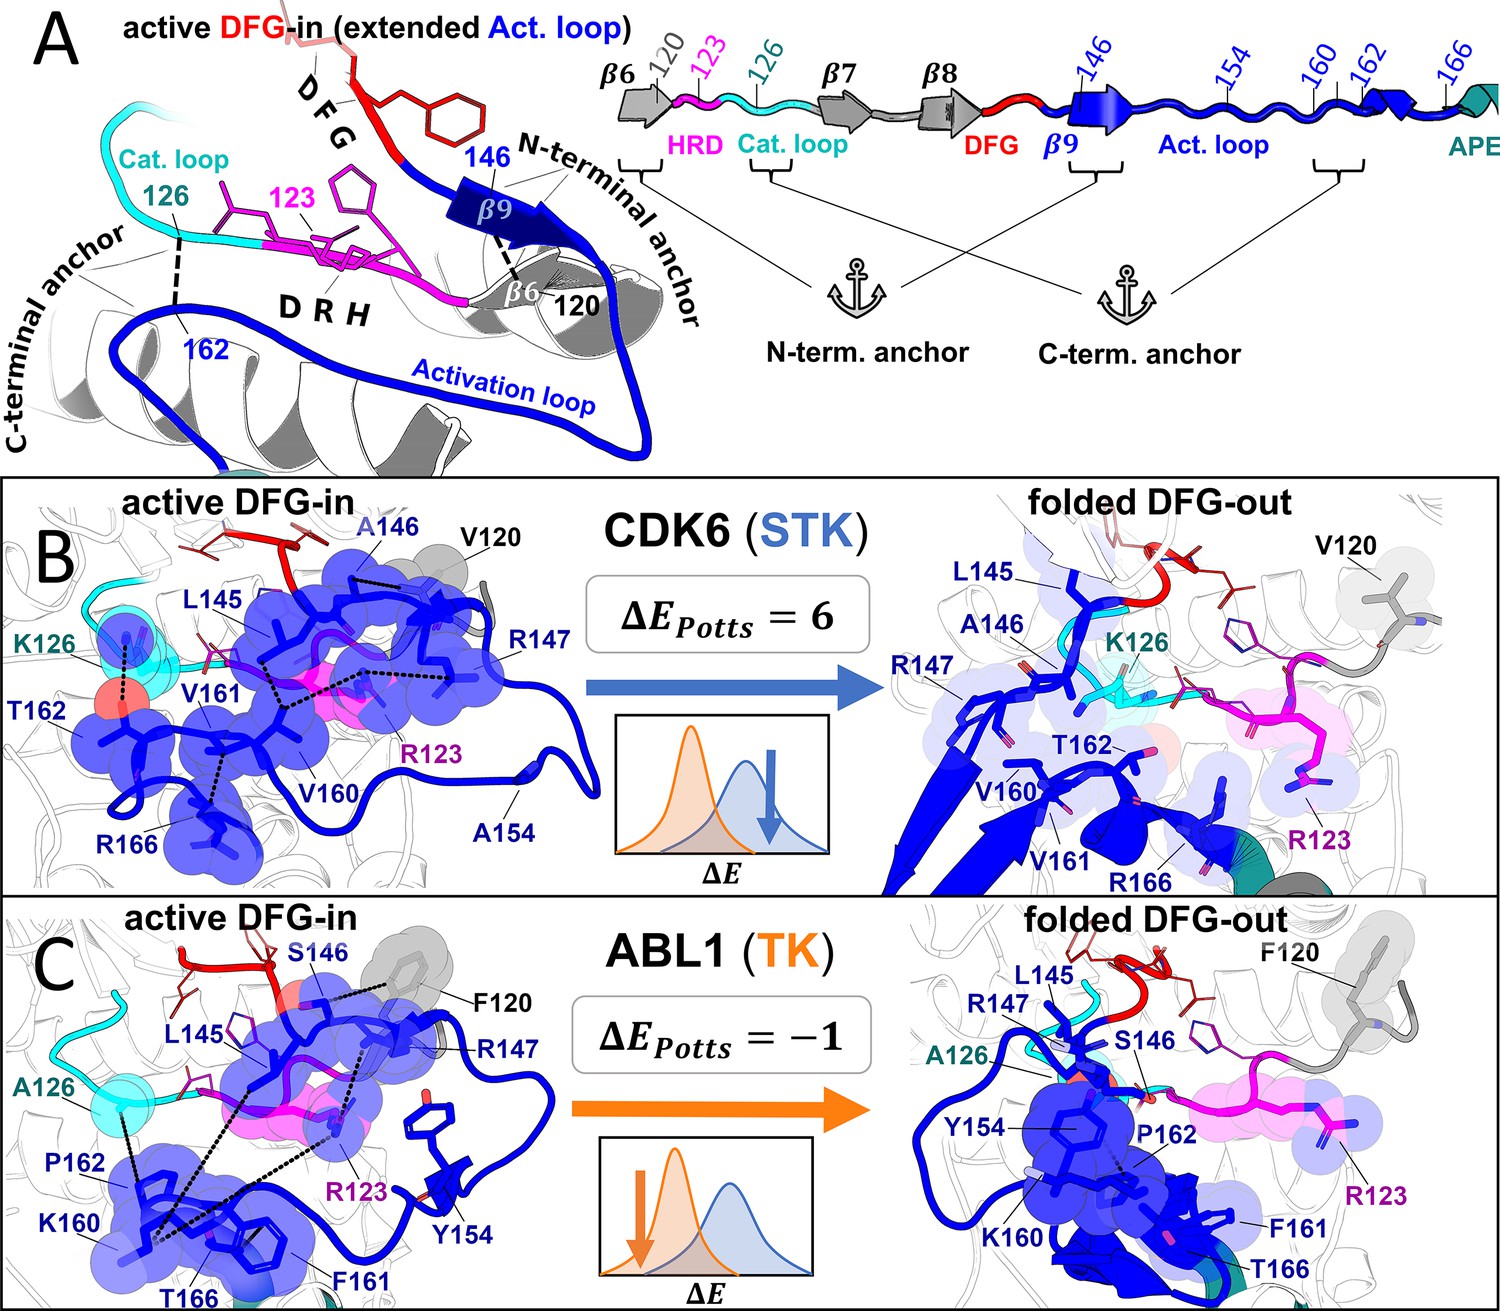
Molecular basis for the evolutionary divergence between tyrosine kinases (TKs) and serine/threonine kinases (STKs).
Visualizing the top interaction pairs that contribute to the result in Figure 5, which is discussed in the main text. (A) Diagrams depicting general features of the active ‘extended’ conformation of the activation loop (left) and the primary structure of these motifs in our multiple sequence alignment (MSA; right) with the HRD (pink), DFG (red), and APE (teal) motifs color-coded for reference. (B–C) Structural examples of a representative STK (CDK6) and TK (Abl) in the active DFG-in conformation (left) and the folded DFG-out conformation (right). Residues are labeled according to their position in our MSA, and colored according to A. The inset (center) displays the ΔEPotts of the reference kinase derived from Figure 5 as well as a cartoon depicting their location in the distributions. The diagrams of CDK6 in the active DFG-in conformation (PDB: 1XO2, chain B), CDK6 in the folded DFG-out conformation (PDB: 1G3N, chain A), Abl in the active DFG-in conformation (PDB: 2G2I, chain A), and Abl in the folded DFG-out conformation (PDB: 1IEP, chain A) were generated with PyMol (pymol, 2015). All ligands and some backbone atoms were hidden for clarity.
Figure 6—figure supplement 1

Interactions belonging to the top five contributions to ΔΔE.
ΔΔE was decomposed to identify the strongest contributing pairs of positions (see Methods), with the idea that these pairs form interactions in the 3D structure that are important for controlling the conformational equilibrium. The residue pairs shown in this figure belong to the top five ΔΔEij (except for [128, 154], which is the 19th top contributing pair). For each position pair (a–h), the residue identities which make the largest contributions are shown. Location of each position along the kinase primary structure with consistent coloring is shown in (i) for reference. (j–k) The substrate mimicking behavior of the TK DFG-out activation loop, with the trans-autophosphorylating FGFR3 structure for reference (substrate activation loop colored green). (l) The interaction between positions (161, 166) forms part of the activation loop C-terminal bulge in TKs which, according to the Potts model, decreases the energetic cost for DFG-out relative to STKs (m) where formation of this interaction pair is constrained to the active conformation, and transition to DFG-out is penalized by breakage of this contact. PDBs: 1XO2 chain B (active CDK6), 2G2I chain A (active ABL), 4MNE chain B (active BRAF), 5HID chain A (inactive BRAF), 3LCD chain A (active CSF1R), 4R7I chain A (inactive CSF1R), 6PNX (trans-autophosphorylating FGFR3 dimer).
Figure 6—figure supplement 2
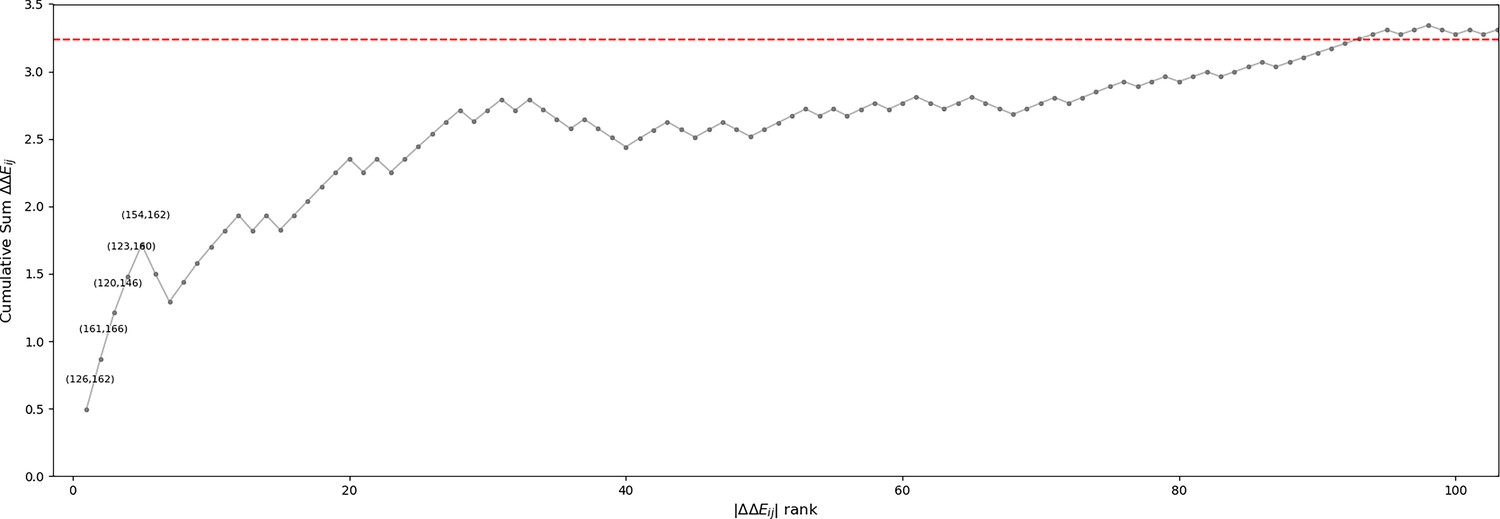
Cumulative sum of position pair contributions to ΔΔE.
ΔΔE contributions (see Methods) were ordered from largest to smallest magnitude. The top pairs which are discussed in the main text and illustrated in Figure 6 are annotated. When the activation loop is in an active ‘extended’ conformation, the N-terminal anchor (Nolen et al., 2004) is formed by a β6 strand in the N-terminal of the activation loop (146385167 to 148387169) and a β9 strand near the N-terminal of the catalytic loop (119358140 to 121142360). In the inactive ‘folded’ conformation of the activation loop, the N-terminal anchor is completely broken as the and strands are peeled apart (Figure 6B and Figure 6C). The Potts model suggests this conformational change is energetically penalized in STKs due to favorable contacts between position 120359141 in the β6 strand and 146385167 in the β9 strand; in 20% of serine/threonine kinases (STKs) we observe and at these positions (Figure 6B). These residues have a significantly more favorable Potts interaction energy than the TK-prevalent pair () which appears in 17% of tyrosine kinases (TKs) and only 1% of STKs (Figure 6C). As reported previously, position 120359141 in TKs is a frequent site of drug resistance mutations to type-II inhibitors (Apperley, 2007; Hauser et al., 2018), particularly the F120I mutation (F359I in Abl numbering). This mutation in Abl changes the interaction pair from (), seen in only 1% of STKs, to () which is seen in 15% of STKs. The mutant ‘STK-like’ interaction pair () is energetically more favorable according to the Potts model, suggesting that part of the Abl type-II inhibitor resistance mechanism of F120I (F359I) involves increasing the free-energy penalty for the active DFG-in/extended activation loop → classical DFG-out/folded activation loop transition. Consistent with this view, it was found that it is possible to treat patients with this drug-resistance mutation using dasatinib (Barańska et al., 2008; Tokarski et al., 2006): a type-I inhibitor that does not require access to the DFG-out conformation.
Tables
Table 1
Calculation of reorganization free-energy for five TKs and five STKs.
Type-II hit rates from Davis et al. and Potts threaded energy penalties from Figure 1 were used to guide the selection of five serine/threonine kinase (STK) and five tyrosine kinase (TK) targets for absolute binding free-energy simulations. For some kinases, the hit rate binary classifier captures a set of relatively weak hits with average binding which, in context with large Potts penalty (see Figure 1D), might be explained by a large ΔGreorg incurred for the folded DFG-out state (Figure 1B). See Figure 3—source data 1 for detailed data and references for experimental binding affinities.
| Kinase | Class | Hit rate* (Kd <10 µM) | Potts penalty† (ΔEPotts) | Calculated ΔGreorg‡ |
|---|---|---|---|---|
| MELK | STK | 3 | 5.9 | 5.6±0.2 |
| MAPK9 | STK | 5 | 4.7 | 6.9±0.3 |
| CDK2 | STK | 2 | 5.3 | 7.7±0.2 |
| IRAK4 | STK | 0 | 2.5 | 5.4±0.2 |
| BRAF | STK | 7 | 4.0 | 6.5±0.1 |
| ABL1 | TK | 10 | –1.0 | 1.3±0.3 |
| LCK | TK | 11 | 0.5 | 1.0±0.3 |
| TIE2 | TK | 6 | 1.1 | –0.3±0.2 |
| NTRK2 | TK | 6 | –1.0 | 1.7±0.1 § |
| DDR1 | TK | 11 | 0.4 | 0.3±0.3 |
-
*
Type-II inhibitors only, data from Davis et al., 2011.
-
†
Calculations from Figure 1d.
-
‡
ΔGreorg was calculated from Equation 3. Reported standard deviations were calculated by propagating error from the simulations used in the calculation of average ΔGreorg in units of kcal/mol (see Figure 3—source data 1 for statistics from individual simulations).
-
§
Average and standard deviation calculated from two simulated complexes.
Table 2
Summary of benchmarking results.
All reported values are in units of kcal/mol. The root mean square error (RMSE) and mean unsigned error (MUE) were calculated with respect to the linear model , where is calculated as . The average difference between and is shown in the last column.
| Kinase | # Compounds | MUE | RMSE | |
|---|---|---|---|---|
| CDK2 | 6 (type-I) | 0.71 | 1.03 | 1.89 |
| JNK1 | 5 (type-I) | 0.37 | 0.44 | 1.29 |
| MAPK14 | 9 (type-11/2) | 0.47 | 0.64 | 0.2 |
| ABL1 | 6 (type-II) | 1.47 | 1.57 | 1.26 |
Additional files
Download links
A two-part list of links to download the article, or parts of the article, in various formats.
Downloads (link to download the article as PDF)
Open citations (links to open the citations from this article in various online reference manager services)
Cite this article (links to download the citations from this article in formats compatible with various reference manager tools)
Evolutionary divergence in the conformational landscapes of tyrosine vs serine/threonine kinases
eLife 11:e83368.
https://doi.org/10.7554/eLife.83368


