Structures of RecBCD in complex with phage-encoded inhibitor proteins reveal distinctive strategies for evasion of a bacterial immunity hub
- Section of Structural Biology, Department of Infectious Disease, Faculty of Medicine, Imperial College London, United Kingdom
- DNA:protein Interactions Unit, School of Biochemistry, University of Bristol, United Kingdom
Figures
Figure 1 with 1 supplement
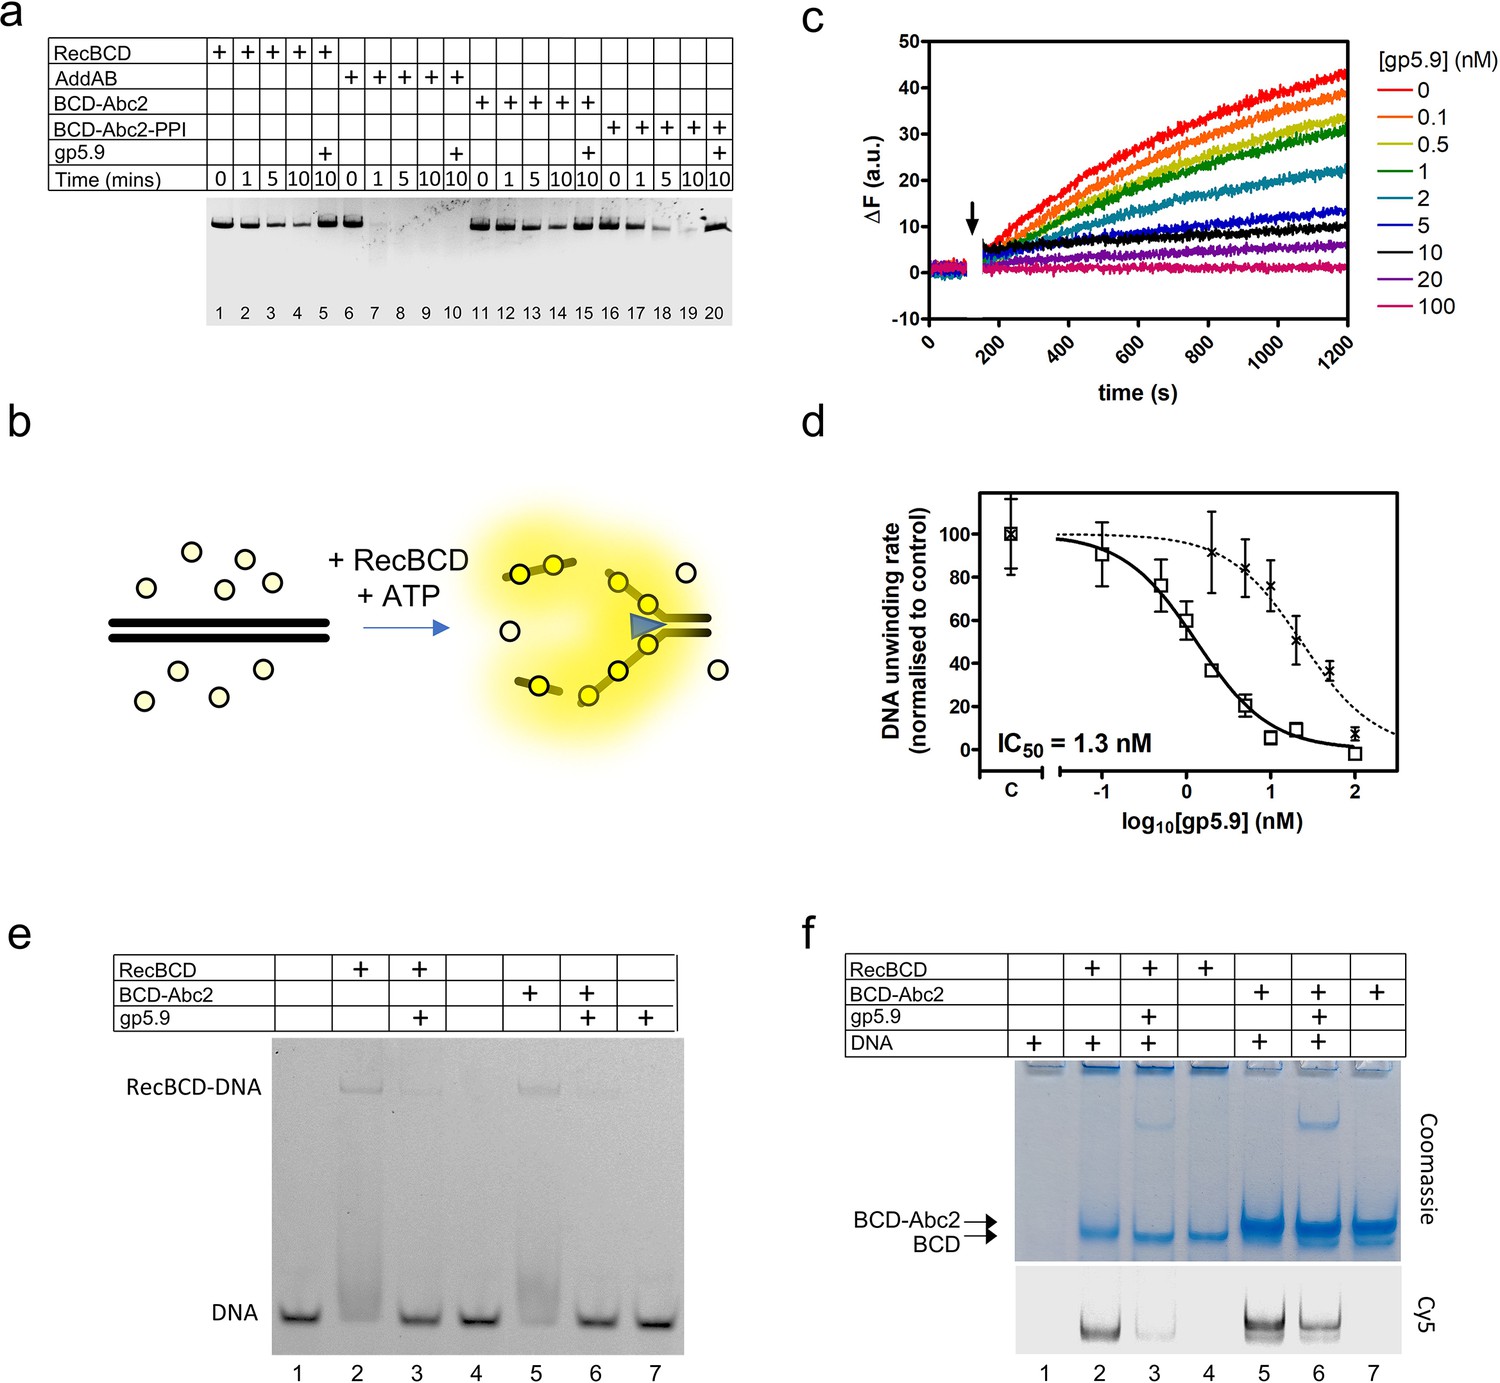
RecBCD helicase activity is inhibited by gp5.9 but not Abc2.
(a) Gel-based double-stranded DNA break (DSB) resection assay. The indicated proteins or protein complexes were incubated with a linearised dsDNA substrate for the indicated times in the presence of ATP. RecBCD (or AddAB) activity leads to DNA strand separation and depletion of the substrate. Substrate depletion is not affected by the presence of Abc2 or PPI. The substrate is not unwound by RecBCD in the presence of gp5.9 regardless of the presence of Abc2/PPI, but gp5.9 does not inhibit the orthologous AddAB complex. (b) Schematic of the DNA helicase assay using the fSSB biosensor (yellow circles). The ssDNA products of DNA unwinding are bound by fSSB causing a fluorescence increase. (c) Representative example of DNA unwinding traces for RecBCD in the presence of increasing [gp5.9]. The black arrow indicates addition of ATP to initiate the reaction. (d) A plot of initial DNA unwinding rate versus [gp5.9] yields a low nanomolar inhibition constant (IC50). The two data sets shown are for gp5.9 with the N-terminal his-tag removed (squares and solid fit line; IC50 = 1.3 nM) and with the his-tag intact (crosses and dotted fit line; IC50 = 23 nM). Values for the unwinding rate (mean and standard error for three technical repeats) are normalised to a control experiment in the absence of gp5.9 (marked C on the x-axis). (e) Electrophoretic mobility shift assay showing the effect of gp5.9 and Abc2 on the DNA binding activity of RecBCD. A Cy5-labelled blunt-ended duplex DNA substate was incubated with the proteins indicated and then run on a native gel to separate the free and bound DNA species. (f) Native 'inverse EMSA' assay showing binding of DNA by RecBCD or RecBCD-Abc2 complexes, and the effect of gp5.9 on both systems. The indicated complexes were incubated with or without labelled DNA substrate either in the presence or absence of gp5.9 as indicated. The samples were then run on native polyacrylamide gels and stained with Coomassie to reveal the position of the intact protein complexes. The same gel was also imaged for Cy5 fluorescence to reveal the position of the DNA. Note that free DNA runs off the bottom of the gel in this experiment, whereas bound DNA co-migrates with the RecBCD complexes. All gel images are representative examples of experiments that were technically reproduced at least once.
-
Figure 1—source data 1
Compresssed file containing images of uncropped gels and raw data associated with Figure 1.
- https://cdn.elifesciences.org/articles/83409/elife-83409-fig1-data1-v2.zip
Figure 1—figure supplement 1
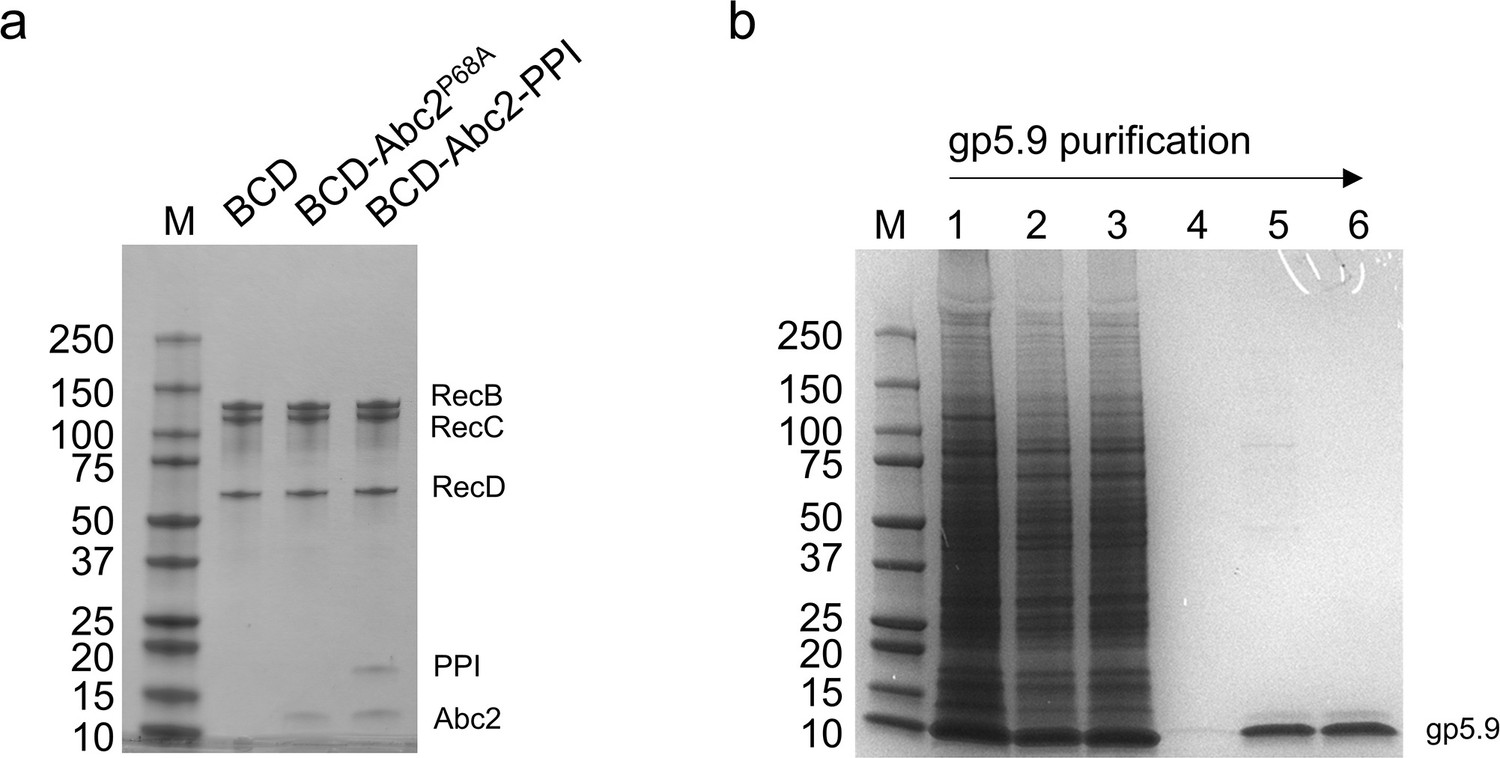
Purified proteins and protein complexes used in this study.
(A) Purified RecBCD, RecBCD-Abc2P68A, and RecBCD-PPI-Abc2 complexes (1.5 µg each). The subunits are indicated. (B) Purification of gp5.9 from an insect cell extract. Lane 1, whole-cell extract; lane 2, soluble cell extract; lane 3, Ni2+ flowthrough; lane 4, Ni2+ elution; lane 5, monoQ elution; lane 6; final prep after SEC and concentration. All samples were run on SDS-PAGE gels and stained with Coomassie Blue.
Figure 2 with 4 supplements
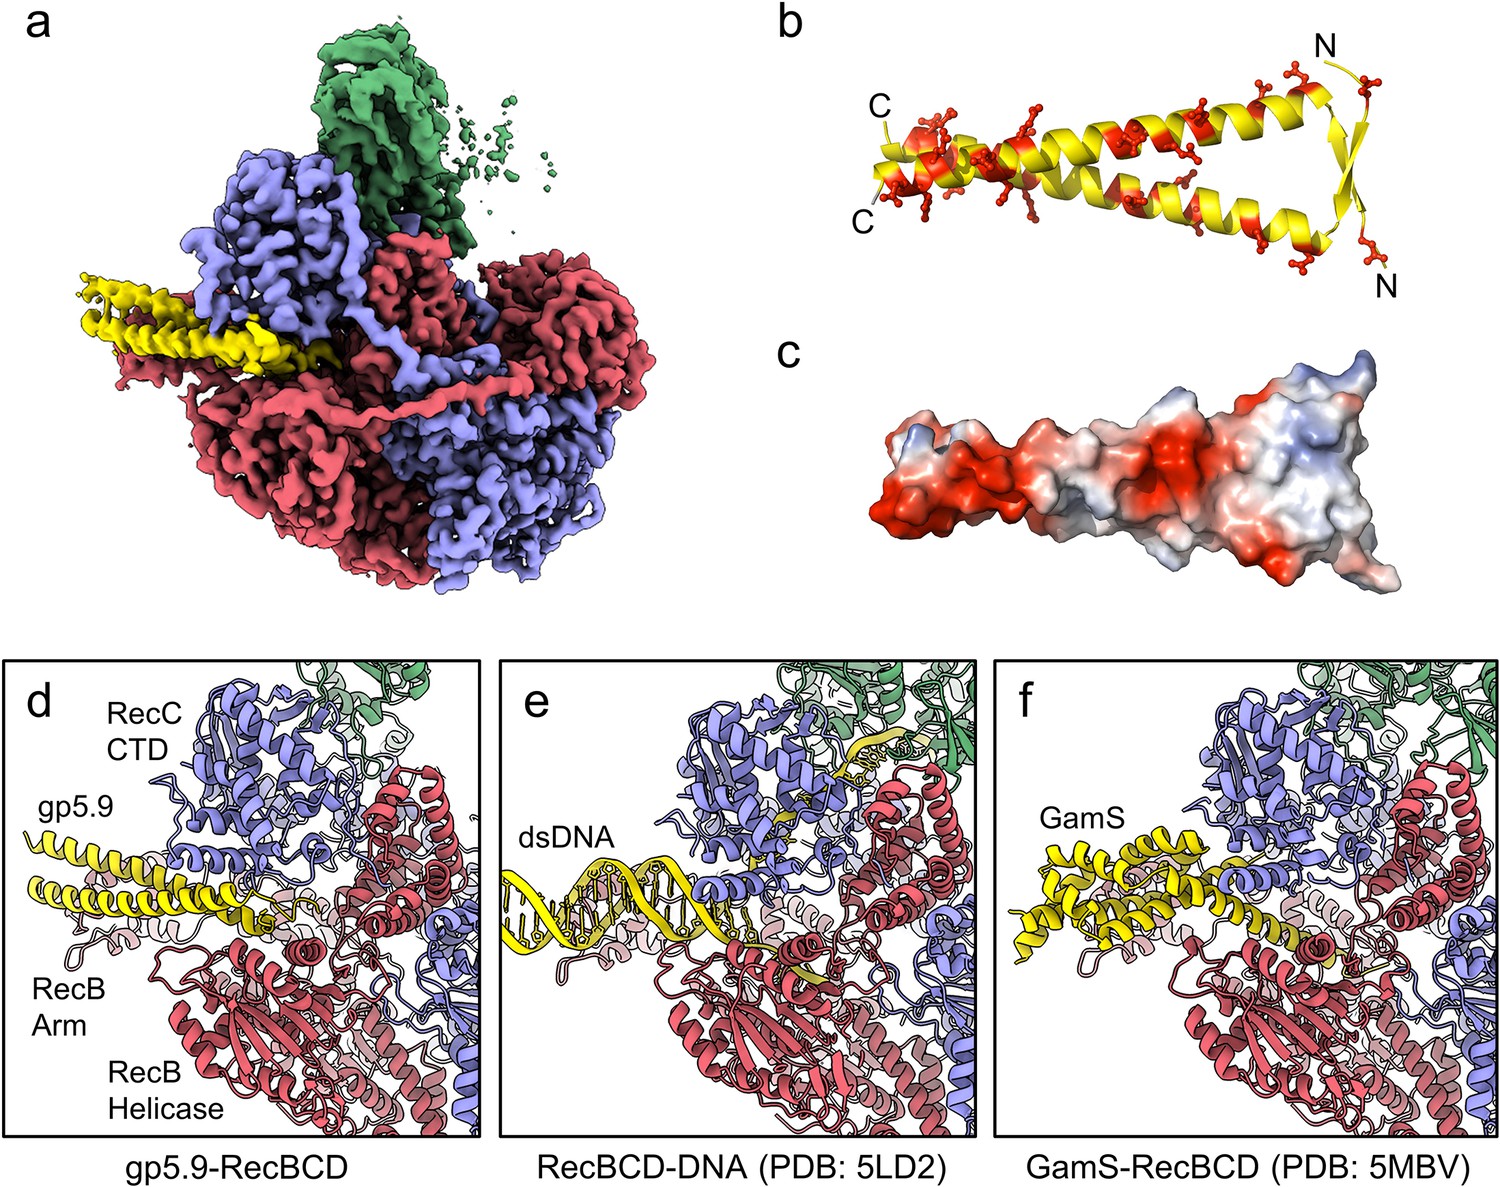
CryoEM structure of the RecBCD-gp5.9 complex.
(a) CryoEM map of the RecBCD-gp5.9 complex. Subunit colour coding is as follows: RecB in red, RecC in slate blue, RecD in green, and gp5.9 in yellow. (b, c) The gp5.9 dimer adopts a parallel coiled-coil architecture braced by an N-terminal beta-sheet and displays many negatively charged Asp and Glu residues (red) on its surface. (d) Section of the atomic model of the RecBCD-gp5.9 complex with colouring as in (a). (e, f) Sections of the models of the RecBCD-DNA (PDB:5LD2) and RecBCD-Gam (PDB:5MBV) complexes for comparison.
Figure 2—figure supplement 1

CryoEM processing scheme for the RecBCD-gp5.9 dataset.
(a) Representative micrograph from the dataset. (b) The most populated 2D class averages generated in cryoSPARC from the cleaned 2xbinned particle set. (c) The results of cryoSPARC ab initio 3D classification. (d) The RELION-3 refined cryoEM maps before and after Bayesian polishing and CTF refinement. (e) The output classes from 3D classification with local angular searches. (f) 3D refinement of the selected particles and generation of a mask around the gp5.9 binding site used for (g) focused classification to remove particles absent of density for gp5.9. (h) The final refined RecBCD-gp5.9 map coloured by local resolution as estimated in RELION. (i) Fourier Shell Correlation curves for the corrected and phase randomised maps.
Figure 2—figure supplement 2
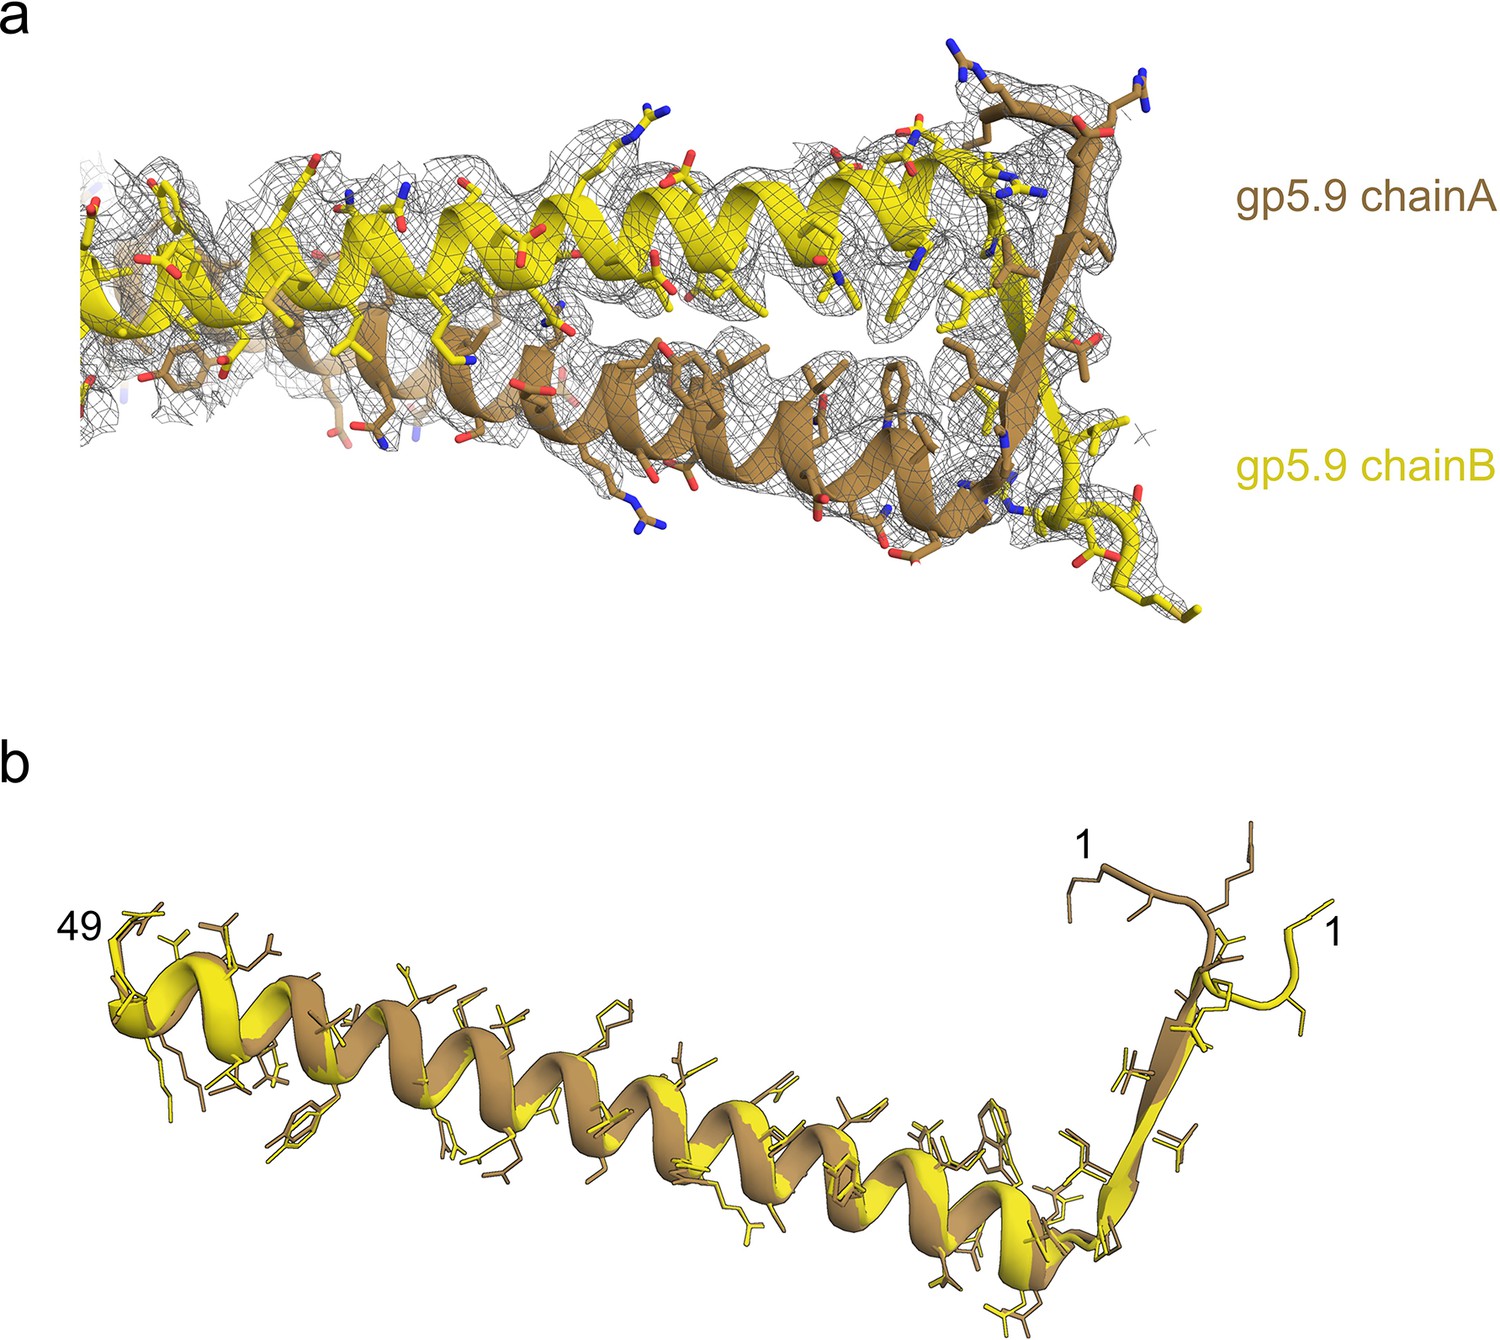
Modelling the structure of the gp5.9 phage protein.
(a) The model of the gp5.9 dimer with the surrounding cryoEM density represented by grey mesh. (b) Superposition of the two chains of the gp5.9 model shows they share a high degree of structural similarity.
Figure 2—figure supplement 3
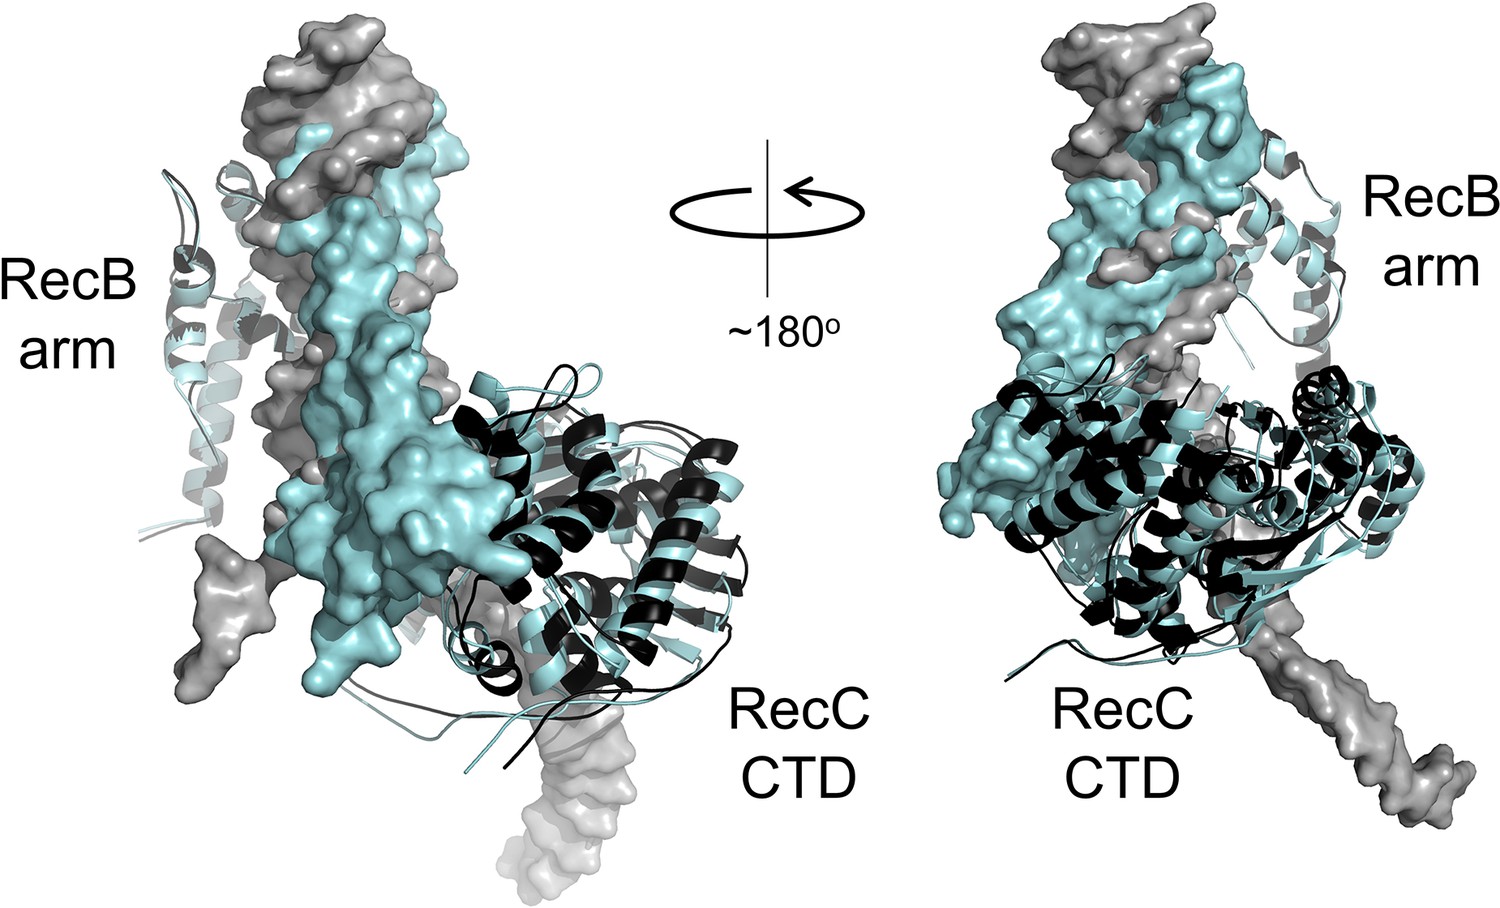
Small rigid body domain movements in RecBCD facilitate binding to either DNA or gp5.9.
Both DNA and gp5.9 bind predominantly to RecBCD at the RecB arm domain and the RecC CTD. Small changes in the relative positioning of these two domains allow RecBCD to bind either DNA or gp5.9 at the same site despite their slightly different sizes and orientation of binding. The RecBCD-DNA complex and the RecBCD-gp5.9 complex are shown overlaid and in black and cyan, respectively. In both cases, the ligand (i.e. either DNA or gp5.9) is shown as a surface representation, whereas the RecB arm and RecC CTD are shown as ribbons (positions indicated). The structures have been aligned using the RecB arm domains which are therefore almost perfectly superimposed upon one another. Note the different positioning of the RecC CTD which accommodates differences in the binding of either DNA or the DNA mimic.
Figure 2—figure supplement 4
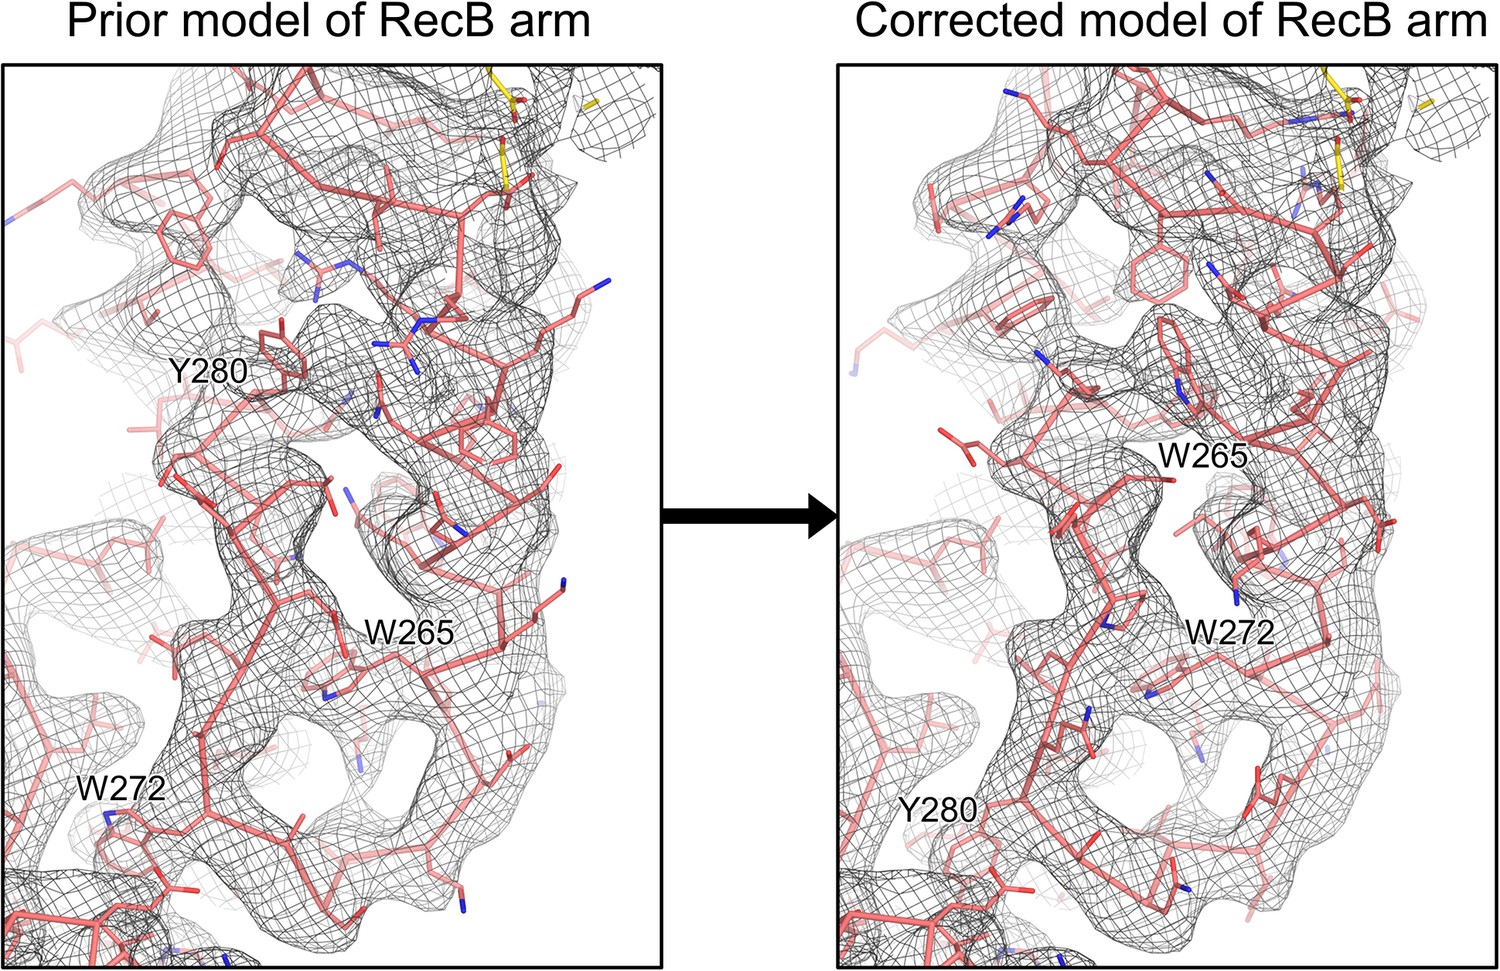
Rebuilding of the RecB arm domain model based on the high-resolution RecBCD-gp5.9 cryoEM map.
Side-by-side view of the density for the RecB arm in the RecBCD-gp5.9 cryoEM map, with the original RecB model (left) shown alongside the corrected RecB model (right). The large hydrophobic residues key to establishing the register of the model are labelled, highlighting the 7–8 residue sequence shift induced by the rebuilding.
Figure 3
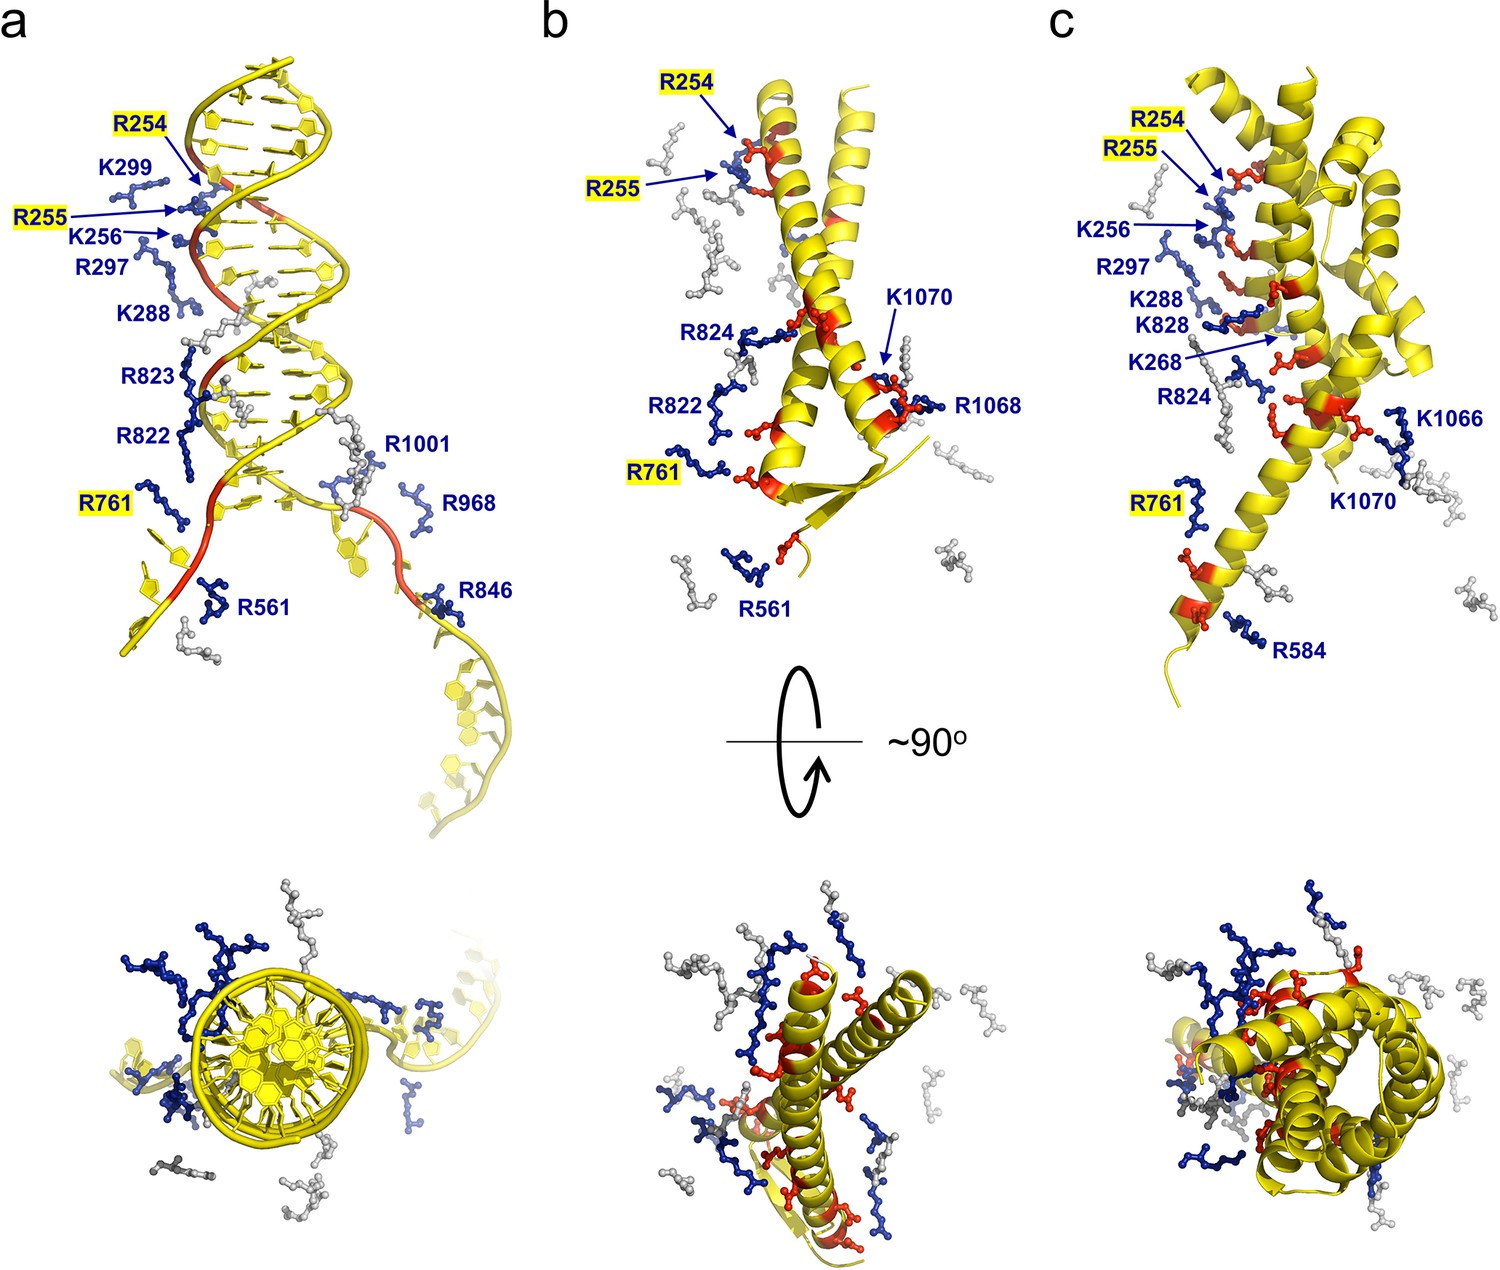
gp5.9 is a DNA mimic protein.
Charge pair interactions between R/K residues in RecBCD (blue) and either phosphates or D/E residues (red) for DNA (a), gp5.9 (b), or Gam (c). The images are all taken from the same point of view for complexes that were superimposed using the RecB arm domain. The R/K residues displayed are all of those shown in Table 1 and are the same for all three complexes. They are coloured blue and labelled with residue numbers if they make contacts with the ligand in each case (either DNA, gp5.9, or Gam) and are grey and unlabelled if they do not.
-
Figure 3—source data 1
Complete list of interactions between the RecBCD complex and gp5.9.
- https://cdn.elifesciences.org/articles/83409/elife-83409-fig3-data1-v2.docx
Figure 4 with 6 supplements
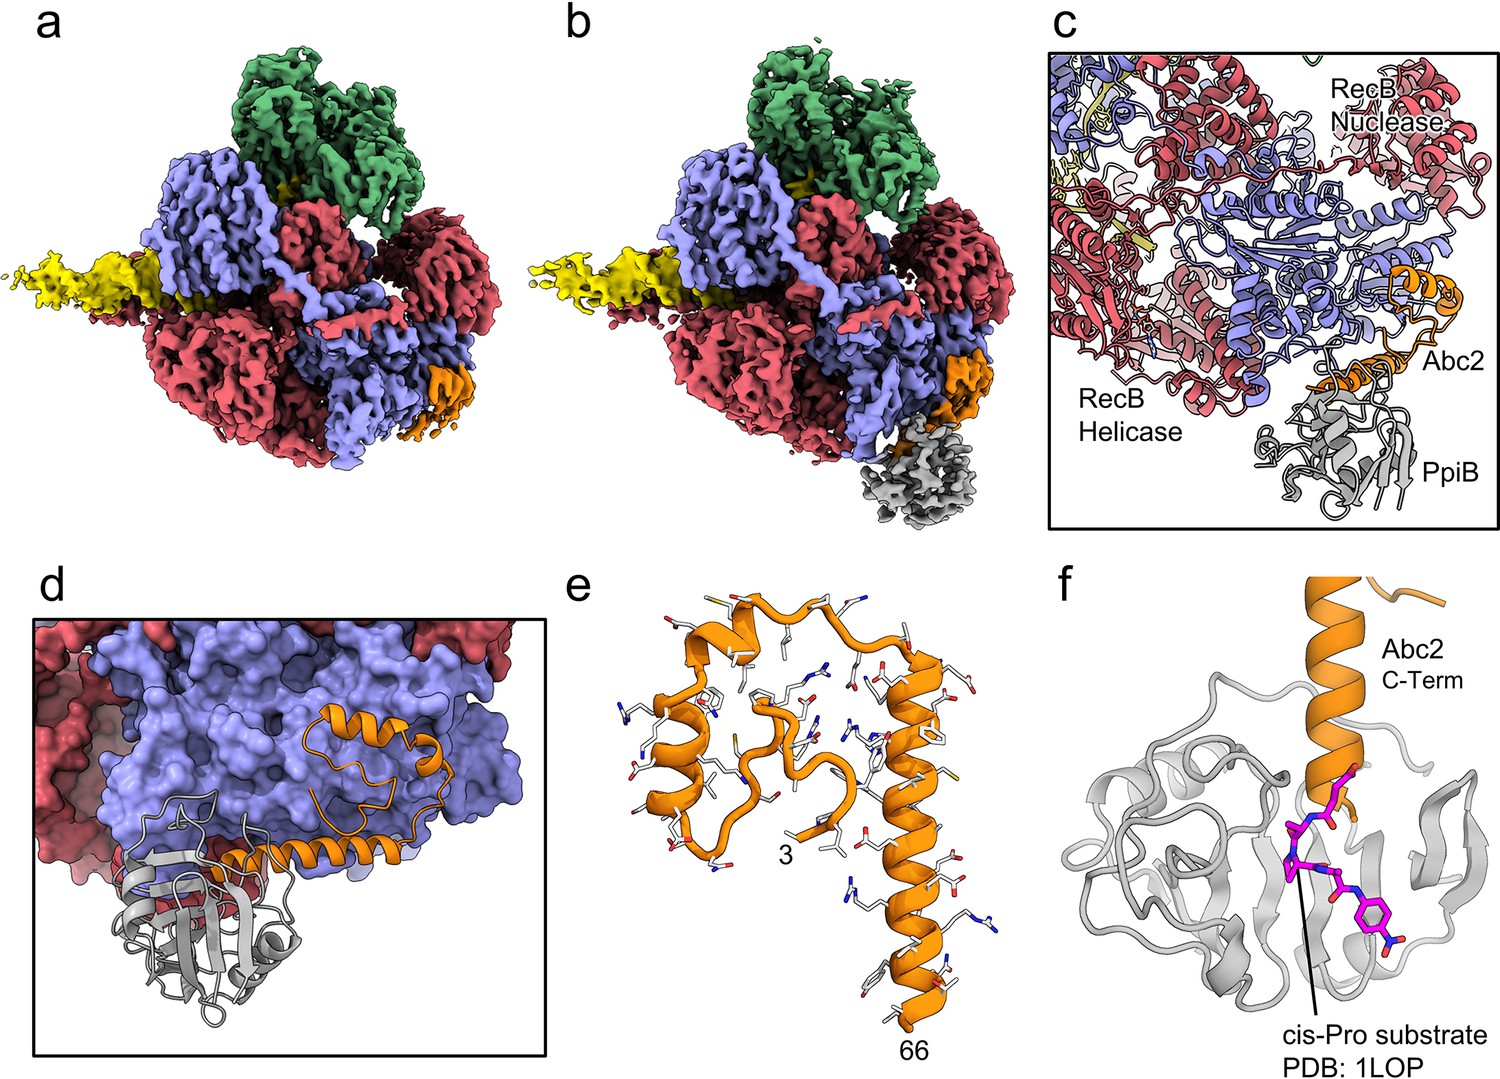
CryoEM structures of the RecBCD-Abc2 and RecBCD-Abc2-PPI complexes.
(a) CryoEM map of the RecBCD-Abc2-DNA complex, coloured as in Figure 2 but with the DNA substrate yellow and Abc2 in orange (b) CryoEM map of the RecBCD-Abc2-PpiB-DNA complex, with PpiB in grey. (c) Section of the atomic model of the RecBCD-Abc2-PpiB-DNA complex. (d) Surface view of the Abc2 binding site on the surface of the RecC Chi-binding domains. (e) Atomic model of residues 3–66 of Abc2 in the PpiB-bound complex showing an extended helical structure. (f) Model of the C-terminus of Abc2 bound to PpiB. A substrate analogue (magenta) is superimposed on the PpiB structure based upon PDB: 1LOP. The structure strongly suggests that P68 (two residues beyond the final modelled amino acid 66) would reside in the cis-trans isomerisation active site.
-
Figure 4—source data 1
Complete list of interactions between the RecBCD complex and Abc2.
- https://cdn.elifesciences.org/articles/83409/elife-83409-fig4-data1-v2.docx
Figure 4—figure supplement 1
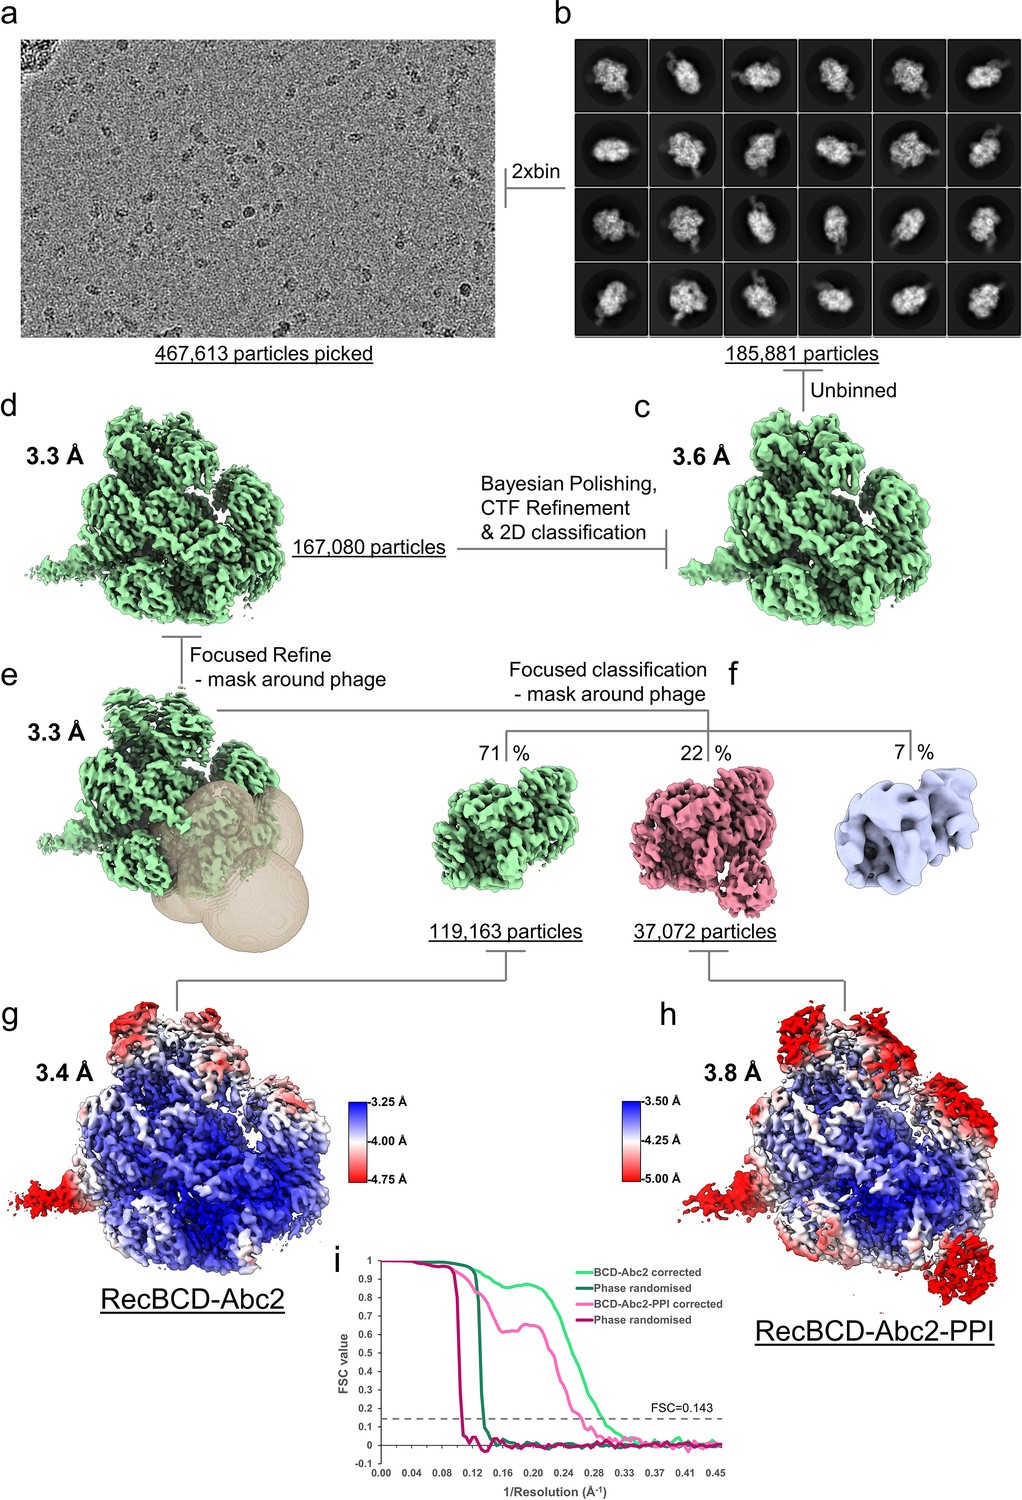
CryoEM processing scheme for the RecBDCD-Abc2-PPI-DNA dataset.
(a) Representative micrograph from the dataset. (b) The most populated 2D class averages generated in cryoSPARC from the cleaned 2xbinned particle set. The RELION-3 refined cryoEM maps (c) before and (d) after Bayesian polishing and CTF refinement. (e) Resulting map from a focused 3D refinement using a mask around the Abc2 binding site with the mask displayed as a transparent surface. (f) Focused classification isolated a high resolution RecBCD-Abc2 class and a RecBCD-Abc2-PPI class. The final refined (g) RecBDCD-Abc2-DNA and (h) RecBDCD-Abc2-PPI-DNA map coloured by local resolution as estimated in RELION. (i) FSC curves for the corrected and phase randomised maps.
Figure 4—figure supplement 2
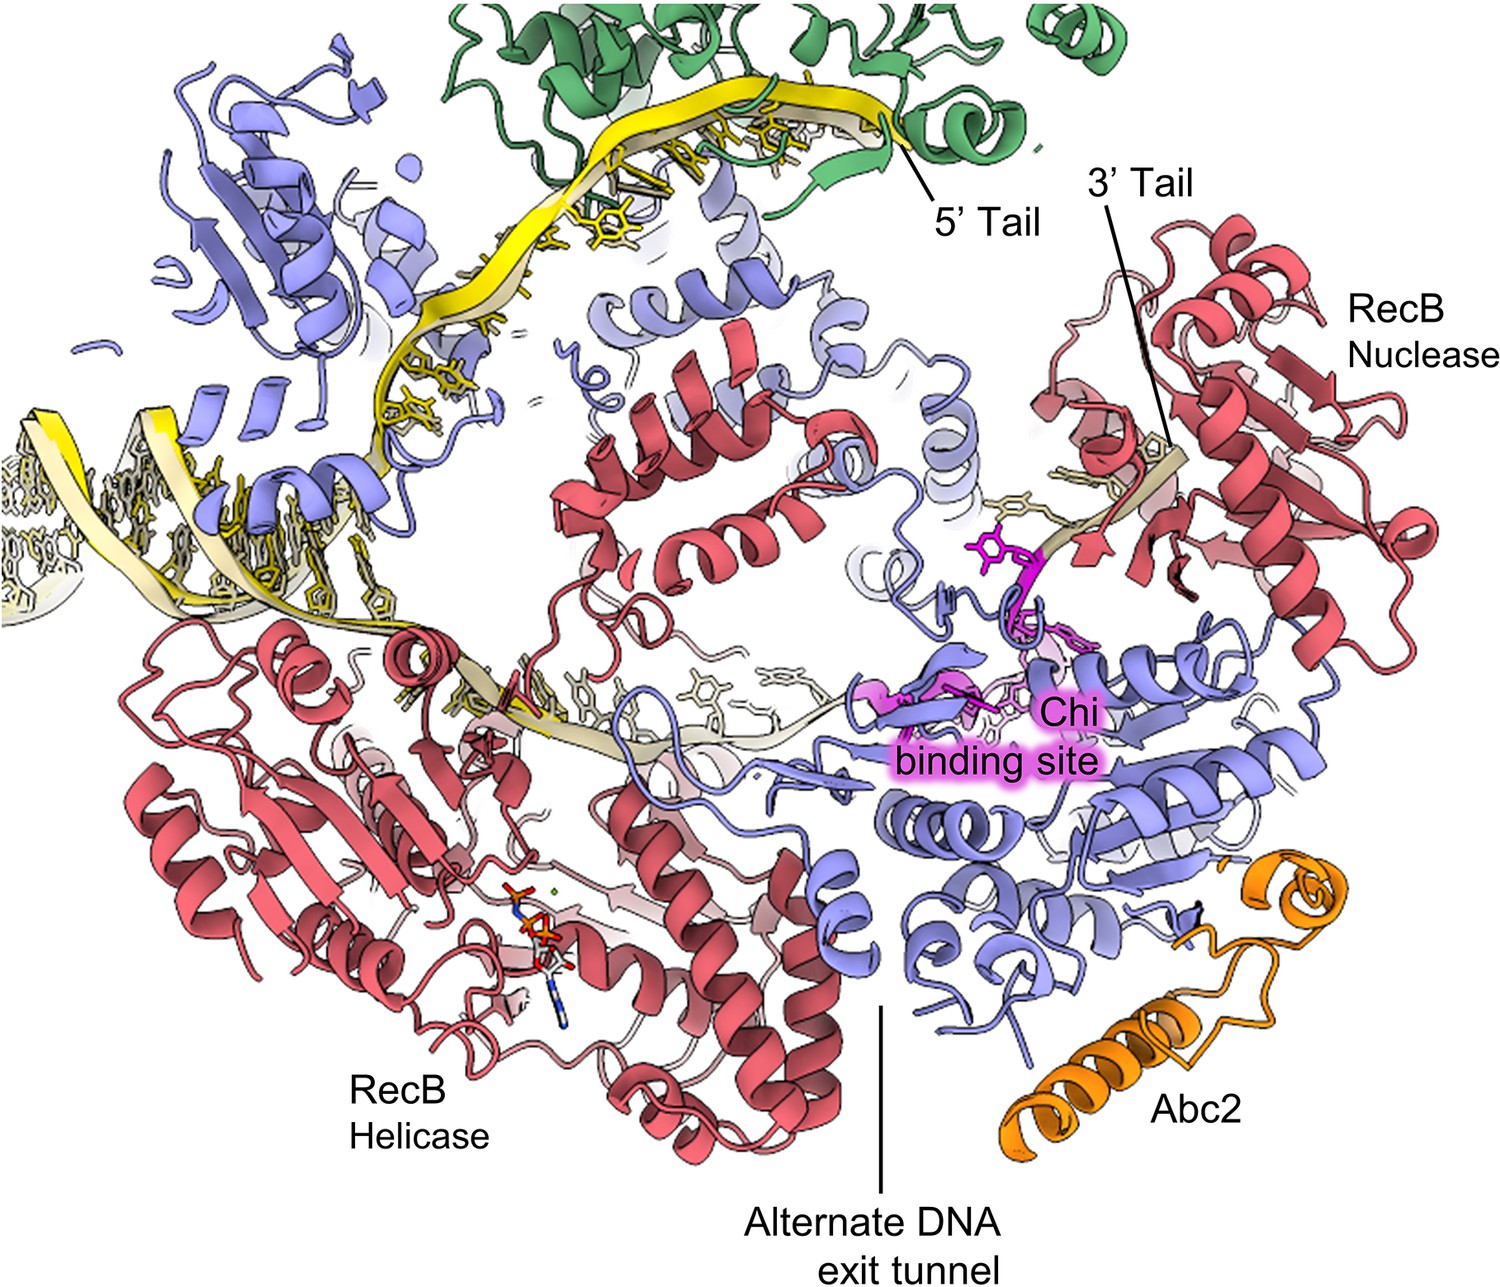
Overview of the location of Abc2 binding in the context of the RecBCD complex.
Slabbed view of the RecBCD-Abc2-DNA structure with the Chi DNA substrate from the RecBCD Chi recognition cryoEM structure (PDB: 6SJB; Murphy, 2000) overlaid in gold with the Chi residues highlighted in magenta.
Figure 4—figure supplement 3

Abc2 binding induces minimal conformational changes in the RecBCD complex.
(a) Superposition of the RecBCD-Abc2-DNA structure (coloured as in other figures) with the corresponding RecBCD-DNA structure containing the same DNA substrate (PDB: 5LD2) in grey. The boxed panel shows a close-up of the superposition, revealing a slight rotation within the RecB nuclease domain. (b) Side-by-side related close-up views of the Abc2 binding site in the structures without (left) and with (right) Abc2. A surface helical bundle involving RecC252-294, highlighted in cyan, peels back to allow Abc2 binding. (c) Rotated view of the Abc2 binding site in the RecBCD-Abc2-PPI-DNA model (left) with the associated cryoEM map displayed unsharpened (right) to indicate a potential path for the displaced RecC252-294 domain, highlighted in cyan.
Figure 4—figure supplement 4

Modelling of Abc2 and PpiB in the cryoEM maps.
(a) Density and model for the RecBCD-Abc2-DNA structure showing the Abc2 binding site on RecC. (b) Density and model for Abc2 and docked PpiB taken from the RecBCD-Abc2-PPI-DNA structure. (c) View of the blurred RecBCD-Abc2-PPI-DNA map showing evidence for the continuation of the Abc2 C-terminus through the crevice between PpiB and RecC.
Figure 4—figure supplement 5

Additional unmodelled density suggests a path for the Abc2 C-terminus breaching the RecB helicase domains.
Similar views and contouring of the blurred (a) RecBCD-Abc2-PPI-DNA and (b) RecBCD-Abc2-DNA CryoEM maps with additional, unmodelled difference density shown as a lime green surface. This suggests that in the PpiB bound complex the C-terminus of Abc2 becomes partially ordered around the RecB helicase domains, in the vicinity of the bound ATP analogue ADPNP.
Figure 4—figure supplement 6

AlphaFold modelling of the full Abc2 protein shows a divergent C-terminus.
(a) The five top AlphaFold models for the Abc2 protein (coloured on a greyscale spectrum) are aligned to the solved Abc2 model (residues 3–66, coloured blue-to-red from the N- to the C-terminus). The predictions diverge significantly in trying to assign structure to the C-terminal residues which cannot be modelled in the cryoEM structure. (B) Alignment of the five AlphaFold models to Abc2 in the context of the RecBCD-Abc2-DNA structure. None of the predictions orientate the C-terminus is a way that would satisfy the additional density seen within the RecB helicase.
Figure 5
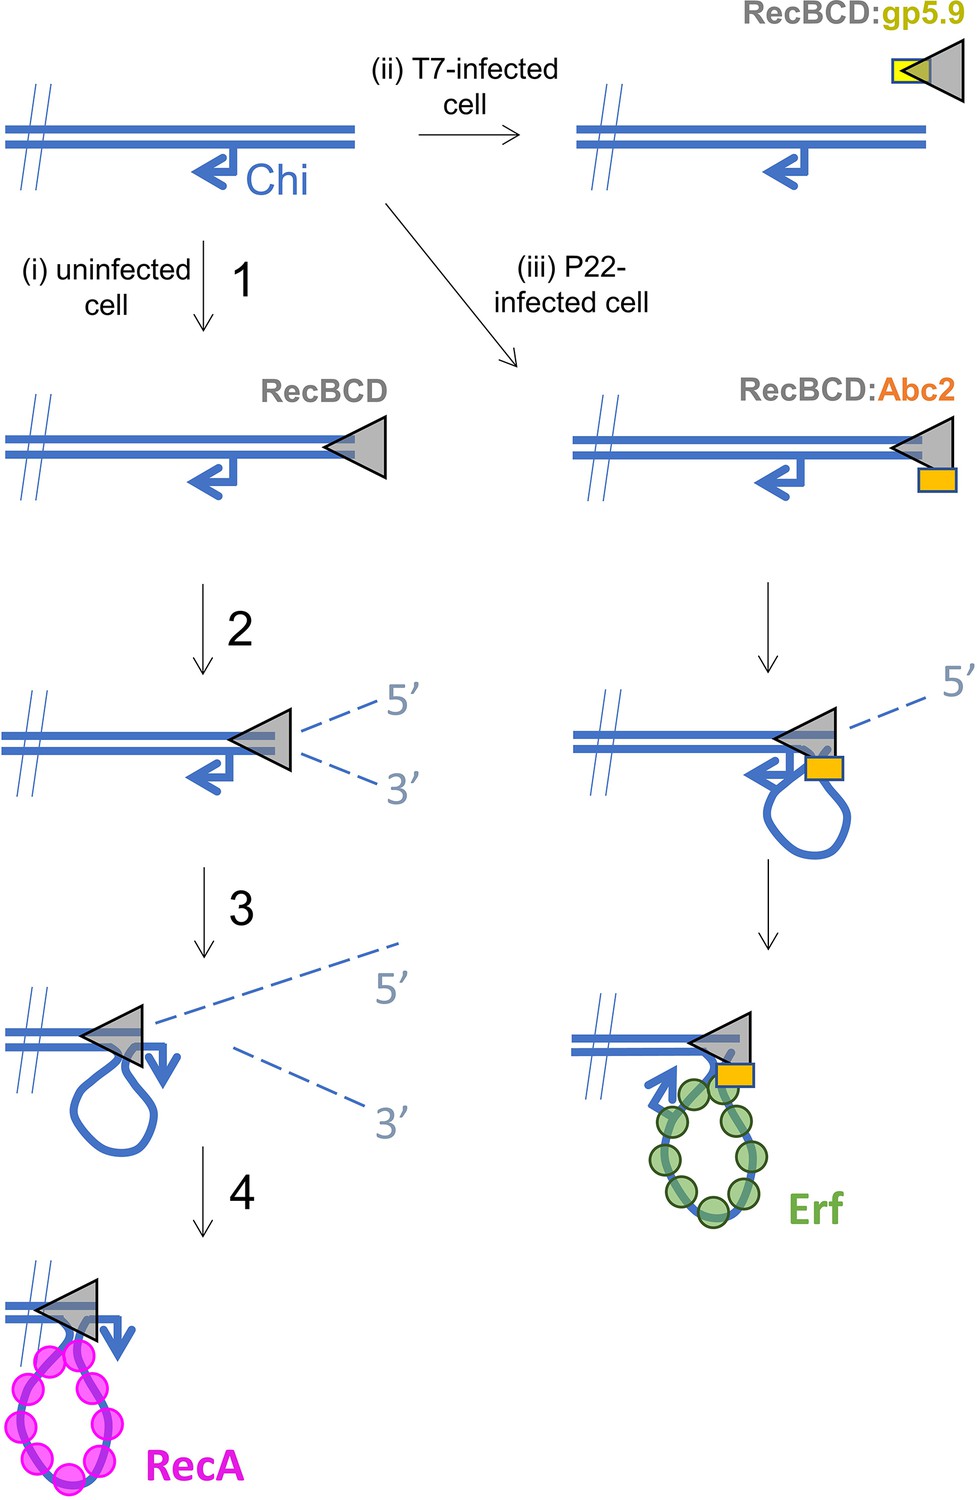
Hypothetical models for control of RecBCD by T7 gp5.9 and P22 Abc2.
In uninfected cells (pathway i), free DNA ends are processed by RecBCD to yield a recombinogenic 3’-terminated ssDNA overhang coated with host RecA protein. The reaction proceeds in five steps. (1) RecBCD binds to the free DNA end. (2) RecBCD translocates and unwinds the duplex DNA degrading both strands as it progresses into fragments of single-stranded DNA of varying lengths. This activity is detrimental to phage as it can help degrade invading linear DNA species and initiates CRISPR acquisition. (3) RecBCD recognises a Chi sequence (these are over-represented in host DNA). (4) RecBCD continues to unwind DNA and to degrade the 5’-terminated DNA strand, but the 3’-terminated strand is protected from degradation and forms an expanding loop structure. (5) RecBCD loads RecA protein onto the ssDNA loop ready for subsequent strand invasion and further steps of DNA repair. In T7-infected cells (pathway ii), the gp5.9 protein titrates RecBCD by competing for the DNA binding site. Linear phage DNA cannot be degraded by RecBCD and is available for phage recombination and replication. In P22-infected cells (pathway iii), Abc2 binds to the RecBCD complex and modifies the enzyme to load the P22 recombinase (Erf), as opposed to RecA, onto the ssDNA products. Recombinase loading might occur either constitutively as indicated here or in response to Chi-recognition as in the unperturbed pathway.
Tables
Table 1
Gp5.9 is a DNA mimic protein.
Ion pair contacts (<4 Å) between Arg/Lys residues in the RecBCD complex and negatively charged moieties in either DNA (phosphates) or DNA mimic proteins (Asp/Glu). Shaded rows highlight charge–charge interactions that are analogous across all three complexes. These interactions are illustrated in Figure 3.
| RecBCD(subunit indicated) | DNA | Gp5.9 | Gam |
|---|---|---|---|
| R254 (B) | O3′-25 | E45 | D73 |
| R255 (B) | O3′-56 | D38/E39 | E118/E125 |
| K256 (B) | OP1-57/O5′-57 | E118 | |
| K264 (B) | E36 | ||
| K268 (B) | D107 | ||
| K288 (B) | OP-59 | E111 | |
| R297 (B) | OP-58 | E114 | |
| K299 (B) | OP-27 | ||
| R561 (B) | OP-69 | D4 | |
| R584 (B) | D48 | ||
| R761 (B) | O5′–68/O3′-67 | D11 | E51 |
| R822 (B) | OP-67 | D15 | |
| R823 (B) | OP-18 | ||
| R824 (B) | D21/E24 | E65/E68/E125 | |
| K828 (B) | E118 | ||
| R846 (C) | OP-10/O3′-9 | ||
| R968 (C) | OP-11/O3′-10 | ||
| R1001 (C) | OP-12 | ||
| K1066 (C) | E70/D74 | ||
| R1068 (C) | D11/D15 | ||
| K1070 (C) | E24 | E70 |
Table 2
CryoEM data collection, refinement, and validation statistics.
| gp5.9-RecBCD(EMDB-15803)(PDB 8B1R) | Abc2-RecBCD-DNA-ADPNP(EMDB-15804)(PDB 8B1T) | Abc2-RecBCD-PpiB-DNA-ADPNP(EMDB-15805)(PDB 8B1U) | |
|---|---|---|---|
| Data collection and processing | |||
| Magnification | 81,000 | 130,000 | |
| Voltage (kV) | 300 | 300 | |
| Detector | K3 | K2 | |
| Energy slit width (e–V) | 20 | 20 | |
| Electron exposure (e–/Å2) | 50 | 56 | |
| Exposure rate (e–/pixel/s) | 14.0 | 5.2 | |
| Defocus range (μm) | –1.0 to –2.5 | –1.2 to –2.4 | |
| Pixel size (Å) | 1.10 | 1.06 | |
| Movies collected | 5064 | 2500 | |
| Initial particle images (no.) | 674,546 | 185,881 | |
| Final particle images (no.) | 141,458 | 119,163 | 37,072 |
| Symmetry imposed | C1 | C1 | C1 |
| Map resolution (Å) | 3.2 | 3.4 | 3.8 |
| FSC threshold | 0.143 | 0.143 | 0.143 |
| Map resolution range (Å) | |||
| Refinement | |||
| Initial model used (PDB code) | 5MBV | 5LD2, 8B1R | 8B1T |
| Map sharpening B factor (Å2) | –50 | –50 | –50 |
| Model resolution (Å) | 3.1 | 3.3 | 3.7 |
| FSC threshold | 0.143 | 0.143 | 0.143 |
| Model to map correlation | 0.87 | 0.83 | 0.78 |
| Model composition | |||
| Non-hydrogen atoms | 21,953 | 23,986 | 24,127 |
| Protein residues | 2746 | 2869 | 2886 |
| DNA residues | - | 51 | 51 |
| Ligand molecules | 1 (Mg2+) | 1 (ADPNP) 1 (Mg2+) | 1 (ADPNP) 1 (Mg2+) |
| B factors (Å2) | |||
| Protein | 89.5 | 72.0 | 68.0 |
| DNA | - | 168.5 | 162.6 |
| Ligand | 61.0 | 50.0 | 54.5 |
| R.m.s. deviations | |||
| Bond lengths (Å) | 0.004 | 0.003 | 0.002 |
| Bond angles (°) | 0.617 | 0.493 | 0.464 |
| Validation | |||
| MolProbity score | 1.4 | 1.5 | 1.5 |
| Clashscore | 7.5 | 6.0 | 5.7 |
| Poor rotamers (%) | 0.5 | 1.4 | 1.5 |
| Ramachandran plot | |||
| Favoured (%) | 99.3 | 98.9 | 98.9 |
| Allowed (%) | 0.7 | 1.1 | 1.1 |
| Disallowed (%) | 0.0 | 0.0 | 0.0 |
Additional files
Download links
A two-part list of links to download the article, or parts of the article, in various formats.
Downloads (link to download the article as PDF)
Open citations (links to open the citations from this article in various online reference manager services)
Cite this article (links to download the citations from this article in formats compatible with various reference manager tools)
Structures of RecBCD in complex with phage-encoded inhibitor proteins reveal distinctive strategies for evasion of a bacterial immunity hub
eLife 11:e83409.
https://doi.org/10.7554/eLife.83409


