Conserved allosteric inhibition mechanism in SLC1 transporters
- Department of Chemistry, Binghamton University, United States
- Department of Pharmacological Sciences, Icahn School of Medicine at Mount Sinai, United States
Figures
Figure 1 with 1 supplement
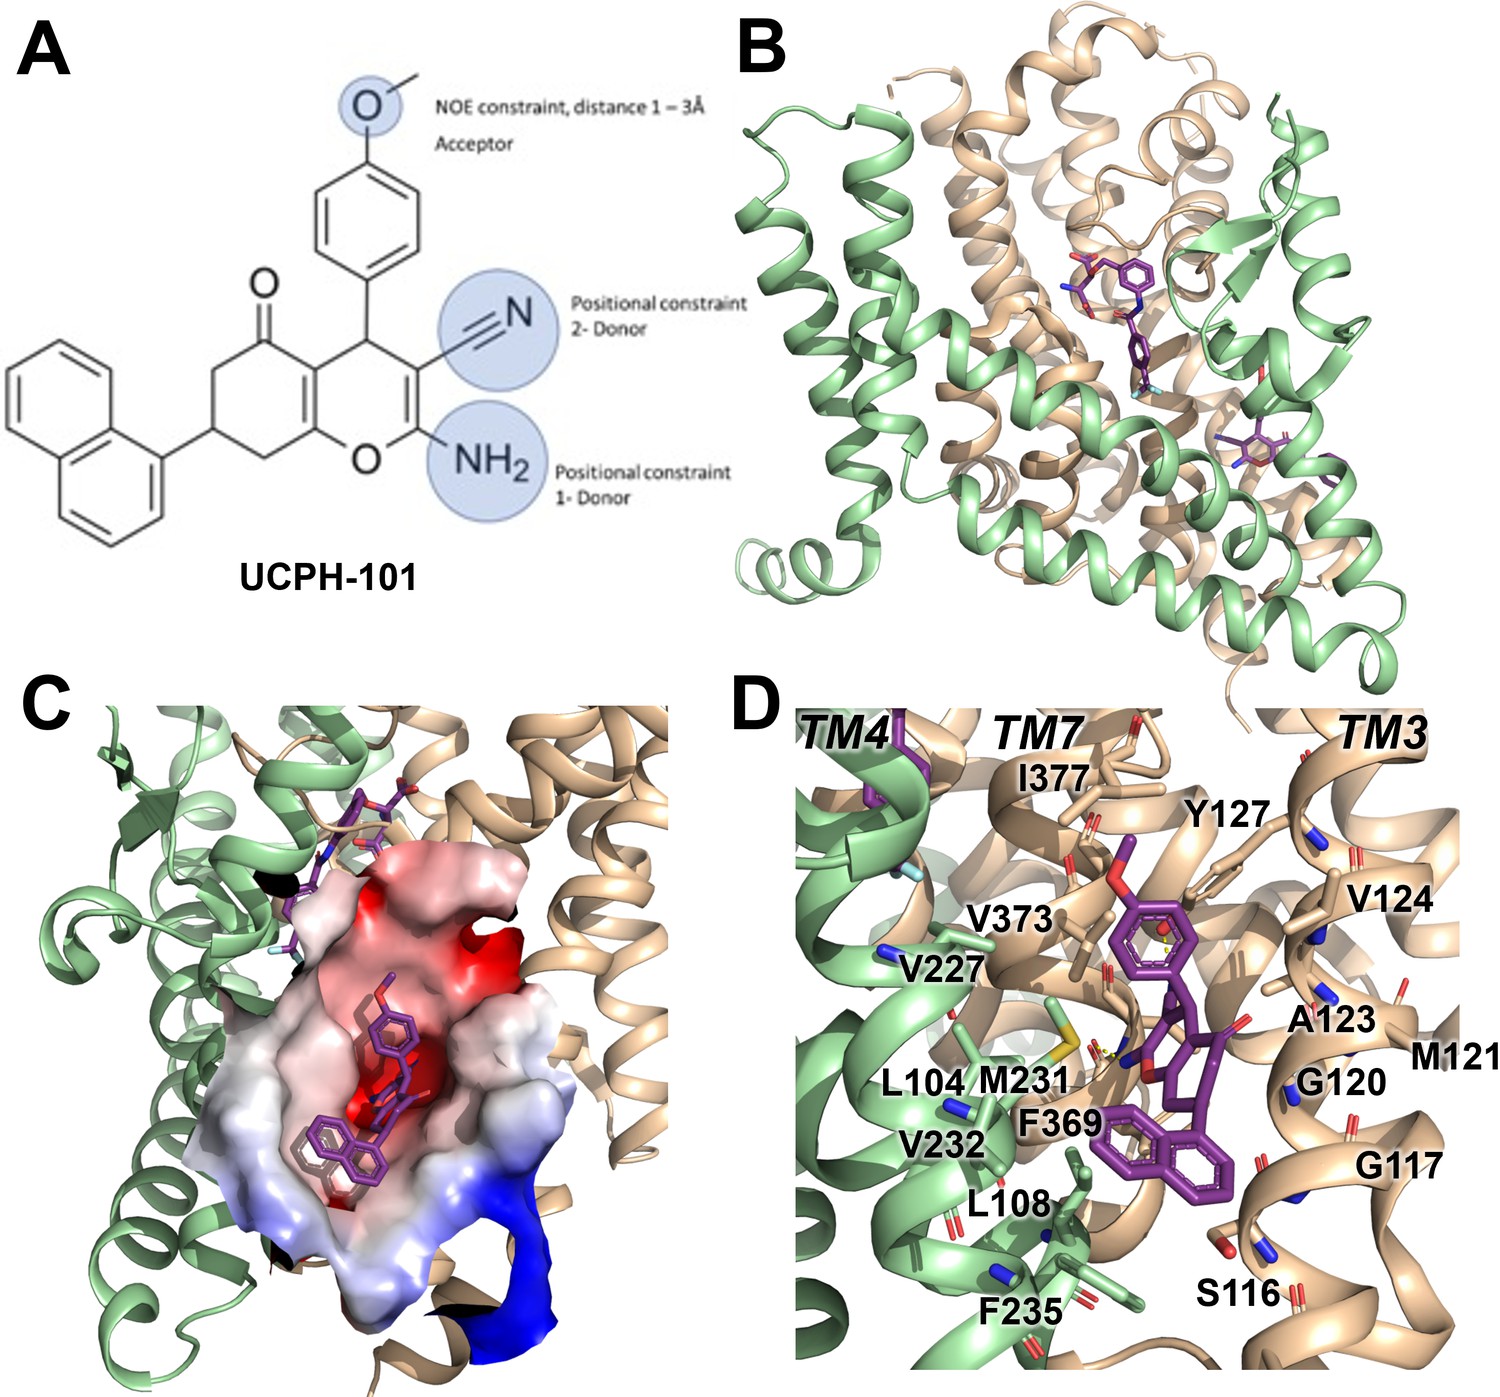
Structure of the excitatory amino acid transporter 1 (EAAT1) UCPH-101-bound state.
(A) UCPH-101 structure and substituents used for constraints in docking calculations. (B) EAAT1 structure (PDB id: 5MJU) in complex with the competitive inhibitor TFB-TBOA ((3S)-3-[[3-[[4-(trifluoromethyl)benzoyl]amino]phenyl]methoxy]-L-aspartic acid) (cyan sticks) in the substrate binding site and the allosteric inhibitor UCPH-101 (purple sticks) in the allosteric site. The trimerization and transport domain are highlighted in light green and orange, respectively. (C) Illustration of the UCPH-101 binding site at the domain interface. The electrostatic surface calculated using the Adaptive Poisson-Boltzmann Solver (APBS) plugin in Pymol (default parameters) in the absence of UCPH-101 is highlighted. (D) EAAT1 transmembrane (TM) helices and amino acid residues in proximity to the UCPH-101 binding site.
Figure 1—figure supplement 1
EAAT1/ASCT2/ASCT1 sequence alignment.
Sequence alignment was performed with Bioedit software, total alignment length: 571 amino acid, 220 identical residues, 109 similar residues. EAAT1 and ASCT2 show 38.53% identity and 57.62% similarity. The position of mutants F136Y, I237M are highlighted. EAAT1, excitatory amino acid transporter 1; ASCT1, alanine serine cysteine transporter 1.
Figure 2
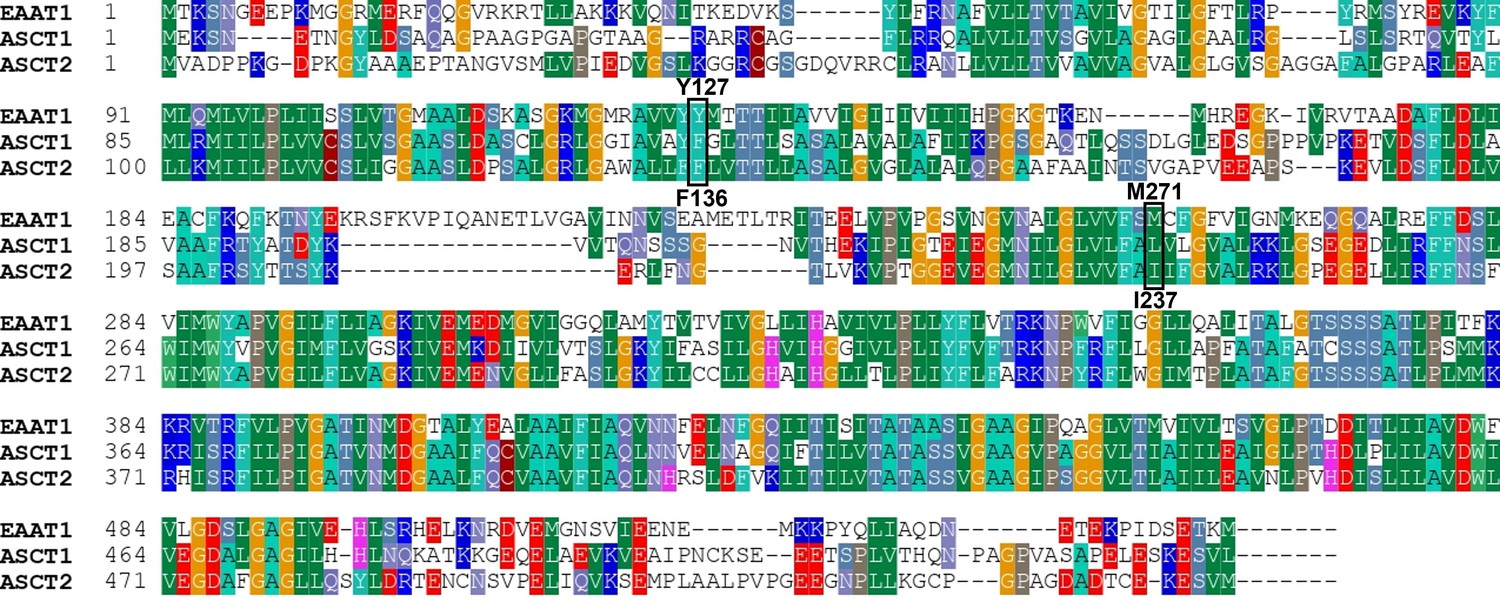
Alanine serine cysteine transporter 2 (ASCT2) structures and predicted allosteric binding site.
(A) ASCT2 structure (PDB id 7BCS) with the competitive inhibitor L-cis-PBE (cyan sticks). The trimerization and transport domains are highlighted in dark green and dark orange, respectively. (B) Illustration of the putative allosteric binding site (UCPH-101 binding site in excitatory amino acid transporter 1 [EAAT1]) at the domain interface. The electrostatic surface of the binding site is highlighted. (C) Close-up view of the putative ASCT2 allosteric binding site; UCPH-101 coordinates (purple sticks) were derived from the EAAT1 structure in the corresponding site.
Figure 3 with 1 supplement

UCPH-101 is a high-affinity, non-competitive inhibitor of excitatory amino acid transporter 1 (EAAT1) anion current.
(A) Typical whole-cell current recordings in the absence (black) and presence of 2 μM (red) and 100 μM (blue) UCPH-101. [Glutamate] was 100 μM. Experiments were performed using 140 mM sodium methanesulfonate (NaMes) in the extracellular buffer, and 130 mM KSCN intracellularly (forward transport conditions). (B) Dose-response curves to determine the apparent Ki for UCPH-101 at increasing glutamate concentration of 100 μM (black, n=16), 200 μM (red, n=19), and 300 μM (blue, n=13). (C) Glutamate concentration dependence of the apparent Ki for UCPH-101 suggests non-competitive inhibition mechanism. All experiments were performed at 0 mV membrane potential.
-
Figure 3—source data 1
The source data contains original current traces for Figure 3A, and the original data for panels (B) and (C).
- https://cdn.elifesciences.org/articles/83464/elife-83464-fig3-data1-v3.xlsx
Figure 3—figure supplement 1

Excitatory amino acid transporter 1 (EAAT1) anion current is inhibited by UCPH-101 independent of voltage.
Voltage dependence of EAAT1 anion currents under forward transport conditions, activated using 500 μM extracellular Glu (n=13) (A) or 500 μM Glu in the presence of 50 μM UCPH-101 (n=14) (B). The voltage jump protocol is shown in the top panels. The extracellular solution contained 140 mM sodium methanesulfonate (NaMes), the intracellular solution contained 130 mM KSCN. The anion current-voltage relationship at steady state is shown in (C). Non-specific background currents were subtracted using 200 μM TBOA.
-
Figure 3—figure supplement 1—source data 1
The source data contains the current traces for Figure 3—figure supplement 1A and B, and the original data for panel (C).
- https://cdn.elifesciences.org/articles/83464/elife-83464-fig3-figsupp1-data1-v3.xlsx
Figure 4 with 1 supplement
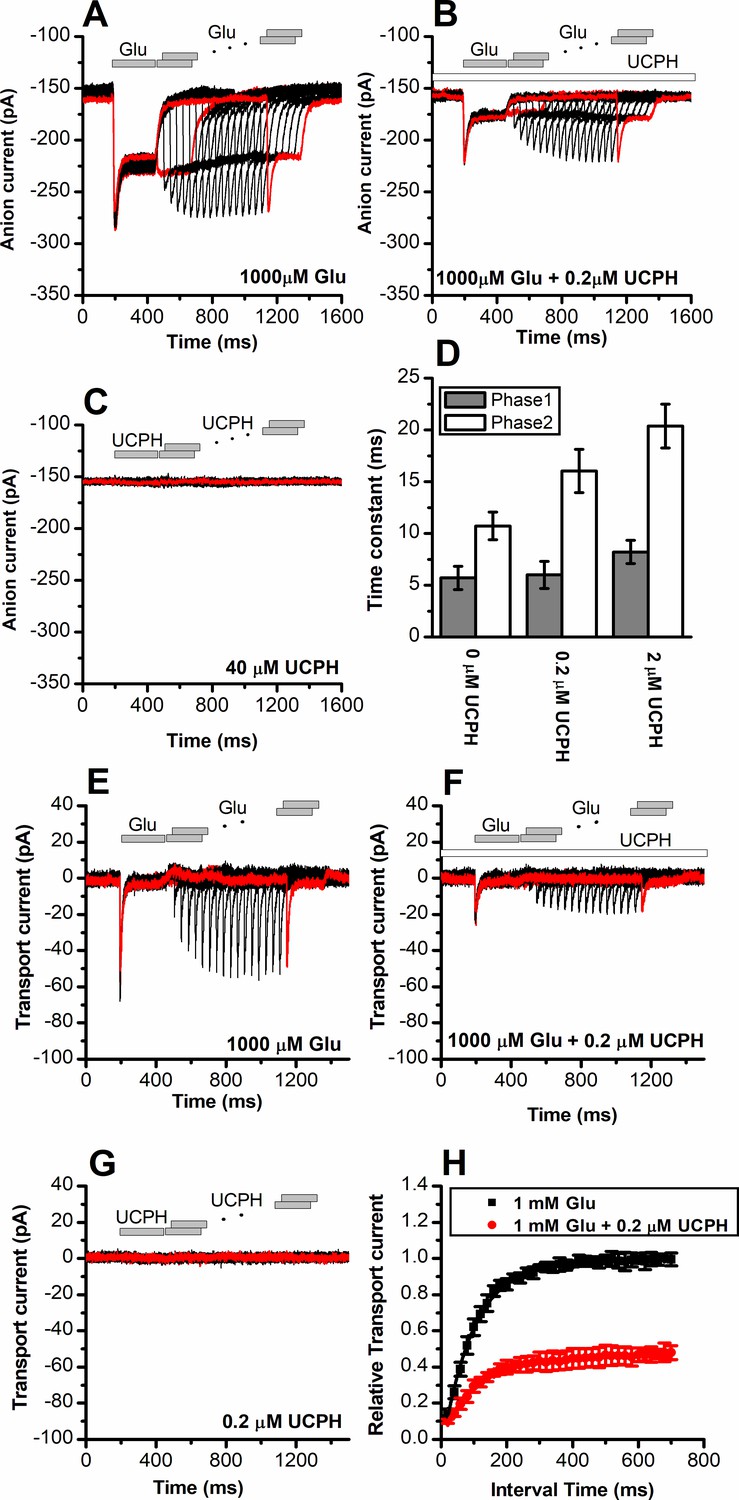
UCPH-101 has only minor effect on recovery kinetics of excitatory amino acid transporter 1 (EAAT1) current after glutamate removal.
(A) Anion currents in response to two pulses of rapid glutamate application (1 mM), with varying inter-pulse interval (pulse protocol shown at the top) under forward transport conditions. The intracellular solution contained 130 mM KSCN, the extracellular solution contained 140 mM sodium methanesulfonate (NaMes). (B) Similar experiment as in (A), but in the presence of 0.2 μM UCPH-101 (pre-incubated for 5 min, see open bar for timing of solution exchange, top of the figure). (C) Application of UCPH-101 alone did not induce any currents. (D) Time constants for the fast and slow phase of the current recovery, for the two exponential components. (E–G) Experiments similar to (A–C), but for the transport component of the current (the permeant intracellular anion, SCN-, was replaced with the non-permeant Mes- anion). (H) Recovery of the transient current in the presence and absence of 0.2 μM UCPH-101. The membrane potential was 0 mV in all experiments.
-
Figure 4—source data 1
Current traces for Figure 3A,B,C,E,F and G, and the original data for panels (D) and (H).
- https://cdn.elifesciences.org/articles/83464/elife-83464-fig4-data1-v3.xlsx
Figure 4—figure supplement 1
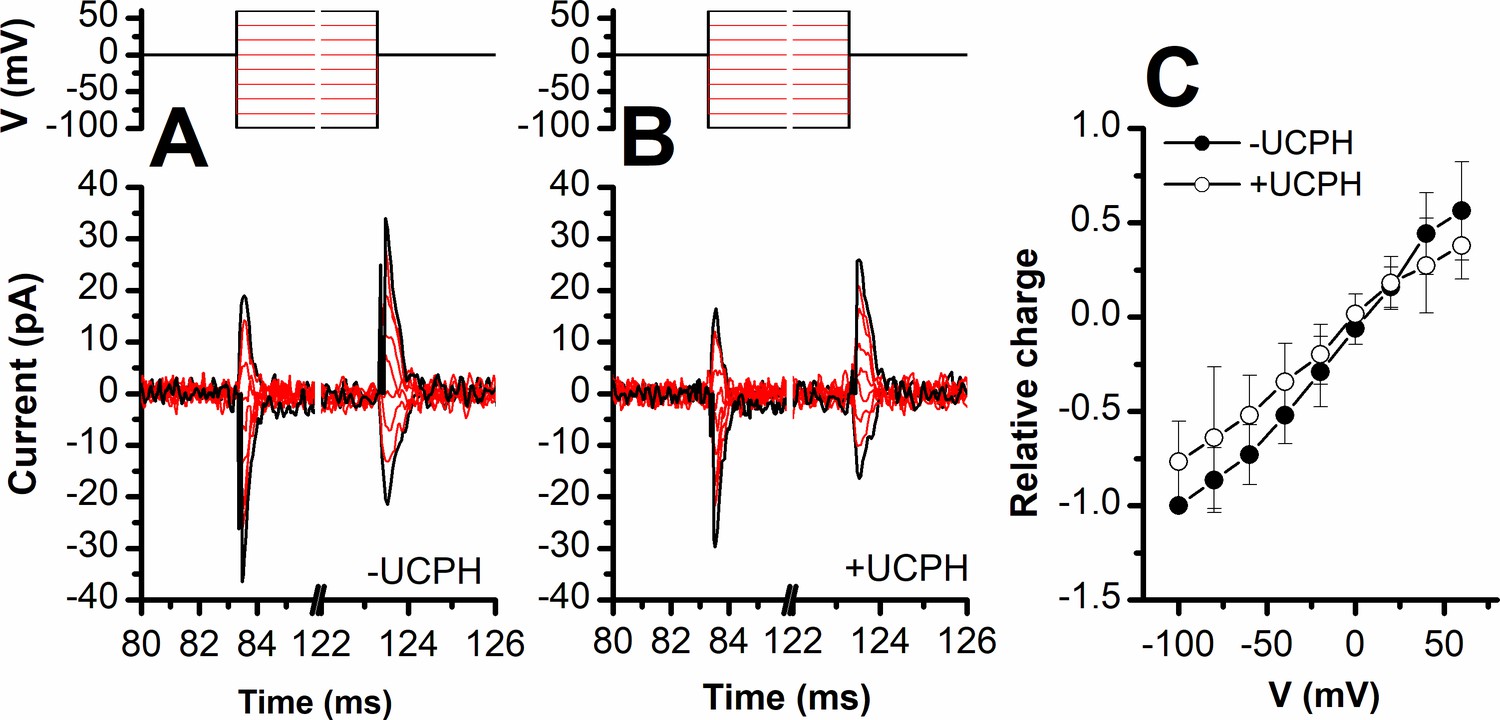
UCPH-101 does not eliminate, but reduces capacitive charge movement caused by Na+ binding to the apo-form of excitatory amino acid transporter 1 (EAAT1).
Voltage jumps (protocol shown in top panel) were used to disturb the Na+ binding equilibrium in the apo-form of EAAT1 (absence of glutamate). (A) and (B) show the transient currents caused by Na+ moving into and out of the binding site in the absence and presence of UCPH-101 (50 μM), respectively. Experiments were performed using extracellular solutions containing 140 mM sodium methanesulfonate (NaMes) and intracellular solutions containing 130 mM KMes. Unspecific currents were subtracted using 200 μM TBOA. (C) Charge movements were integrated from the transient current signals and plotted as a function of the membrane potential. The closed and open circles show relative charge movements in the absence (n=8), and presence of 50 μM UCPH-101 (n=8), respectively.
-
Figure 4—figure supplement 1—source data 1
Original current traces for Figure 4—figure supplement 1A and B, and the original data for panel (C).
- https://cdn.elifesciences.org/articles/83464/elife-83464-fig4-figsupp1-data1-v3.xlsx
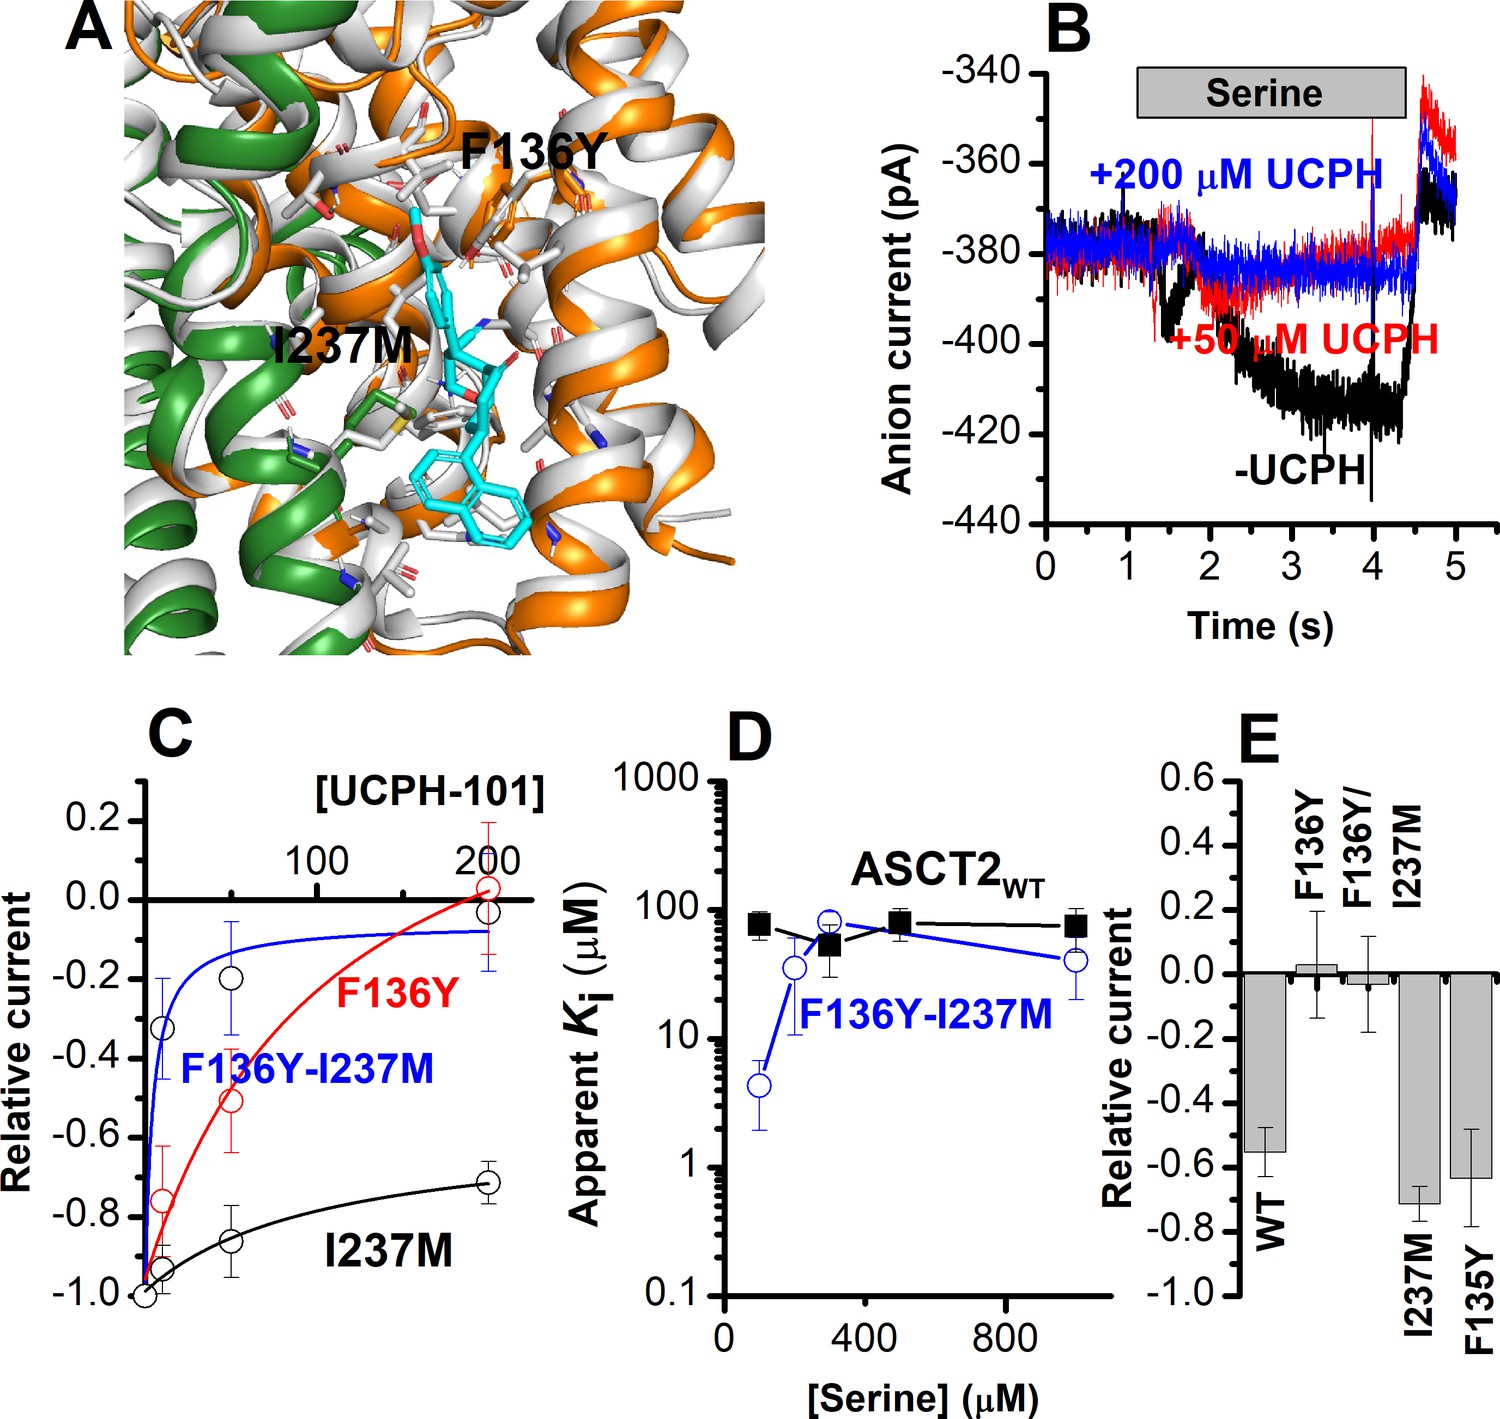
Figure 5 with 1 supplement
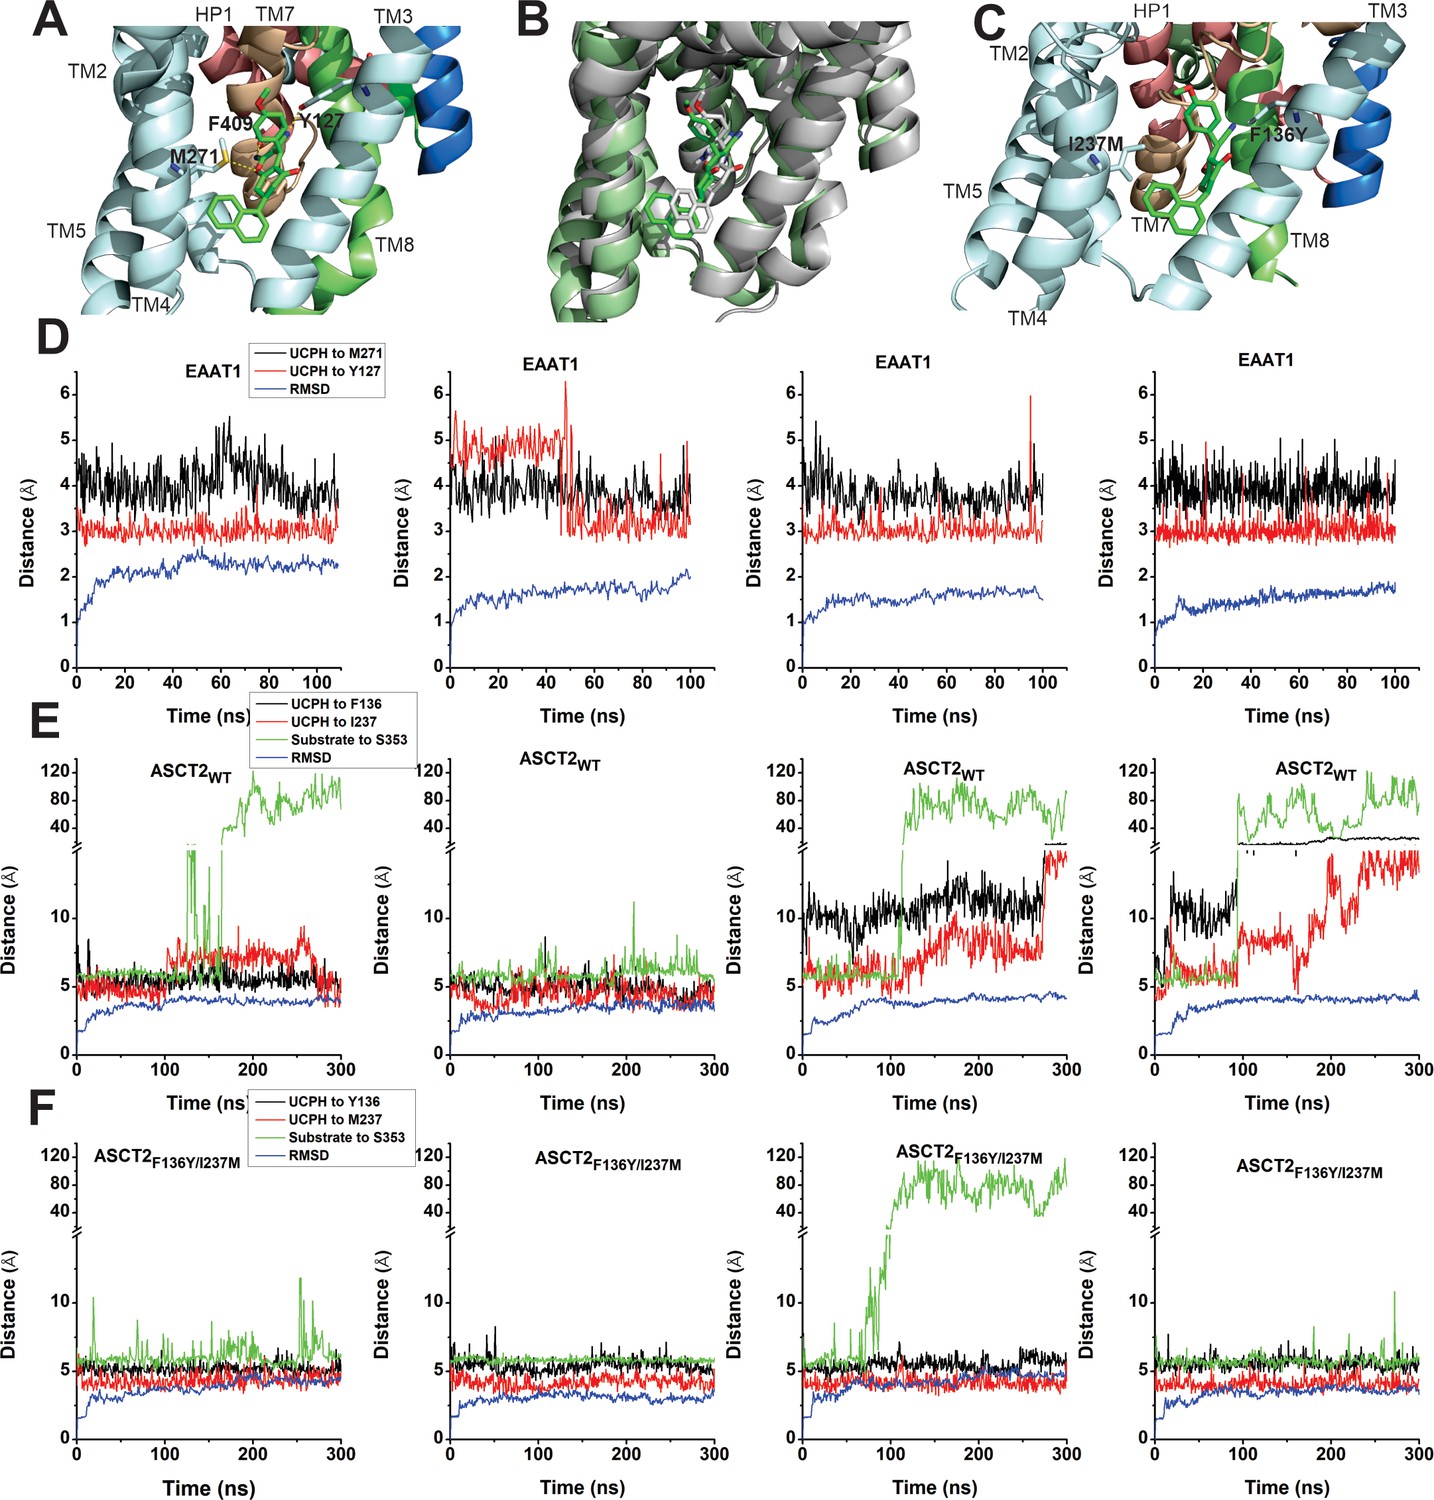
EAAT1, ASCT2WT, and ASCT2F136Y/I237M residues contribute to UCPH-101 stability in the binding site.
(A) Original state of the EAAT1-UCPH-101 complex from structure 5LLM (Canul-Tec et al., 2017). Y127 and M271 (EAAT1 sequence number) contribute to the EAAT1-UCPH-101 interaction. The binding state before (green) and after (gray) 100 ns molecular dynamics (MD) simulation are shown in (B). (C) Original state of the docked ASCT2WT-UCPH-101 complex (7BCS) with modeled side chains. Trajectories for four independent simulations runs for EAAT1, ASCT2WT, and ASCT2F136Y/I237M (one UCPH-101 molecule at each subunit interface) were analyzed and are shown from (D) to (F) (distance calculation [red, black (UCPH-101), green (amino acid substrate)] and RMSD distance [blue]). For distance calculations, in EAAT1, we selected atoms Y127(CA) and M271(CA) for EAAT1 and (O) and (N) for UCPH-101 (Materials and methods) as reference atoms. In ASCT2WT, we selected atoms F136(CZ) and I237(CD) for ASCT2WT and (N1) and (O2) for UCPH-101. In ASCT2F136Y/I237M distance calculation, we selected atoms Y136(OH) and M237(SD) from the transporter, and (N1) and (O2) from UCPH-101 as reference.
-
Figure 5—source data 1
Trajectory and RMSD data for panels (D-F).
- https://cdn.elifesciences.org/articles/83464/elife-83464-fig5-data1-v3.xlsx
Figure 5—figure supplement 1
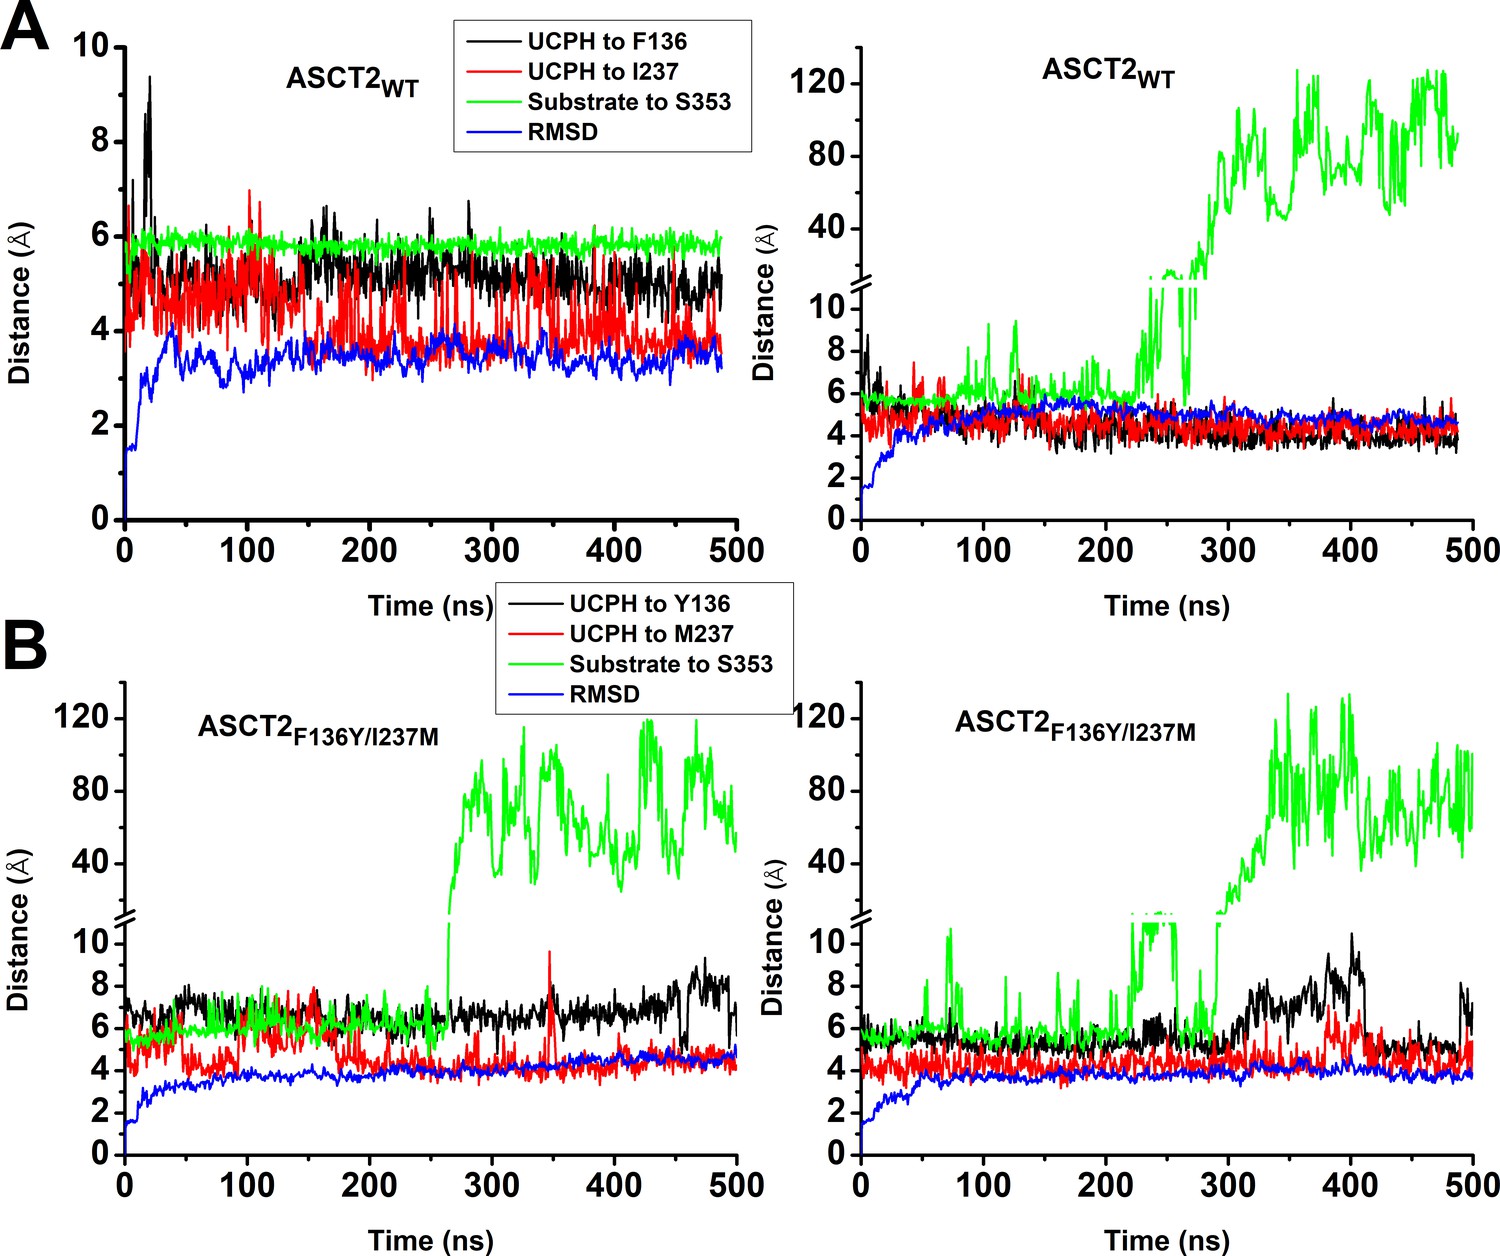
Molecular dynamics (MD) simulations to 500 ns for ASCT2WT and ASCT2F136Y/I237M.
Conditions were as described in the legend of Figure 5.
-
Figure 5—figure supplement 1—source data 1
Trajectory and RMSD data.
- https://cdn.elifesciences.org/articles/83464/elife-83464-fig5-figsupp1-data1-v3.xlsx
Figure 6 with 1 supplement
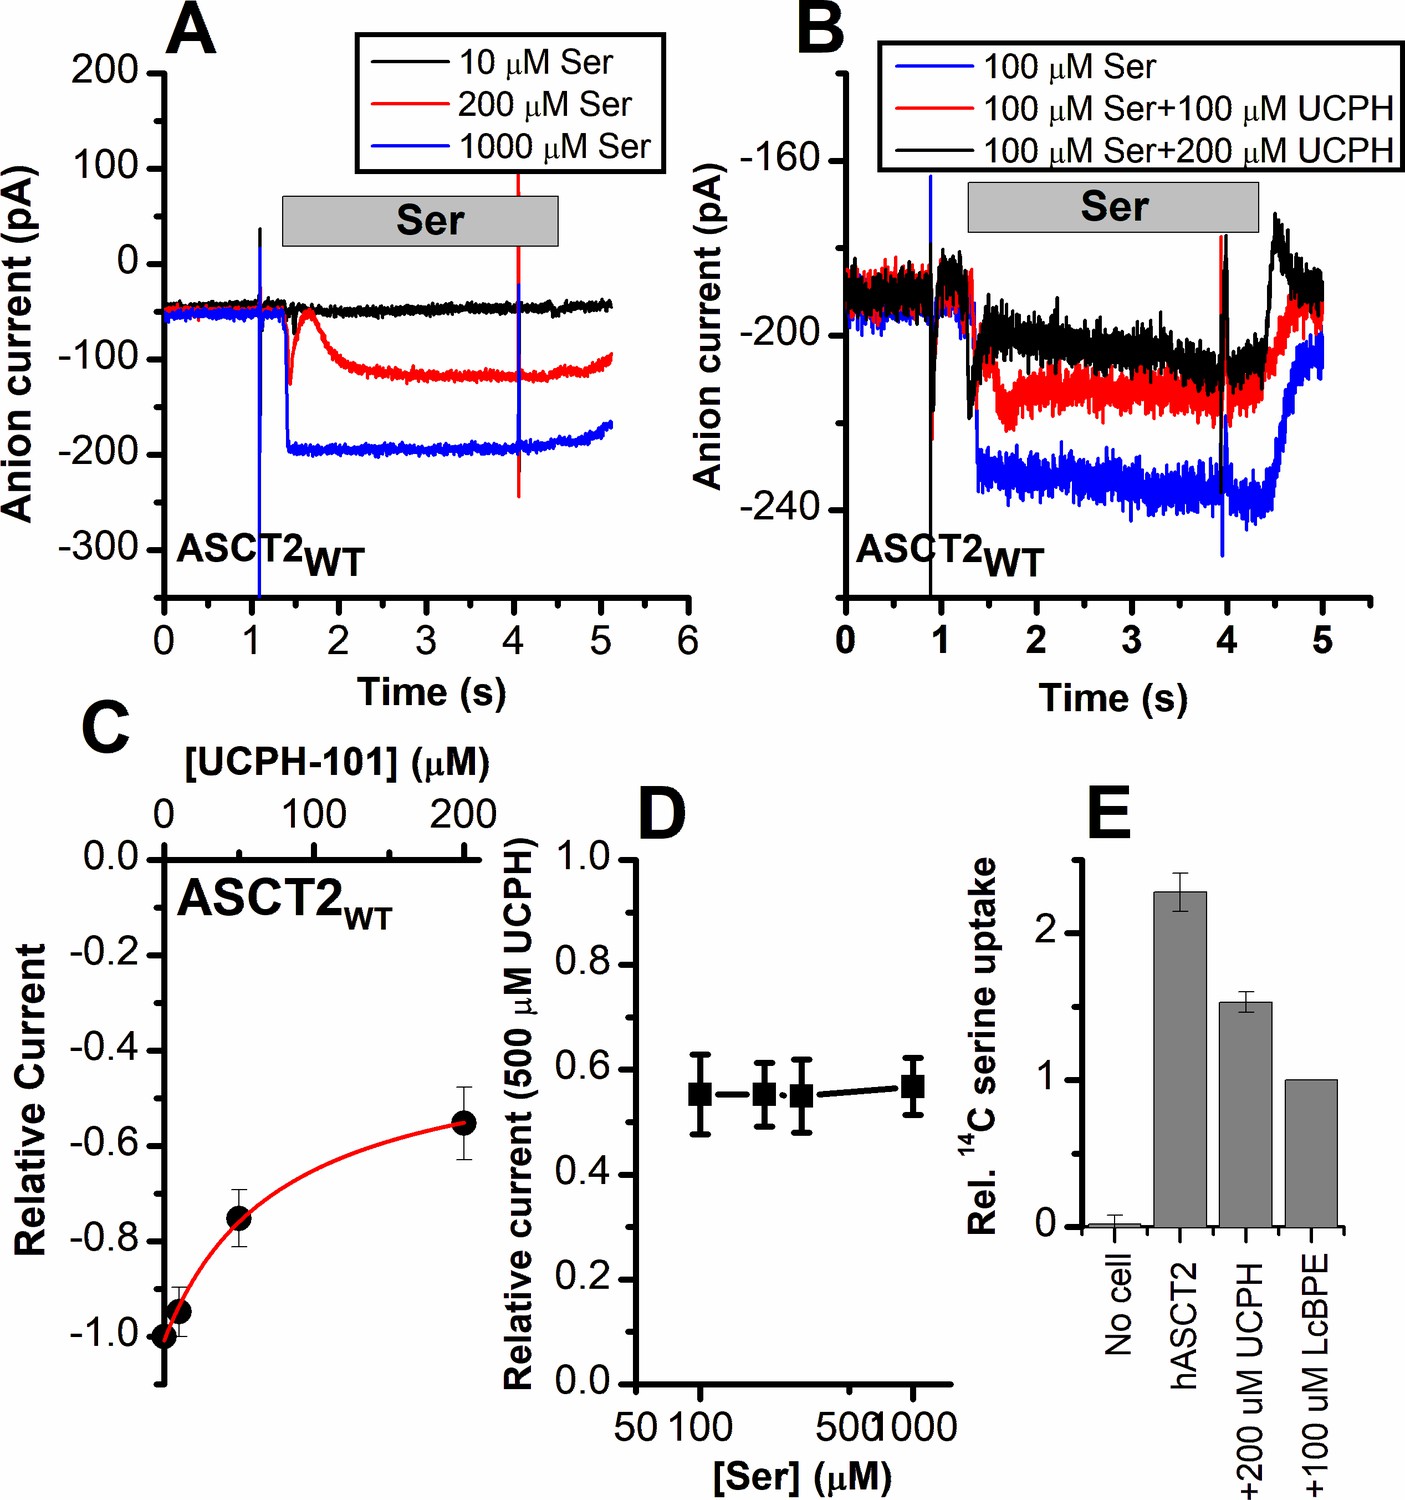
Alanine serine cysteine transporter 2 (ASCT2) amino acid-induced anion current is partially inhibited by UCPH-101.
(A) Typical serine-induced ASCT2 anion current increases with increasing serine concentrations. The extracellular solution contained 140 mM sodium methanesulfonate (NaMes), with 130 mM NaSCN, and 10 mM Ser incorporated into the whole-cell recording electrode. The application time for serine is indicated by the gray bar. The apparent affinity for Ser were calculated as Km = 280 ± 40 μM. (B) Same experiment as in (A) at 100 μM Ser, but in the presence of UCPH-101 at three concentrations. (C) UCPH-101 dose-response curve at 100 μM Ser (n=15). (D) Relative current at saturating [UCPH-101], shown at varying Ser concentrations. (E) Uptake of 14C serine in hASCT2-expressing HEK293 cells in the absence and presence of 200 μM UCPH-101. Competitive ASCT2 inhibitor L-cis-BPE was used at a saturating concentration to determine specific uptake by ASCT2.
-
Figure 6—source data 1
Original current traces for Figure 6A and B, and the original data for panels (C-E).
- https://cdn.elifesciences.org/articles/83464/elife-83464-fig6-data1-v3.xlsx
Figure 6—figure supplement 1
ASCT2F136Y/I237M anion current is inhibited by UCPH-101 independent of voltage.
Voltage dependence of ASCT2F136Y/I237M anion currents under forward transport conditions, activated using 500 μM extracellular Ser (n=13) (A) or 500 μM Ser in the presence of 200 μM UCPH-101 (B). The voltage jump protocol is shown in the top panels. The extracellular solution contained 140 mM sodium methanesulfonate (NaMes), the intracellular solution contained 130 mM NaSCN and 10 mM Ser. The anion current-voltage relationship at steady state is shown in (C). Background currents were obtained by application of 140 mM NMG-Mes and then subtracted to generate the ASCT2F136Y/I237M-specific currents.
-
Figure 6—figure supplement 1—source data 1
Current traces for Figure 6—figure supplement 1A and B, and the original data for panel (C).
- https://cdn.elifesciences.org/articles/83464/elife-83464-fig6-figsupp1-data1-v3.xlsx
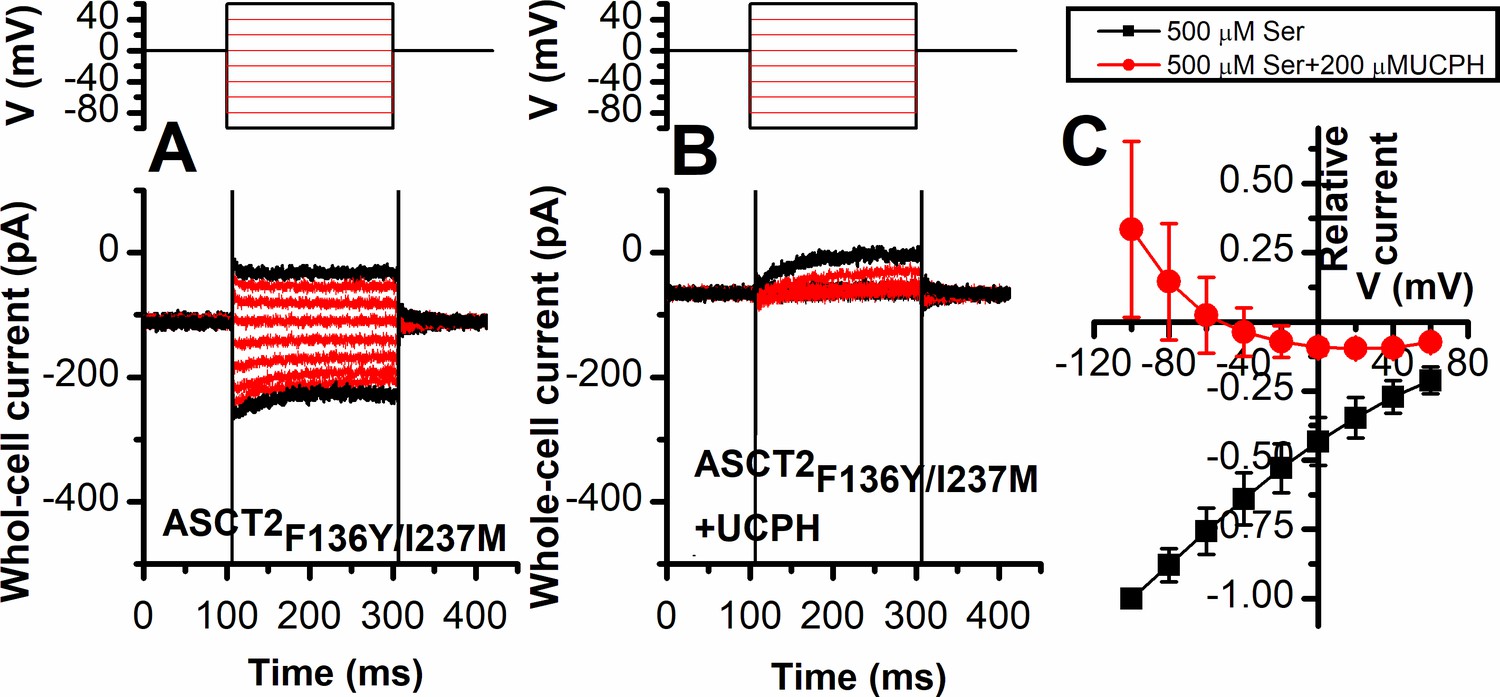
Figure 7
The F136Y/I237M ASCT2 double mutation restores complete inhibition of anion current by UCPH-101.
(A) Predicted binding pose of UCPH-101 (cyan sticks) to the F136Y/I237M-double-mutant ASCT2 transporter (the trimerization and transport domains are highlighted in dark green and dark orange, respectively) in overlay with EAAT1 (white). (B) Typical whole-cell current recordings for ASCT2F136Y/I237M at 100 μM serine. (C) Dose-response curves for ASCT2WT (black), and the F136 (red) and F136Y/I237M (blue) mutant transporters. Blocking effects were measured at a serine concentration of 100 μM and at 0 mV transmembrane potential. (D) UCPH-101 apparent inhibition constant (Ki) plotted as a function of the serine concentration. (E) Comparison of steady-state current at 100 μM Ser and 200 μM UCPH-101, wild-type ASCT2 currents without UCPH-101 were set as reference to 1, error bars represent ± SD.
-
Figure 7—source data 1
Current traces for Figure 7B, and the original data for panels (C-E).
- https://cdn.elifesciences.org/articles/83464/elife-83464-fig7-data1-v3.xlsx
Figure 8
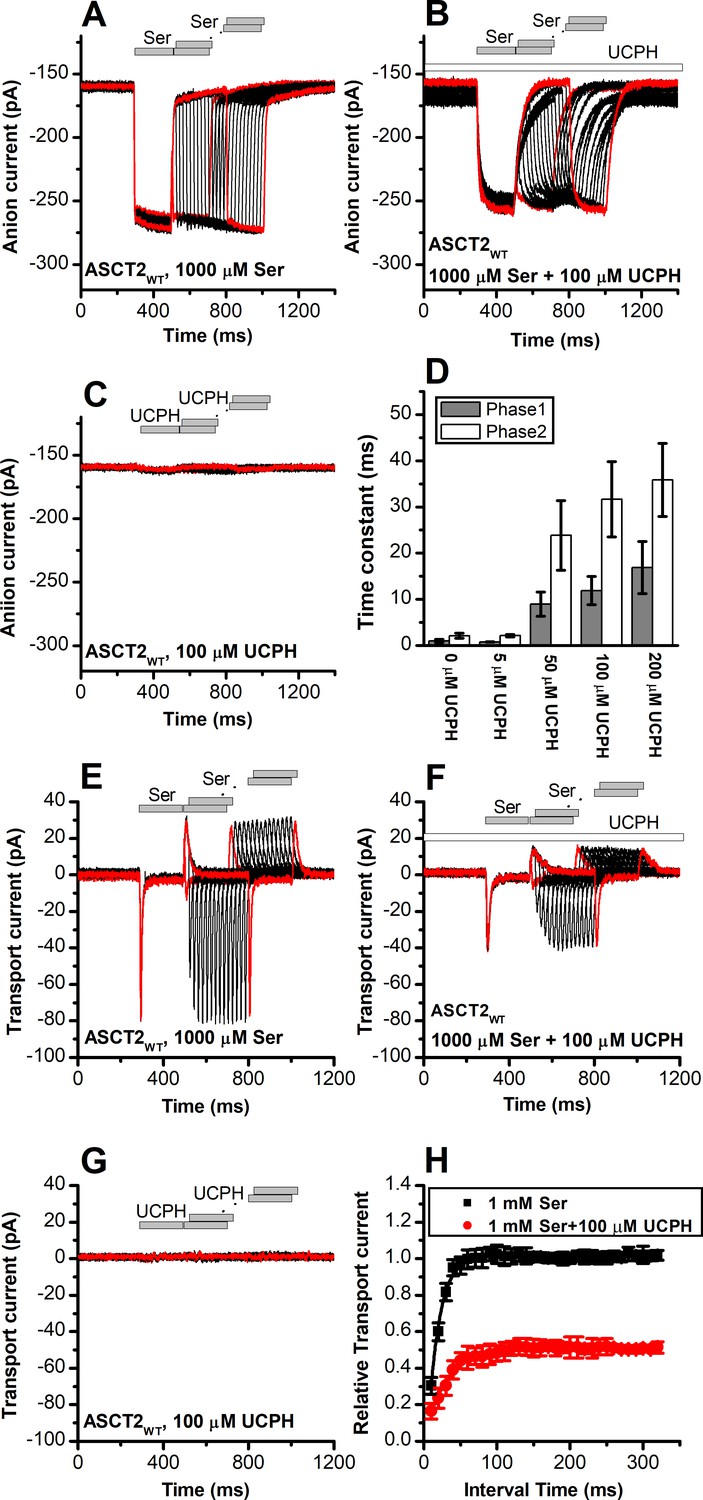
UCPH-101 slows kinetics of alanine serine cysteine transporter 2 (ASCT2) current onset and recovery after amino acid removal.
(A) Anion currents in response to two pulses of rapid serine application (1 mM), with varying inter-pulse interval (pulse protocol shown at the top) under homo-exchange conditions. The intracellular solution contained 130 mM NaSCN/10 mM serine, the extracellular solution contained 140 mM sodium methanesulfonate (NaMes). (B) Similar experiment as in (A), but in the presence of 100 μM UCPH-101 (pre-incubated for 5 min, see open bar for timing of solution exchange, top of the figure). (C) Application of UCPH-101 alone did not induce any currents. (D) Time constants for the fast and slow phase of the current recovery, for the two exponential components. (E–G) Experiments similar to (A–C), but for the transport component of the current (the permeant intracellular anion, SCN-, was replaced with the non-permeant Mes- anion). (H) Recovery of the transient current in the presence and absence of 100 μM UCPH-101. The membrane potential was 0 mV in all experiments.
-
Figure 8—source data 1
Original current traces for Figure 8A,B,C,E,F and G, and the original data for panels (D) and (H).
- https://cdn.elifesciences.org/articles/83464/elife-83464-fig8-data1-v3.xlsx
Figure 9 with 1 supplement
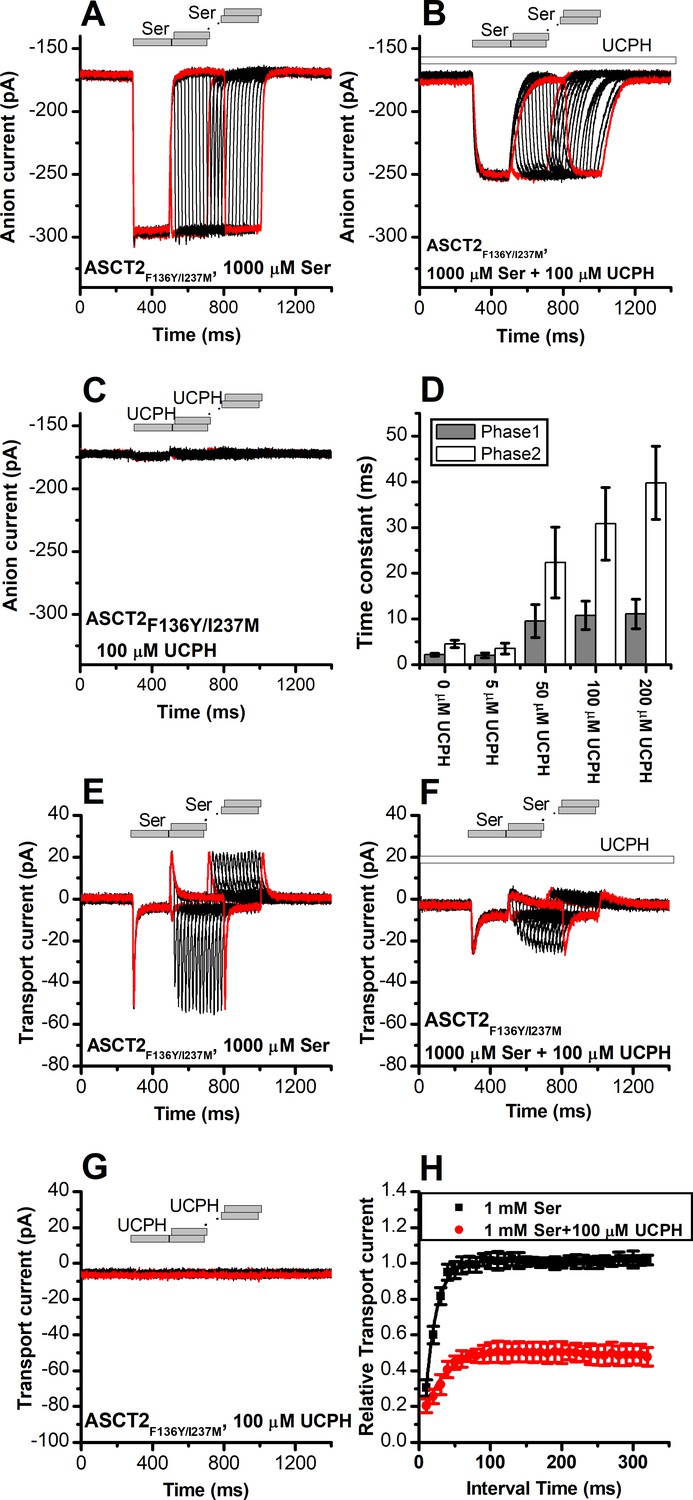
UCPH-101 slows kinetics of ASCT2F136Y/I237M current onset and recovery after amino acid removal.
(A) Anion currents in response to two pulses of rapid serine application (1 mM), with varying inter-pulse interval (pulse protocol shown at the top) under homo-exchange conditions in an ASCT2F136Y/I237M-expressing cell. The intracellular solution contained 130 mM NaSCN/10 mM serine, the extracellular solution contained 140 mM sodium methanesulfonate (NaMes). (B) Similar experiment as in (A), but in the presence of 100 μM UCPH-101 (pre-incubated for 5 min, see open bar for timing of solution exchange, top of the figure). (C) Application of UCPH-101 alone did not induce any currents. (D) Time constants for the fast and slow phase of the current recovery, for the two exponential components. (E–G) Experiments similar to (A–C), but for the transport component of the current (the permeant intracellular anion, SCN-, was replaced with the non-permeant Mes- anion). (H) Recovery of the transient current in the presence and absence of 100 μM UCPH-101. The membrane potential was 0 mV in all experiments.
-
Figure 9—source data 1
Original current traces for Figure 9A,B,C,E,F and G, and the original data for panels (D) and (H).
- https://cdn.elifesciences.org/articles/83464/elife-83464-fig9-data1-v3.xlsx
Figure 9—figure supplement 1

UCPH-101 does not eliminate, but reduces capacitive charge movement caused by Na+ binding to the apo-form of ASCT2F136Y and ASCT2F136Y/I237M.
Voltage jumps (protocol shown in top panel) were used to disturb the Na+ binding equilibrium in the apo-form of ASCT2F136Y/I237M (absence of amino acid substrate). (A) and (B) show the transient currents caused by Na+ moving into and out of the binding site in the absence and presence of UCPH-101 (200 μM), respectively. Experiments were performed using extracellular solutions containing 140 mM sodium methanesulfonate (NaMes) and intracellular solutions containing 130 mM NaMes and 10 mM serine. (C, D) Charge movements were integrated from the transient current signals and plotted as a function of the membrane potential for ASCT2F136Y/I237M (C, n=18) and ASCT2F136Y (D, n=18) in the absence (black squares) and presence (red circles) of 200 μM UCPH-101, respectively.
-
Figure 9—figure supplement 1—source data 1
Original current traces for Figure 9—figure supplement 1A and B, and the original data for panels (C) and (D).
- https://cdn.elifesciences.org/articles/83464/elife-83464-fig9-figsupp1-data1-v3.xlsx
Figure 10
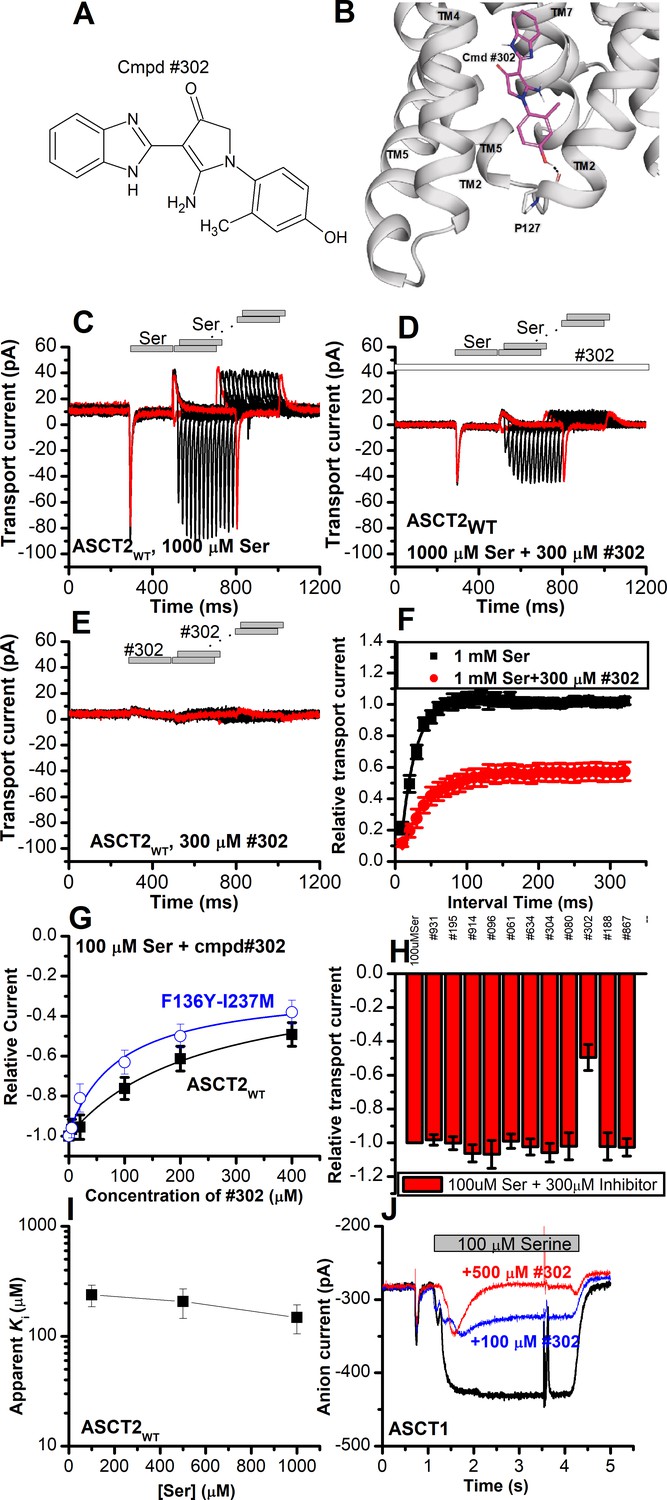
Novel Cmpd #302, identified by docking analysis, is a partial inhibitor of alanine serine cysteine transporter 2 (ASCT2) transient transport current.
(A) Chemical structure of compound #302. (B) Predicted docking pose of compound #302 in the ASCT2 allosteric binding site. (C) Anion currents in response to two pulses of rapid serine application (1 mM), with varying inter-pulse interval (pulse protocol shown at the top) under homo-exchange conditions in an ASCT2-expressing cell. The intracellular solution contained 130 mM sodium methanesulfonate (NaMes)/10 mM serine, the extracellular solution contained 140 mM NaMes. (D) Similar experiment as in (A), but in the presence of 300 μM #302 (pre-incubated for 5 min, see open bar for timing of solution exchange, top of the figure). (E) Application of #302 alone did not induce any currents in ASCT2. (F) Recovery of the transient current in the presence and absence of 300 μM #302. The membrane potential was 0 mV in all experiments. (G) UCPH-101 dose-response curve at 100 μM Ser for ASCT2WT (black, n=18) and the F136Y-I237M double-mutant transporter (blue, n=14). (H) Comparison of steady-state current at 100 μM Ser and 300 μM inhibitors, wild-type ASCT2 currents without inhibitor were set as reference to 1, error bars represent ± SD. (I) Apparent Ki of ASCT2WT for #302 as a function of the serine concentration, indicating a non-competitive inhibition mechanism. (J) Inhibition of ASCT1 serine-induced anion current (100 μM serine, time of application indicated by the gray bar). The voltage was 0 mV. Serine and #302 were applied at the same time.
-
Figure 10—source data 1
Original current traces for Figure 10C,D,E and J, and the original data for panels (F-I).
- https://cdn.elifesciences.org/articles/83464/elife-83464-fig10-data1-v3.xlsx
Figure 11
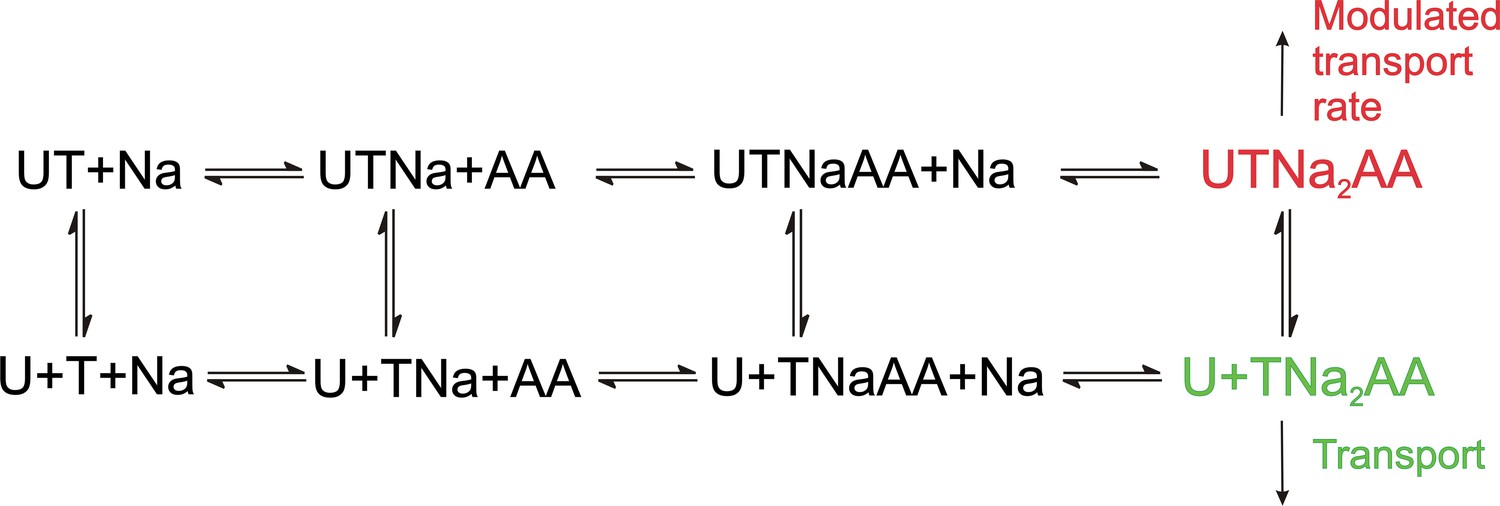
Proposed simplified mechanism of inhibitors (U) targeting the allosteric binding site interacting with alanine serine cysteine transporter 2 (ASCT2) and excitatory amino acid transporter 1 (EAAT1) transporters (T).
The amino acid substrate is abbreviated as AA. Potential charges of the cation (Na+) and the transporter/substrate were omitted for simplicity, and only two of the three Na+ binding steps are shown. For UCPH-101 interaction with EAAT1 the UCPH binding/dissociation process (transition from the first to the second row of the scheme) is slow, while this transition is fast for ASCT2, accounting for the differential effect of UCPH-101 on transport kinetics of both transporters.
Tables
Table 1
Substrate selectivity of all alanine serine cysteine transporter 2 (ASCT2) mutants.
| Substrate binding affinity (μM) | Ala | Ser | Gln |
|---|---|---|---|
| WT | 290±50 | 280±40 | 190±30 |
| F135Y | 300±60 | 180±10 | 190±50 |
| F136Y | 280±70 | 790±130 | Insensitive |
| I237M | 230±20 | 300±70 | 270±50 |
| F136Y/I237M | 300±130 | 310±100 | Insensitive |
-
Table 1—source data 1
Original data for all Km values listed in Table 1.
- https://cdn.elifesciences.org/articles/83464/elife-83464-table1-data1-v3.xlsx
Additional files
-
MDAR checklist
- https://cdn.elifesciences.org/articles/83464/elife-83464-mdarchecklist1-v3.pdf
-
Source code 1
UCPH-101 parameter file.
- https://cdn.elifesciences.org/articles/83464/elife-83464-code1-v3.zip
-
Source code 2
UCPH-101 rtf file.
- https://cdn.elifesciences.org/articles/83464/elife-83464-code2-v3.zip
Download links
A two-part list of links to download the article, or parts of the article, in various formats.
Downloads (link to download the article as PDF)
Open citations (links to open the citations from this article in various online reference manager services)
Cite this article (links to download the citations from this article in formats compatible with various reference manager tools)
Conserved allosteric inhibition mechanism in SLC1 transporters
eLife 12:e83464.
https://doi.org/10.7554/eLife.83464


