Pericytes control vascular stability and auditory spiral ganglion neuron survival
- Oregon Hearing Research Center, Department of Otolaryngology/Head & Neck Surgery, Oregon Health & Science University, United States
- Life Sciences Division, Lawrence Berkeley National Laboratory, United States
- Biological Sciences, Sunnybrook Research Institute, Canada
- Department of Otolaryngology-Head & Neck Surgery, University of Toronto, Canada
- Department of Laboratory Medicine and Pathobiology, University of Toronto, Canada
Figures
Figure 1

Cochlear vascular networks in the spiral ganglion region are densely populated by pericytes, and spiral ganglion neurons (SGNs) contains particles released by pericytes.
(a and b) Illustrations of pericyte containing microvascular networks in the spiral ganglion region. (A) A confocal projection image of the spiral lamina from an NG2DsRedBAC mouse shows pericytes (red) situated on microvessels labeled with Lectin-Alexa Fluor 488 conjugate (green) around SGNs and their peripheral fibers labeled with an antibody for β-III tubulin (blue). The pericyte distribution can be better visualized under high magnification (A, lower). (B–D) Cross-talk between SGNs and pericytes is suggested by the red fluorescent particle (arrows) observed in SGNs (green). Further evidenced by 3D reconstructive images showing the particles are inside the soma of SGNs.
Figure 2
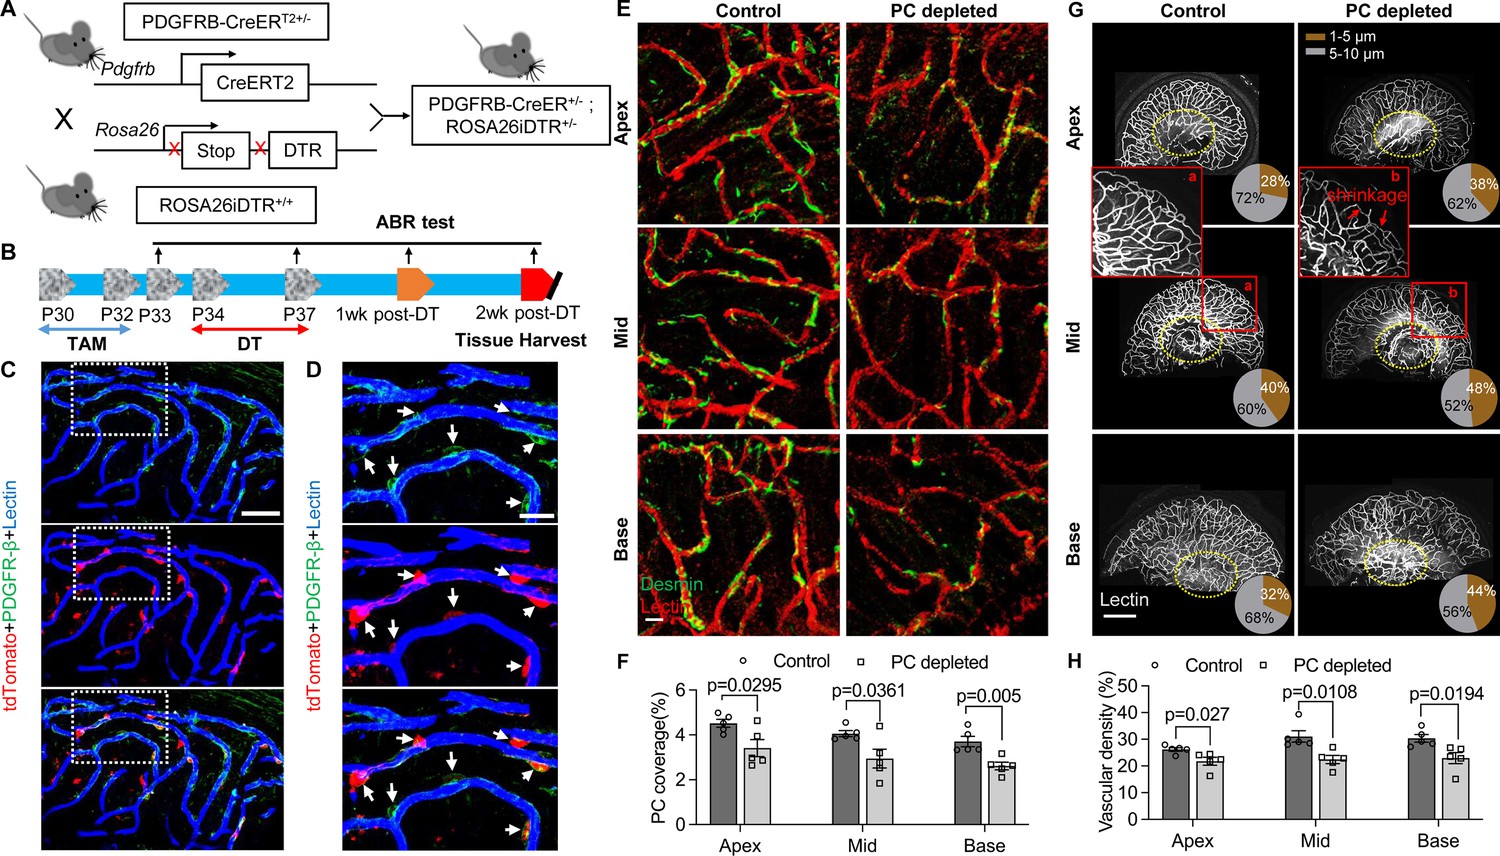
Pericyte-depletion induces vascular regression in the region of spiral ganglion neuron (SGN) peripheral nerve fibers in adult mice.
(A) Schematic of a pericyte-depletion mouse model incorporating an inducible Cre-loxP system. (B) The diagram shows the timeline of tamoxifen and diphtheria toxin (DT) administration and the time point of auditory brainstem response (ABR) test and tissue harvest. (C) Co-localization of PDGFRβ-Cre (tdTomato) and immune-labeled PDGFRβ (green) signals in the pericytes of PDGFRB-CreERT2; ROSA26tdTomato mice. (D) A high-magnification image further shows co-localization of the Cre and PDGFRβ fluorescence signals (arrows). (E) Representative figures show pericyte coverage in the region of the spiral limbus in DT-treated control inducible diphtheria toxin receptor (iDTR; left) and DT-treated PDGFRB-CreERT2; ROSA26iDTR mice (right) 2 wk after DT injection. DT injection significantly leads to loss of pericyte coverage. (F) Pericyte density was significantly reduced in the PDGFRB-CreERT2; ROSA26iDTR mice at the apical, middle, and basal turn relative to density in the control of iDTR mice (n=5, pApex=0.0295, pMid=0.0361, pBase=0.005, unpaired t test). (G) Representative figures show the capillaries of the spiral lamina in control ROSA26iDTR (left) and PDGFRB-CreERT2; ROSA26iDTR (right) mice, with the distribution of vessel diameter shown in π charts, and the location of SGNs shown in ellipses. (H) Total vascular density in the spiral limbus and lamina is significantly reduced in the pericyte-depleted mice 2 wk after DT injection (n=5, pApex=0.027, pMid=0.0108, pBase=0.0194, unpaired t test). Loss of vascular volume with pericyte depletion is better seen in the high-magnification image inserts in panel G (a) and (b). Data are presented as the mean ± SEM. Scale bars: C, 50 µm; D, 20 µm; E, 20 µm; F, 200 µm.
Figure 3
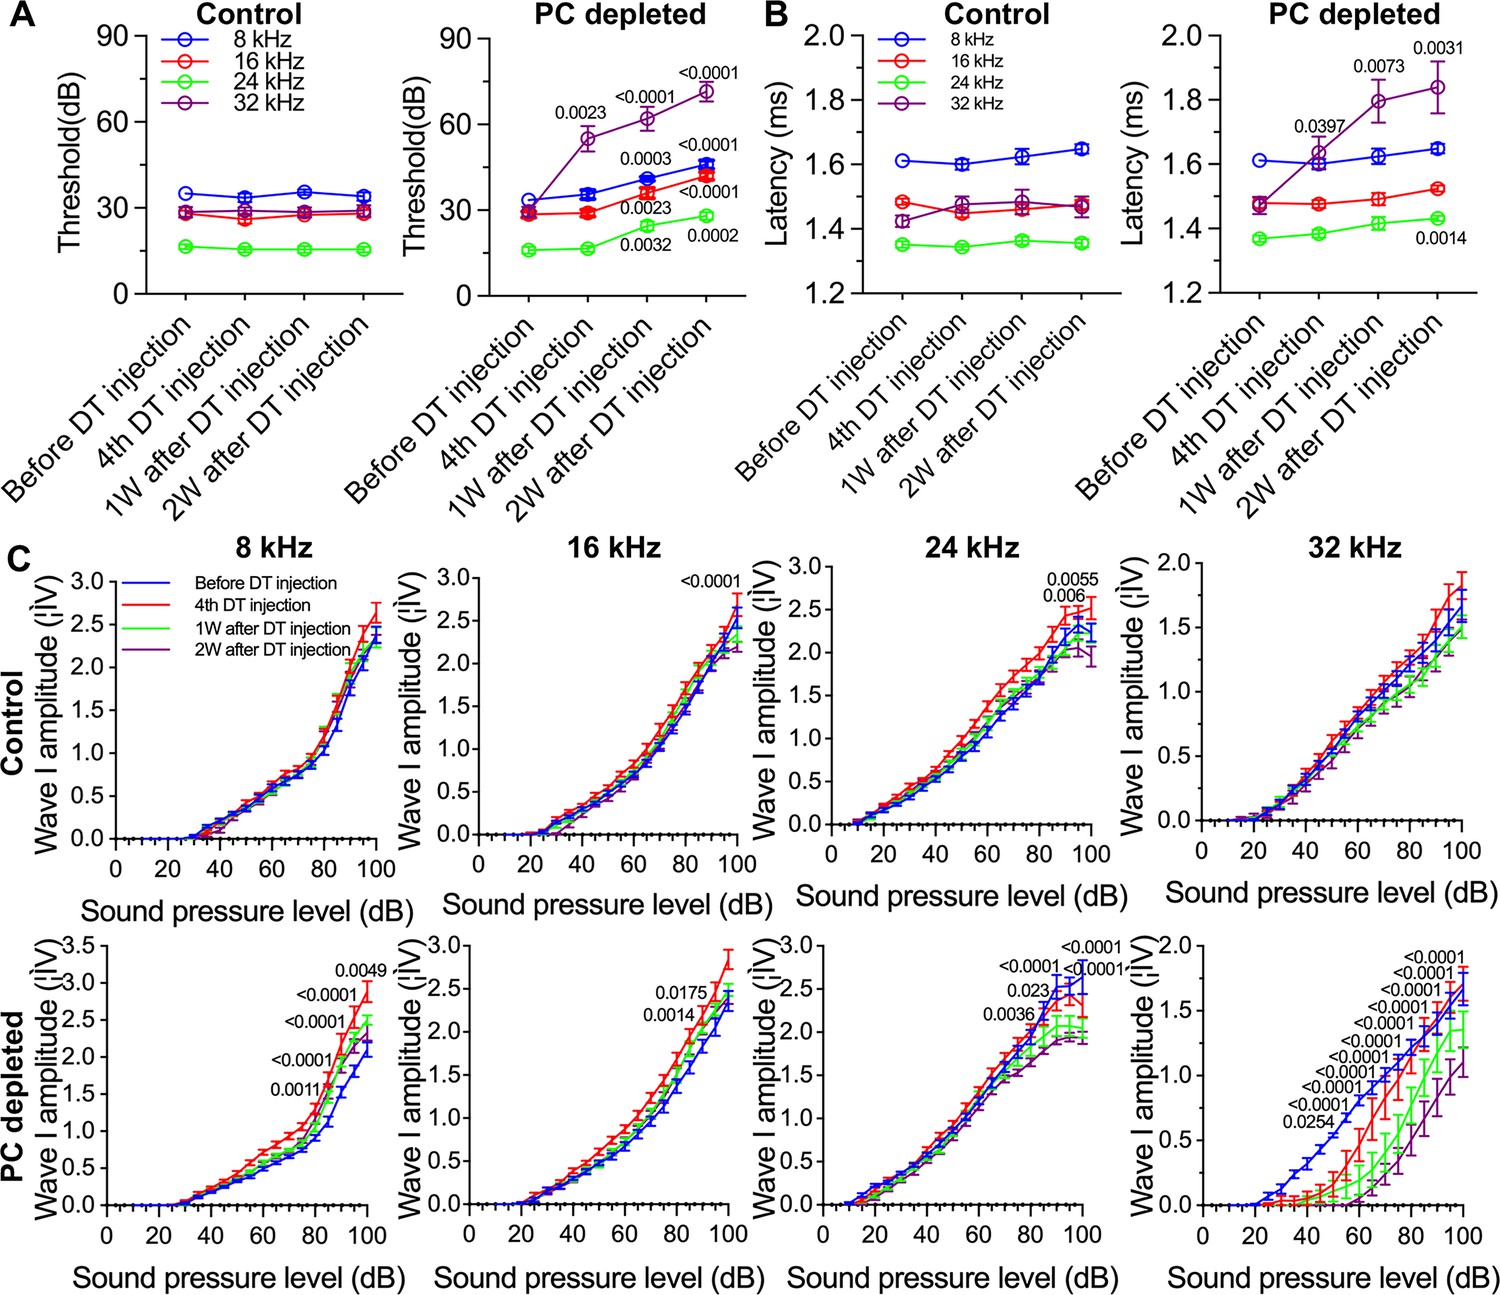
The depletion of pericytes led to hearing loss, increased latency and reduced amplitude of wave I.
(A) The control mice showed no significant hearing threshold change after diphtheria toxin (DT) injection (n=10, p=0.9651). In contrast, the hearing threshold in pericyte-depleted animals was significantly elevated at 1 wk after DT injection and persisted to 2 wk after injection (n=10, p<0.0001). Two-way ANOVA, followed by Dunnett’s multiple comparison test, and individual p values of different time points versus before DT injection are labeled on the graph. (B) The control mice showed no significant wave I latency change after DT injection (n=10, p=0.3576). In pericyte-depleted animals, the latency was significantly delayed at high frequency (32 kHz) starting with the fourth DT injection, and at low frequency (8 kHz) 2 wk after DT injection (n=10, p<0.0001). Two-way ANOVA, followed by Dunnett’s multiple comparison test, and individual p values of different time points versus before DT injection are labeled on the graph. (C) Although changed wave I amplitude was randomly observed in control mice after DT injection, changes rarely persisted to 2 wk after the injection (n=10, p16kHz<0.0001, p24kHz<0.0001). In contrast, significant reduction in wave I amplitude was observed in pericyte-depleted animals at 2 wk after DT injection, particularly at high frequency (32 kHz) (n=10, p8kHz<0.0001, p16kHz<0.0001, p24kHz<0.0001, p32kHz<0.0001). Two-way ANOVA, followed by Dunnett’s multiple comparison test, and individual p values at 2 wk after DT injection versus before DT injection at different sound pressure levels are labeled on the graph. Data are presented as the mean ± SEM.
Figure 4
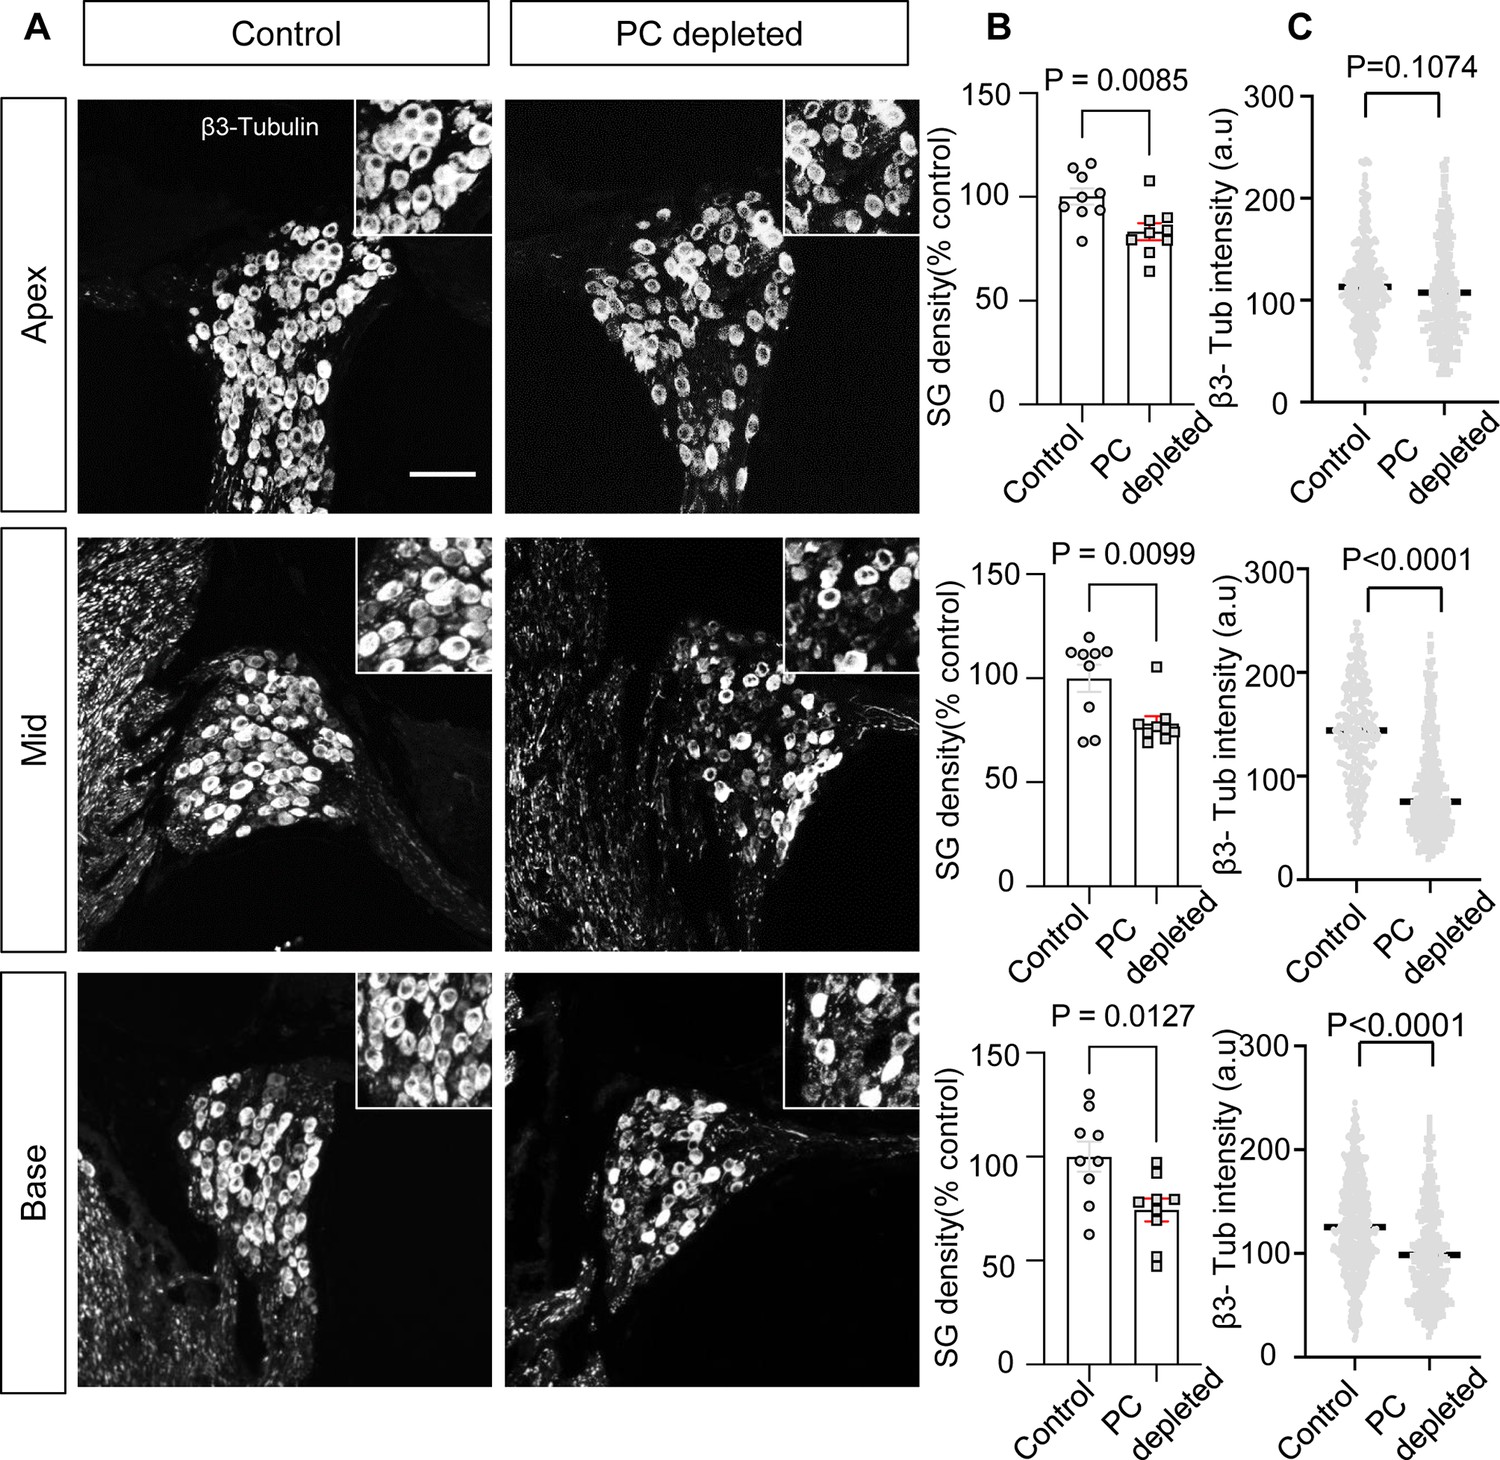
The depletion of pericytes led to spiral ganglion neuron (SGN) loss and decreased expression of β-III tubulin in SGNs.
(A) Representative confocal images from control and pericyte-depleted animals, labeled with antibody for β-III tubulin. (B) Significant SGN loss at all turns 2 wk after diphtheria toxin (DT) treatment (n=9, pApex=0.0085, pMid=0.0099, pBase=0.0127, unpaired t-test). (C) Significantly decreased β-III tubulin expression in SGNs at middle and basal turns 2 wk after DT treatment (pApex=0.1074, pMid<0.0001, pBase<0.0001, unpaired t-test). Data are presented as the mean ± SEM. Scale bar: D, 50 µm.
Figure 5

Pericytes promote both vascular and neuronal growth in spiral ganglia in vitro.
(A) The 20 most significant overrepresented PANTHER pathways for genes (RPKM>0.5) identified in cochlear pericytes. (B) Neonatal spiral ganglion neuron (SGN) explants co-cultured with pericytes show robust SGN dendritic growth (green, labeled for β-III Tubulin) and new vessel growth (red, labeled for CD31). (C) There are significant differences in number of new vessel branches and in number and length of dendritic fibers in the two groups (n=6, pVascular branch #/area=0.0018, pNeurites #/area<0.0001, pNeurite length/explant=0.0393, unpaired t test). (D) Adult SGNs co-cultured with pericytes show robust SGN dendritic growth (red, labeled for β-III Tubulin). (E) There are significant differences in cell survival, and in average neurite number and length, in the two groups (n=3 wells per group, 25 cells per well, pneuron survival=0.0186, pNeurites #/cell<0.0001, plongest neurite length/cell<0.001, unpaired t test). Data are presented as the mean ± SEM. Scale bars: B, 300 µm (top), 150 µm (middle), 50 µm (bottom); D, 50 µm.
Figure 6
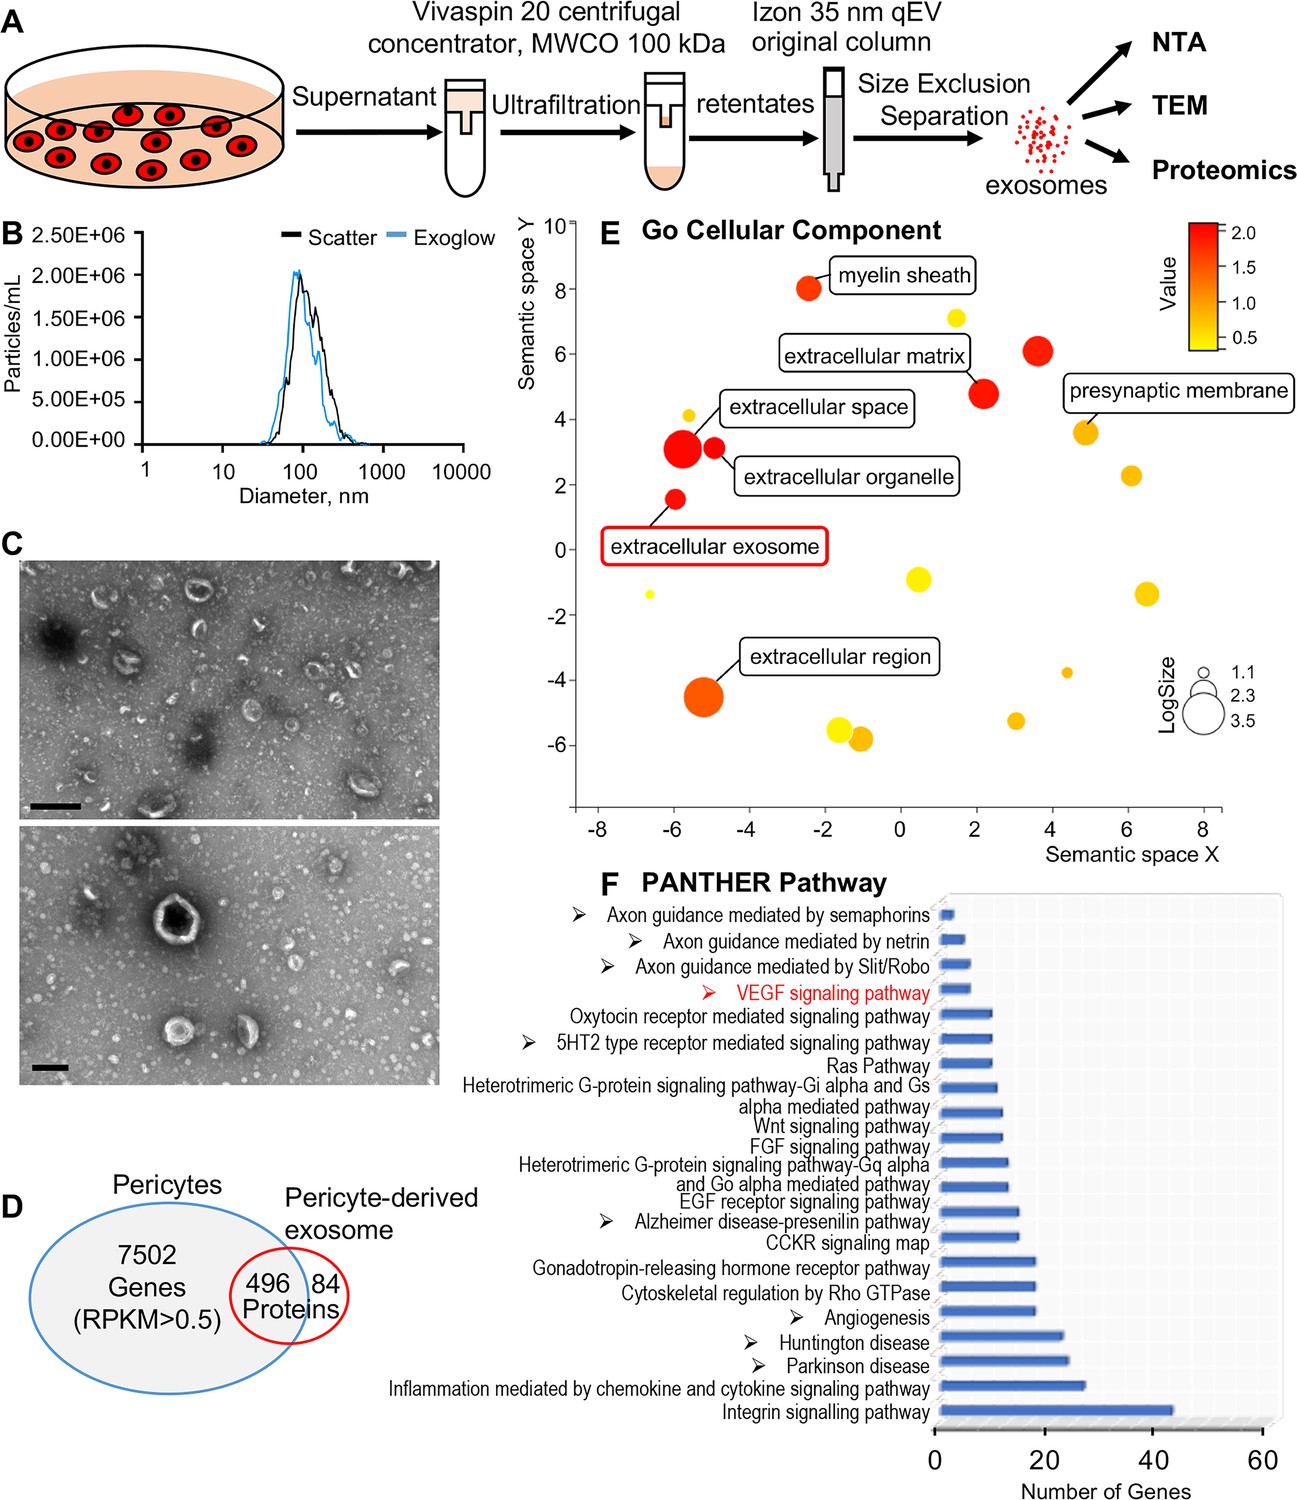
Identification of pericyte-derived exosomes.
(A) Schematic of the exosome purification procedure used to isolate exosomes from pericyte-conditioned culture medium for nanoparticle tracking analysis (NTA), transmission electron microscopy (TEM), and proteomics analysis. Exosomes were isolated via ultracentrifugation followed by size-exclusion separation. (B) NTA shows a rich population of exosome-sized (~50–150 nm) particles, 96.4% of which are labeled with Exoglow (a membrane extracellular vesicle [EV] marker kit). (C) TEM images show a classic cup-shaped structure membrane vesicle with diameter around 100 nm. (D) Proteomics analysis of exosomes identified a total of 570 unique protein families in the exosomes, 496 of which overlap with genes identified in pericyte isolated total RNA. (E) The 22 most significantly enriched Gene Ontology (GO) cellular component terms for proteins identified in the pericyte-derived exosomes. (F) The relative PANTHER pathways identified in pericyte-derived exosome proteins. Scale bars: C, 500 nm (top) and 200 nm (bottom).
-
Figure 6—source data 1
Protein families of cochlear pericyte-derived exosomes identified by proteomics analysis.
- https://cdn.elifesciences.org/articles/83486/elife-83486-fig6-data1-v3.xlsx
Figure 7

Pericytes release VEGFA through exosomes.
(A) mRNA expression of VEGF-A in primary cochlear pericytes. (B) VEGF-A production assessed by ELISA at day 3 in the control and pericyte containing culture medium (n=6, p<0.0001, unpaired t test). (C) VEGFA expression level assessed by ELISA in the cochlea of control and pericyte-depleted mice (ncontrol = 5, npericyte depletion=8, p=0.0387, unpaired t test). (D) Representative confocal images showing VEGF-A expression in pericytes. (E) Exosomes and the non-exosomal fraction (supernatant) were purified from pericyte-conditioned media using differential ultracentrifugation for western blot analysis. (F) Western blot showing the expression of VEGFA in exosomes. Similarly, PDGFR-β (pericyte membrane marker) was detected exclusively in exosomes. Data are presented as the mean ± SEM. Scale bars: D, 5 µm.
-
Figure 7—source data 1
Original uncropped blots of VEGFA and PDGFR-β, and raw gel data of whole protein staining with the relevant bands clearly labeled.
- https://cdn.elifesciences.org/articles/83486/elife-83486-fig7-data1-v3.zip
-
Figure 7—source data 2
Original uncropped blots of VEGFA and PDGFR-β, and raw gel data of whole protein staining with the relevant bands clearly labeled.
- https://cdn.elifesciences.org/articles/83486/elife-83486-fig7-data2-v3.pdf
Figure 8
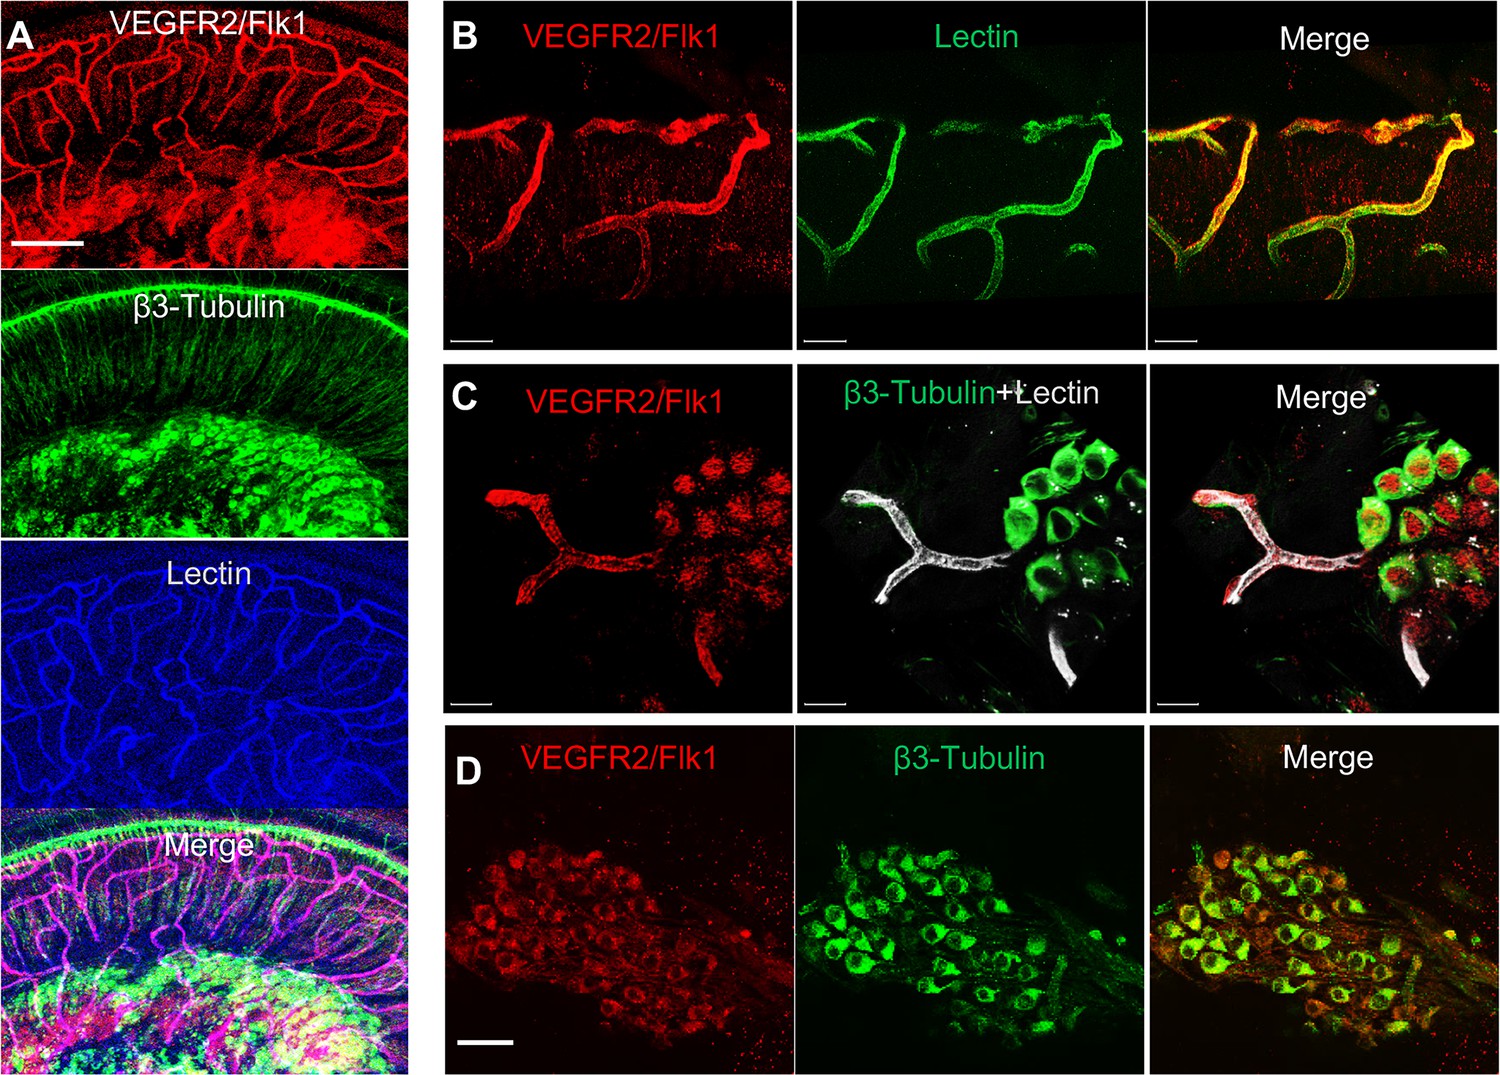
VEGFR2 expression in the spiral ganglion region.
(A–C) Representative confocal images of a cochlear whole mount under low (A) and high (B and C) magnification. (D) Cross section showing VEGFR2 (red) is positively expressed in both spiral ganglion neurons (SGNs; labeled for β-III Tubulin) and blood vessels (labeled for lectin). Scale bars: E, 100 µm; F, 30 µm; G, 20 µm; H, 50 µm.
Figure 9
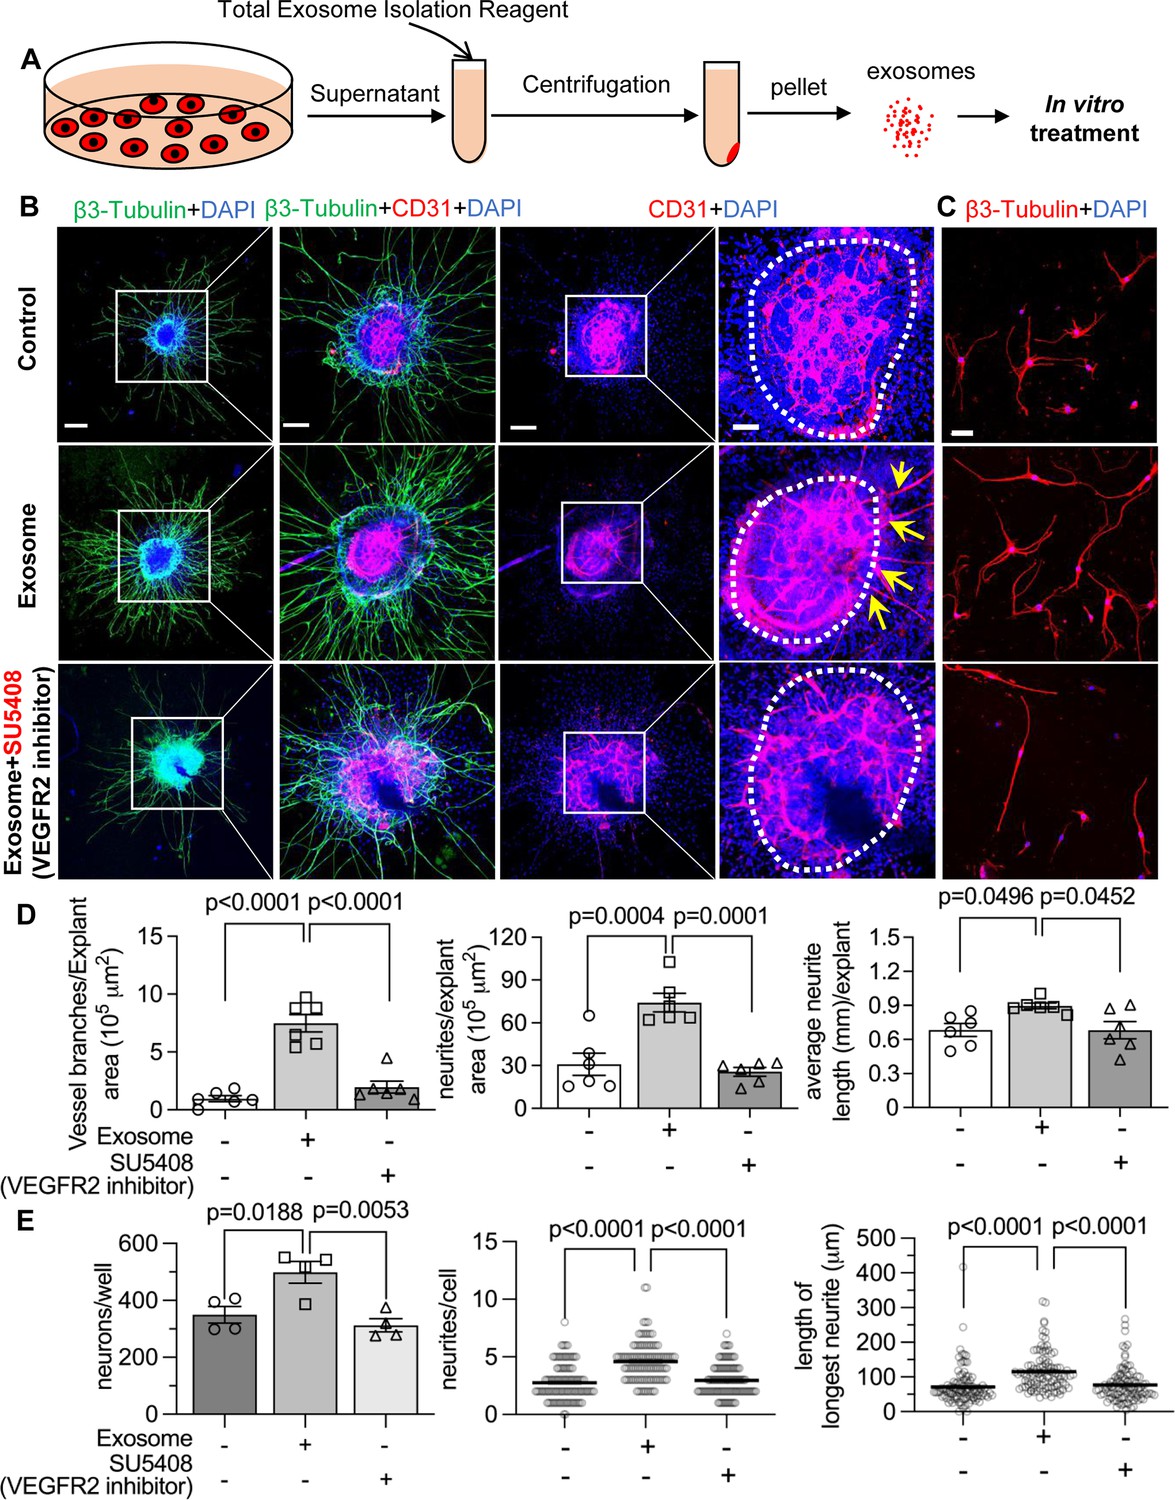
Pericyte-derived exosomes promote angiogenesis and spiral ganglion neuron (SGN) growth through VEGFR2 signaling.
(A) Exosomes were purified from pericyte-conditioned media using total exosome isolation reagent for in vitro treatment. (B) Compared to the control group, exosome treated SGN explants showed robust SGN dendritic growth (green, labeled for β-III Tubulin) and new vessel growth (red, labeled for CD31). In contrast, both neurogenic and angiogenetic activity were decreased when a VEGFR2 inhibitor, SU5408, was presented in the medium. (C) Exosome treated adult SGNs showed more SGN dendritic growth (red, labeled for β-III Tubulin) compared to control and VEGFR2 blocked groups. (D) There are significant differences in new vessel branch number and in dendritic fiber number and length in the three groups (n=6, p=0.0017). (E) There are significant differences in cell survival and in average neurite number and length, in the three groups (n=4 wells per group, 25 cells per well, p=0.0048). One-way ANOVA followed by Tukey’s multiple comparison test, individual p values of different group comparisons are labeled on the graph. Data are presented as the mean ± SEM. Scale bars: B, 300 µm (left), 150 µm (center), 50 µm (right); C, 50 µm.
Figure 10
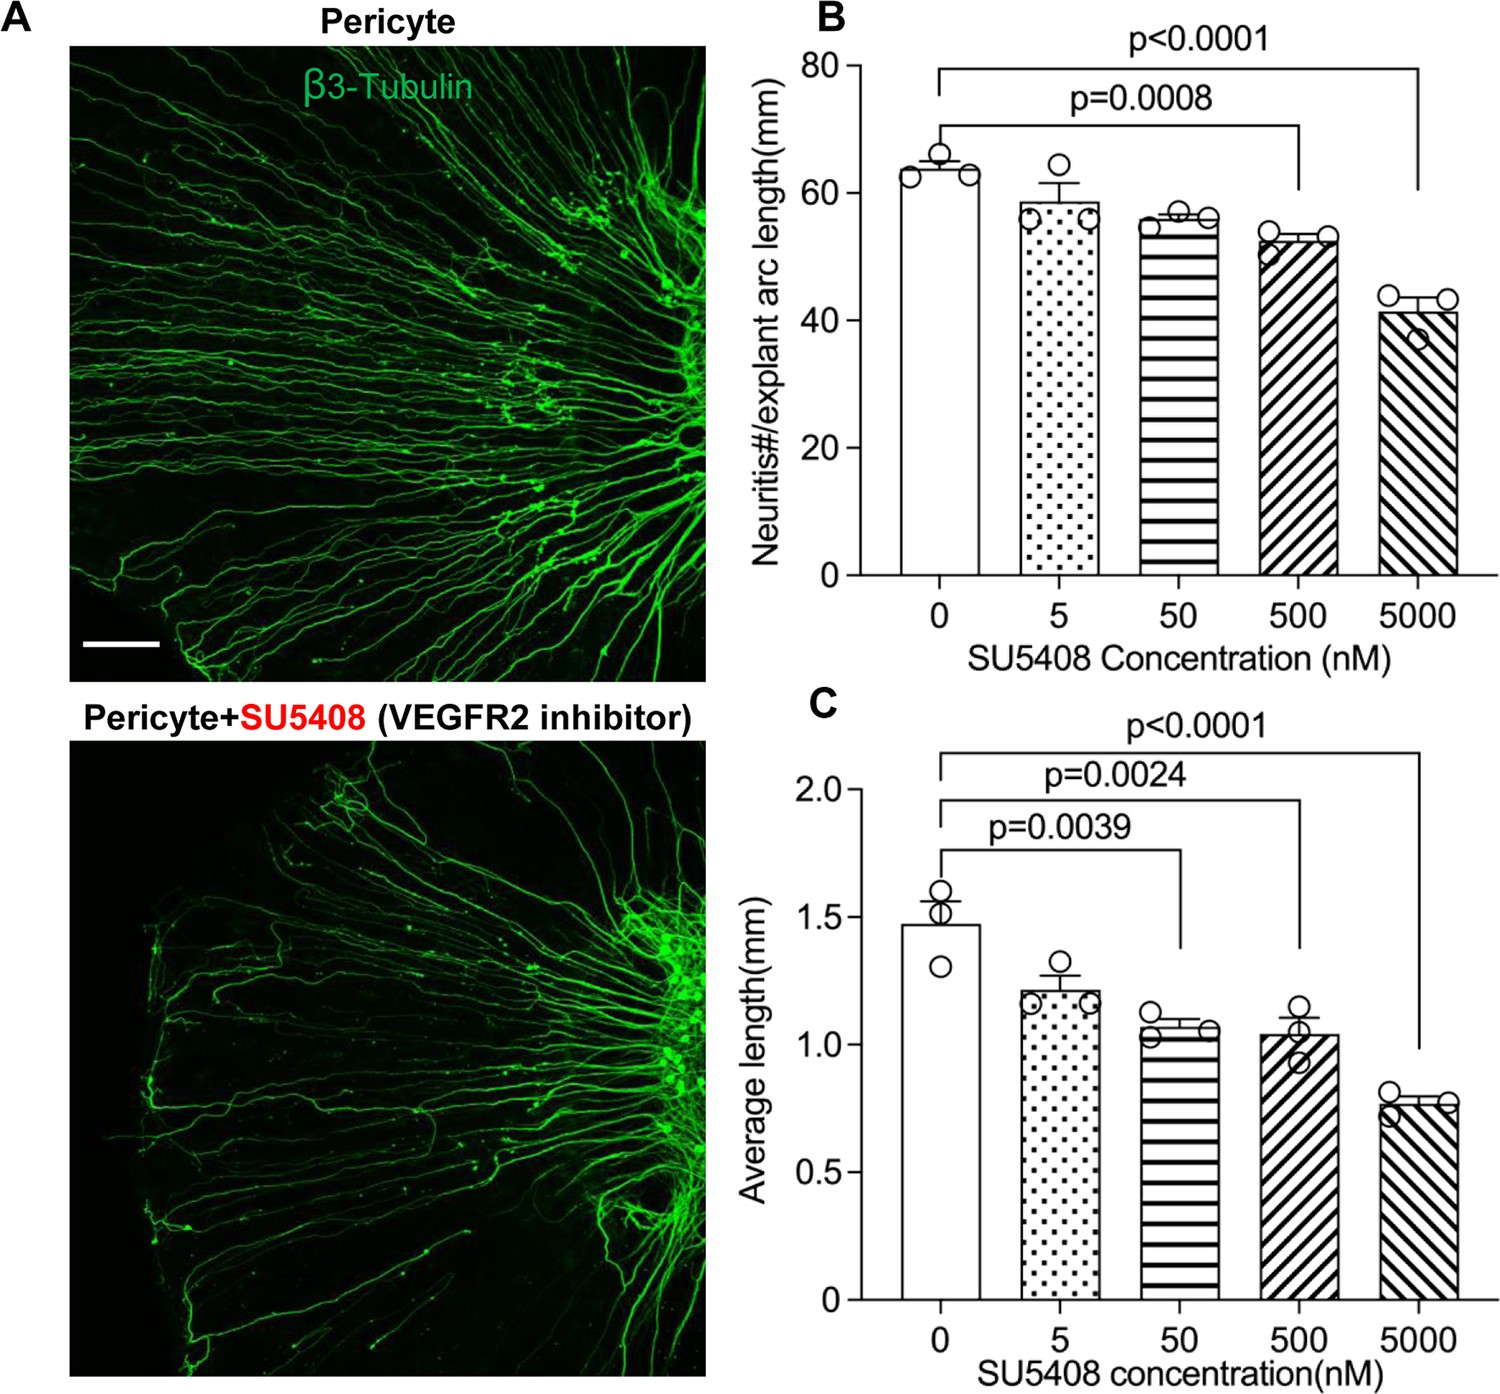
Neuronal dendritic growth is reduced when VEGFR2 is blocked in a pericyte-spiral ganglion neuron (SGN) explant co-culture model.
(A) Representative images showing the pattern of SGN dendritic growth under different experimental conditions. (B and C) Number and length of dendritic fibers when the VEGFR2 receptor is blocked. A dose-dependent relationship is shown (n=3, pnumber<0.0001, plength<0.0001, one-way ANOVA followed by a Tukey’s multiple comparison test, individual p values between different groups labeled on the graph). Data are presented as the mean ± SEM. Scale bar: A, 150 µm.
Figure 11

Hypothesized mechanisms of pericyte-mediated effects on spiral ganglion neuron (SGN) growth and survival.
(A) Under normal conditions, pericytes participate in the maintenance of SGN health through two parallel pathways: (1) One maintains vascular stability and function and (2) the other ‘nourishes’ SGNs through release of exosomes. (B) Pericyte depletion causes reduction in vascular volume as well as dysfunction, including loss of SGNs and hair cells (Buch et al., 2005), and, in consequence, hearing loss. (C) VEGF-A-carrying exosomes interact with VEGFR2 on the SGNs to stimulate growth and promote survival, which can be arrested by the specific VEGFR2 inhibitor, SU5408. (D) The schematic model shows the molecular structure of exosomes and includes mention of common exosome markers such as CD81, CD63, CD9, and Tsg101 and exosome cargo such as proteins, DNAs, RNAs, lipids, and metabolites.
Figure 12
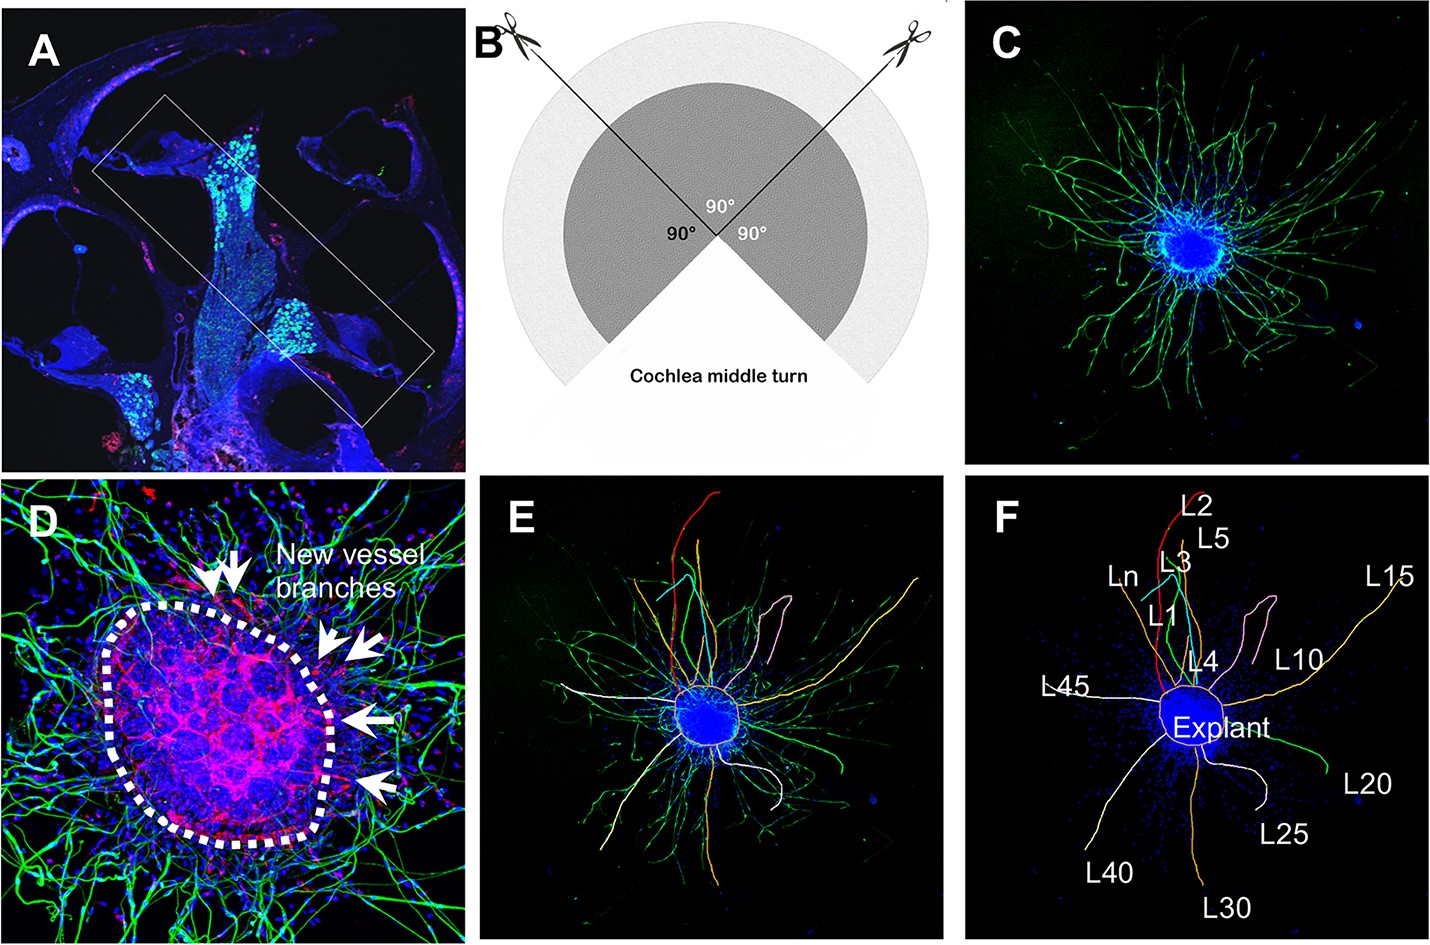
Schematic of dissection and culture of spiral ganglion neuron (SGN) explants and method of quantitative analysis of neural dendritic growth in a P2 neonatal mouse cochlea over the course of 5 d in culture.
(A and B) The cochlear middle turns were dissected out, stria vascularis and organ of Corti discarded, and the remaining SGN cut into three 90° fan-shaped pieces. These were attached to a coated 6-well glass bottom plate and cultured. (C) A representative confocal projection image of an SGN explant labeled with an antibody for β-III tubulin (green). (D–F) Illustration showing the method used for quantification of SGN neurite number and length. N: the number of neurites; L: the length of the neurites. (F) High magnification of the SGN explant showing new vessel growth labeled for CD31 (red). Arrows indicate new vessel branches.
Appendix 1—figure 1
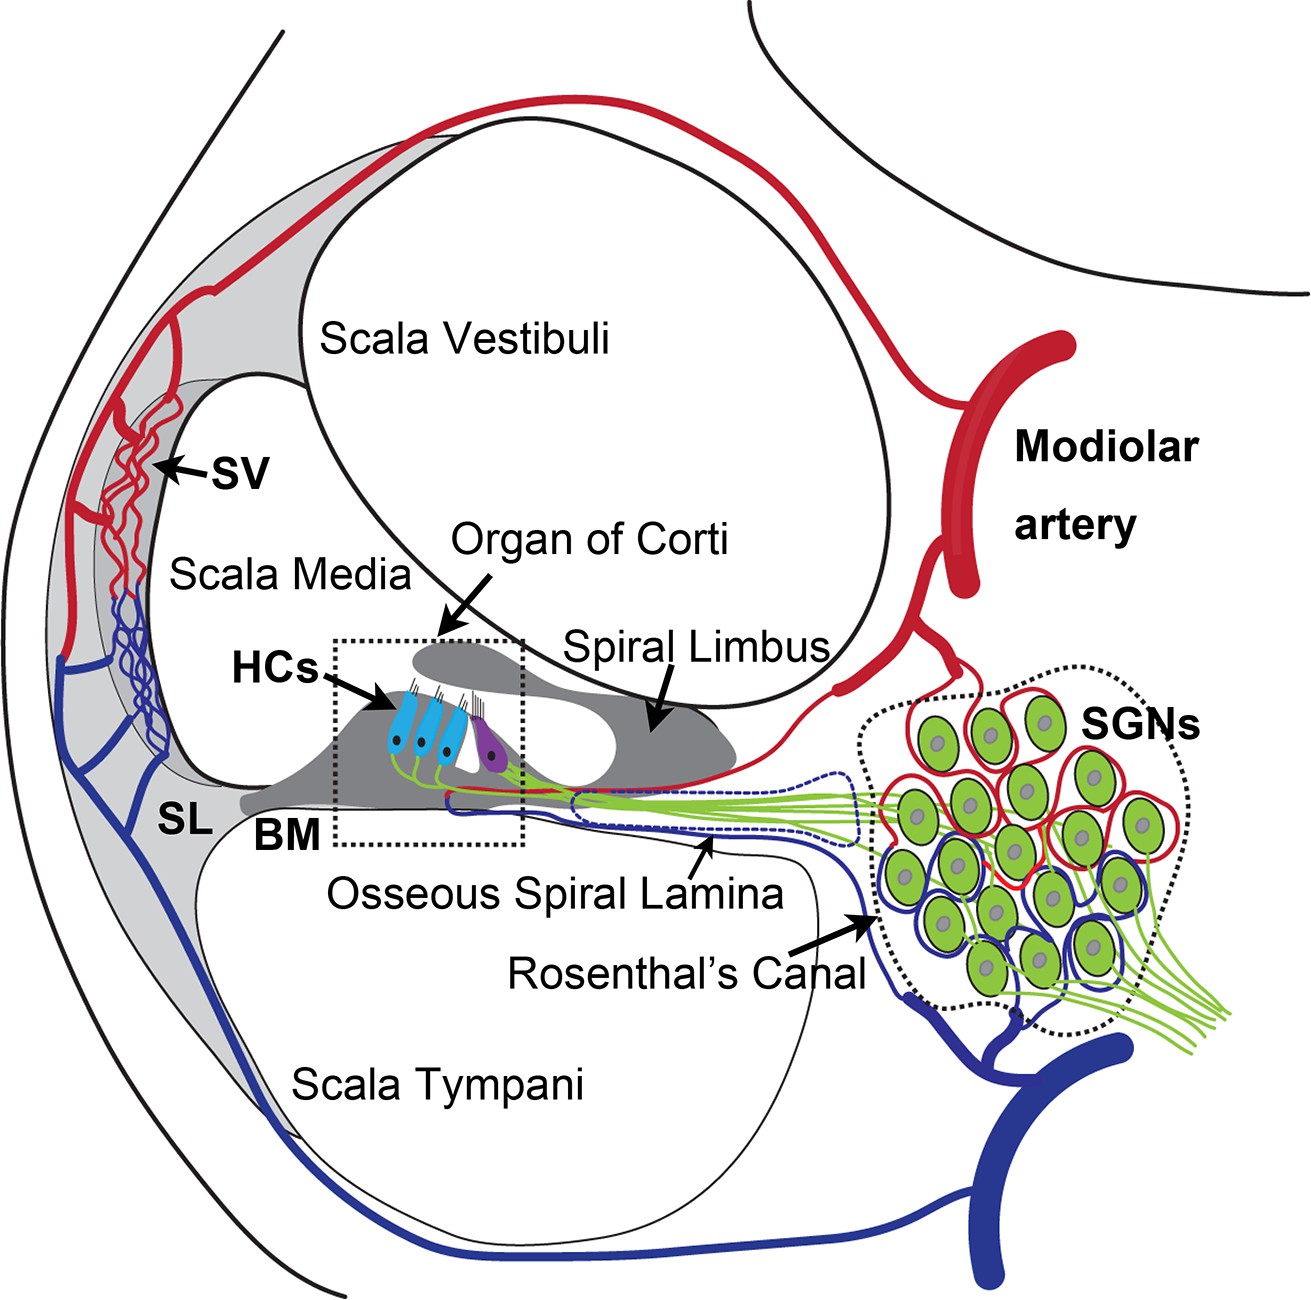
The anatomy and blood supply of cochlea.
Two major microvascular networks in the cochlea include the network in the cochlear lateral wall and network in the region of spiral ganglion neurons (SGNs)-blood vessels penetrate the SGNs and directly supply nutrients to the neurons. SV, stria vascularis; SL, spiral ligament; HCs, hair cells; BM, basilar membrane.
Appendix 1—figure 2
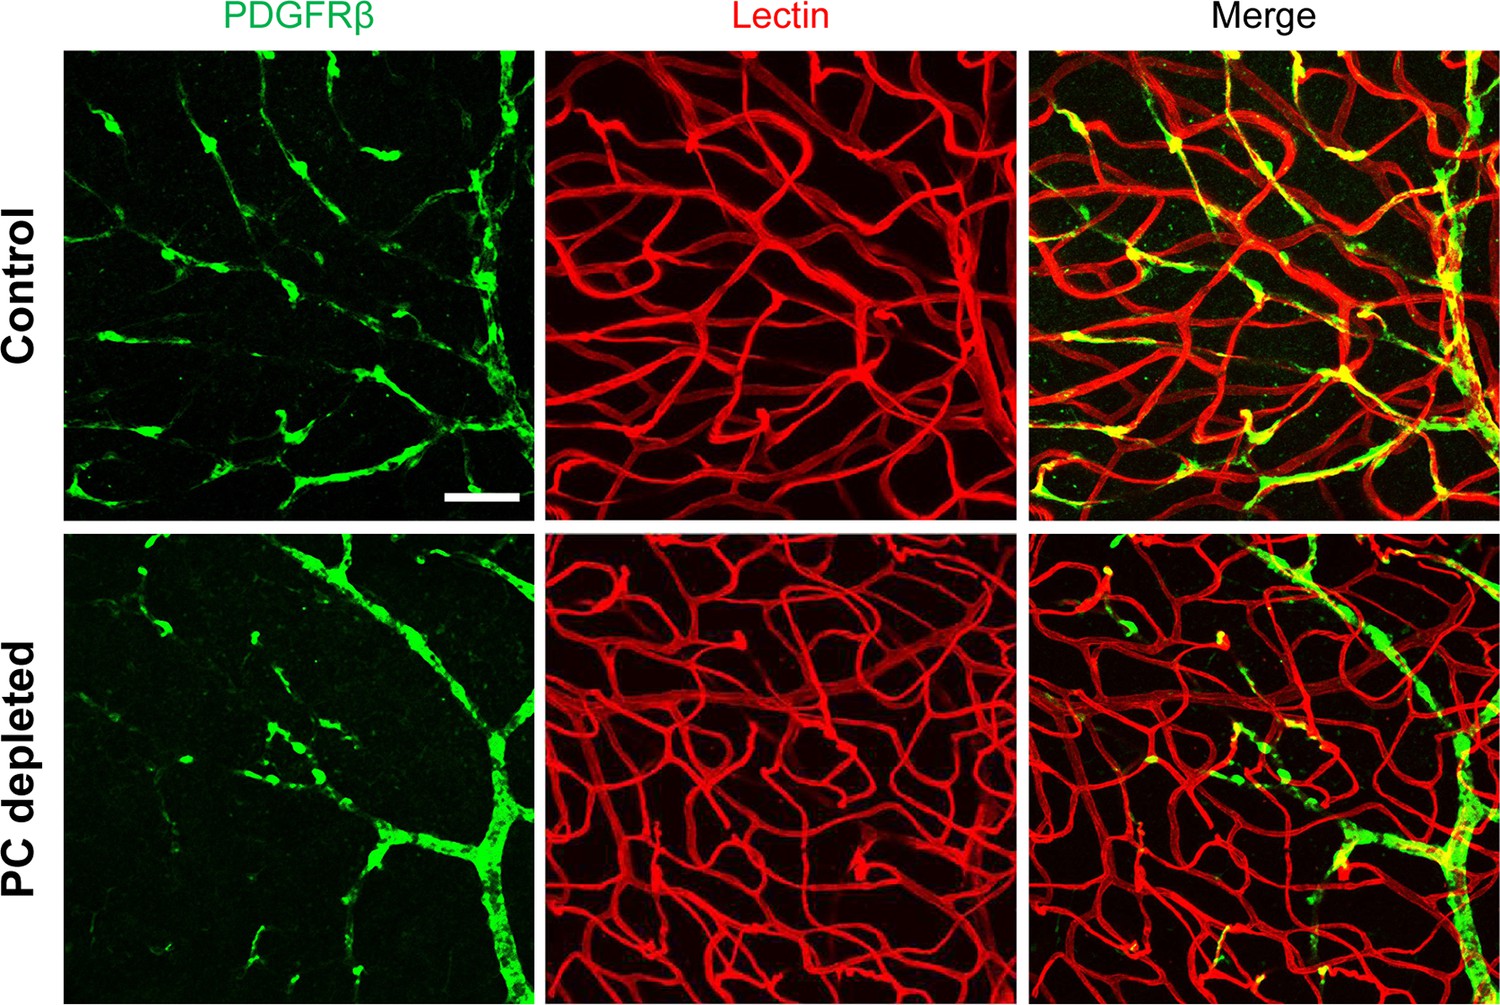
Pericyte depletion in the retina does not affect the blood vessels in adult animals.
Scale bar: 50 µm.
Tables
Table 1
Overrepresented PANTHER pathways for genes (RPKM>0.5) identified in cochlear pericytes.
| No. | PANTHER pathways | % of gene in the list | −Log10 (FDR (false discovery rate)) | |
|---|---|---|---|---|
| Mus musculus (REF) | Pericyte | |||
| 1 | Inflammation mediated by chemokine and cytokine signaling pathway | 1.181979 | 5.072464 | 14.88941 |
| 2 | CCKR signaling map | 0.74101 | 3.804348 | 13.30277 |
| 3 | Angiogenesis | 0.813747 | 3.713768 | 11.61261 |
| 4 | Heterotrimeric G-protein signaling pathway-Gq alpha and Go alpha mediated pathway | 0.554621 | 2.717391 | 8.9914 |
| 5 | Heterotrimeric G-protein signaling pathway-Gi alpha and Gs alpha mediated pathway | 0.722826 | 2.98913 | 8.364516 |
| 6 | Wnt signaling pathway | 1.418375 | 4.257246 | 8.073658 |
| 7 | Gonadotropin-releasing hormone receptor pathway | 1.068327 | 3.623188 | 8.066513 |
| 8 | T cell activation | 0.409147 | 2.173913 | 7.876148 |
| 9 | Apoptosis signaling pathway | 0.563713 | 2.445652 | 7.314258 |
| 10 | Endothelin signaling pathway | 0.377324 | 1.992754 | 7.218245 |
| 11 | B cell activation | 0.322771 | 1.811594 | 6.931814 |
| 12 | VEGF signaling pathway | 0.304587 | 1.630435 | 5.958607 |
| 13 | Oxytocin receptor mediated signaling pathway | 0.272764 | 1.449275 | 5.242604 |
| 14 | Histamine H1 receptor mediated signaling pathway | 0.209119 | 1.268116 | 5.136677 |
| 15 | PI3 kinase pathway | 0.245488 | 1.358696 | 5.135489 |
| 16 | Thyrotropin-releasing hormone receptor signaling pathway | 0.286403 | 1.449275 | 5.086716 |
| 17 | Alzheimer disease-presenilin pathway | 0.577351 | 1.992754 | 4.640165 |
| 18 | Integrin signaling pathway | 0.863754 | 2.445652 | 4.315155 |
| 19 | Alzheimer disease-amyloid secretase pathway | 0.300041 | 1.358696 | 4.308919 |
| 20 | 5HT2 type receptor mediated signaling pathway | 0.309133 | 1.358696 | 4.194499 |
| 21 | Muscarinic acetylcholine receptor 1 and 3 signaling pathway | 0.272764 | 1.268116 | 4.154902 |
| 22 | PDGF signaling pathway | 0.650089 | 1.992754 | 4.017277 |
| 23 | Heterotrimeric G-protein signaling pathway-rod outer segment phototransduction | 0.177297 | 0.996377 | 3.886057 |
| 24 | EGF receptor signaling pathway | 0.618266 | 1.902174 | 3.882729 |
| 25 | Interleukin signaling pathway | 0.395508 | 1.449275 | 3.721246 |
| 26 | Muscarinic acetylcholine receptor 2 and 4 signaling pathway | 0.272764 | 1.177536 | 3.636388 |
| 27 | FGF signaling pathway | 0.554621 | 1.721014 | 3.603801 |
| 28 | Cytoskeletal regulation by Rho GTPase | 0.363686 | 1.358696 | 3.595166 |
| 29 | Nicotinic acetylcholine receptor signaling pathway | 0.450061 | 1.449275 | 3.19382 |
| 30 | p53 pathway feedback loops 2 | 0.227304 | 0.996377 | 3.157391 |
| 31 | ATP synthesis | 0.031823 | 0.452899 | 3.123782 |
| 32 | Axon guidance mediated by netrin | 0.159113 | 0.815217 | 3.010105 |
| 33 | Beta1 adrenergic receptor signaling pathway | 0.209119 | 0.905797 | 2.886057 |
| 34 | Enkephalin release | 0.168205 | 0.815217 | 2.882729 |
| 35 | GABA-B receptor II signaling | 0.168205 | 0.815217 | 2.869666 |
| 36 | Metabotropic glutamate receptor group II pathway | 0.213665 | 0.905797 | 2.832683 |
| 37 | Insulin/IGF pathway-protein kinase B signaling cascade | 0.177297 | 0.815217 | 2.772113 |
| 38 | Blood coagulation | 0.236396 | 0.905797 | 2.551294 |
| 39 | FAS signaling pathway | 0.154567 | 0.724638 | 2.522879 |
| 40 | Nicotine pharmacodynamics pathway | 0.159113 | 0.724638 | 2.462181 |
| 41 | Dopamine receptor mediated signaling pathway | 0.25458 | 0.905797 | 2.376751 |
| 42 | Beta2 adrenergic receptor signaling pathway | 0.209119 | 0.815217 | 2.366532 |
| 43 | Alpha adrenergic receptor signaling pathway | 0.10456 | 0.543478 | 2.095284 |
| 44 | Axon guidance mediated by Slit/Robo | 0.113652 | 0.543478 | 1.978811 |
| 45 | TGF-beta signaling pathway | 0.459154 | 1.177536 | 1.978811 |
| 46 | p53 pathway | 0.400055 | 1.086957 | 1.974694 |
| 47 | Androgen/estrogene/progesterone biosynthesis | 0.077283 | 0.452899 | 1.970616 |
| 48 | Endogenous cannabinoid signaling | 0.113652 | 0.543478 | 1.970616 |
| 49 | Cortocotropin releasing factor receptor signaling pathway | 0.154567 | 0.634058 | 1.970616 |
| 50 | Histamine H2 receptor mediated signaling pathway | 0.118198 | 0.543478 | 1.931814 |
| 51 | 5HT1 type receptor mediated signaling pathway | 0.209119 | 0.724638 | 1.910095 |
| 52 | Opioid proopiomelanocortin pathway | 0.168205 | 0.634058 | 1.853872 |
| 53 | Hypoxia response via HIF activation | 0.12729 | 0.543478 | 1.821023 |
| 54 | TCA cycle | 0.054553 | 0.362319 | 1.754487 |
| 55 | Cadherin signaling pathway | 0.736464 | 1.539855 | 1.686133 |
| 56 | Pyruvate metabolism | 0.059099 | 0.362319 | 1.669586 |
| 57 | Triacylglycerol metabolism | 0.009092 | 0.181159 | 1.446117 |
| 58 | Opioid prodynorphin pathway | 0.163659 | 0.543478 | 1.407823 |
| 59 | Opioid proenkephalin pathway | 0.172751 | 0.543478 | 1.321482 |
-
Table 1—source data 1
Gene list of cochlear pericytes identified by RNA-seq analysis.
- https://cdn.elifesciences.org/articles/83486/elife-83486-table1-data1-v3.xlsx
Table 2
Common protein markers for exosomes were identified in the pericyte-derived exosomes.
| Protein | Gene names | # PSMs | Log2 LFQ (label-free quantitation) intensity |
|---|---|---|---|
| CD81 antigen | Cd81 | 26 | 29.6153 |
| CD63 antigen | Cd63 | 3 | 26.1908 |
| CD9 antigen | Cd9 | 16 | 29.2576 |
| Tumor susceptibility gene 101 | Tsg101 | 5 | 25.7598 |
Key resources table
| Reagent type (species) or resource | Designation | Source or reference | Identifiers | Additional information |
|---|---|---|---|---|
| Strain, strain background (Mus musculus) | C57BL/6J | The Jackson Laboratory | RRID:IMSR_JAX:000664 | |
| Strain, strain background (M. musculus) | B6.Cg-Gt(ROSA)26Sortm9(CAG-tdTomato)Hze/J | The Jackson Laboratory | RRID:IMSR_JAX:007909 | |
| Strain, strain background (M. musculus) | B6.Cg-Tg(Pdgfrb-cre/ERT2)6096Rha/J | The Jackson Laboratory | RRID:IMSR_JAX:029684 | |
| Strain, strain background (M. musculus) | C57BL/6-Gt(ROSA)26Sortm1(HBEGF)Awai/J | The Jackson Laboratory | RRID:IMSR_JAX:007900 | |
| Strain, strain background (M. musculus) | Tg(Cspg4-DsRed.T1)1Akik/J | The Jackson Laboratory | RRID:IMSR_JAX:008241 | |
| Antibody | anti-Desmin [Y66] (Rabbit monoclonal) | Abcam | Cat#: ab32362 | 1:50 |
| Antibody | anti-β-III Tubulin [EP1569Y] (Rabbit monoclonal) | Abcam | Cat#: ab52623 | 1:200 |
| Antibody | anti-CD31 [MEC 7.46] (Rat monoclonal) | Abcam | Cat#: ab7388 | 1:100 |
| Antibody | anti-VEGFR2 [EPR21884-236] (Rabbit monoclonal) | Abcam | Cat#: ab233693 | 1:500 |
| Antibody | anti-VEGFA (Rabbit polyclonal) | Abcam | Cat#: ab51745 | 1:400 |
| Antibody | anti-PDGFRβ [Y92] (Rabbit monoclonal) | Abcam | Cat#: ab32570 | 1:1000-1:5000 |
| Sequence-based reagent | B6.Cg-Tg(Pdgfrb-cre/ERT2)6096Rha/J F | The Jackson Laboratory | PCR primers | GAA CTG TCA CCG GGA GGA |
| Sequence-based reagent | B6.Cg-Tg(Pdgfrb-cre/ERT2)6096Rha/J R | The Jackson Laboratory | PCR primers | AGG CAA ATT TTG GTG TAC GG |
| Sequence-based reagent | B6.Cg-Tg(Pdgfrb-cre/ERT2)6096Rha/J internal positive control F | The Jackson Laboratory | PCR primers | CAA ATG TTG CTT GTC TGG TG |
| Sequence-based reagent | B6.Cg-Tg(Pdgfrb-cre/ERT2)6096Rha/J internal positive control R | The Jackson Laboratory | PCR primers | GTC AGT CGA GTG CAC AGT TT |
| Sequence-based reagent | Mouse VEGFA F | IDT | PCR primers | GCAGCGACAAGGCAGACTA |
| Sequence-based reagent | Mouse VEGFA R | IDT | PCR primers | GGTCCGATGCAAGATCCCAA |
| Peptide, recombinant protein | Diphtheria toxin | Sigma | Cat#: D0564 | 10 ng/g body weight |
| Peptide, recombinant protein | Dispase II | Sigma | Cat#: D4693 | |
| Peptide, recombinant protein | Collagenase I | ThermoFisher | Cat#: 17018029 | |
| Peptide, recombinant protein | DNase I | Sigma | Cat#: 10104159001 | |
| Peptide, recombinant protein | 100× Penicillin-Streptomycin Solution | Invitrogen/Gibco | Cat#: 15140–122 | |
| Commercial assay or kit | Invitrogen Total Exosome Isolation Reagent (from cell culture media) | ThermoFisher | Cat#: 4478359 | |
| Commercial assay or kit | SuperSignal West Femto Duration Substrate | Thermo Fisher Scientific | Cat#: A38554 | |
| Commercial assay or kit | Clontech SMARTer cDNA kit | Clontech Laboratories | Cat#: 634925 | |
| Commercial assay or kit | NEBNext reagents | New England Biolabs | Cat#: E6040 | |
| Commercial assay or kit | RNeasy micro kit | Qiagen | Cat#: 74004 | |
| Commercial assay or kit | SuperScript IV First-Strand Synthesis kit | ThermoFisher | Cat#: 18091050 | |
| Commercial assay or kit | VEGFA ELISA Kit | Abcam | Cat#: ab119565 | |
| Commercial assay or kit | BCA protein assay kit | Abcam | Cat#: ab102536 | |
| Commercial assay or kit | ExoGlow-Protein EV Labeling Kit (Green) | SBI | Cat#: EXOGP300A-1 | |
| Chemical compound and drug | Tamoxifen | Sigma | Cat#: T5648 | 75 mg/kg body weight |
| Chemical compound and drug | SU5408 | Abcam | Cat#: ab145888 | |
| Software and algorithm | Sample Size Calculator | N/A | https://clincalc.com/stats/samplesize.aspx | |
| Software and algorithm | ImageJ | NIH | https://imagej.nih.gov/ij/ | |
| Software and algorithm | PANTHER classification system | N/A | http://www.pantherdb.org/ | |
| Software and algorithm | REVIGO | Ruđer Bošković Institute | http://revigo.irb.hr/ | |
| Other | Lectin-DyLight 488 | Vector Laboratories | Cat#: DL-1174 | 20 μg/ml |
| Other | Lectin-DyLight 649 | Vector Laboratories | Cat#: DL-1178 | 20 μg/ml |
| Other | Decal Stat Decalcifier | StatLab | Cat#: 1212–32 | Use directly (contains Hydrogen Chloride, Acid mists, strong inorganic) |
| Other | Antifade Mounting Medium with DAPI | Vector Laboratories | Cat#: H-1200 | Use directly (contains 1 μg/ml of DAPI) |
Additional files
Download links
A two-part list of links to download the article, or parts of the article, in various formats.
Downloads (link to download the article as PDF)
Open citations (links to open the citations from this article in various online reference manager services)
Cite this article (links to download the citations from this article in formats compatible with various reference manager tools)
Pericytes control vascular stability and auditory spiral ganglion neuron survival
eLife 12:e83486.
https://doi.org/10.7554/eLife.83486


