A chronic signaling TGFb zebrafish reporter identifies immune response in melanoma
- Stem Cell Program and Division of Hematology/Oncology, Boston Children’s Hospital and Dana Farber Cancer Institute, Howard Hughes Medical Institute, United States
- Stem Cell and Regenerative Biology Department, Harvard University, United States
- Harvard Medical School, United States
- Biological and Biomedical Sciences Program, Harvard Medical School, United States
- Immunology Program, Harvard Medical School, United States
Figures
Figure 1 with 3 supplements
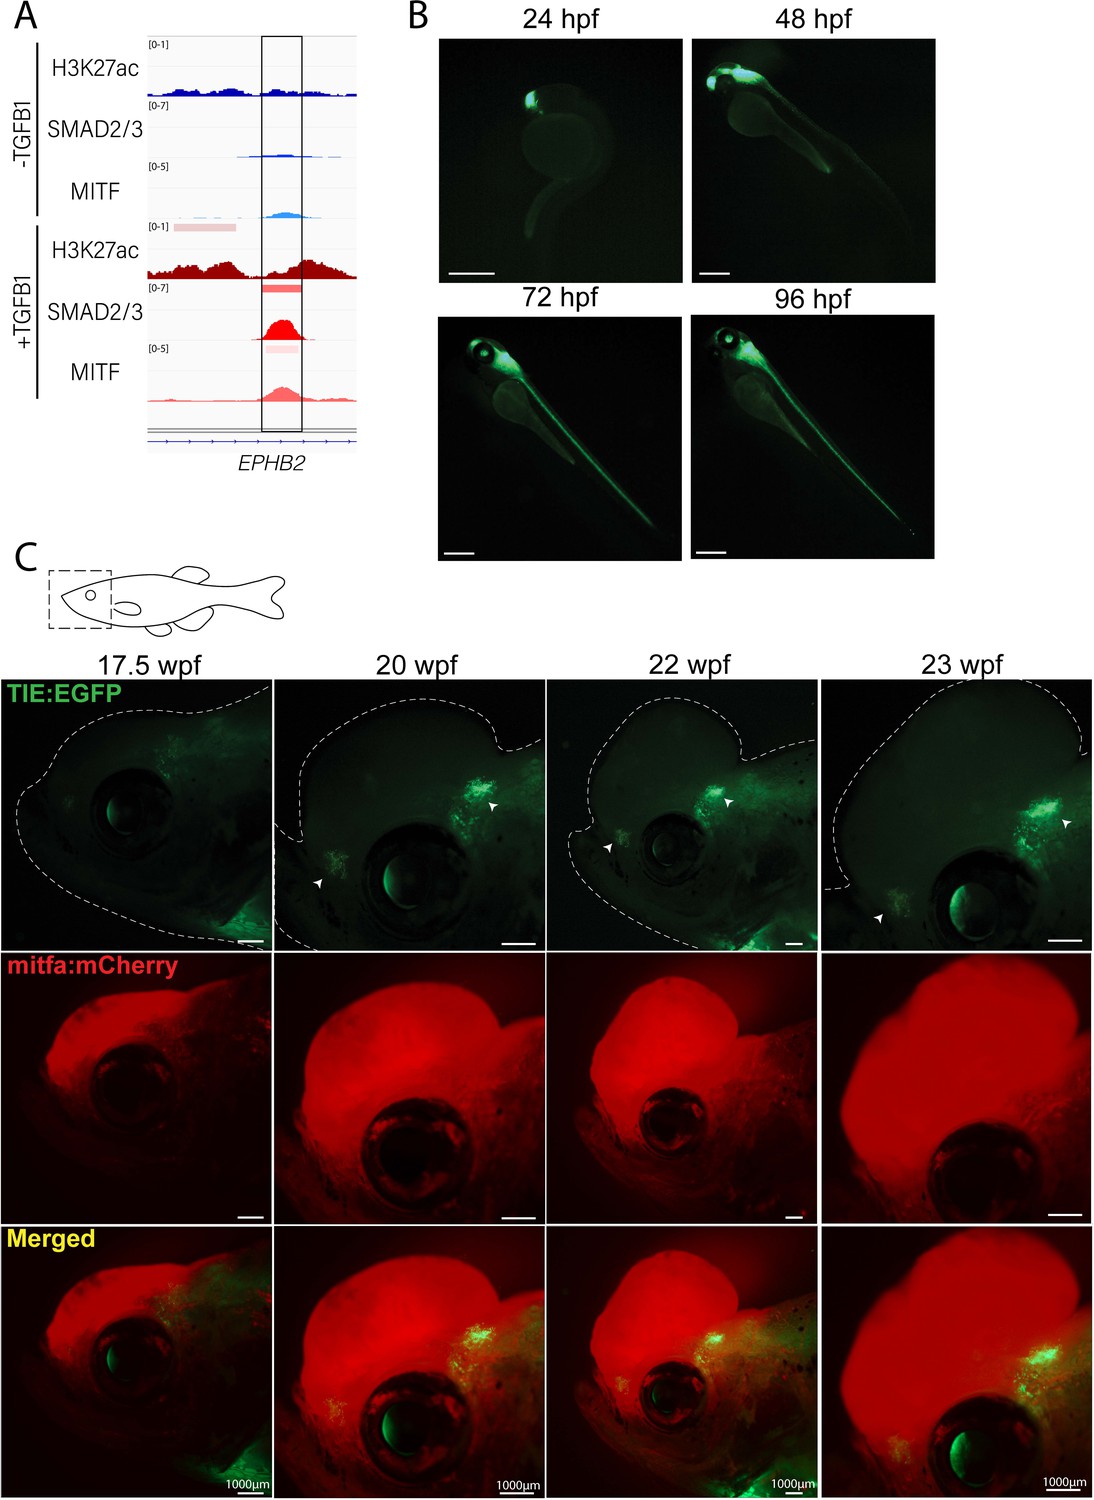
Novel TIE:EGFP zebrafish enhancer reporter is expressed in advanced melanomas.
(A) TGFb-induced enhancer (TIE) used to construct TIE:EGFP reporter determined by H3K27ac, SMAD2/3, and MITF ChIP-seq peaks in A375s+/-TGFB1. There is unique H3K27ac and SMAD2/3 binding upon stimulus. (B) TIE:EGFP expression throughout zebrafish development. Scale bars represent 500 µm. (C) TIE:EGFP expression across melanomagenesis indicated by arrowheads. Representative images shown. Additional tumors shown in Figure 1—figure supplement 3. Illustrated fish diagram in (C) created with BioRender.com, and published using a CC BY-NC-ND license with permission.
© 2024, BioRender Inc. Figure 1 was created using BioRender, and is published under a CC BY-NC-ND license. Further reproductions must adhere to the terms of this license.
Figure 1—figure supplement 1
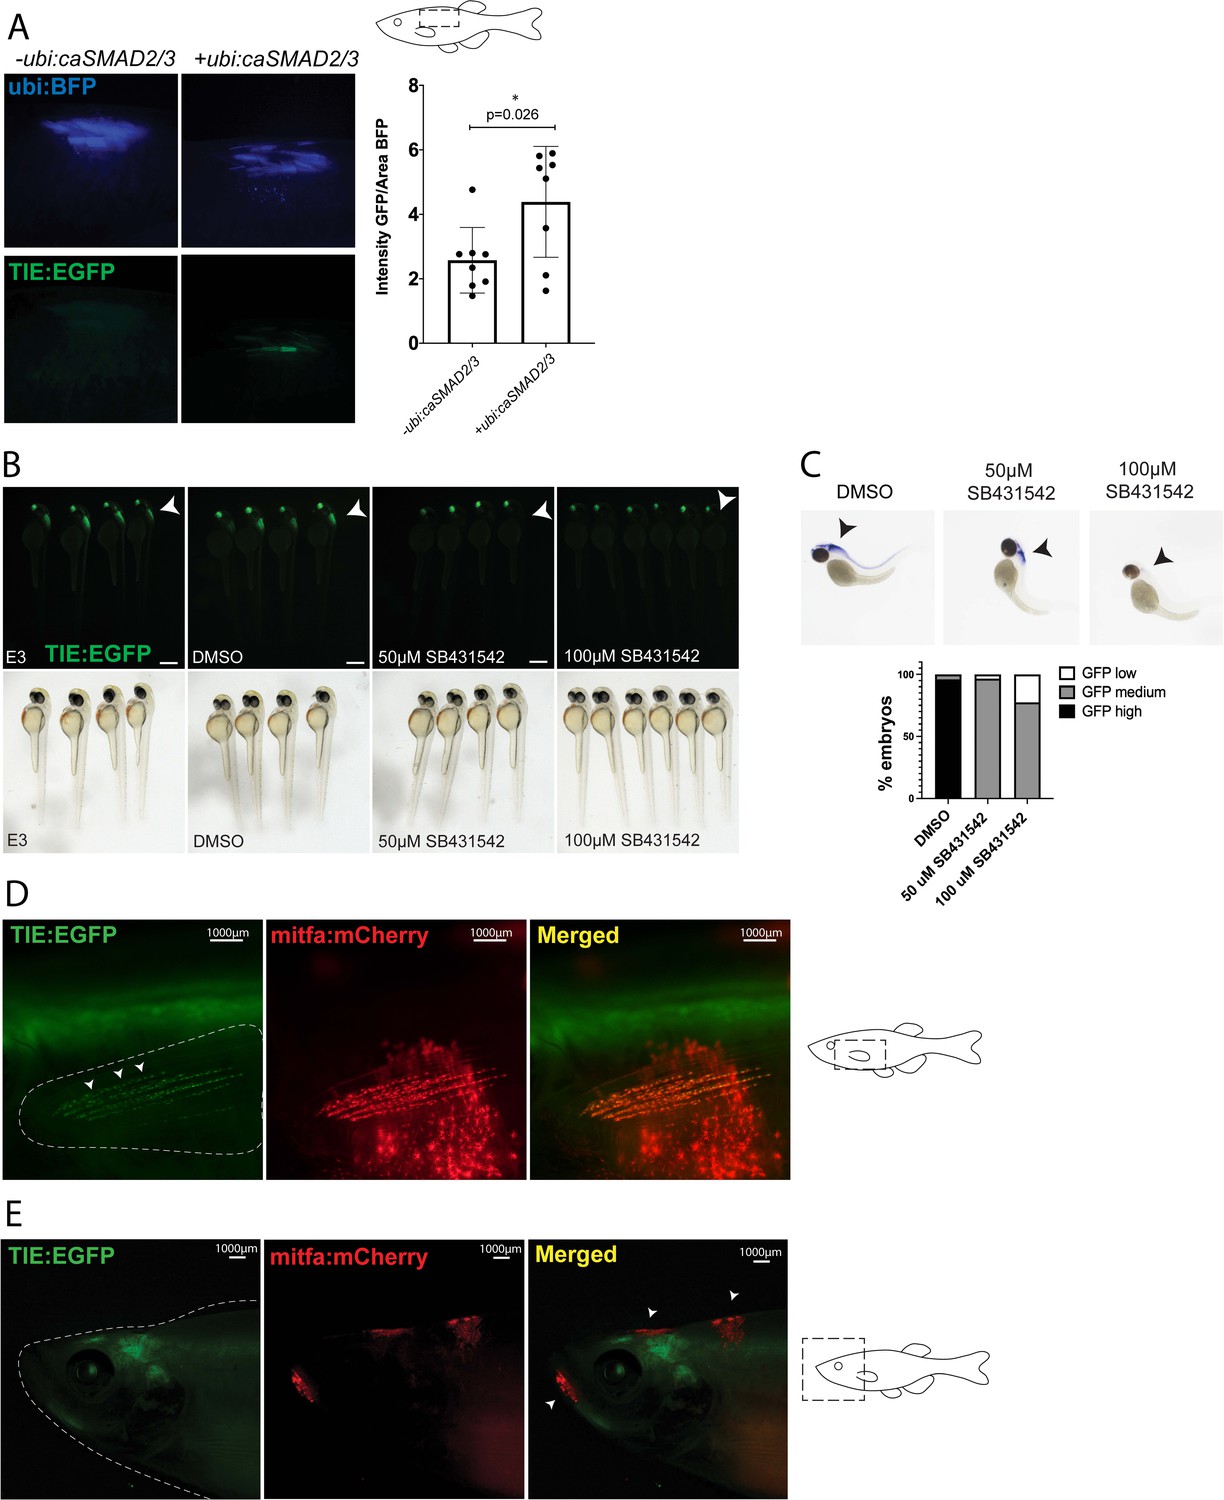
TIE:EGFP zebrafish enhancer reporter is inducible and specific.
(A) TIE:EGFP reporter is induced upon electroporation with ubi:caSMAD2 and ubi:caSMAD3 in adult zebrafish flank skin. Ubi:BFP was used as a control for varying electroporation efficiency. TIE:EGFP intensity/BFP area was quantified (right). Two-tailed unpaired Welch’s t-test was used to calculate significance. Representative images shown. n=8 fish per condition. (B) TIE:EGFP embryos treated at 1 day post fertilization for 24 hr with E3 (zebrafish water), DMSO (vehicle control), 50 µM or 100 µM TGFb inhibitor SB431542. TIE:EGFP channel (top) and white light (bottom). Representative images shown. Scale bars represent 500 µm. (C) In situ hybridization (ISH) was performed probing for GFP in embryos treated with DMSO (n=26), 50 µM (n=30), or 100 µM (n=31) TGFb inhibitor SB431542 for 24 hr starting at 1 day post fertilization. Embryos were grouped into three qualitative groups based on GFP intensity: low, medium, and high, and the percentage of embryos in each are graphed below. (D) Representative image of mitfa:mCherry+ zebrafish fin melanocytes expressing TIE:EGFP. The uppermost EGFP+ region not overlapping with mCherry signal is residual spinal expression of TIE:EGFP. (E) Early melanomas, indicated by arrowheads, do not express TIE:EGFP. The EGFP+ region not overlapping with mCherry signal is residual brain expression of TIE:EGFP. Representative images shown. Illustrated fish diagrams in (A, D, E) created with BioRender.com, and published using a CC BY-NC-ND license with permission.
© 2024, BioRender Inc. Figure 1—figure supplement 1 was created using BioRender, and is published under a CC BY-NC-ND 4.0. Further reproductions must adhere to the terms of this license.
Figure 1—figure supplement 2
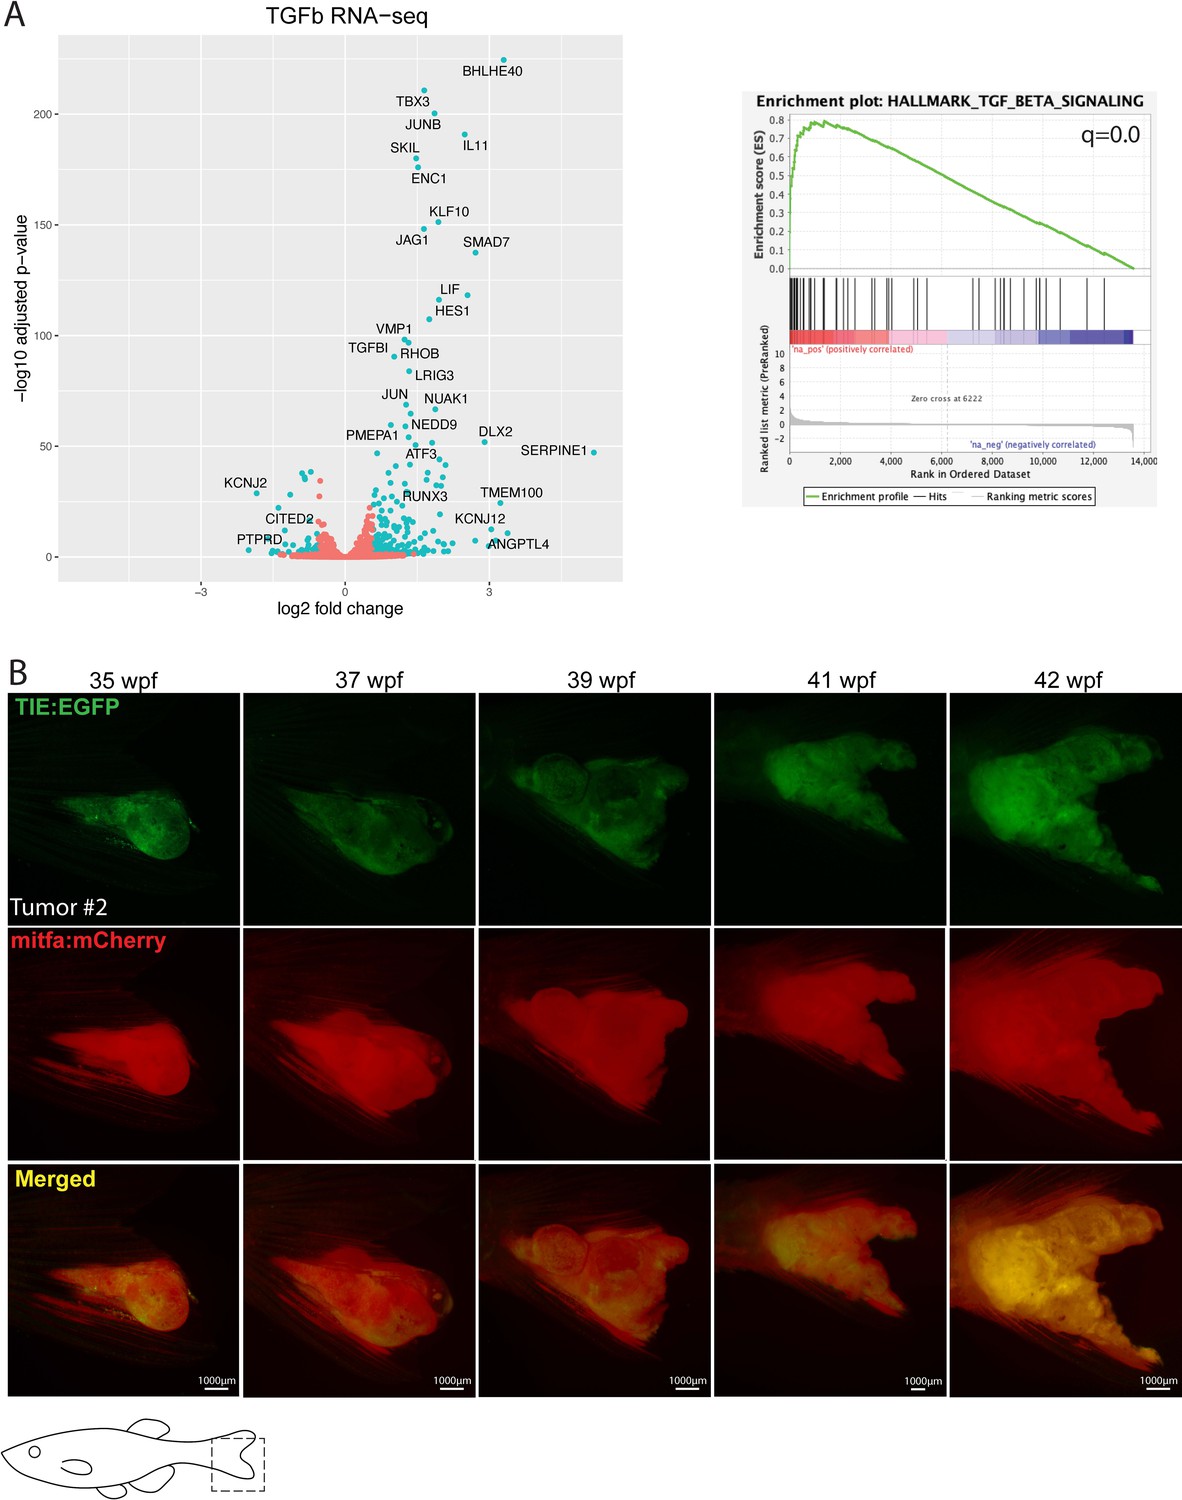
Treatment with human recombinant TGFB1 activates the TGFb pathway in human melanoma cells.
(A) (Left) RNA-sequencing indicated that following a 2-hr treatment with 10 ng/mL TGFB1, 223 genes were significantly up-regulated (q<0.05), including typical TGFb target genes such as SMAD7, JUNB, and PMEPA1, while 94 genes were down-regulated. This Volcano plot indicates top up- and down-regulated genes upon TGFB1 treatment. (Right) Hallmark gene set enrichment analysis (GSEA) of genes ranked by log2 fold-change (log2fc) confirmed that TGFb was the top up-regulated pathway (q=0). RNA-seq was performed in triplicate. (B) TIE:EGFP+ melanoma #2 expressing MCR:MCS. TIE:EGFP expression across melanomagenesis. Representative images shown. Illustrated fish diagrams in (B) created with BioRender.com, and published using a CC BY-NC-ND license with permission.
© 2024, BioRender Inc. Figure 1—figure supplement 2 was created using BioRender, and is published under a CC BY-NC-ND 4.0. Further reproductions must adhere to the terms of this license.
Figure 1—figure supplement 3
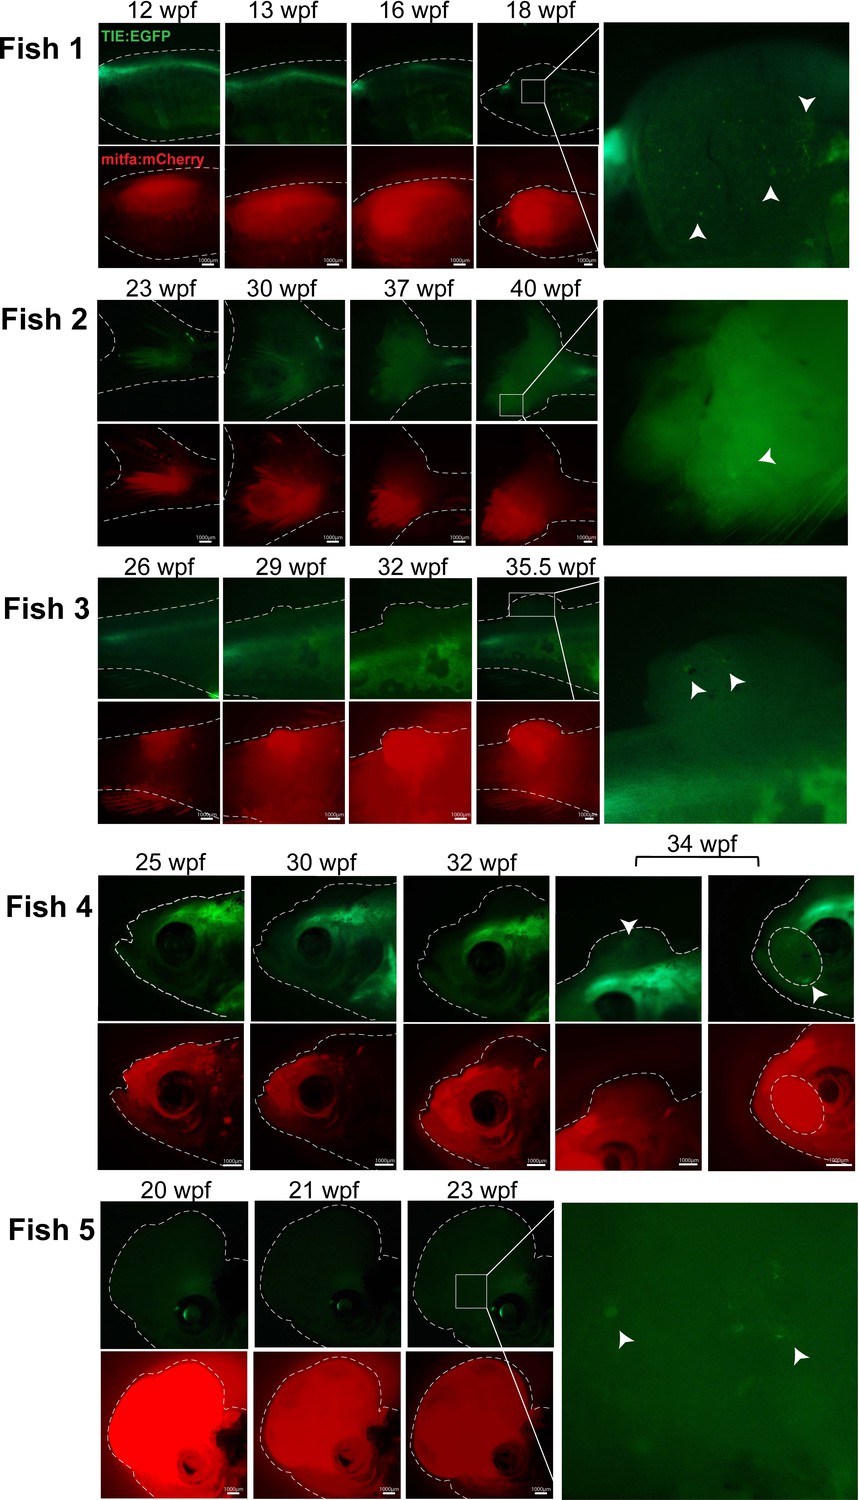
TIE:EGFP expression across melanomagenesis in several additional TIE:EGFP;Tg(mitfa:BRAFV600E);p53-/-;mitfa-/-;MCR:MCS;mitfa:mCherry;tyr-/- fish.
Clusters of TIE:EGFP+ cells indicated by white arrowheads.
Figure 2 with 2 supplements
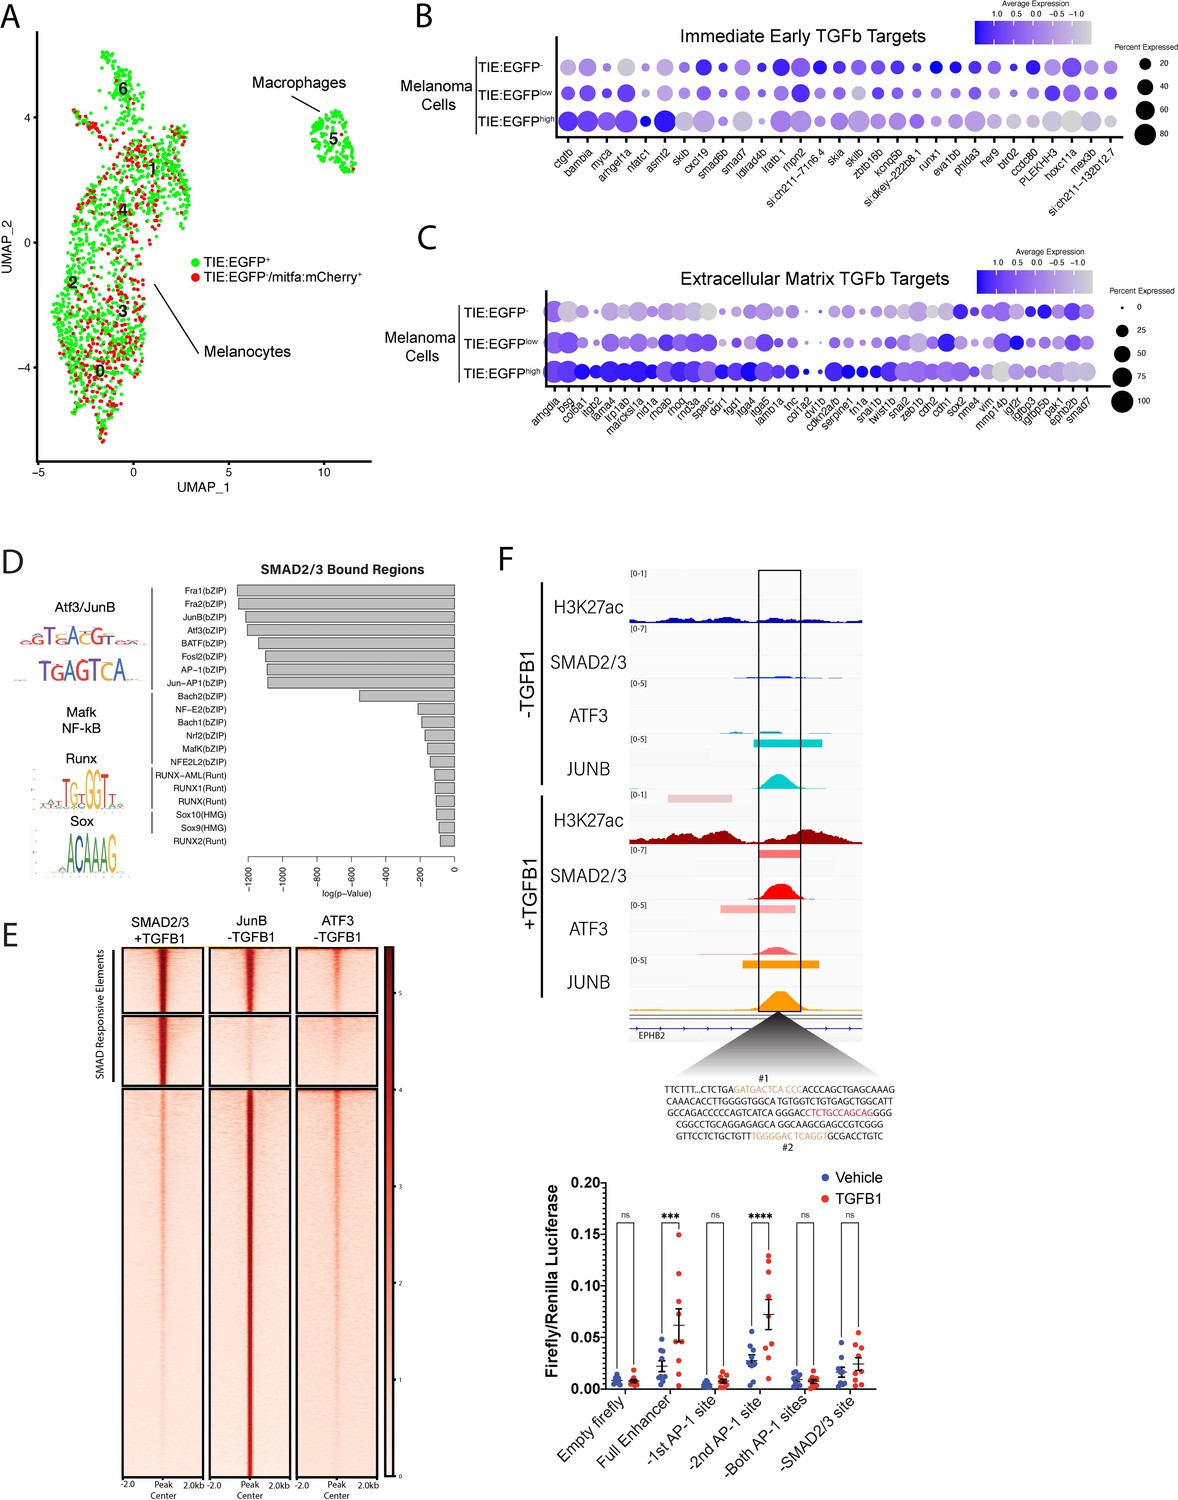
TGFb responsive melanoma cells in MCR:MCS tumors up-regulate chronic extracellular matrix TGFb target genes and AP-1 binding is required for TGFb responsiveness.
(A) (Left) UMAP depicting seven cell clusters identified by SORT-seq, combined two MCR:MCS biological replicates. Approximately 2256 TIE:EGFP+ cells and 752 mitfa:mCherry+;TIE:EGFP- cells (as a control) were sorted by flow cytometry for scRNA-seq. TIE:EGFP+ cells were both mitfa:mCherry+ and mitfa:mCherry-. In analysis of the scRNA-seq data, melanoma cells were identified as being mitfa and sox10 positive, while macrophages were identified as mpeg1.1 and marco positive. (B) Dotplot depicting TGFb immediate-early target gene expression in TIE:EGFPhigh, TIE:EGFPlow, and TIE:EGFP- melanoma cells. Melanoma cells can be segregated into TIE:EGFPhigh vs. TIE:EGFPlow based on EGFP intensity during sorting. (C) Dotplot depicting extracellular matrix TGFb target gene expression in TIE:EGFPhigh, TIE:EGFPlow, and TIE:EGFP- melanoma cells. (D) HOMER motif analysis of regulatory regions bound by SMAD2/3 upon stimulation in A375 cells. (E) Heatmap showing binding of JUNB and ATF3 pre-stimulus at 12,000 SMAD2/3-responsive elements in A375. (F) (Top) IGV plot of H3K27ac, SMAD2/3, ATF3 and JUNB ChIP-seq +/- TGFB1 stimulus at the TGFb-induced enhancer. Inset depicts sequence under SMAD2/3 ChIP-seq peak and highlights AP-1 (orange) and SMAD2/3 (red) binding sites. (Bottom) Firefly luciferase luminescence of full TIE reporter or reporter lacking AP-1 or SMAD2/3 sites. Normalized to Renilla transfection control. Experiment performed three times with three technical replicates each. A two-way multiple comparison ANOVA was used to calculate significance.
Figure 2—figure supplement 1
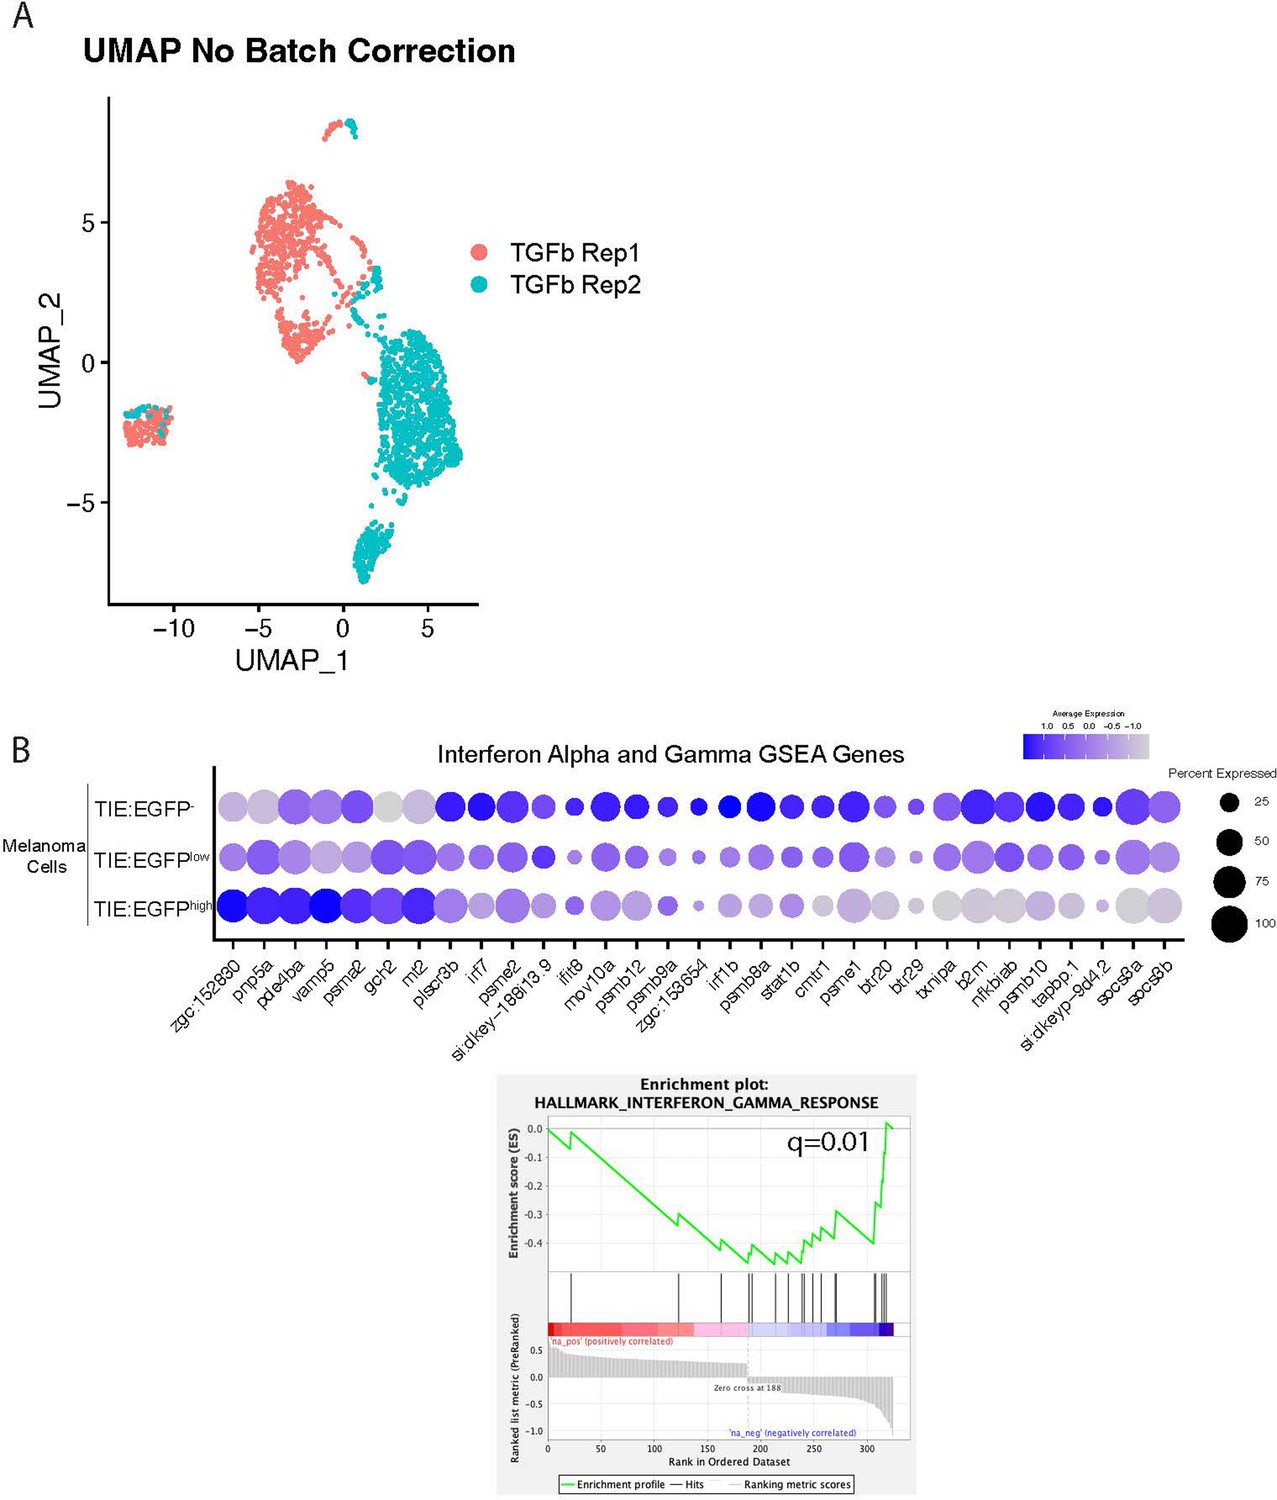
TGFb responsive melanoma cells down-regulate interferon target genes.
(A) UMAP with no batch correction of 2 MCR:MCS replicate melanomas combined in Figure 2A. Approximately 2,256 TIE:EGFP+ cells and 752 mitfa:mCherry+; TIE:EGFP- cells (as a control) were sorted for scRNA-seq. (B) (Top) Dotplot depicting interferon target gene expression in TIE:EGFPhigh, TIE:EGFPlow, and TIE:EGFP- melanoma cells. (Bottom) GSEA enrichment plot reveal down-regulated interferon gamma (q=0.01) in TIE:EGFP+ melanoma cells. The internal control for these comparisons was TIE:EGFP- melanoma cells from the same tumor.
Figure 2—figure supplement 2
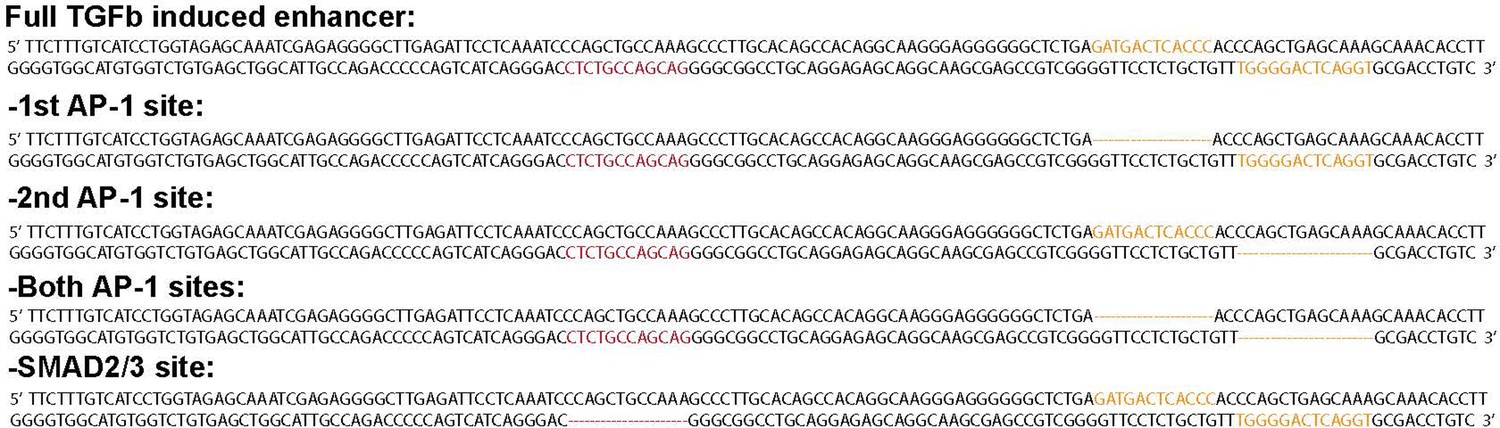
Mutated TGFb inducible enhancer sequences used for luciferase assays in Figure 2F.
AP-1 motifs are in orange, SMAD2/3 motif is in red.
-
Figure 2—figure supplement 2—source data 1
Editable version of Figure 2—figure supplement 2.
- https://cdn.elifesciences.org/articles/83527/elife-83527-fig2-figsupp2-data1-v1.ai
Figure 3 with 2 supplements
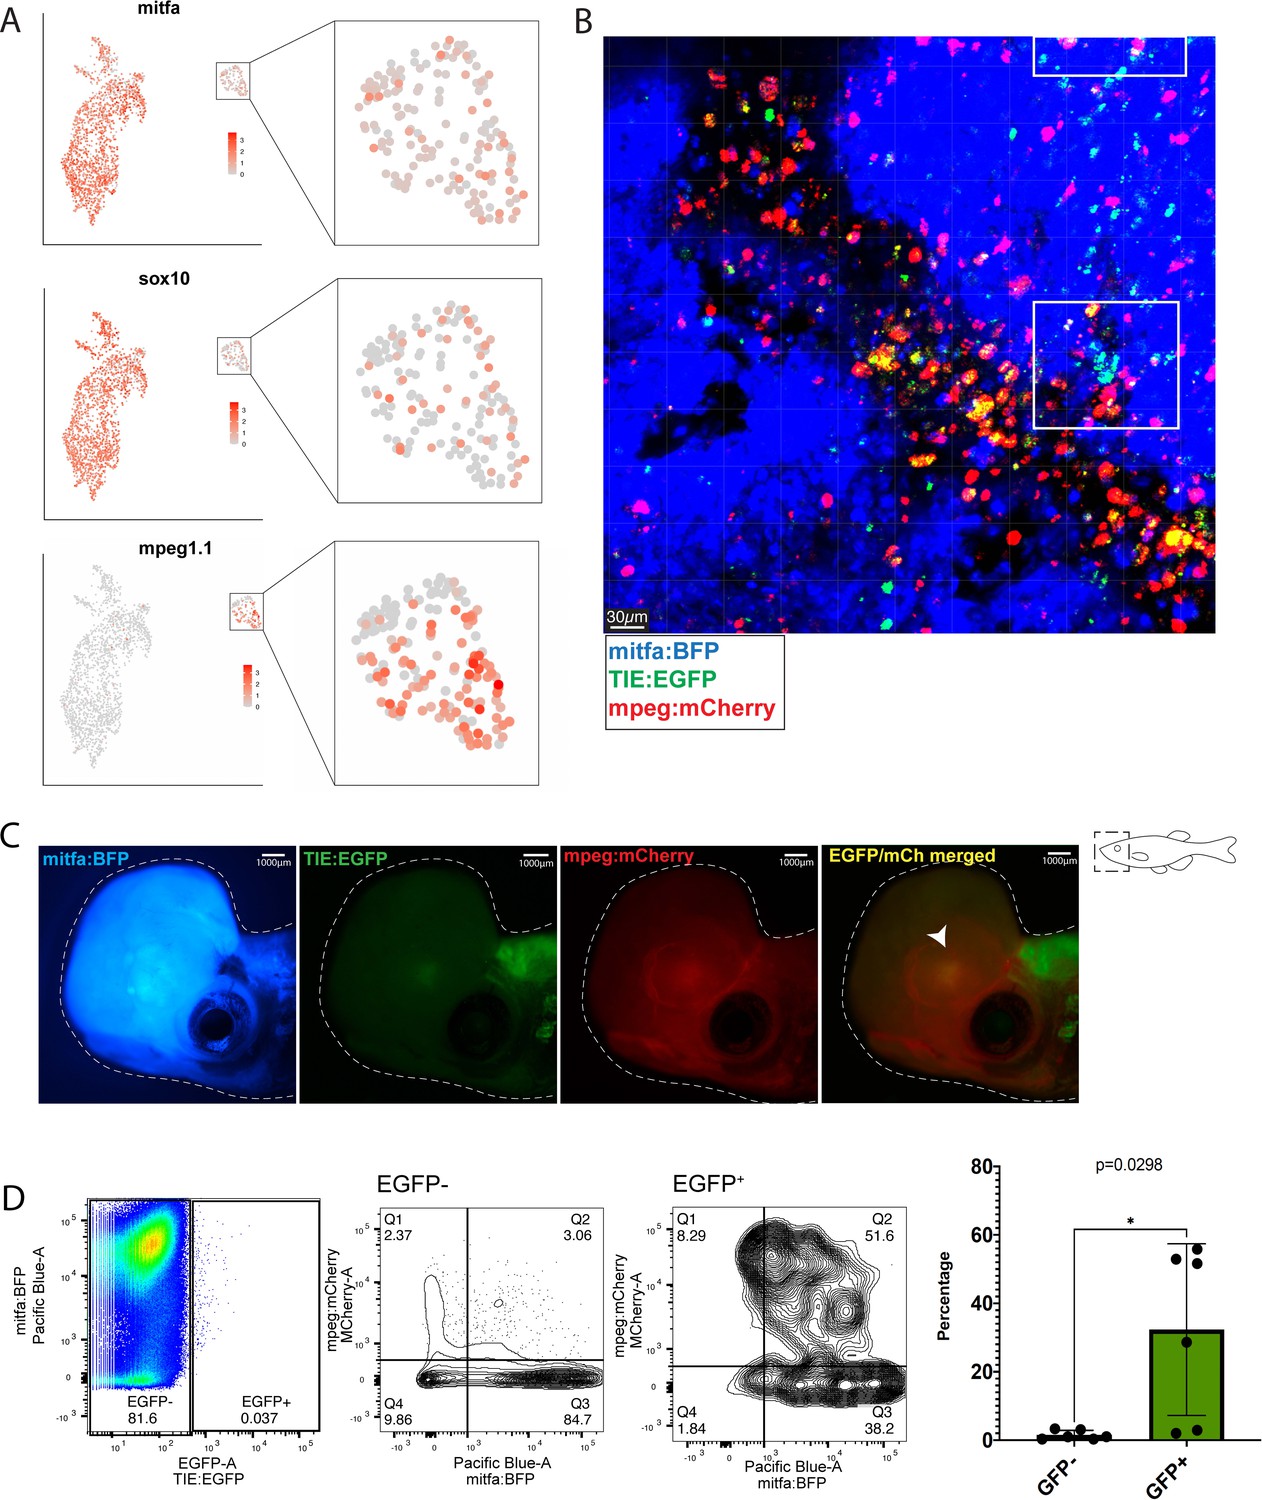
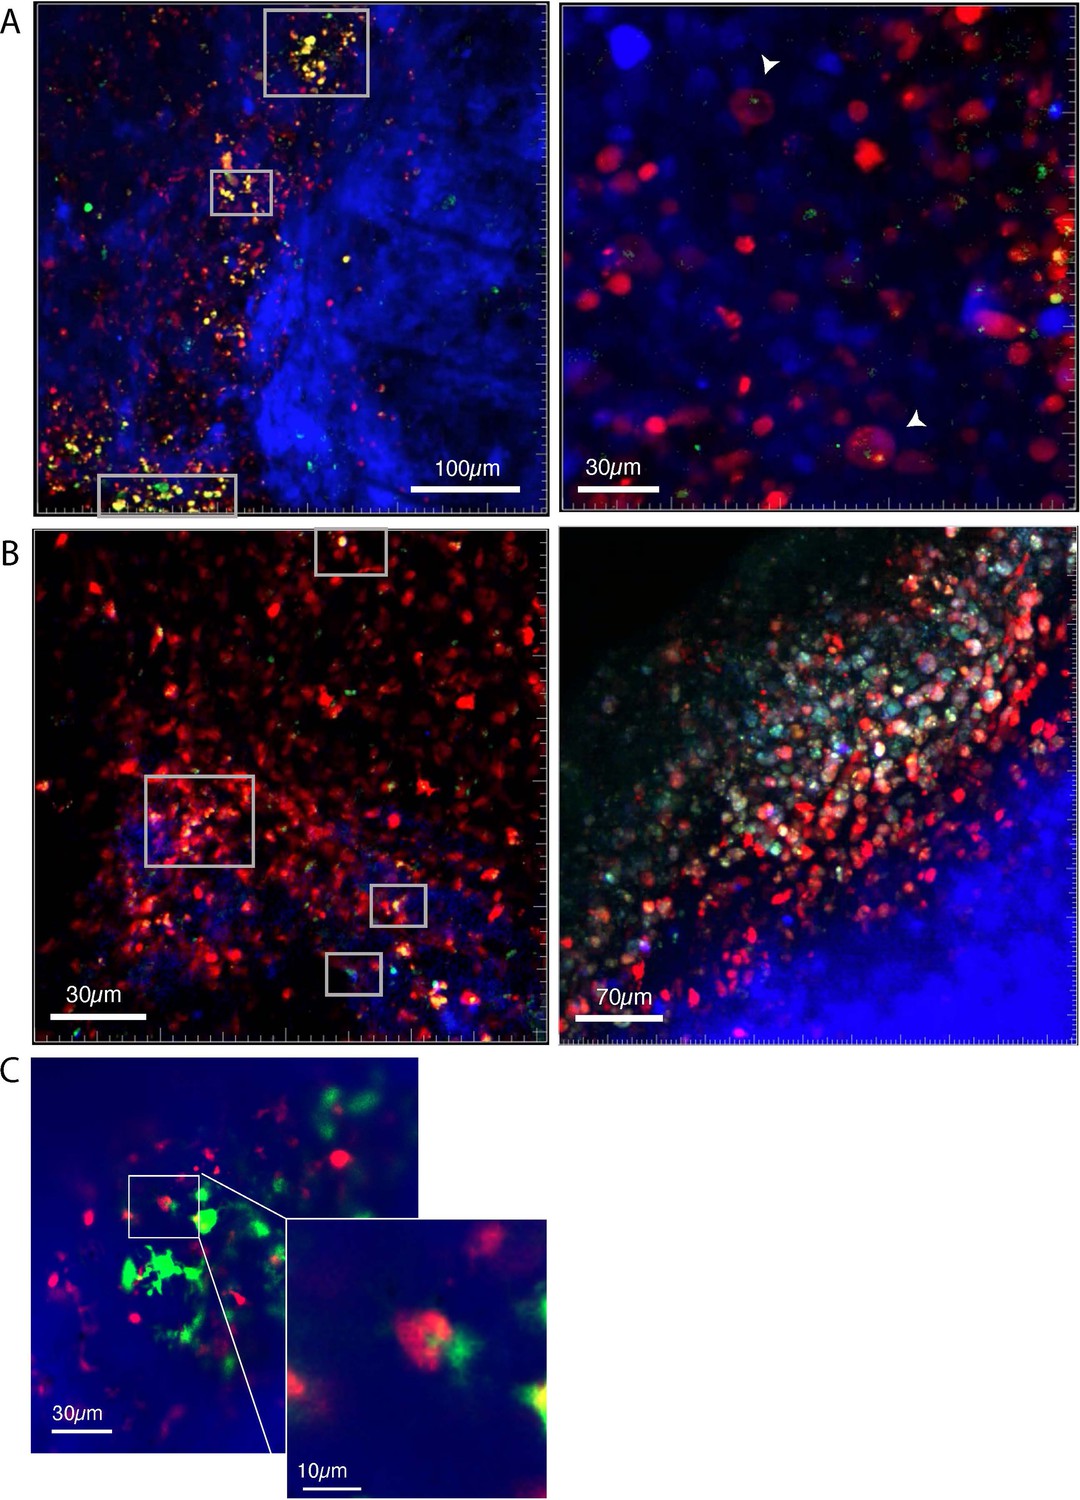
Macrophages preferentially phagocytose TIE:EGFP+ cells.
(A) UMAP depicting mitfa, sox10, and mpeg1.1 expression in clusters identified by SORT-seq, combined two MCR:MCS melanoma replicates. Inset shows expression of these genes in the macrophage cluster. (B) Representative image from a zebrafish melanoma acquired on an upright confocal, n=13 fish. Additional images shown in Figure 3—figure supplement 1. Melanoma cells are blue, macrophages are red, and TIE:EGFP+ cells are green. Yellow indicates a macrophage that has phagocytosed a TGFb responsive cell, which often appears as fragments within macrophages. A macrophage that expresses the TIE:EGFP endogenously would express EGFP throughout the entire cell, rather than in fragments. Cyan indicates a TIE:EGFP+ melanoma cell. When phagocytosed by macrophages, TIE:EGFP+ melanoma cells appear white, which are indicated within in the white boxes. (C) Representative TIE:EGFP+;mpeg:mCherry+;mitfa:BFP+ melanoma used for flow analysis of macrophages. Scale bars indicate 1000 µm. The EGFP+ region adjacent to the tumor is endogenous TIE:EGFP+ expression of the brain. (D) (Far left) Viable cells were separated into TIE:EGFP- and TIE:EGFP+. (Middle) FACS plots showing TIE:EGFP- and TIE:EGFP+ cells relative to mpeg:mCherry and mitfa:BFP. Q1 in the TIE:EGFP- plot represents macrophages that have not phagocytosed any melanoma cells. Q2 represents macrophages that have phagocytosed TIE:EGFP- melanoma cells. Q1 in the TIE:EGFP+ plot represents macrophages that have not phagocytosed melanoma cells, but rather express the TIE:EGFP reporter endogenously or phagocytosed a TIE:EGFP+ non-melanoma cell. Q2 represents macrophages that have phagocytosed TIE:EGFP+ melanoma cells. (Far right) Q2 of both plots are graphed to represent the percentage of all TIE:EGFP- or TIE:EGFP+ live cells that are melanoma cells phagocytosed by macrophages. Two-tailed unpaired Welch’s t-test was used to calculate significance. n=3 fish with two technical replicates each. Illustrated fish diagram in (C) created with BioRender.com, and published using a CC BY-NC-ND license with permission.
© 2024, BioRender Inc. Figure 3 was created using BioRender, and is published under a CC BY-NC-ND license. Further reproductions must adhere to the terms of this license.
Figure 3—figure supplement 1
Macrophages phagocytose TIE:EGFP+ cells.
Representative images showing several zebrafish melanomas acquired on an upright confocal microscope. Fish were anesthetized using tricaine and images were acquired of tumors in live fish. Melanoma cells are blue, macrophages are red, and TIE:EGFP+ cells are green. Yellow indicates TIE:EGFP+ macrophages, which results from endogenous reporter expression or from phagocytosis of a TIE:EGFP+ cell, in which case yellow signal appears as fragments within macrophages. Cyan indicates a TIE:EGFP+ melanoma cell. When phagocytosed by macrophages, TIE:EGFP+ melanoma cells appear white because of mitfa:BFP, TIE:EGFP, and mpeg:mCh co-localization. (A) (Left) White boxes indicate diffusely yellow macrophages that express TIE:EGFP endogenously. (Right) Higher magnification in a different tumor shows that TIE:EGFP+ fragments are contained in macrophages occasionally in endosome-like structures, seen most clearly by the cell indicated by the lowest white arrowhead. Z projection, single frame. (B) (Left) White cells (indicating macrophages that have phagocytosed TIE:EGFP+ melanoma cells) are indicated within white boxes. (Right) A TIE:EGFP+ patch in a separate tumor is composed of macrophages engaged with TIE:EGFP+ tumor cells. White signal represents mpeg:mCh+ macrophages that have engulfed TIE:EGFP+ mitfa:BFP+ tumor cells. Z projection, single frame. (C) Image of a macrophage actively phagocytosing a TIE:EGFP+ cell in a tumor. Image taken via optical sectioning, single frame. In total, n=13 tumors analyzed by confocal microscopy.
Figure 3—figure supplement 2

qPCR shows that TIE:EGFP+ macrophages express higher levels of melanocyte markers mitfa and sox10 (compared to TIE:EGFP- macrophages), validating that macrophages preferentially phagocytose TGFb responsive melanoma cells.
Two Tg(mitfa:BRAFV600E);p53-/-;mitfa-/-;MCR:MCS tumors expressing TIE:EGFP and mpeg:mCherry were dissected and TIE:EGFP+;mpeg:mCherry+ macrophages and TIE:EGFP-;mpeg:mCherry+ macrophages were isolated by FACS. RNA was extracted, reverse transcribed, and qPCR was performed. Graphed here are individual replicate values and their mean, and error bars represent standard deviation. Two-tailed unpaired t-test was used to calculate significance. n=2 fish with three technical replicates.
Figure 4 with 1 supplement
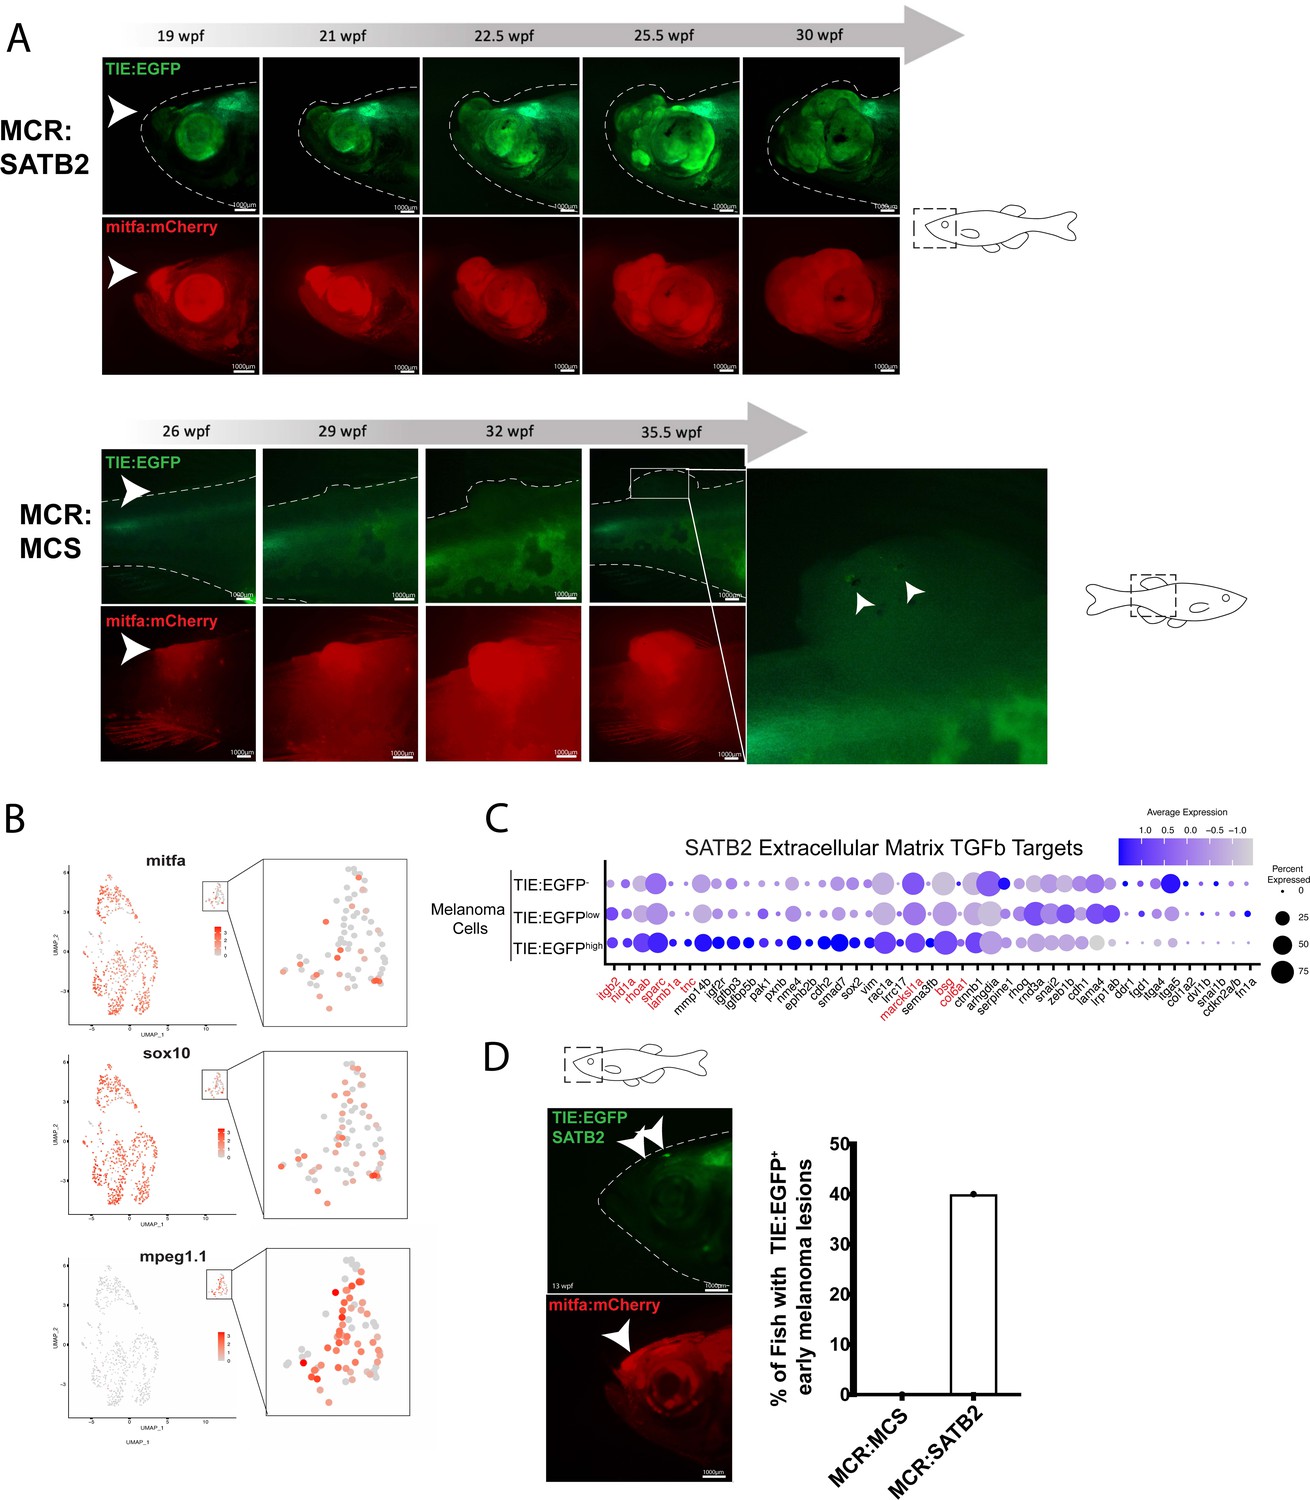
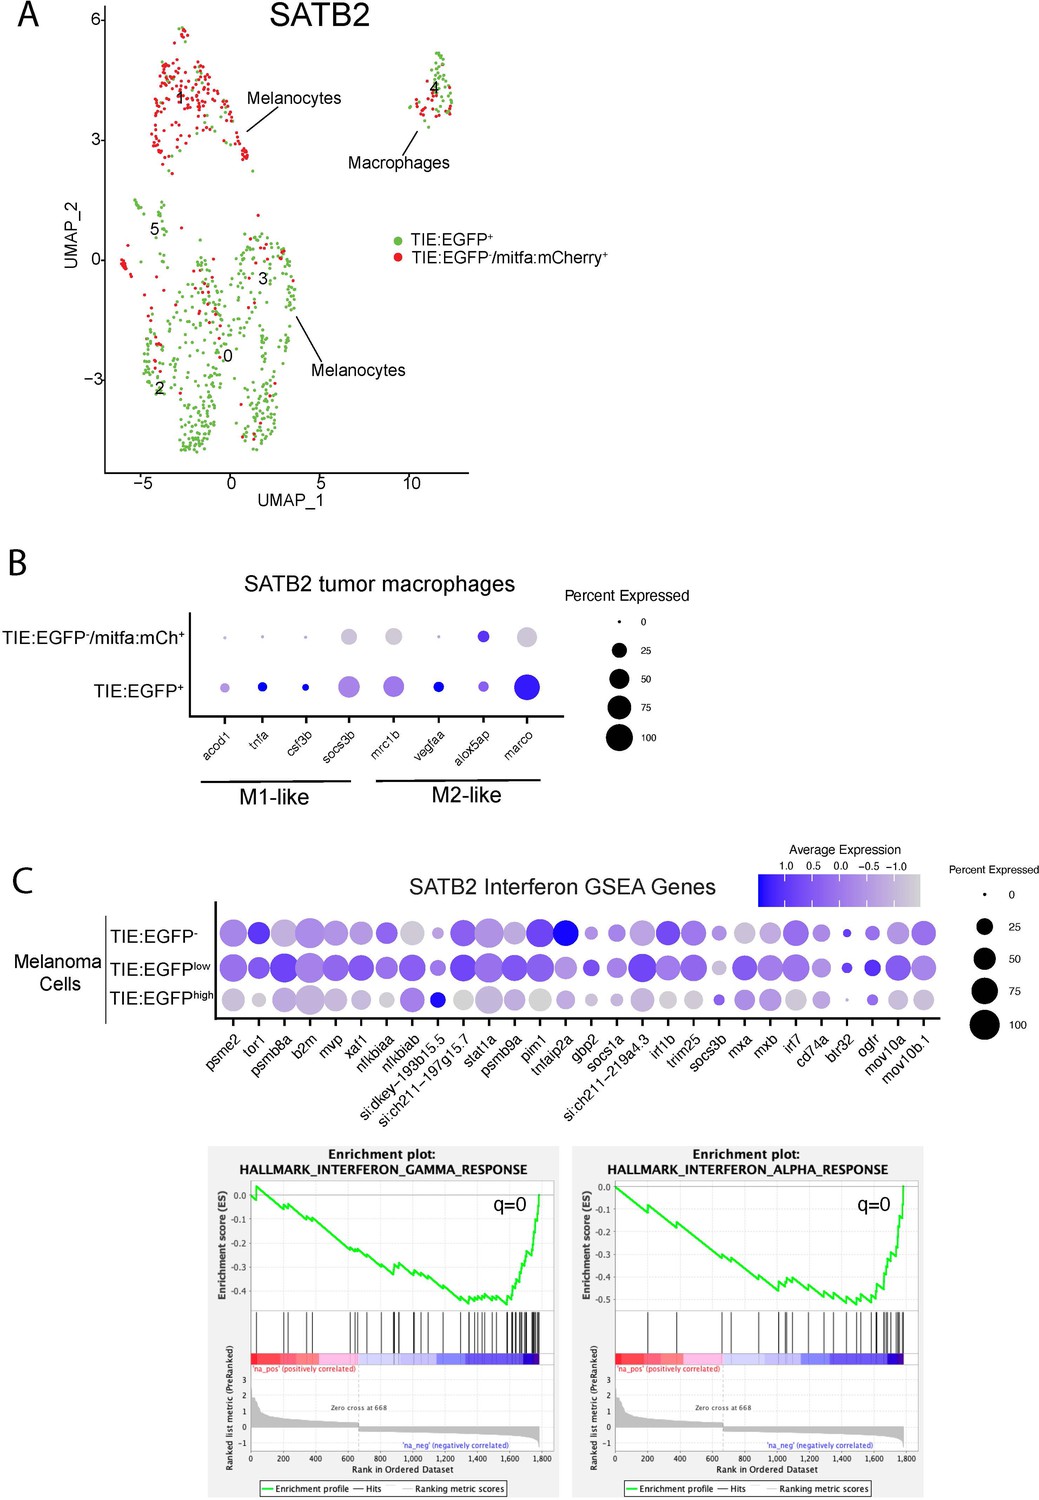
SATB2 expressing melanomas exhibit TIE:EGFP expression in early initiating lesions.
(A) (Top) Development of a representative tumor overexpressing MCR:SATB2 in TIE:EGFP;Tg(mitfa:BRAFV600E);p53-/-;mitfa-/- zebrafish. Arrowhead indicates TIE:EGFP+ early melanoma before tumor formation. This EGFP+ region is separate from the endogenous TIE:EGFP+ expression of the brain. (Bottom) Development of a control MCR:MCS tumor in TIE:EGFP;Tg(mitfa:BRAFV600E);p53-/-;mitfa-/- zebrafish, for reference. (B) UMAP depicting mitfa, sox10, and mpeg1.1 expression in clusters identified by SORT-seq of SATB2 expressing tumor in (A). Inset shows expression of these genes in the macrophage cluster. (C) Dotplot depicting extracellular matrix TGFb target gene expression in TIE:EGFPhigh, TIE:EGFPlow, and TIE:EGFP- SATB2 expressing melanoma cells. Genes shown in red are genes that are also upregulated in control MCR:MCS tumors. (D) Early initiating melanoma (arrowhead) overexpressing MCR:SATB2 in TIE:EGFP;Tg(mitfa:BRAFV600E);p53-/-;mitfa-/- zebrafish. Representative image chosen. 40% of MCR:SATB2 early melanomas (n=27) express TIE:EGFP, compared to 0% of MCR:MCS early melanomas (n=56) (quantification on right). Illustrated fish diagrams in (A, D) created with BioRender.com, and published using a CC BY-NC-ND license with permission.
© 2024, BioRender Inc. Figure 4 was created using BioRender, and is published under a CC BY-NC-ND license. Further reproductions must adhere to the terms of this license.
Figure 4—figure supplement 1
Single-cell RNA-seq identifies TIE:EGFP+ macrophages and melanoma cells in an MCR:SATB2 tumor.
(A) (Left) UMAP depicting six cell clusters identified by SORT-seq. Approximately 867 TIE:EGFP+ cells and 376 mitfa:mCherry+;TIE:EGFP- cells (as a control) were sorted into individual wells using flow cytometry. TIE:EGFP+ cells were both mitfa:mCherry+ and mitfa:mCherry-. In scRNA-seq data analysis, melanoma cells were identified as being mitfa and sox10 positive, while macrophages were identified as mpeg1.1 and marco positive. (B) Macrophages were subset from the UMAP, and this dotplot depicts M1-like and M2-like transcriptional marker expression in TIE:EGFP+ and TIE:EGFP- macrophages. The top row indicates TIE:EGFP- macrophages (which happen to be mitfa:mCherry+ because they phagocytosed TIE:EGFP- melanoma cells). The bottom row indicates macrophages that express TIE:EGFP endogenously or phagocytosed TIE:EGFP+ cells. Some of these macrophages expressed mitfa:mCherry, representing macrophages that had phagocytosed TIE:EGFP+ melanoma cells. (C) (Top) Dotplot depicting expression of interferon alpha and gamma GSEA pathway genes in TIE:EGFPhigh, TIE:EGFPlow, and TIE:EGFP- melanoma cells. (Bottom) GSEA enrichment plots reveal down-regulated interferon alpha (q=0) and gamma (q=0.0) in TIE:EGFP+ melanoma cells.
Author response image 1

qPCR shows that IFN target genes are down-regulated in TIE:EGFPhigh melanoma cells compared to TIE:EGFP- melanoma cells.
Two Tg(mitfa:BRAFV600E);p53-/-;mitfa-/- tumors expressing TIE:EGFP, mitfa:BFP and mpeg:mCherry were dissociated for FACS. We sorted two populations of cells: TIE:EGFPhigh mitfa:BFP+ mpeg:mCherry-, and TIE:EGFP- mitfa:BFP+ mpeg:mCherry-. Here, we gated for mitfa:BFP+ melanoma cells, gating out the macrophage population which may contain mitfa:BFP due to tumor cell phagocytosis. We isolated RNA from these sorted populations, performed cDNA synthesis, and performed qPCR. We used housekeeping gene b-actin to normalize values according to loading differences. Here, we confirmed that 4 major IFN genes discussed in the manuscript are down-regulated: irf7, irf1b, stat1b, and b2m. We included 3 additional IFN genes here to further validate the IFN pathway trend: mxa, mxb, and isg15. Fold change of mitfa is included here as a negative control, as we do not expect its expression to change between the two conditions. N=2 tumors, 3 technical replicates each. 2-tailed, unpaired t-tests were performed.
Author response image 2

ScRNA-seq shows that expression of IFN target genes increases in tumors compared to normal skin and precursor lesions.
Mitfa:BFP+ melanocytes were sorted via FACS from normal skin, an early melanoma, and an advanced melanoma and 10X single-cell RNA-seq was performed. Data was analyzed using Seurat and cell types were called based on gene expression signatures. Depicted here are violin plots of several IFN target genes in melanocytes across the three stages.
Tables
Author response table 1
List of top up-regulated genes in TIE:EGFP+ melanoma cells of MCR:MCS and MCR:SATB2 tumors, as defined by SORT-seq.
These genes are also listed in manuscript Figures 2C and 4C.
| MCS | Shared | SATB2 |
|---|---|---|
| arhgdia | bsg | mmp14b |
| lama4 | col6a1 | igf2r |
| lrp1ab | itgb2 | igfbp3 |
| rhoq | marcksl1a | igfbp5b |
| rnd3a | nid1a | pak1 |
| ddr1 | rhoab | pxnb |
| fgd1 | sparc | nme4 |
| itga4 | lamb1a | ephb2b |
| itga5 | tnc | cdh2 |
| col1a2 | smad7 | |
| dv1b | sox2 | |
| cdkn2a | vim | |
| cdkn2b | rac1a | |
| serpine1 | lrrc17 | |
| fn1a | sema3fb | |
| snai1b | ctnnb1 | |
| twist1b | ||
| snai2 |
Additional files
Download links
A two-part list of links to download the article, or parts of the article, in various formats.
Downloads (link to download the article as PDF)
Open citations (links to open the citations from this article in various online reference manager services)
Cite this article (links to download the citations from this article in formats compatible with various reference manager tools)
A chronic signaling TGFb zebrafish reporter identifies immune response in melanoma
eLife 13:e83527.
https://doi.org/10.7554/eLife.83527


