Quantitative trait and transcriptome analysis of genetic complexity underpinning cardiac interatrial septation in mice using an advanced intercross line
- Victor Chang Cardiac Research Institute, Australia
- School of Clinical Medicine, Faculty of Medicine and Health, UNSW Sydney, Australia
- Department of Infectious Disease, Faculty of Medicine, Imperial College London, United Kingdom
- Centre for Clinical Genetics, Sydney Children’s Hospital, Australia
- Randwick Genomics Laboratory, NSW Health Pathology, Australia
- School of Biotechnology and Biomolecular Sciences, Faculty of Science, UNSW Sydney, Australia
- Sydney School of Veterinary Science, University of Sydney, Australia
Figures
Figure 1 with 1 supplement
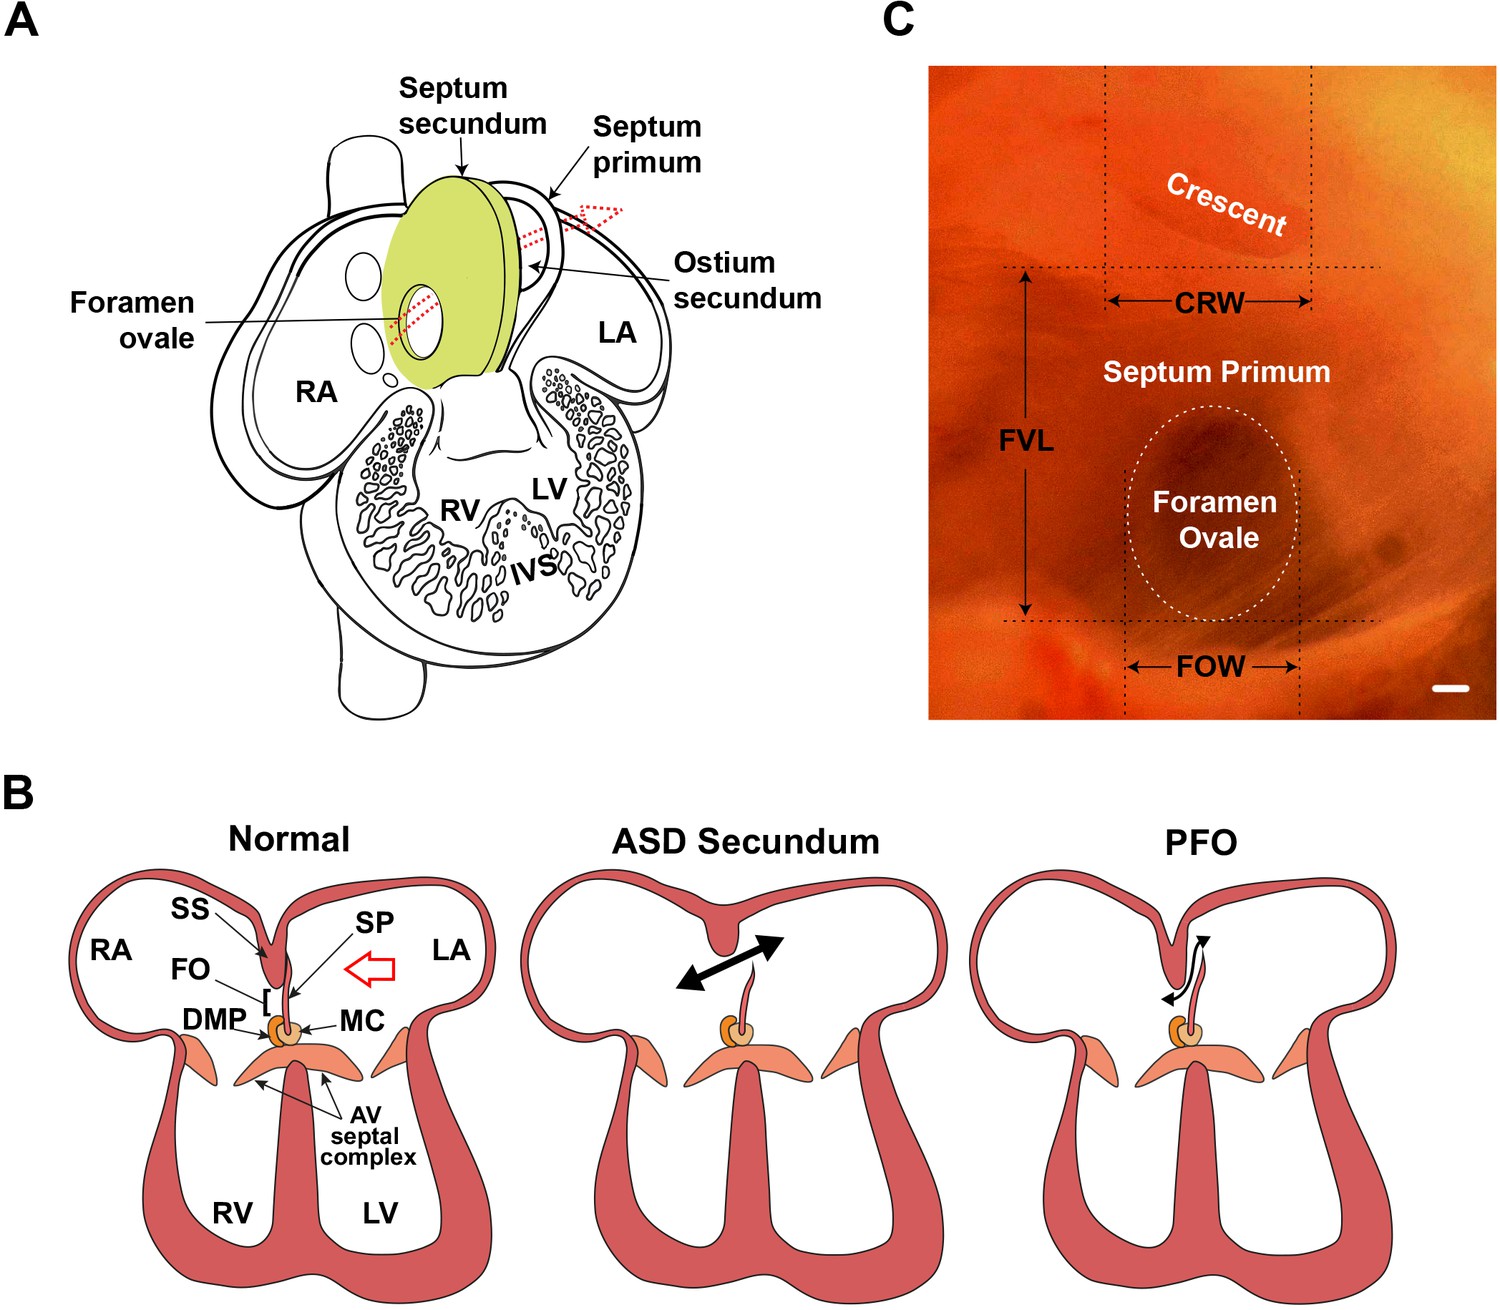
Atrial septal morphology in normal adult and congenital heart disease.
(A) Schematic of human fetal heart highlighting inter-atrial septal structures. In the fetal heart, the septum primum has not yet fused with the septum secundum, as in adult stages; thus, the foramen ovale is patent. The foramen ovale and ostium secundum are offset, creating a flap valve. Arrow shows the direction of the blood shunt, allowing blood to bypass the pulmonary circuit. (B) Schematic of atrioventricular septal complex in the adult heart, and dysmorphology associated with the more common secundum type of atrial septal defect (ASD), and patent foramen ovale (PFO). Red arrow in the normal heart indicates the viewpoint for panel C. Double-headed black arrows indicate blood flow in pathological settings. (C) Light micrograph of the interatrial septum of an adult mouse heart as seen after removal of the left atrial appendage. The annulus of the mitral valve is towards the lower left of this panel. Note that the foramen ovale is covered by the membranous atrial septum primum, which is foremost in the left viewpoint (see red arrow in panel B). Septal landmarks are shown along with quantitative atrial septal traits measured in F2 and F14 studies. The crescent corresponds to the upper edge (see A) of the atrial septum primum. Scale bar, 100 µm. AV: atrioventricular; CRW: crescent width; DMP: dorsal mesenchymal protrusion; FO: foramen ovale; FOW: foramen ovale width; FVL: flap valve length; IVS: interventricular septum; LA: left atrium; LV: left ventricle; MC: mesenchymal cap; RA: right atrium; RV: right ventricle; SP: septum primum; SS: septum secundum.
© 2001, Elsevier. Figure 1A has been adapted from Figure 7-16 from Larsen, 1997, with permission from Elsevier. It is not covered by the CC-BY 4.0 license and further reproduction of this panel would need permission from the copyright holder.
© 2001, Elsevier. Figure 1C has been adapted from Figure 1 from Kirk et al., 2006.
Figure 1—figure supplement 1
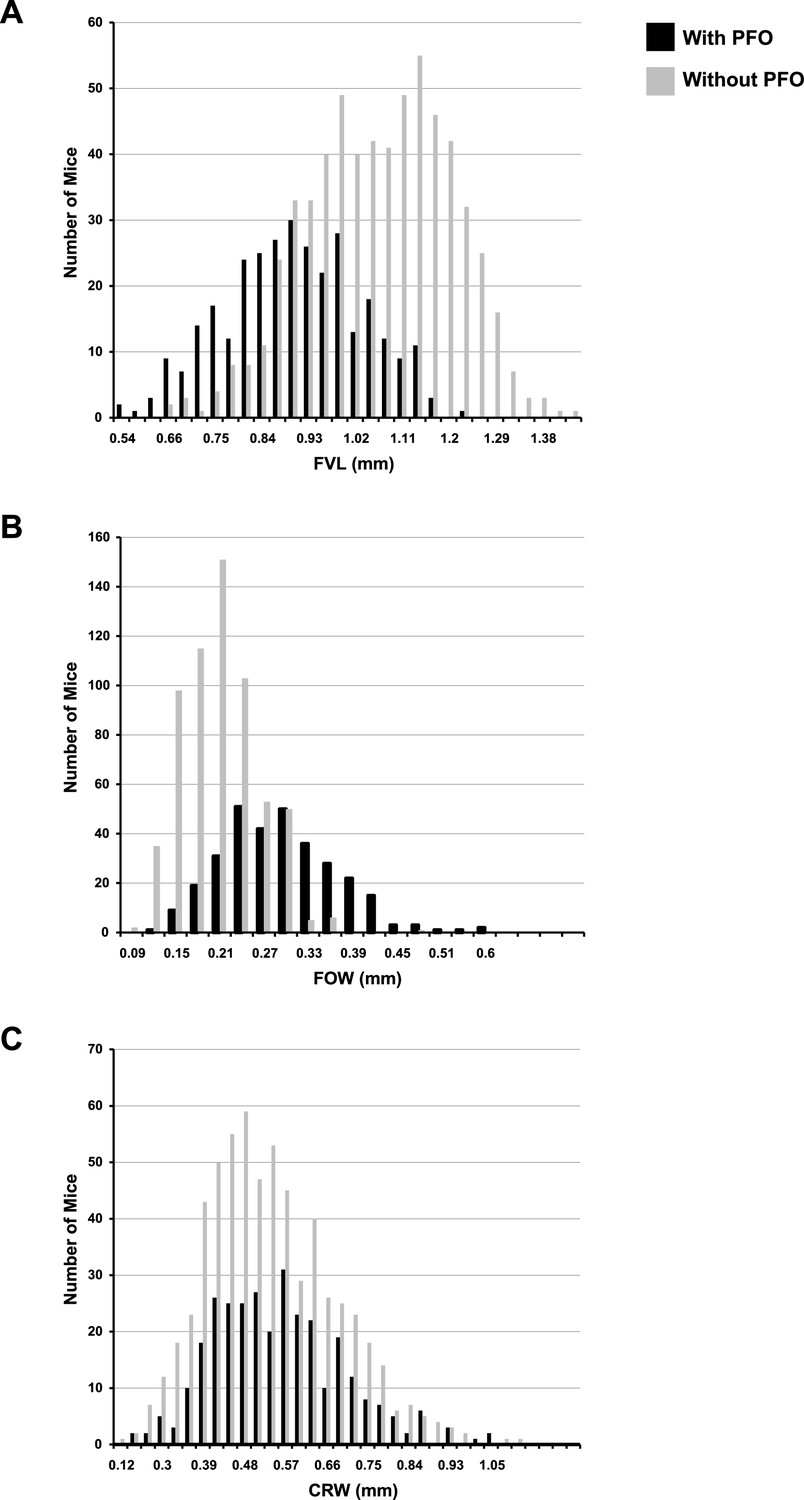
Histograms of quantitative traits in F14 mice with and without patent foramen ovale (PFO).
Figure 2 with 1 supplement
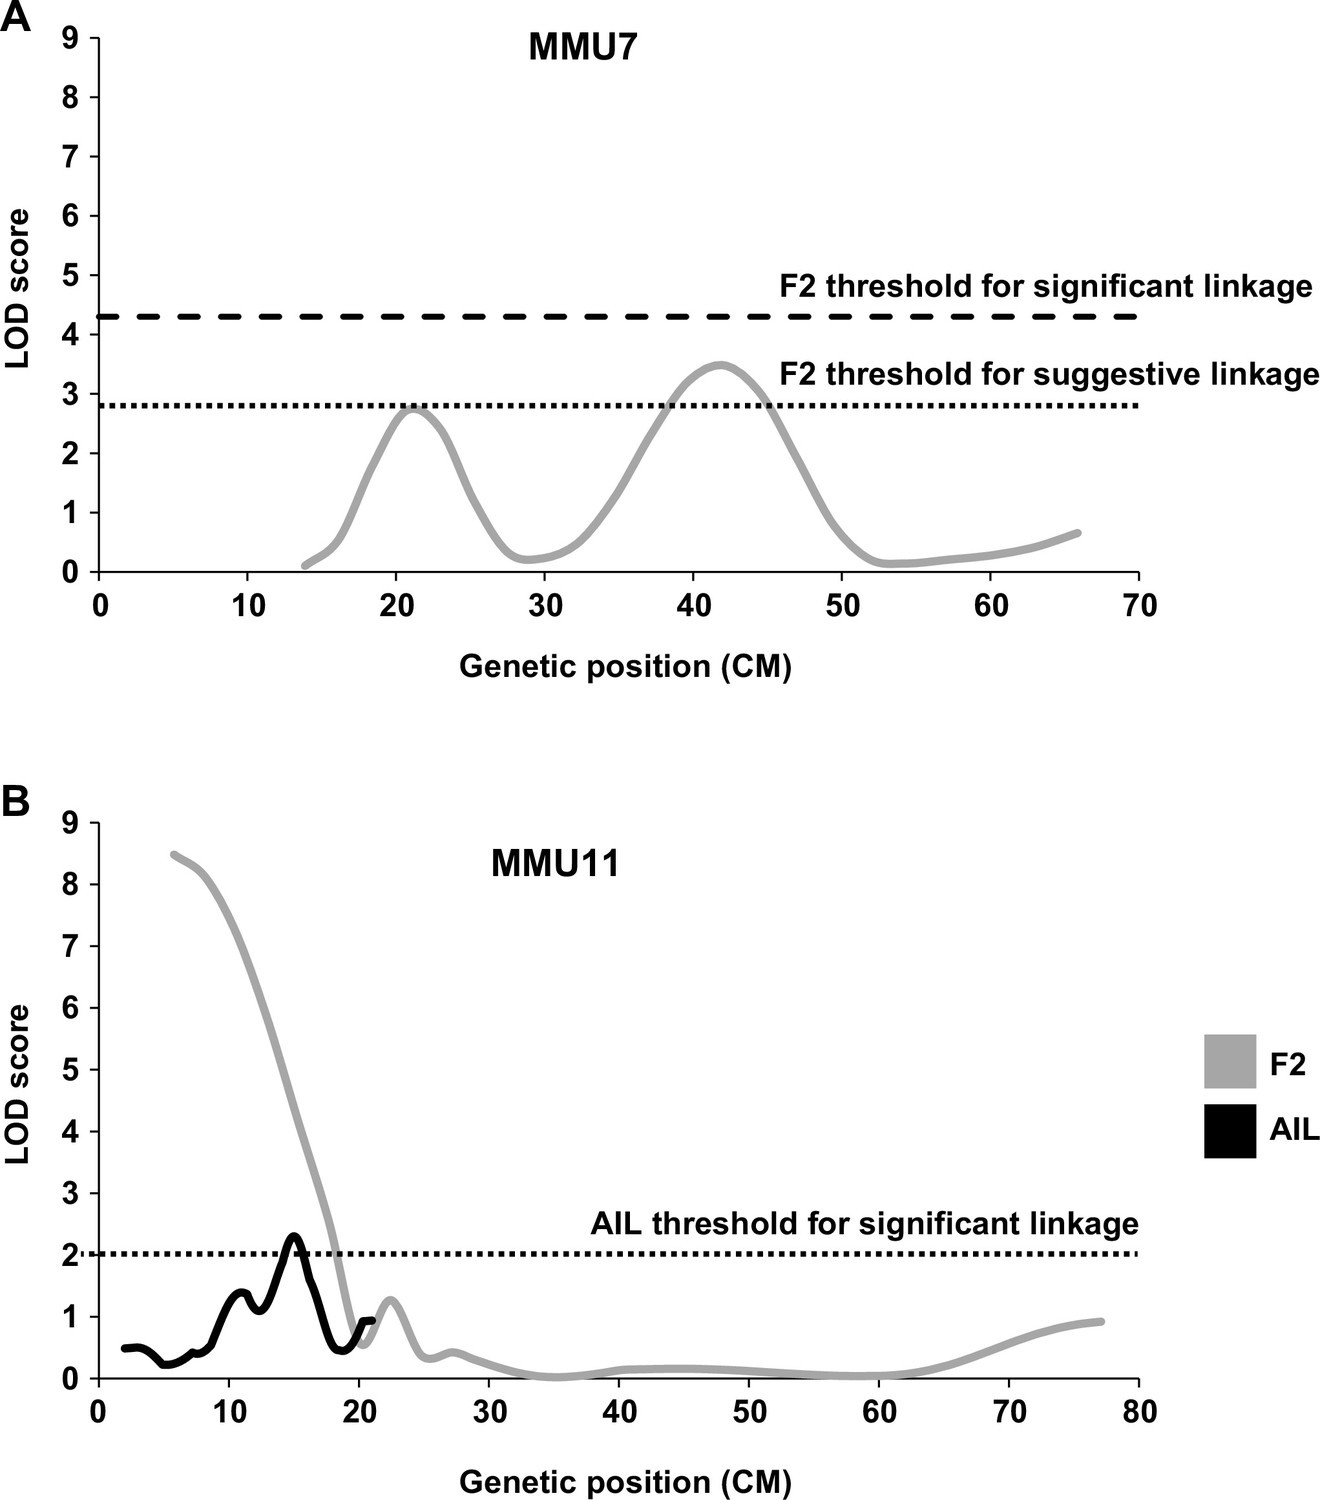
Linkage analysis for heart weight (HW).
Suggestive and significant quantitative trait loci (QTL) identified on MMU7 (A) and MMU11 (B) by retrospective analysis of HW in the F2 study, the latter being fine-mapped by the advance intercross line (AIL) study. Y-axes represent logarithm of odds (LOD) scores for HW adjusted for age, sex, and body weight (BW).
Figure 2—figure supplement 1
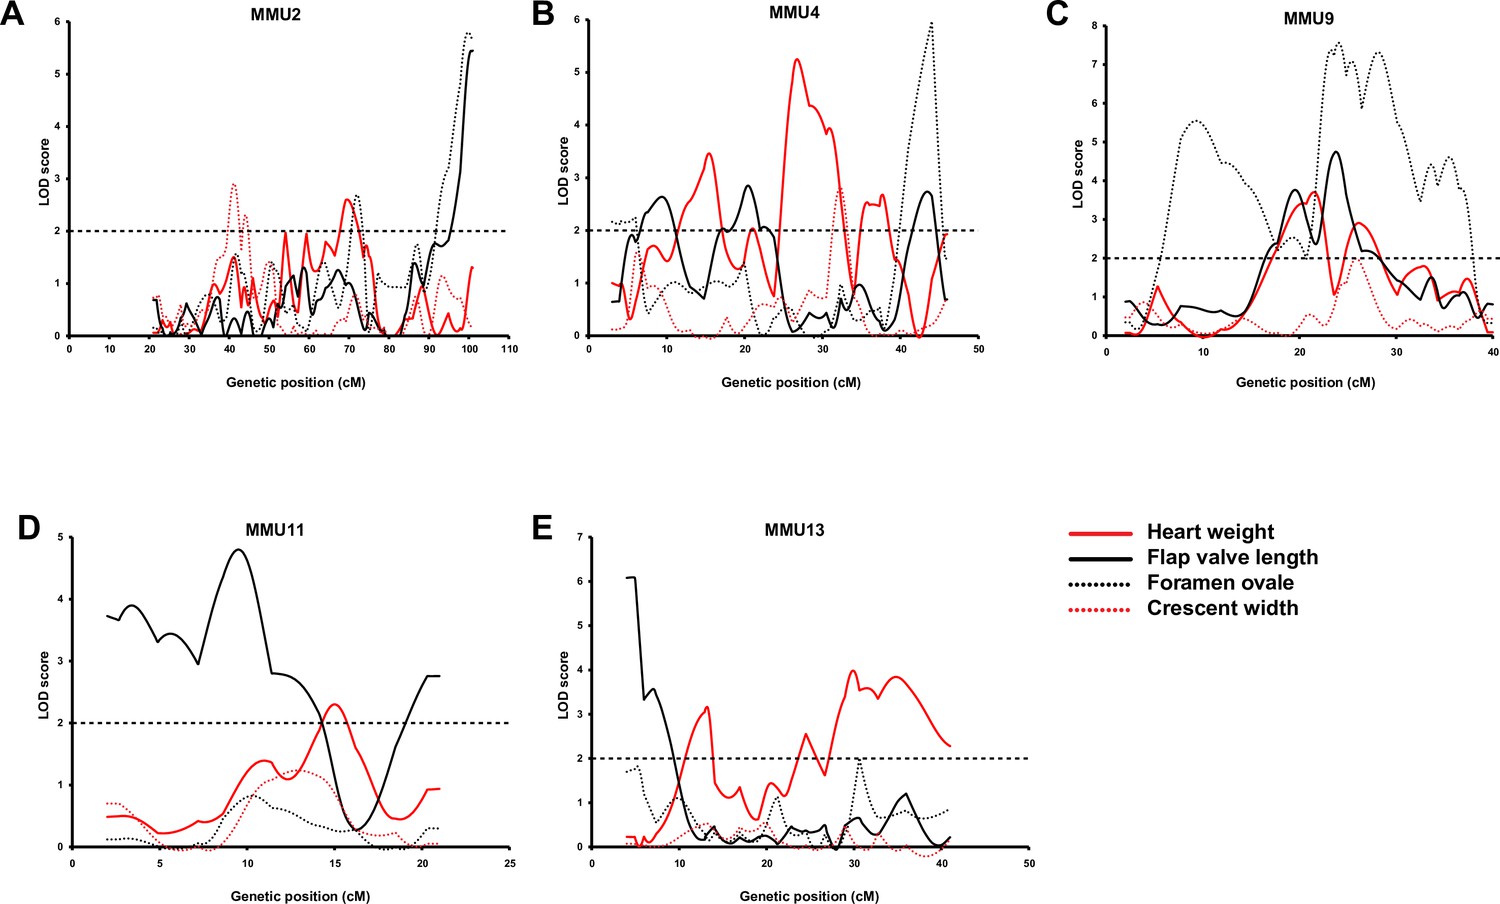
Comparison of advanced intercross line (AIL) results for heart weight (HW) (red line) and quantitative traits of atrial septum.
Figure 3 with 1 supplement
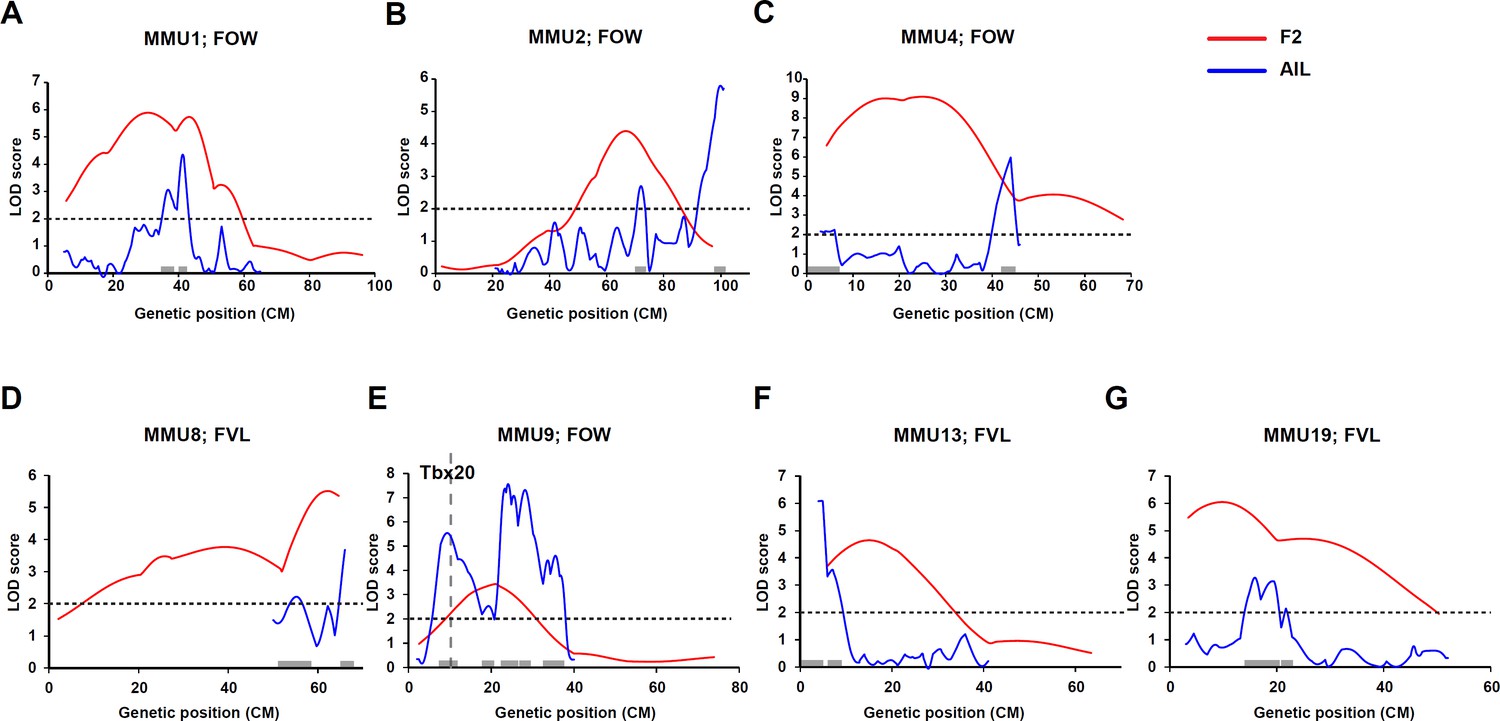
Comparison of linkage results from F2 (red line) and advanced intercross line (AIL) (blue line) populations.
Y-axis represent logarithm of odds (LOD) scores and x-axis represent genetic map positions. A 1-LOD drop-off for each quantitative trait locus (QTL) is shown on the x-axis representing the confidence interval of the QTL.
Figure 3—figure supplement 1
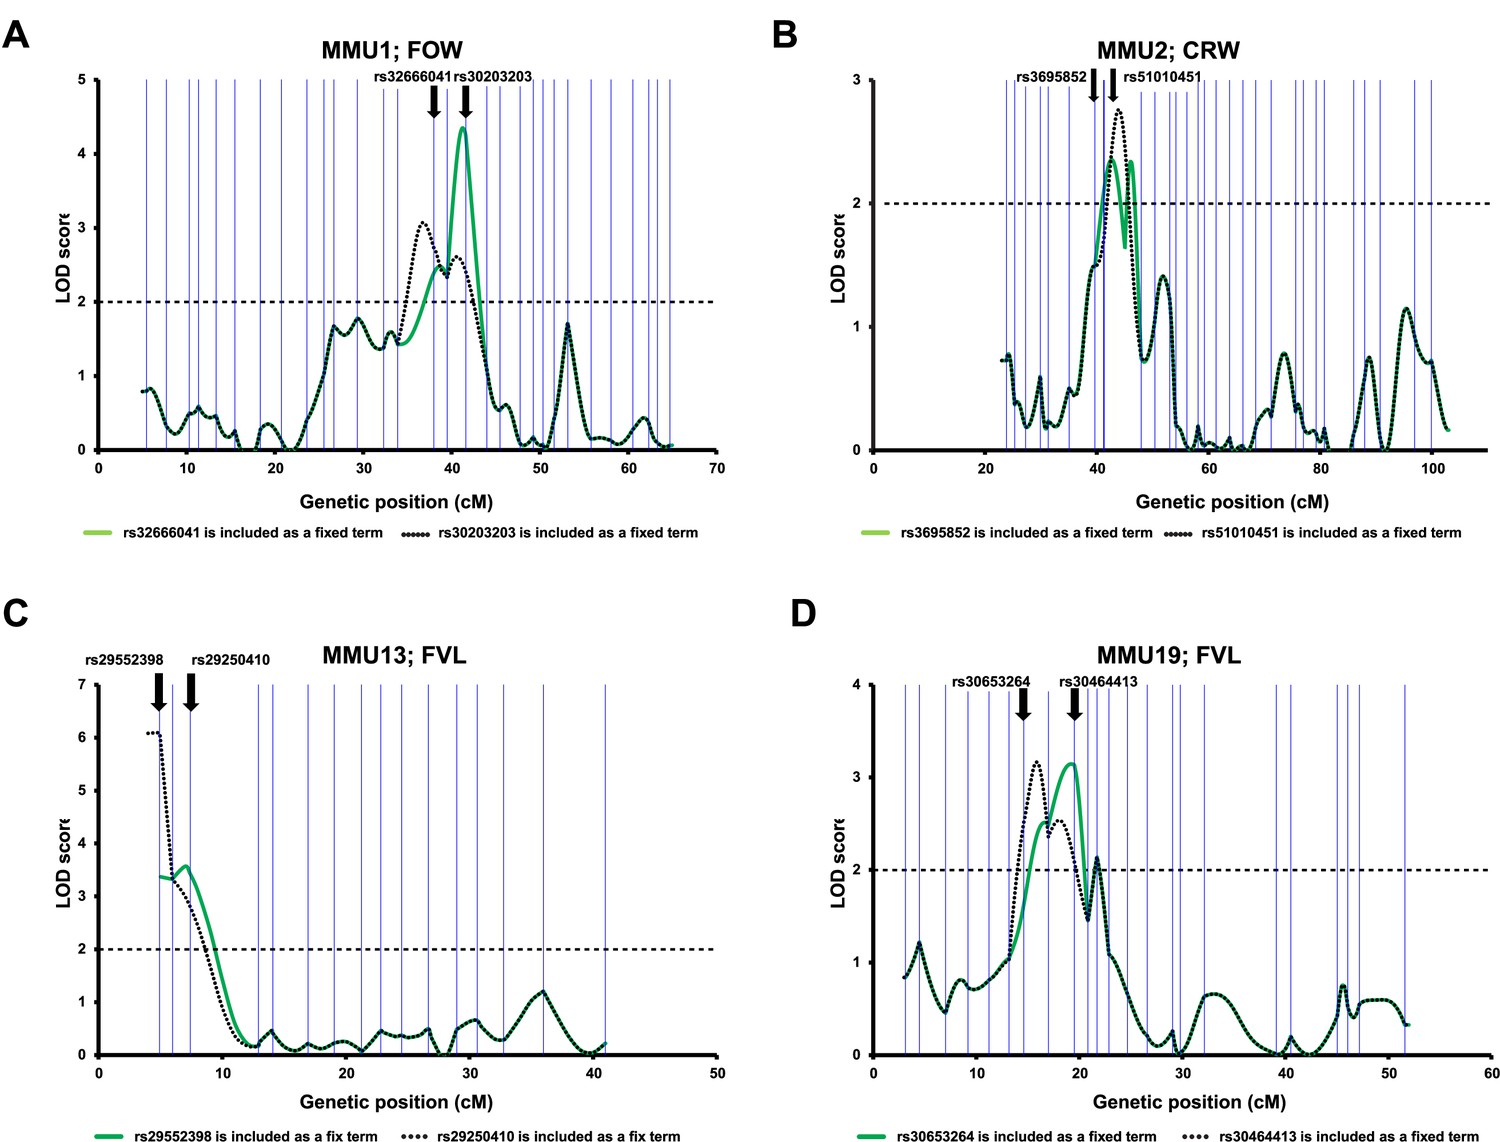
Differentiation of overlapping QTL peaks identified by the advanced intercross line (AIL) data.
To determine whether the peaks reflected the same underlying QTL or identified the presence of independent QTL, for each chromosome, the linkage analysis was performed using two different models in each, one peak marker was included as a fixed term. Vertical blue lines correspond to the positions of the AIL markers. The bold arrows indicate the positions of the fixed markers.
Figure 4
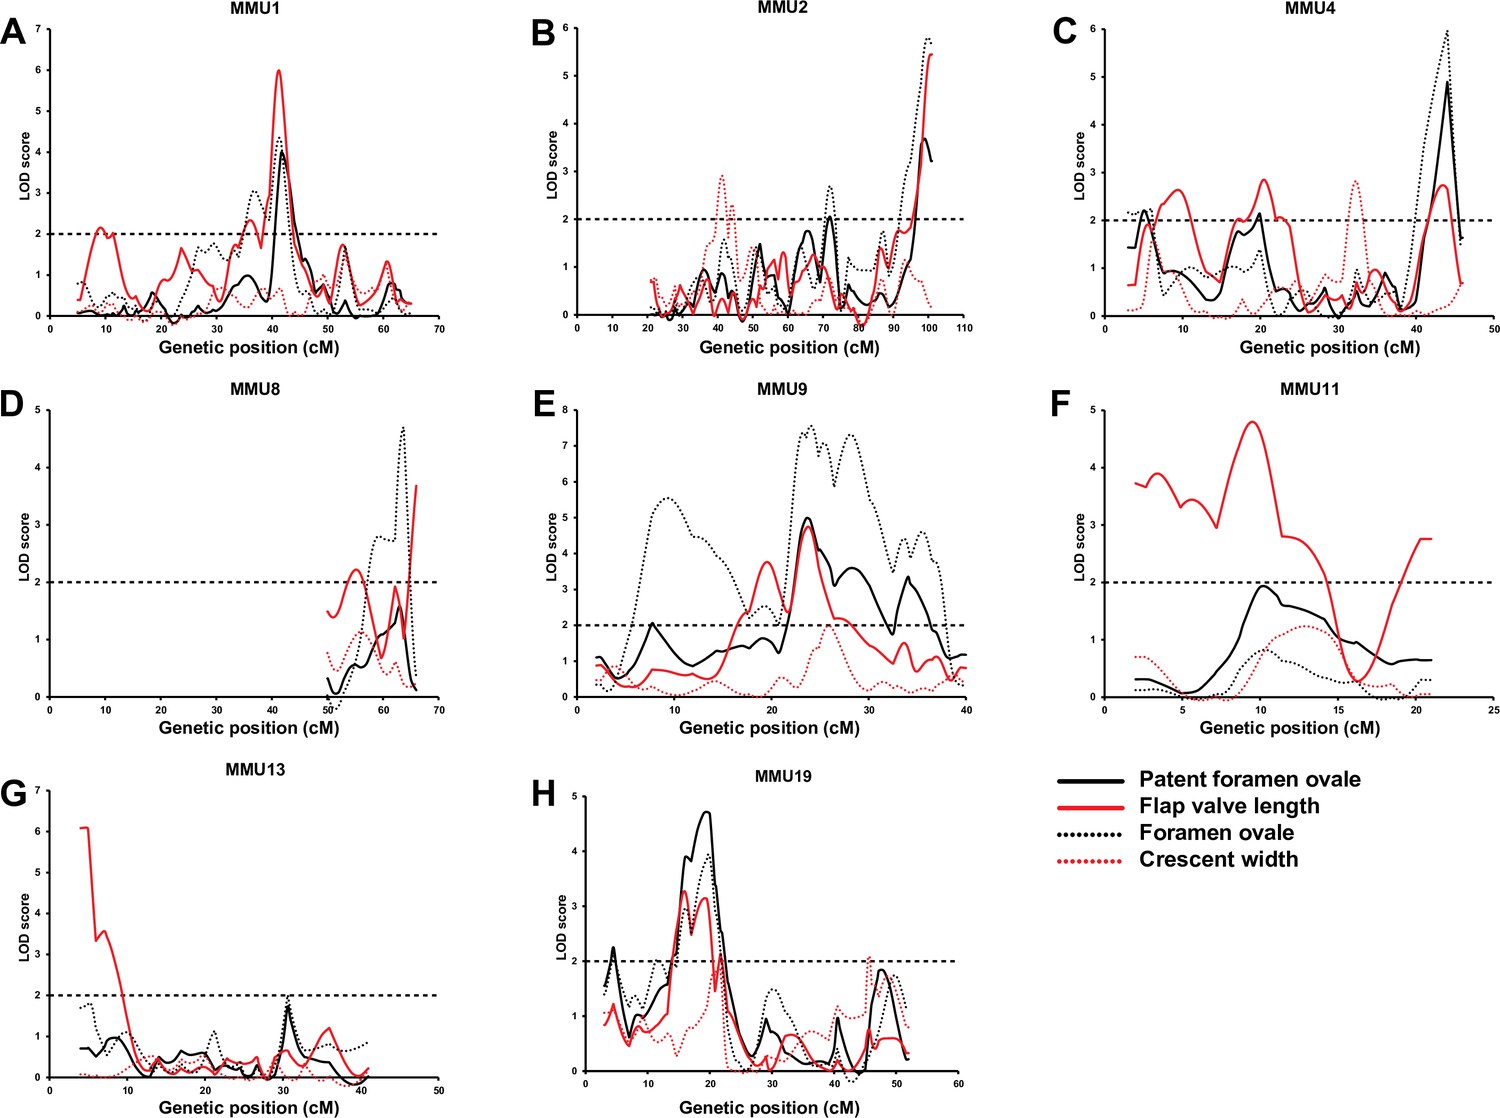
Comparison of advanced intercross line (AIL) results for patent foramen ovale (PFO), flap valve length (FVL), foramen ovale (FOW), and crescent width (CRW).
Figure 5 with 2 supplements
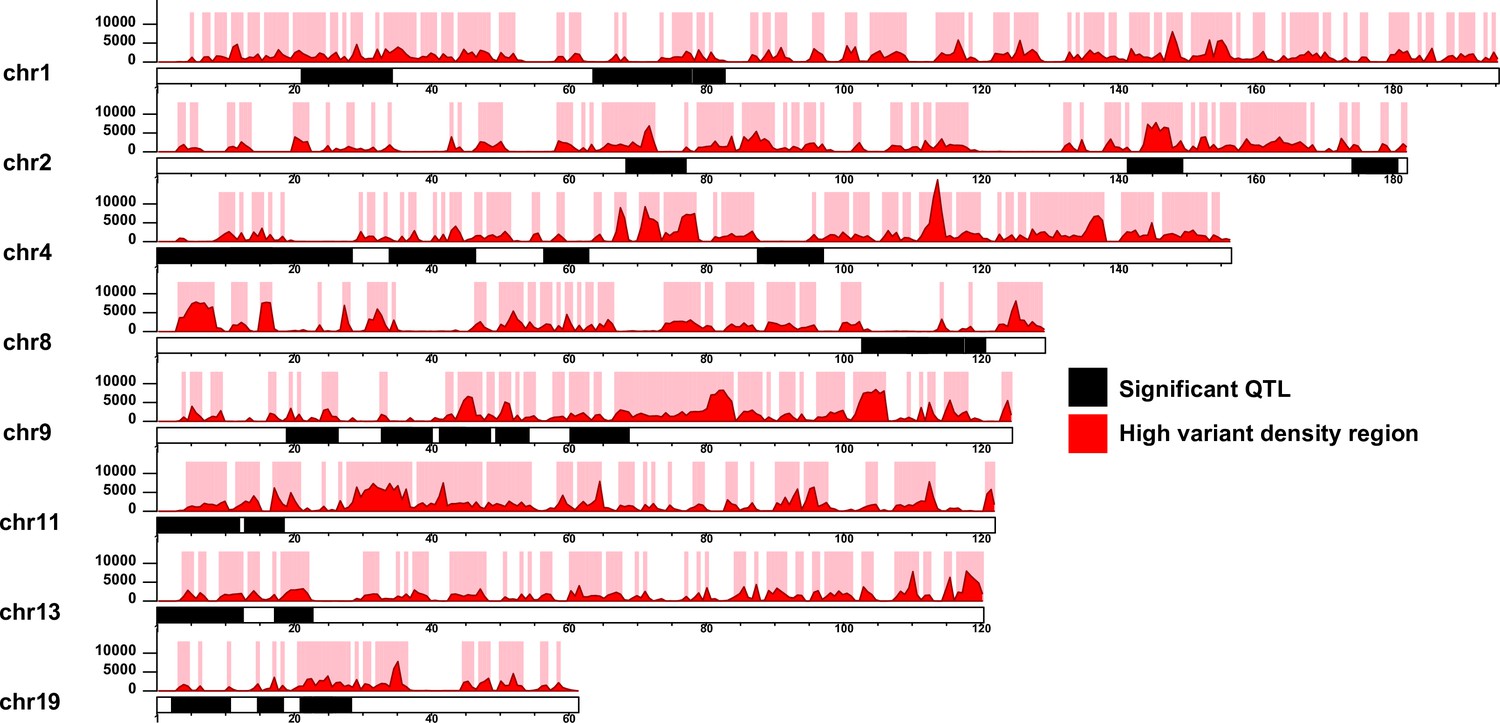
Segmentation of the quantitative trait loci (QTL) according to high variant density regions.
The QTL regions for each chromosome are illustrated as black blocks. The red histograms and y-axeis represent the variant density defined as the number of 129T vs QSi5 variants per 600 Kb genomics intervals. High variant density regions (density ≥ 1000) are represented as pink blocks. The x-axis for each chromosome represents the genomic position (Mb).
Figure 5—figure supplement 1
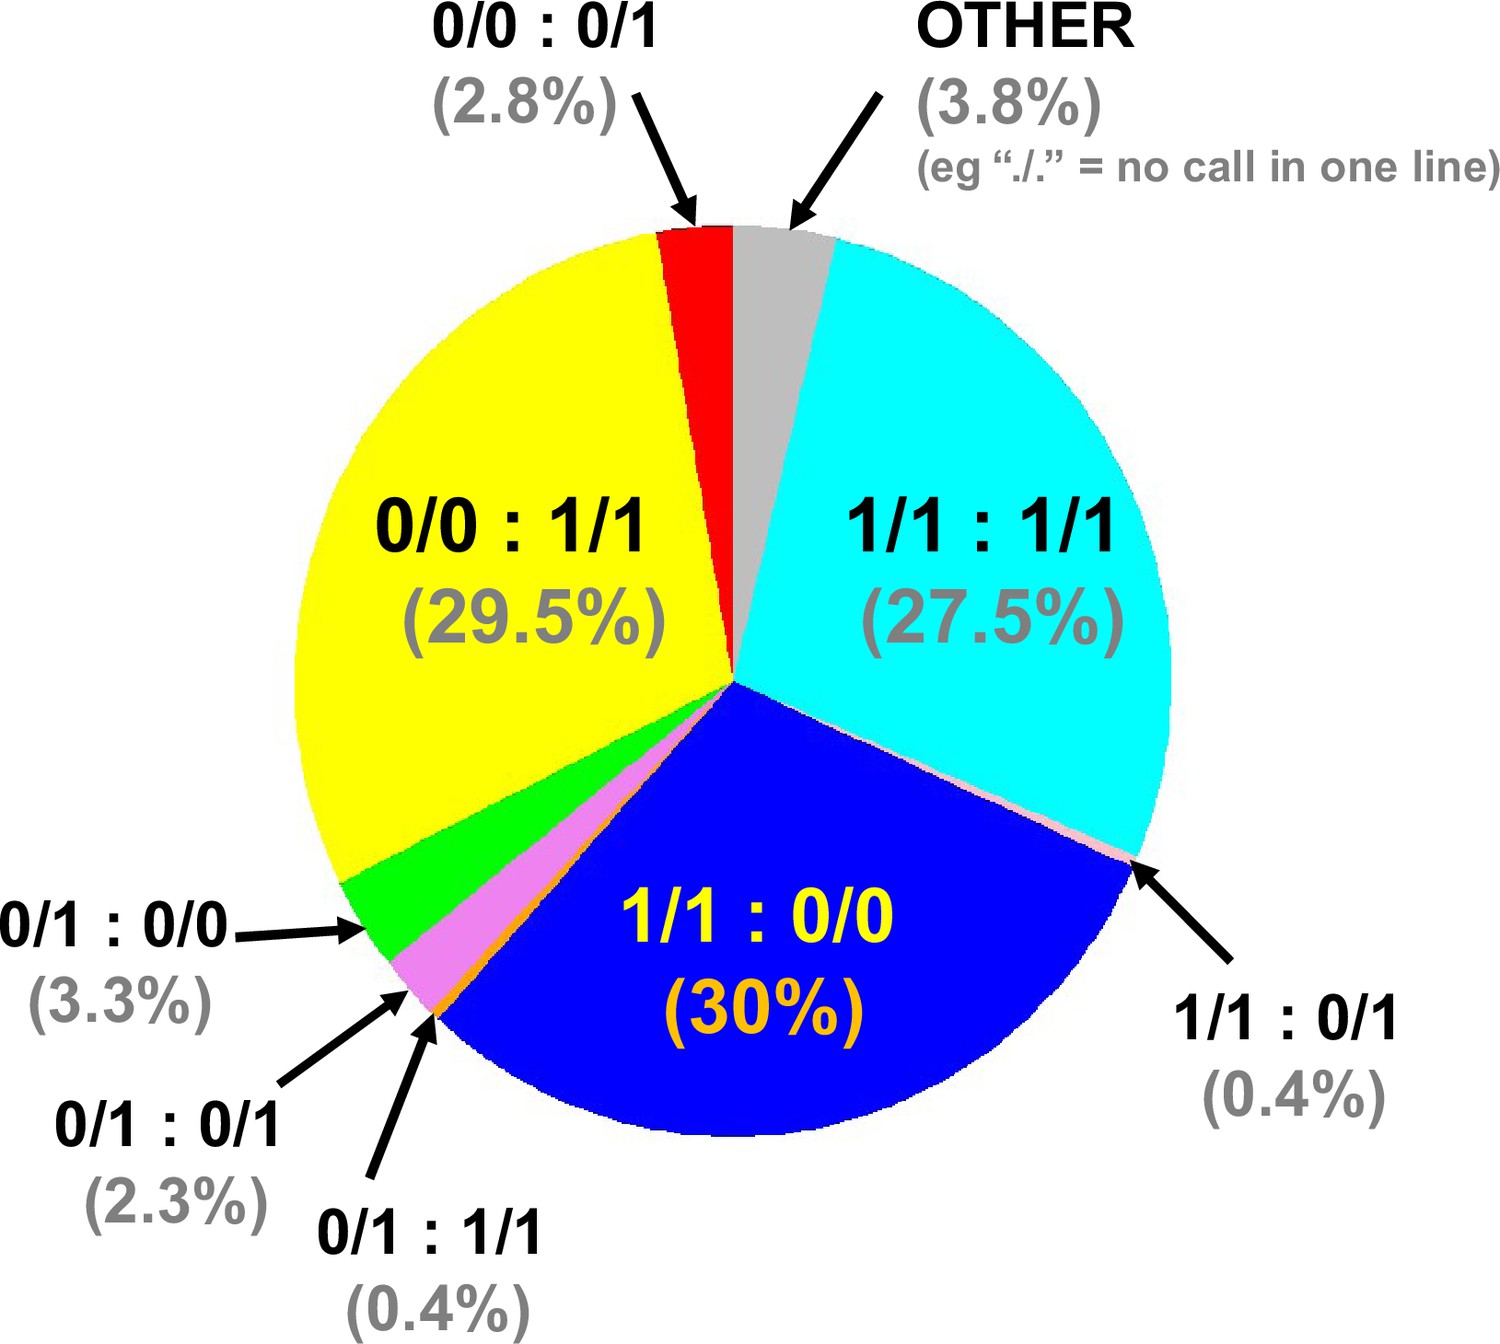
Combined genome-wide variant zygosity of advanced intercross line (AIL) parental strains.
The majority of single nucleotide polymorphisms (SNPs) are either unique to 129T (1/1:0/0; 30%; dark blue) or QSi5 (0/0:1/1; 29.5%; yellow) or common to both lines (1/1:1/1; 27.5%; light blue) with respect to the C56Bl/6 reference. ‘Other’ includes, for example./.=one call in one line. The low number of heterozygous calls may be annotation artifacts due to the presence of repetitive sequences.
Figure 5—figure supplement 2
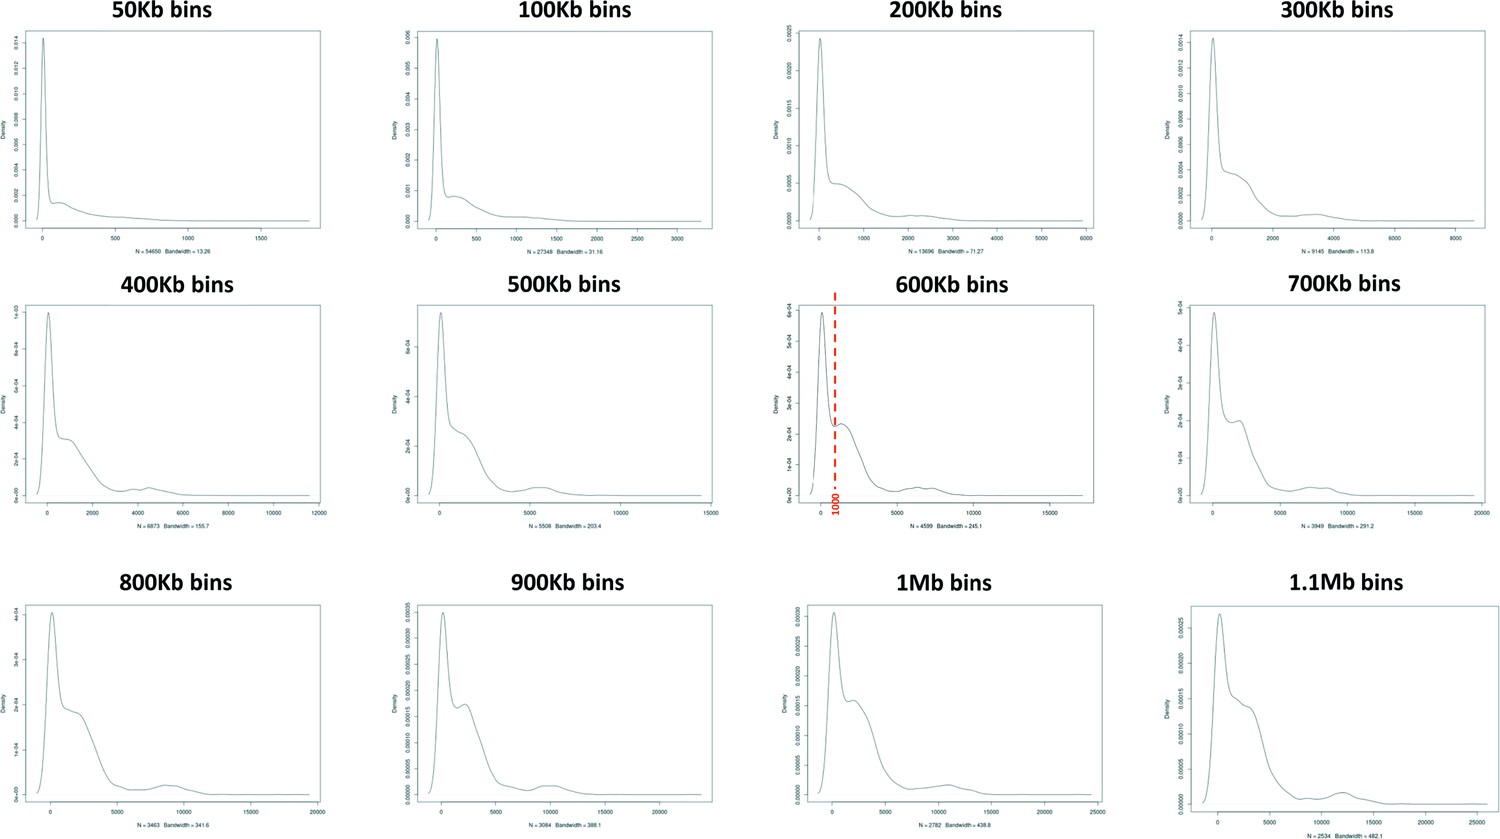
Assessment of 129T2/SvEms vs QSi5 variant density across the genome using different bin sizes.
A bin of 600 Kb provided the clearest distinction between high and low variant density peaks defining a cutoff of 1000 variants/600 Kb.
Figure 6
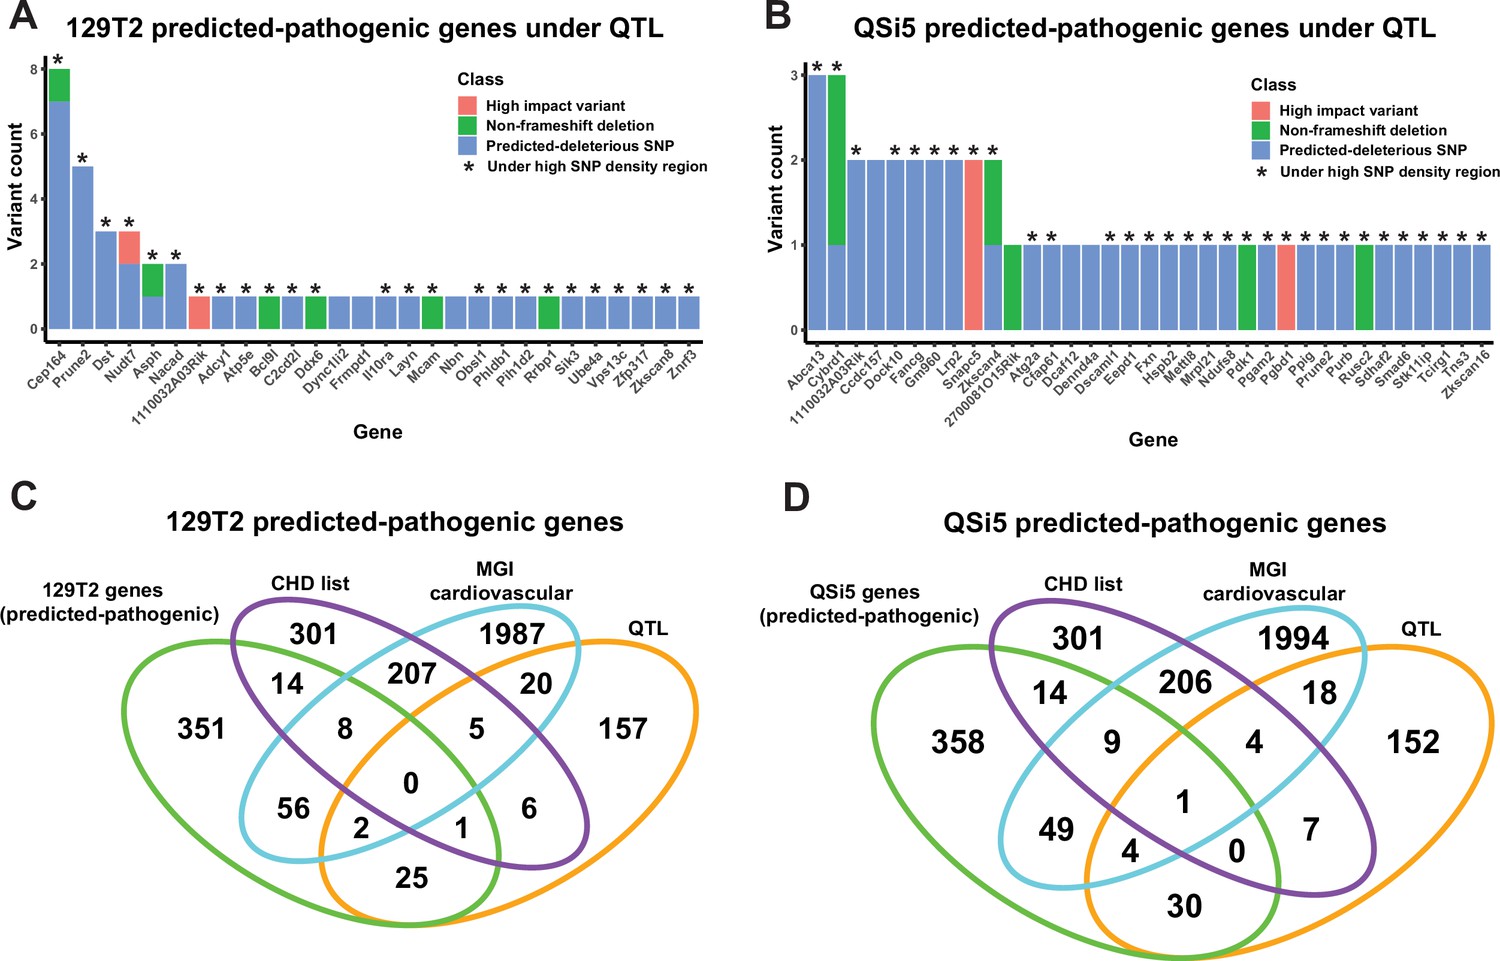
Identification of predicted-pathogenic variants.
(A, B) Number of variants per gene for predicted pathogenic genes under quantitative trait loci (QTL) according to classification (high-impact, non-frameshift deletion, or predicted-deleterious missense variant) for (A) 129T2 and (B) QSi5. (C, D) Overlap of genes containing predicted-pathogenic variants with (1) genes in a high confidence/emerging congenital heart disease (CHD) list, (2) genes with a heart development cardiovascular function from mouse genome informatics (MGI), and (3) all genes under QTL intervals that contain protein-modifying variants. Overlaps are shown for predicted pathogenic variants in (C) 129T2 and (D) QSi5.
Figure 7
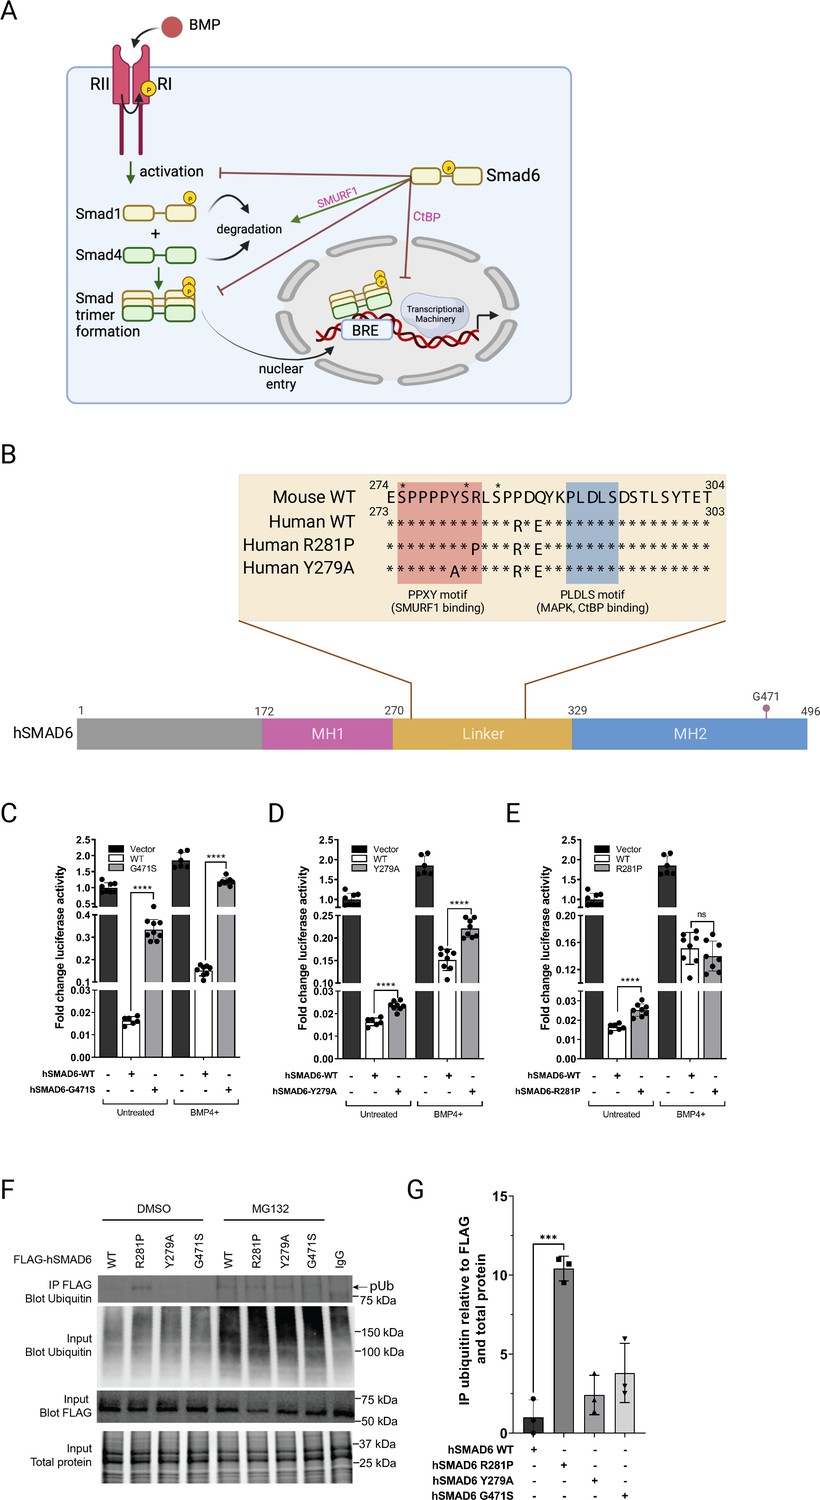
Functional analysis of SMAD6 variant R282P.
(A) Schematic of BMP signaling pathway highlighting roles of SMAD6. Prepared with Biorender. (B) Schematic of hSMAD6 showing the three main functional domains; the conserved DNA-binding MH1 domain (172-270aa), regulatory linker region (271-328aa), and the C-terminal transactivation/cofactor interaction MH2 domain (329-496aa). The position of G471 within the MH2 domain is indicated – mutation of this residue (G471S). Insert shows the amino acid sequence of the linker region containing PPXY (SMURF1 binding) and PLDLS (CtBP binding) domains, with the position of hSMAD R281P and Y279A variants indicated. Known serine phosphorylation sites are marked * above the sequence. (C–E). Functional analysis of hSMAD6 variants. Activity of hSMAD6-G471S (C), hSMAD6-Y279A (D), and hSMAD6-R281P (E), were assessed relative to wild-type (WT) hSMAD6 on a BMP-signaling responsive (BRE)-luc promoter in untreated and BMP4-treated cells. n=6–9; differences between WT and variant were assessed by unpaired t-test; data presented as mean ± SD. Asterisks denote significance, ****p<0.0001, ns = 0.3332. (F,G) Ubiquitination of WT hSMAD6 and variants assessed in MG132 or DMSO (control)-treated HEK293T cells. WT FLAG-ShMAD6 and variants were immunoprecipitated with anti-FLAG antibody with lysates subject to western blotting with anti-ubiquitin antibody (F). Total ubiquitin, FLAG-hSMAD6, and protein indicated. (G) Quantification of FLAG-hSMAD6 ubiquitination. n=3; difference between WT and variants assessed by one-way ANOVA with Tukey’s multiple comparisons; data presented as mean ± SD. Asterisks denote significance, ***p=0.0001.
-
Figure 7—source data 1
Original blots associated with Figure 7.
- https://cdn.elifesciences.org/articles/83606/elife-83606-fig7-data1-v3.zip
Figure 8 with 2 supplements
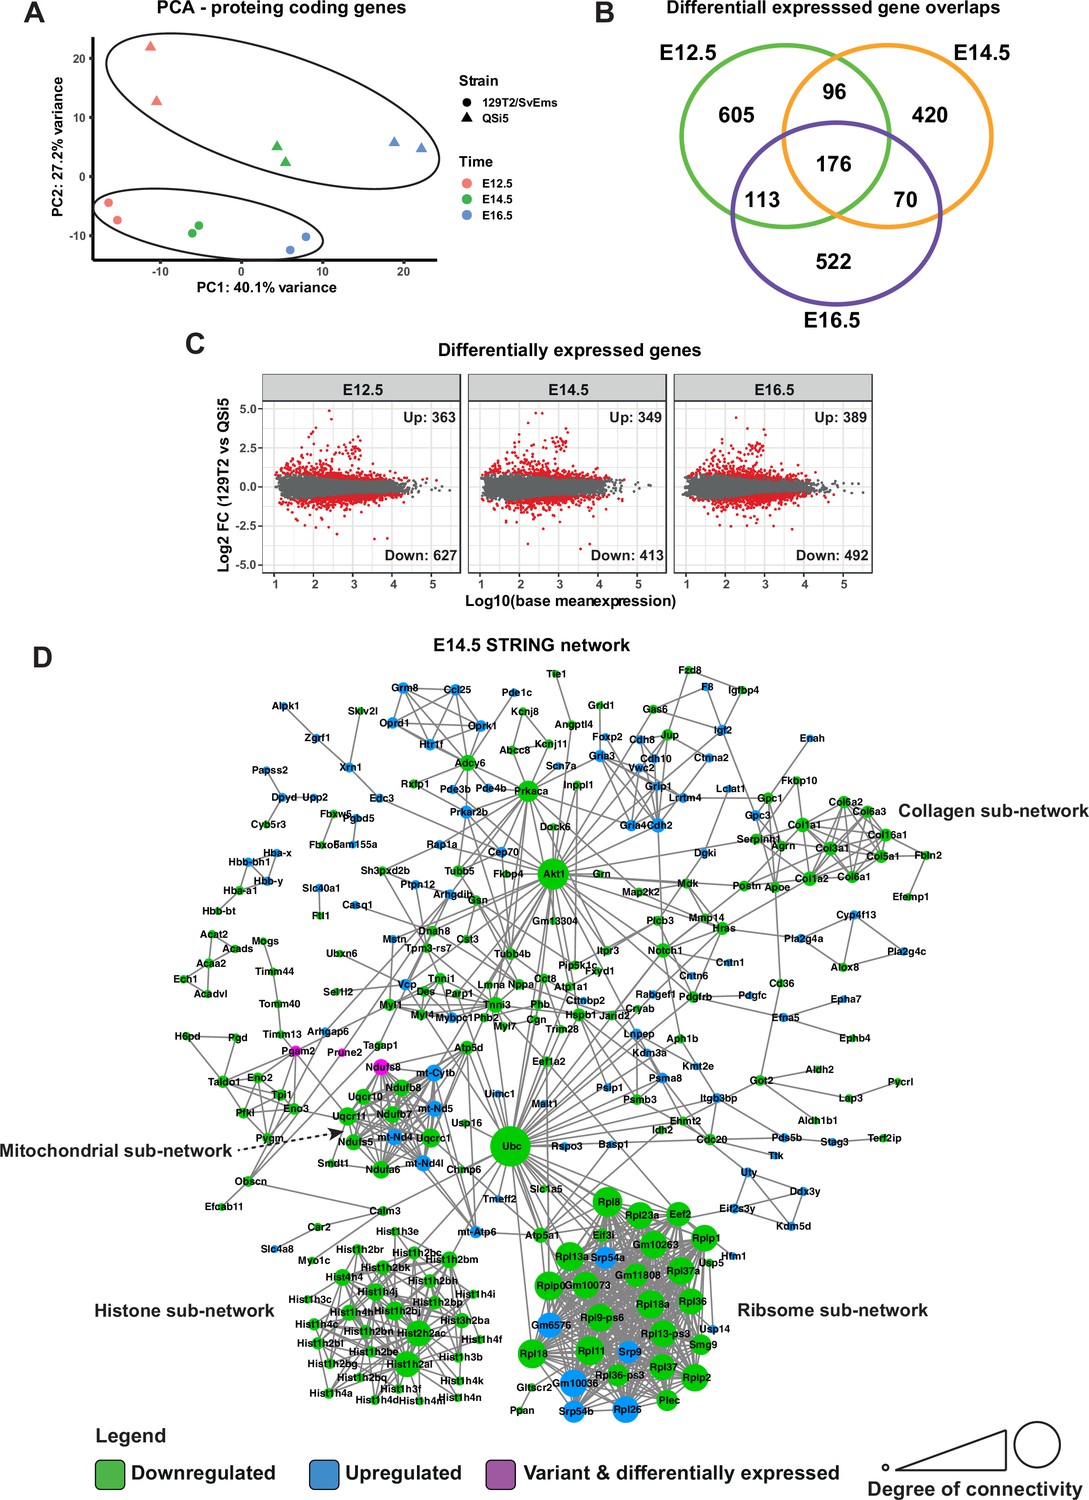
Transcriptome analysis of atrial septum.
(A) Principal component analysis (PCA) plot of gene expression profiles from atrial septum RNA-seq libraries including two replicates per time point (E12.5, E14.5, and E16.5) per mouse strain (QSi5 and 129T2/SvEms) for protein-coding genes. (B) Venn diagram with the number of differentially expressed genes between QSi5 and 129T2/SvEms at different time points. (C) MA plots of differentially expressed genes for each time point. (D) STRING network of E14.5 differentially expressed genes and genes with predicted-pathogenic variants from QSi5 or 129T2/SvEms. Genes are colored according to whether they are upregulated or downregulated in 129T2/SvEms or contain a variant that is predicted-pathogenic and differentially expressed.
Figure 8—figure supplement 1
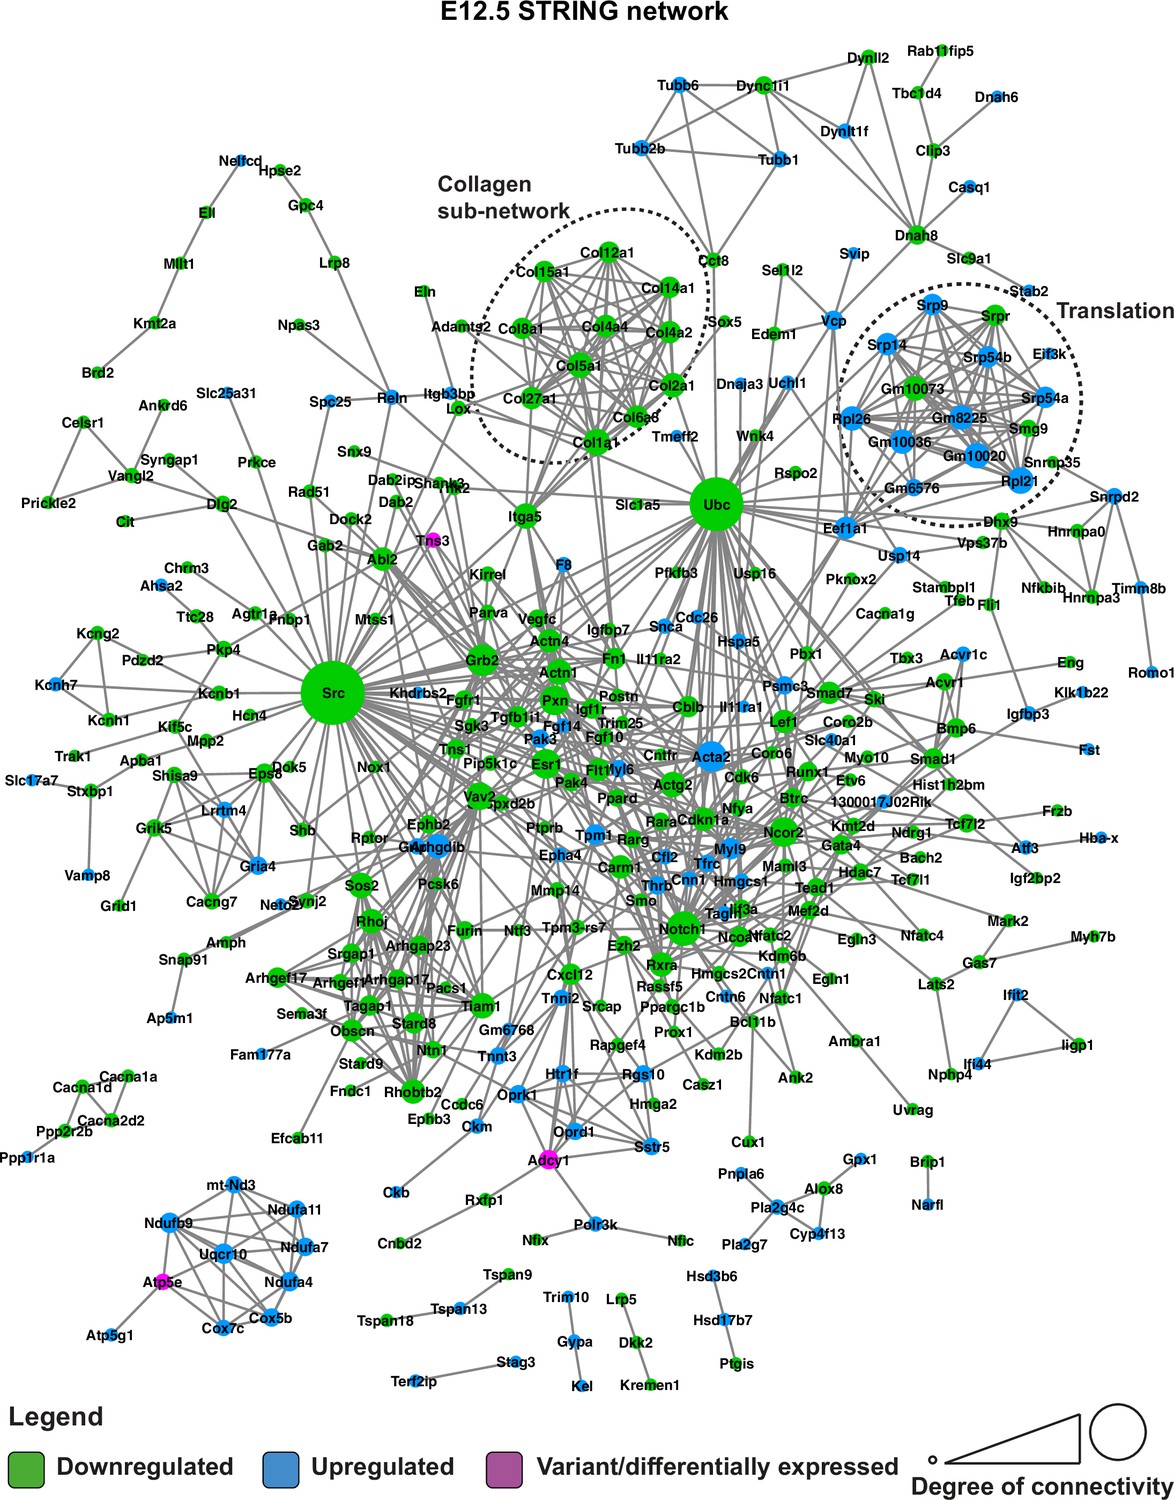
STRING network of E12.5 differentially expressed genes and genes with predicted-pathogenic variants from QSi5 or 129T2/SvEms.
Genes are coloured according to whether they are upregulated or downregulated in 129T2/SvEms, or contain a variant that is predicted-pathogenic and differentially expressed.
Figure 8—figure supplement 2
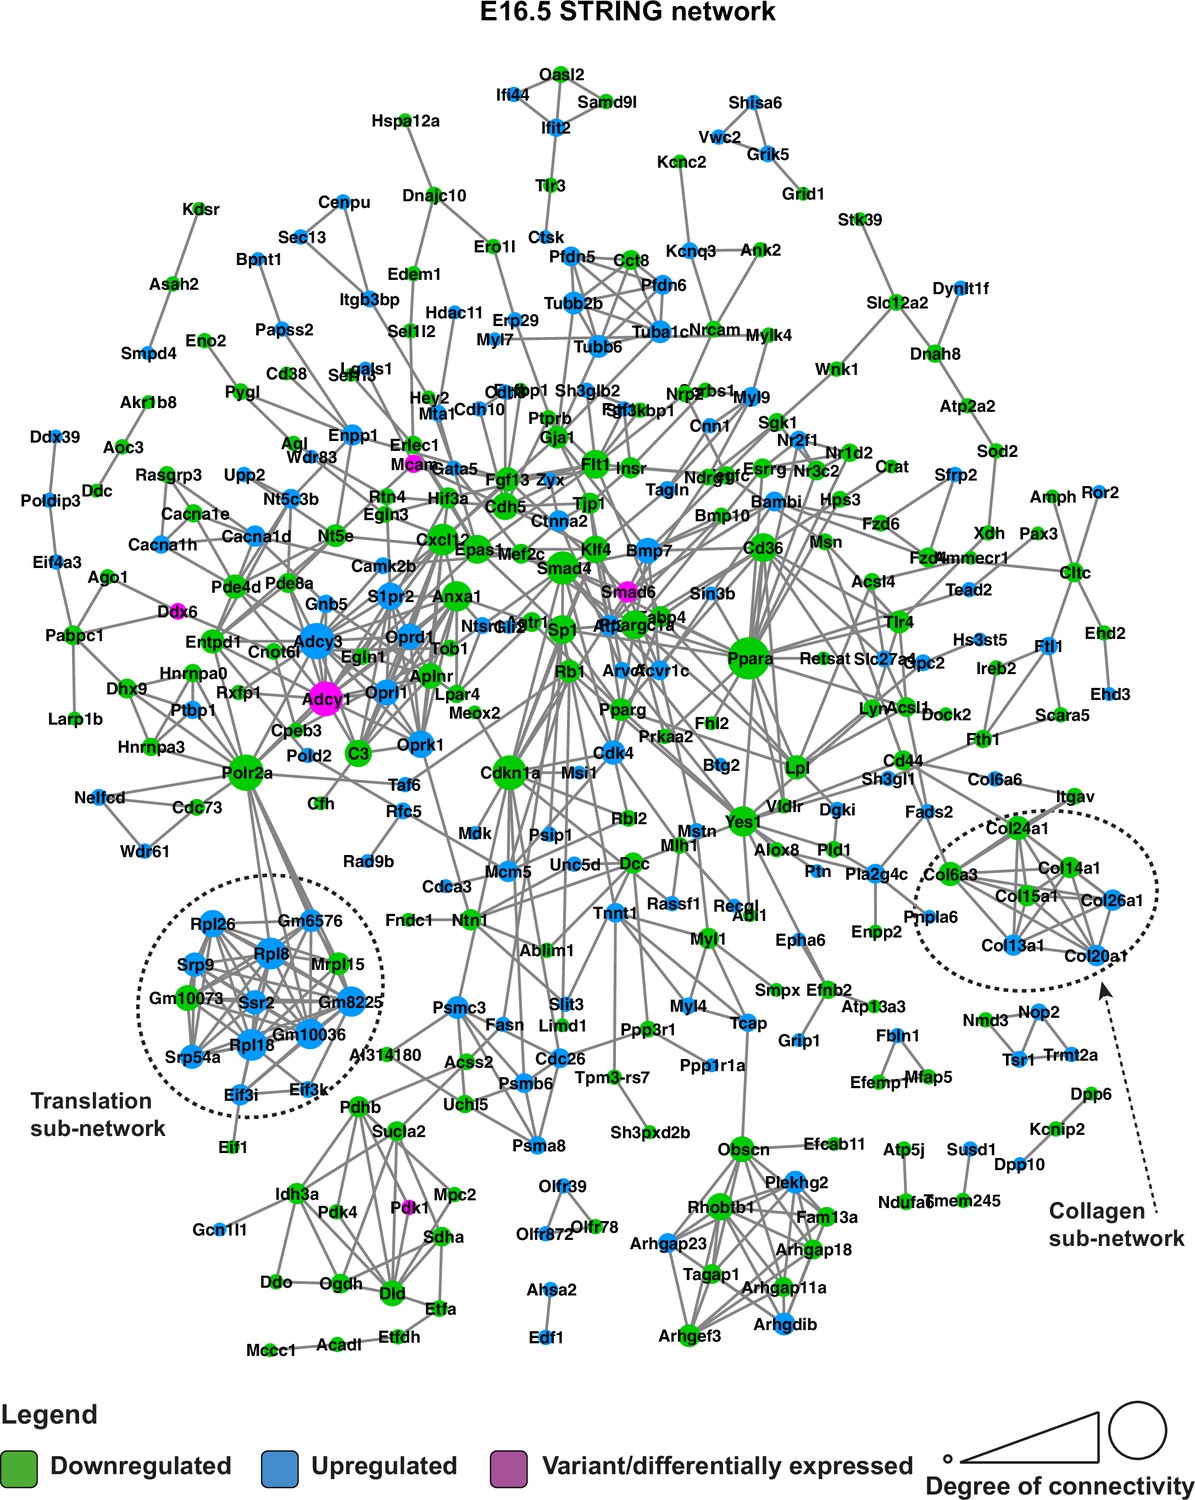
STRING network of E16.5 differentially expressed genes and genes with predicted-pathogenic variants from QSi5 or 129T2/SvEms.
Genes are coloured according to whether they are upregulated or downregulated in 129T2/SvEms, or contain a variant that is predicted-pathogenic and differentially expressed.
Figure 9
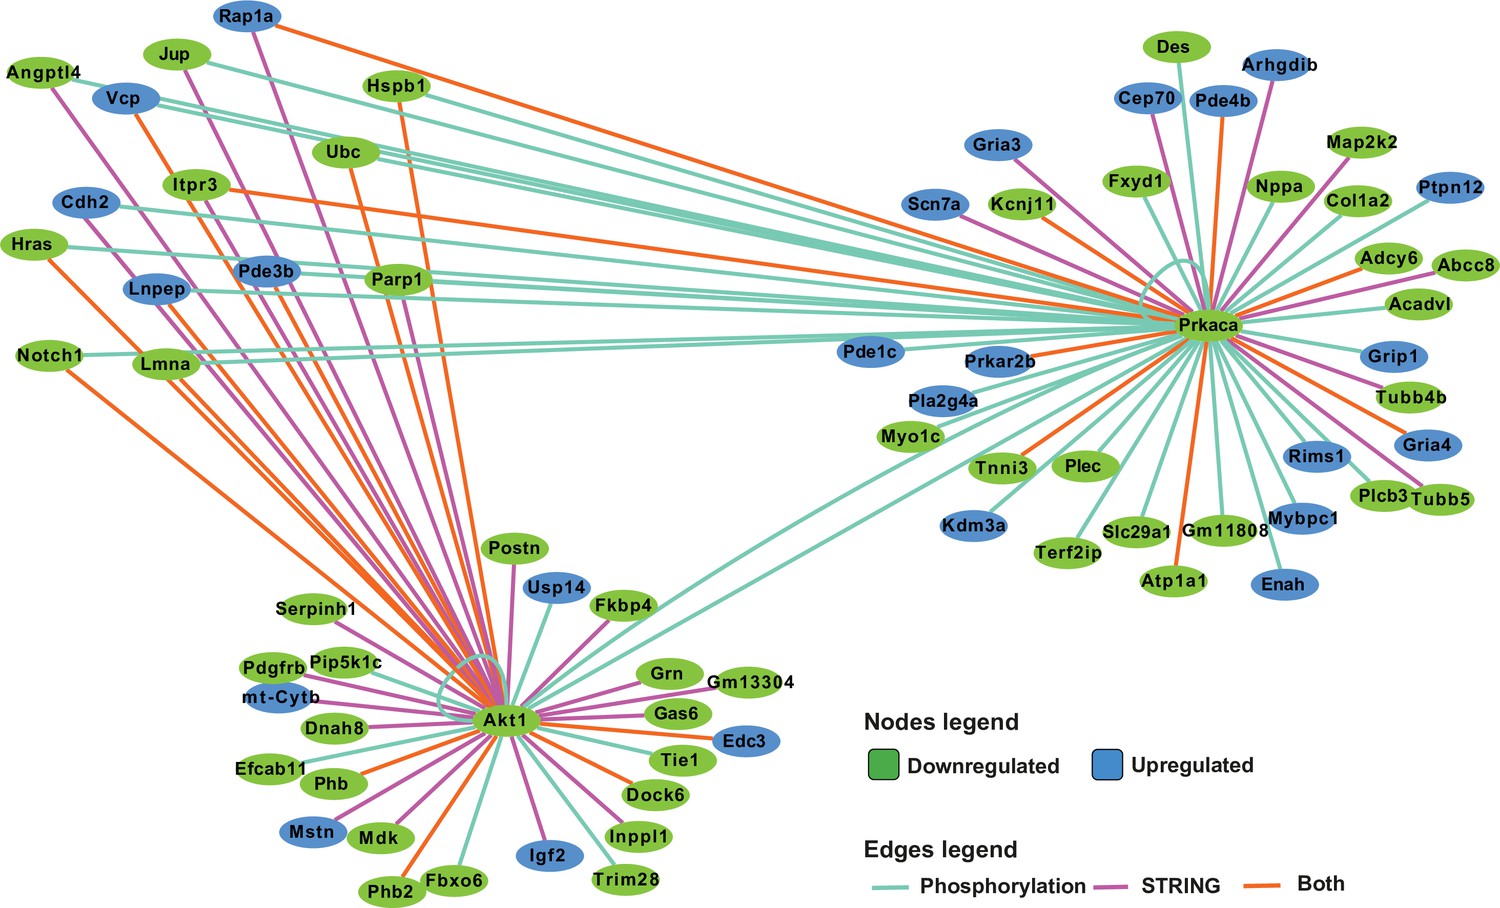
Network analysis of protein kinase A (PKA) and AKT1 phosphorylation targets.
Integrated network analysis of PKA and AKT1 STRING connections and phosphorylation substrate targets from PhosphoSitePlus and PhosphoPICK predictions.
Figure 10 with 2 supplements
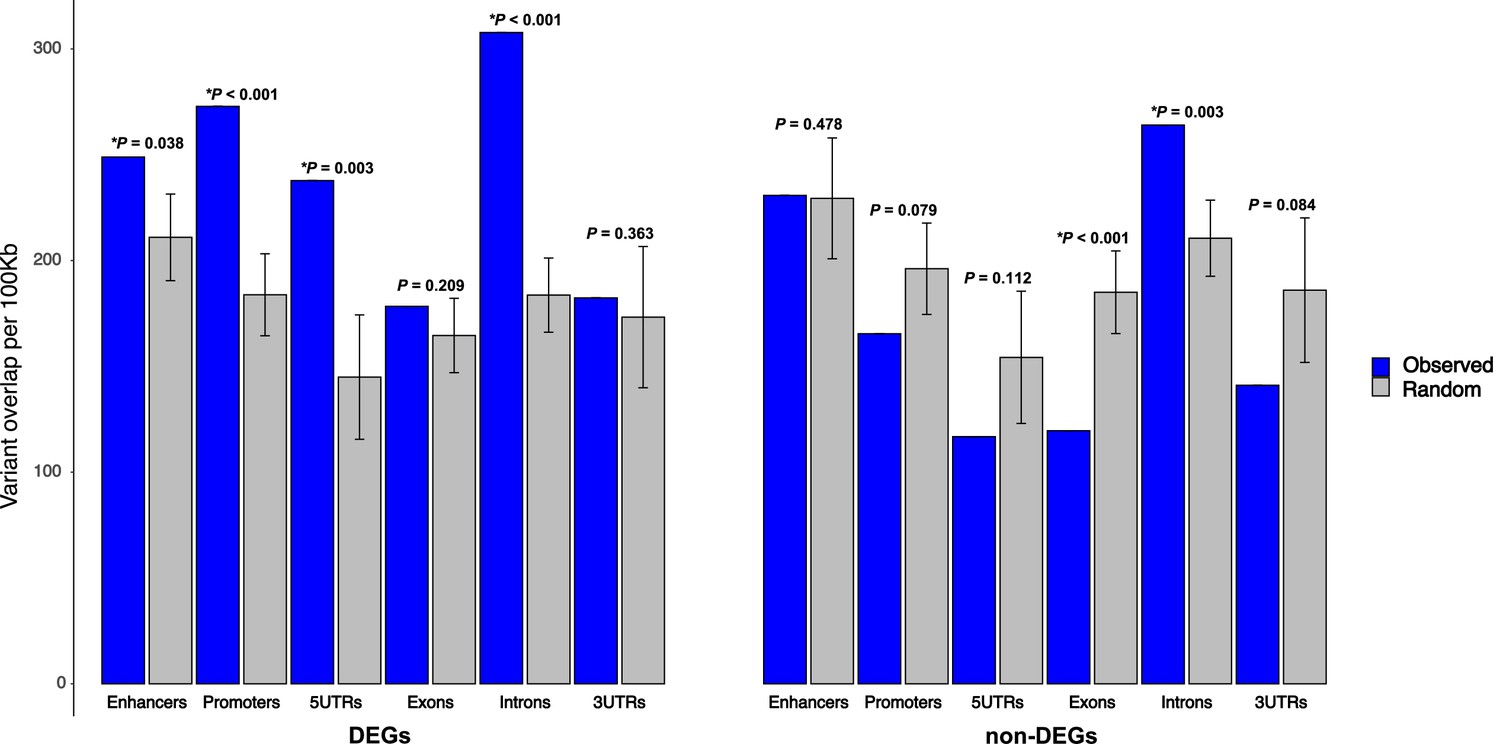
Enrichment of 129T2/SvEms vs QSi5 variants in genomic features of differentially expressed genes (DEGs) under quantitative trait loci (QTL).
The number of variants directly overlapping a feature is shown in blue, and gray bars represent the expected values based on the mean overlap from 1000 randomly generated interval sets. Error bars show the 95% confidence intervals of the mean. The significance of the enrichment is expressed as p-values, calculated by dividing the number of random samples showing equal or greater overlap than the observed by the total number of permutations (*p< 0.05).
Figure 10—figure supplement 1
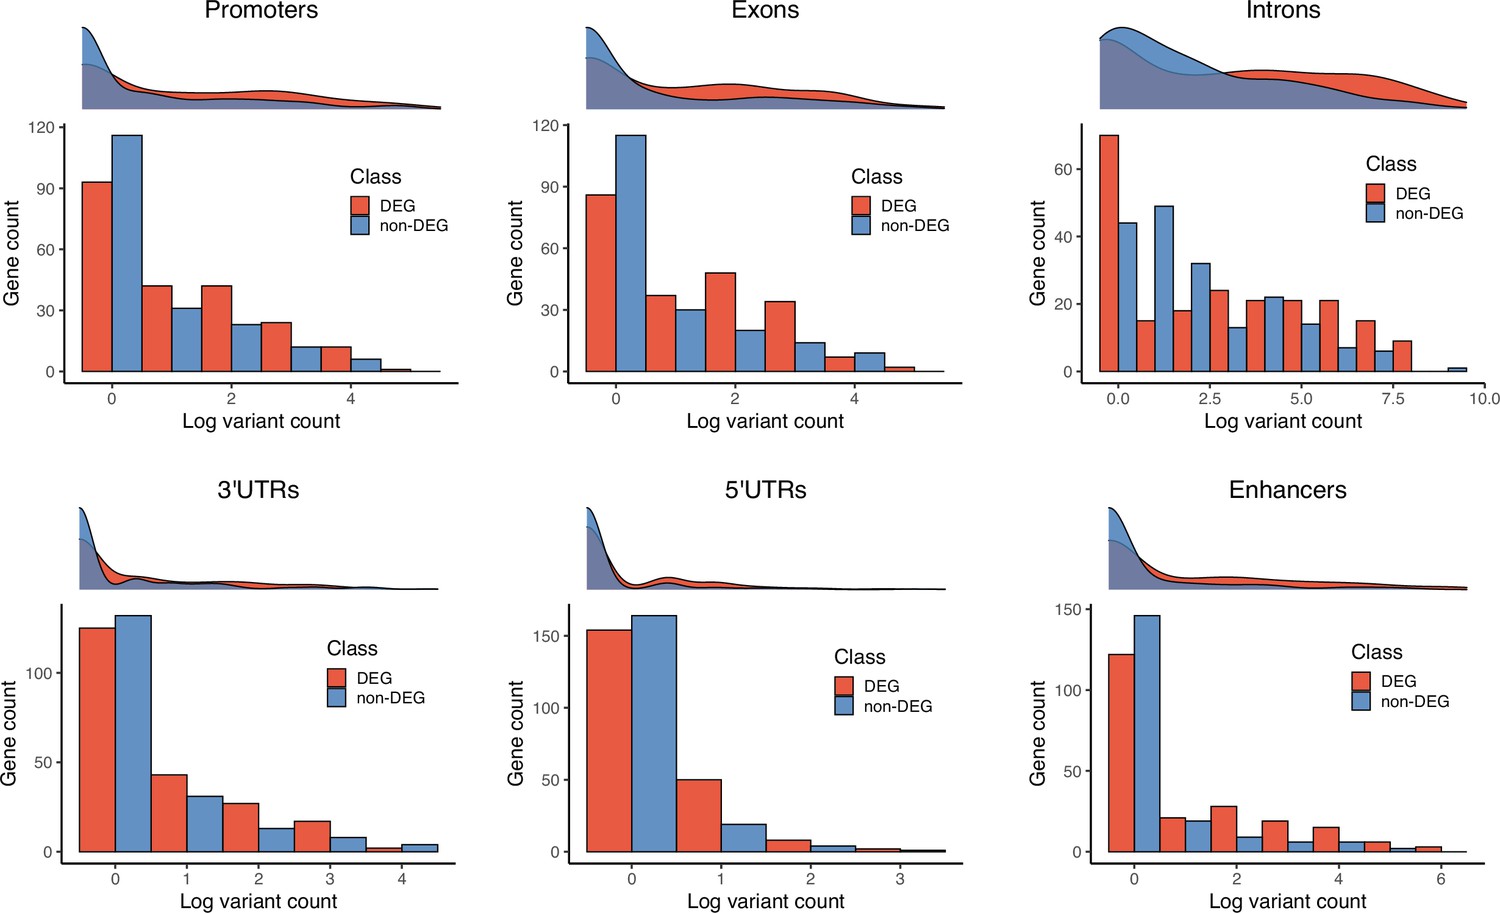
Gene counts by number of 129T2/SvEms vs QSi5 variants.
For each genomic feature, a density plot and histogram representing the log-transformed number of variants per gene (x-axis) and frequency of the genes (y-axis). Each plot illustrates the gene counts for differentially expressed genes (DEGs) (red) and non-DEGs (blue) under QTL.
Figure 10—figure supplement 2
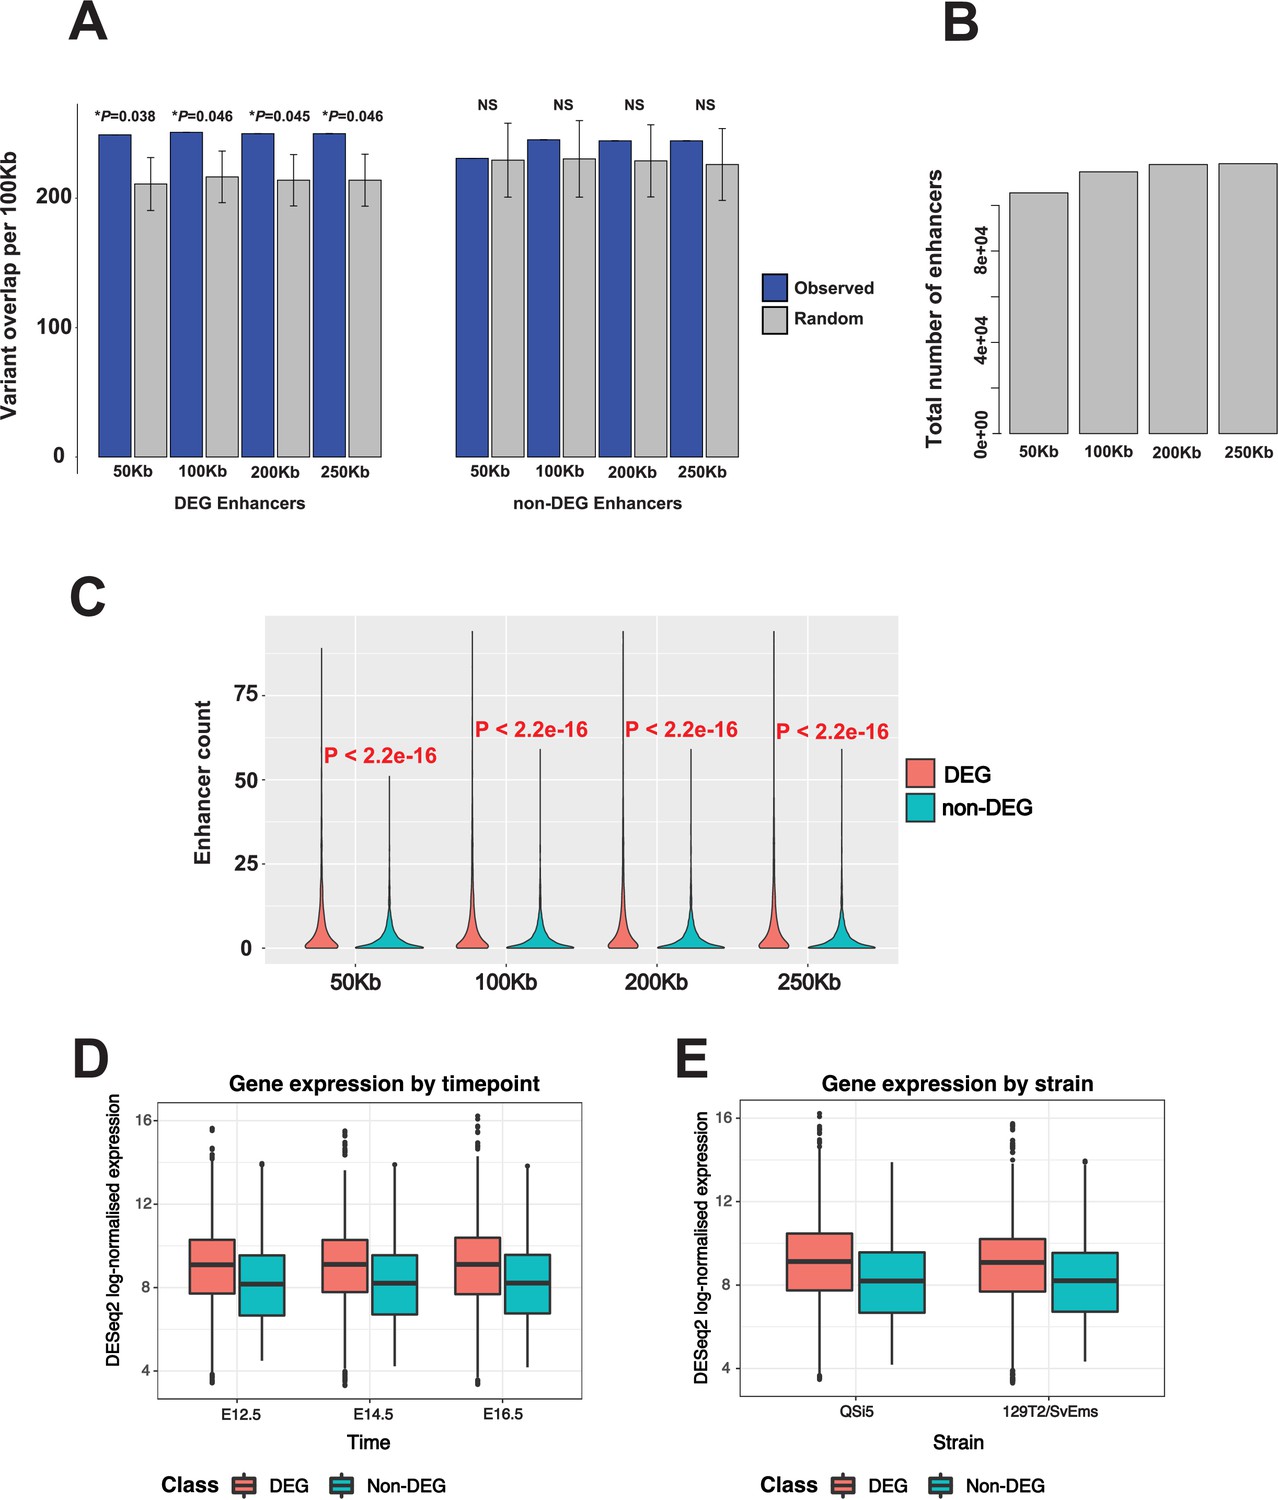
Impact of increasing enhancer window size on over-representation of variants in differentially expressed genes (DEGs) and non-DEGs under quantitative trait locus (QTL), and on number of enhancers detected.
(A) Total number of enhancers detected with increasing window size. (B) Total number of enhancers corresponding to DEGs and non-DEGs with increasing window size. (C) Effect of increasing enhancer window size on over-representation of variants in DEGs and non-DEGs under QTL.
Tables
Table 1
Phenotypic characteristics of parental strains and F2 mice extracted from Kirk et al., 2006 compared to F14 mice.
| QSi5 | 129T2/SvEms | F2 | F14 | |
|---|---|---|---|---|
| N | 66 | 75 | 1437* | 933 |
| PFO (%) | 4.5 | 80 | 17 | 34 |
| FVL ± SD (mm) | 1.13 ± 0.11 | 0.60 ± 0.11 | 1.0 ± 0.19 | 1.01 ± 0.16 |
| FOW ± SD (mm) | 0.21 ± 0.06 | 0.24 ± 0.06 | 0.21 ± 0.07 | 0.24 ± 0.07 |
| CRW ± SD (mm) | 0.51 ± 0.13 | 0.44 ± 0.12 | 0.41 ± 0.12 | 0.54 ± 0.15 |
| Body Weight ± SD (g) | 29.4 ± 2.77 | 17.5 ± 2.1 | 26.6 ± 3.3 | 25.8 ± 2.9 |
| Heart Weight ± SD (g) | 0.21 ± 0.02 | 0.14 ± 0.02 | 0.21 ± 0.03 | 0.18 ± 0.03 |
-
*
Data were incomplete for some mice.
Key resources table
| Reagent type (species) or resource | Designation | Source or reference | Identifiers | Additional information |
|---|---|---|---|---|
| Strain, strain background (M. musculus) | 129 T2/SvEms | The Jackson Laboratory Biben et al., 2000 | Stock no. 002064 | http://www.informatics.jax.org/mgihome/nomen/strain_129.shtml |
| Strain, strain background (M. musculus) | QSi5 | The Jackson Laboratory | Stock no. 027001 | |
| Antibody | Smad6 (mouse monoclona) | Santa Cruz Biotechnology | SC-25321; RRID: AB_627906 | WB (1:100) |
| Antibody | FLAG-M2 (rabbit monoclona) | Cell Signaling Technology | CST:14793; RRID: AB_2572291 | IP (1:150) WB (1:1000) |
| Antibody | Ubiquitin (mouse monoclona) | Santa Cruz Biotechnology | SC-166553; RRID: AB_2241297 | WB (1:1000) |
| Cell line (H. sapiens) | HEK293T | ATCC | RRID: CVCL_0063 | |
| Transfected construct (H. sapiens) | PCS2-SMAD6 | ADDGENE | RRID:Addgene_14960 | |
| Transfected construct (M. musculus) | BRE-luc | ADDGENE | RRID:Addgene_45126 | |
| Peptide, recombinant protein | BMP4 | Gibco | Gibco:PHC9534; | 100 ng/mL |
| Commercial assay or kit | Dual luciferase assay kit | Promega | Promega:E1980 | |
| Commercial assay or kit | KAPA hifi | Roche | Roche:KK2101 | |
| Commercial assay or kit | WesternBreeze Chemiluminescent kit-Anti-rabbit | Thermo Fisher Scientific | Thermo Fisher:WB7106 | |
| Software/ algorithm | ImageJ | NIH | RRID:SCR_003070 | |
| Software/ algorithm | Graphpad Prism | Dotmatics | RRID:SCR_002798 | |
| Other | Recombinant protein G-Sepharose 4B | Thermo Fisher Scientific | Thermo Fisher:101241 | |
| Software/algorithm | R | https://cran.r-project.org | Version 4.2.2 | |
| Software/algorithm | GenomicRanges (R package) | Lawrence et al., 2013 | Version 1.42.0 | |
| Software/algorithm | GenomicFeatures (R package) | Lawrence et al., 2013 | Version 1.42.3 | |
| Software/algorithm | liftOver | Kent tools via UCSC | version 402 | |
| Software | Trimmomatic | Bolger et al., 2014 | v0.35 | |
| Software/Algorithm | STAR aligner | Dobin et al., 2013 | v2.5.1 | |
| Software/Algorithm | Salmon | Patro et al., 2017 | ||
| Software/Algorithm | DESeq2 | Love et al., 2014 | v1.14.1 | |
| Software/algorithm | PANTHER | Mi et al., 2017 | Web service | |
| Software/algorithm | BWA-MEM | Li and Durbin, 2010 | v0.7.15 | |
| Software/algorithm | GATK | van der Auwera and O’Connor, 2020 | v3.5 | |
| Software/algorithm | VCFtools | Danecek et al., 2011 | v0.1.14 | |
| Software/algorithm | Annovar | Wang et al., 2010 | ||
| Software/algorithm | Cytoscape | Shannon et al., 2003 | RRID: SCR_003032 | V3.9.1 |
| Software/algorithm | Python | https://www.python.org | ||
| Software/algorithm | Networkx | Hagberg et al., 2008 | V3.0 | |
| Other | STRING | Szklarczyk et al., 2017 | v10 | |
| Software/algorithm | Spliceogen | Monger et al., 2019 | ||
| Software/algorithm | Variant Effect Predictor | McLaren et al., 2016 | ||
| Software/algorithm | SIFT | Ng and Henikoff, 2003 | ||
| Software/algorithm | fgsea | https://doi.org/10.1101/060012 | v1.22.0 | |
| Other | Mouse Molecular Signatures Database | https://www.gsea-msigdb.org/ | version m5.all.v2023.1.Mm |
Additional files
-
Supplementary file 1
Relationship between PFO and the quantitative traits in F14 mice with complete data (n=933).
- https://cdn.elifesciences.org/articles/83606/elife-83606-supp1-v3.xlsx
-
Supplementary file 2
Inter-trait correlation coefficients (r) in F14 mice with p-values in brackets.
- https://cdn.elifesciences.org/articles/83606/elife-83606-supp2-v3.xlsx
-
Supplementary file 3
QTL identified by AIL study.
- https://cdn.elifesciences.org/articles/83606/elife-83606-supp3-v3.xlsx
-
Supplementary file 4
High impact, deleterious missense, and deletion variants between 129T2/SvEms and QSi5 strains.
- https://cdn.elifesciences.org/articles/83606/elife-83606-supp4-v3.xlsx
-
Supplementary file 5
Splicing analysis of Tbx20 and results of transcript isoform differential expression between strains.
- https://cdn.elifesciences.org/articles/83606/elife-83606-supp5-v3.xlsx
-
Supplementary file 6
Differentially expressed genes (DEGs) between 129T2 vs QSi5 mice across the developmental time points.
- https://cdn.elifesciences.org/articles/83606/elife-83606-supp6-v3.xlsx
-
Supplementary file 7
Gene ontology biological process terms that were significantly over-represented among the DEGs.
- https://cdn.elifesciences.org/articles/83606/elife-83606-supp7-v3.xlsx
-
Supplementary file 8
Counts of variants in different genomic features for DEGs and non-DEGs.
- https://cdn.elifesciences.org/articles/83606/elife-83606-supp8-v3.xlsx
-
Supplementary file 9
Effect of various covariates on FVL.
- https://cdn.elifesciences.org/articles/83606/elife-83606-supp9-v3.xlsx
-
Supplementary file 10
Effect of various covariates on FOW.
- https://cdn.elifesciences.org/articles/83606/elife-83606-supp10-v3.xlsx
-
Supplementary file 11
Effect of various covariates on CRW.
- https://cdn.elifesciences.org/articles/83606/elife-83606-supp11-v3.xlsx
-
Supplementary file 12
Effect of various covariates on HW.
- https://cdn.elifesciences.org/articles/83606/elife-83606-supp12-v3.xlsx
-
Supplementary file 13
Effect of various covariates on PFO.
- https://cdn.elifesciences.org/articles/83606/elife-83606-supp13-v3.xlsx
-
Supplementary file 14
List of markers with physical and genetic location.
- https://cdn.elifesciences.org/articles/83606/elife-83606-supp14-v3.xlsx
-
MDAR checklist
- https://cdn.elifesciences.org/articles/83606/elife-83606-mdarchecklist1-v3.docx
Download links
A two-part list of links to download the article, or parts of the article, in various formats.
Downloads (link to download the article as PDF)
Open citations (links to open the citations from this article in various online reference manager services)
Cite this article (links to download the citations from this article in formats compatible with various reference manager tools)
Quantitative trait and transcriptome analysis of genetic complexity underpinning cardiac interatrial septation in mice using an advanced intercross line
eLife 12:e83606.
https://doi.org/10.7554/eLife.83606


