Spontaneous body wall contractions stabilize the fluid microenvironment that shapes host–microbe associations
- Aerospace and Mechanical Engineering, University of Southern California, United States
- Helmholtz Pioneer Campus and Institute of Biological and Medical Imaging (IBMI), Helmholtz Munich (GmbH), Germany
- Chair of Biological Imaging at the Central Institute for Translational Cancer Research (TranslaTUM), School of Medicine, Technical University of Munich, Germany
- Zoological Institute, Kiel University, Germany
Figures
Figure 1
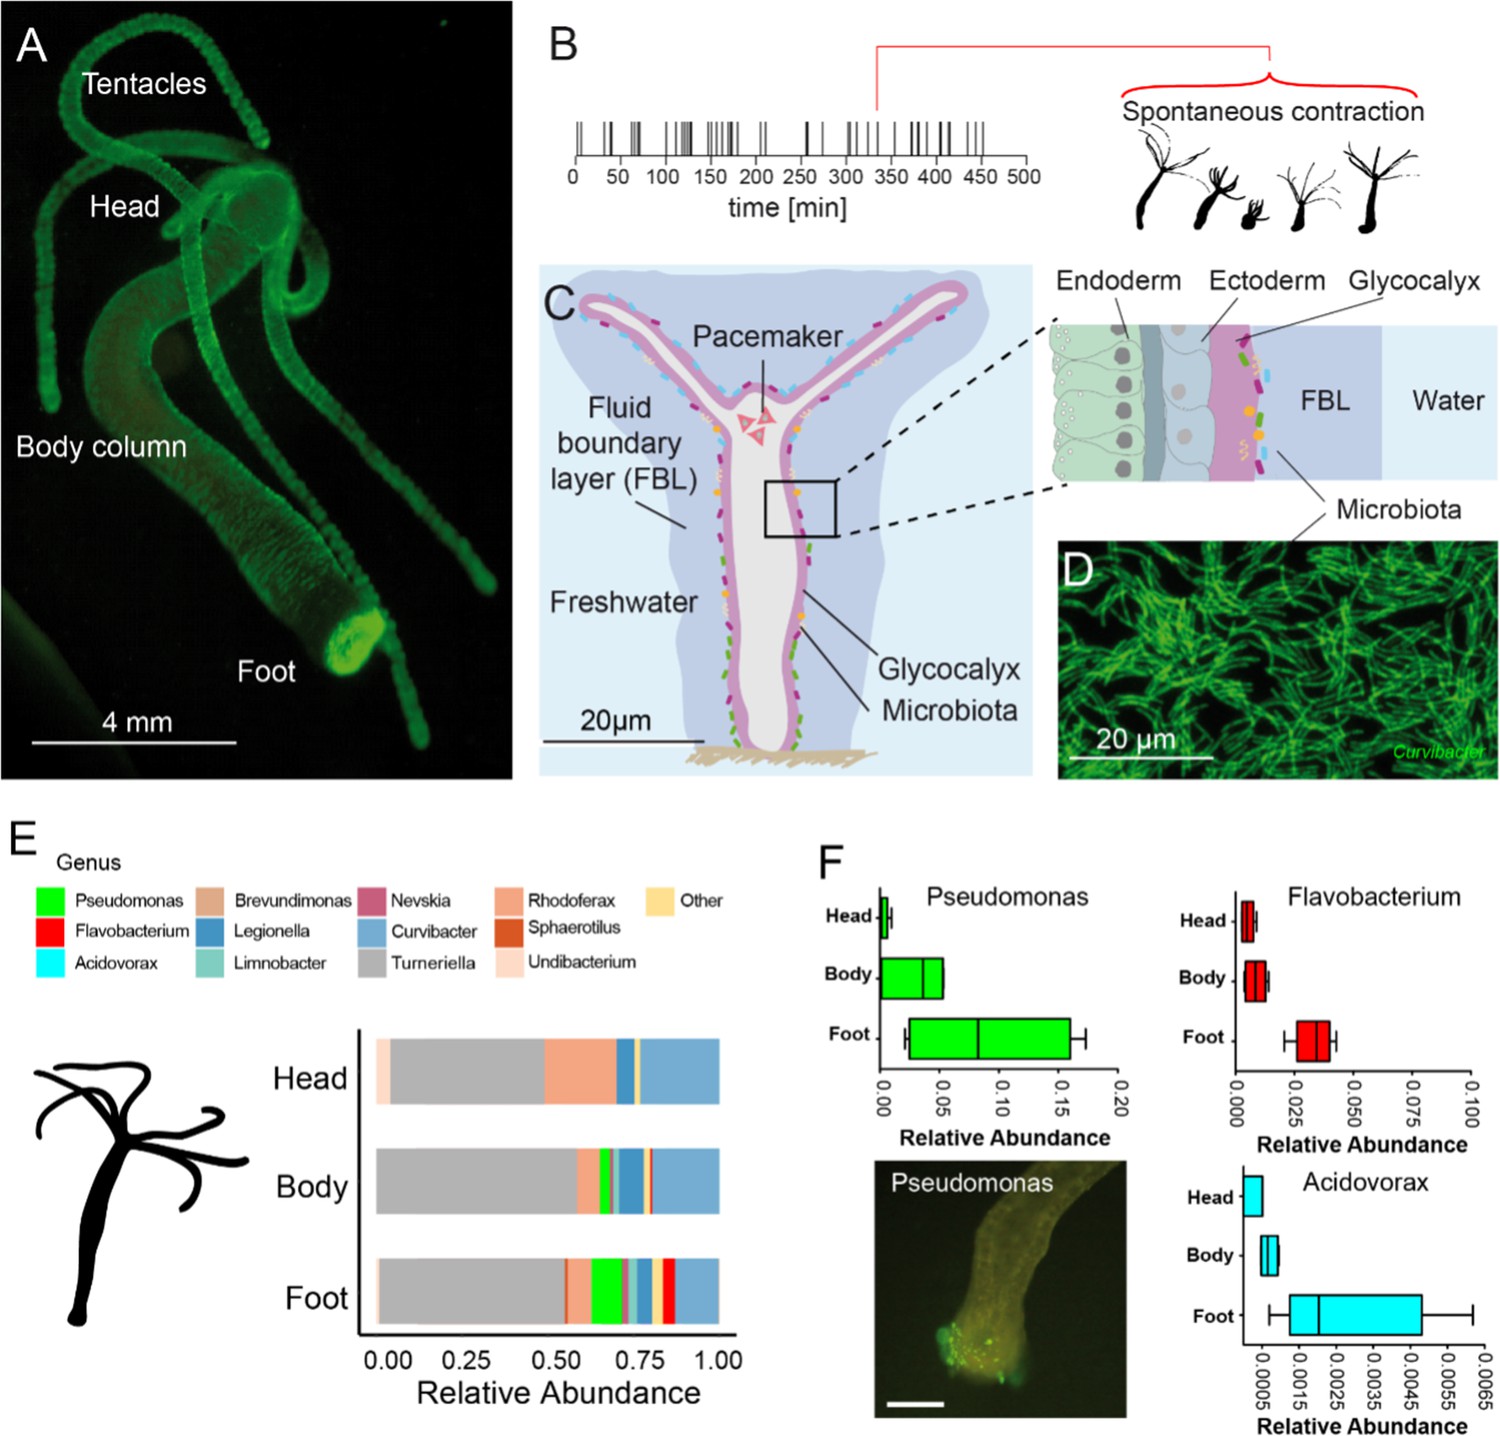
The freshwater polyp Hydra, a model system for the role of spontaneous body wall contractions in shaping microbe biogeography.
(A) Polyp colonized with fluorescent labelled betaproteobacteria. (B) A representative contractile activity pattern of an individual polyp recorded over 8 hr (left). Each dash on the timeline represents an individual spontaneous contraction–relaxation cycle (right). (C) Schematic representation of a Hydra with a fluid boundary layer surrounding the polyp with the glycocalyx layer adjacent to the polyp’s tissue. Inset: tissue architecture covered outside by the mucus-like glycocalyx that provides the habitat for a specific bacterial community on the interface with the fluid boundary layer. (D) Dense community of fluorescently labeled bacteria (main colonizer Curvibacter sp.) colonizing the polyp’s head. (E) The biogeography of Hydra’s symbionts under undisturbed/control conditions follows a distinct spatial colonization pattern along the body column (n = 4). (F) Bacteria mostly colonizing the foot region include Pseudomonas, Flavobacterium, and Acidovorax (n = 4). Scale bar: 500 µm.
Figure 2 with 6 supplements
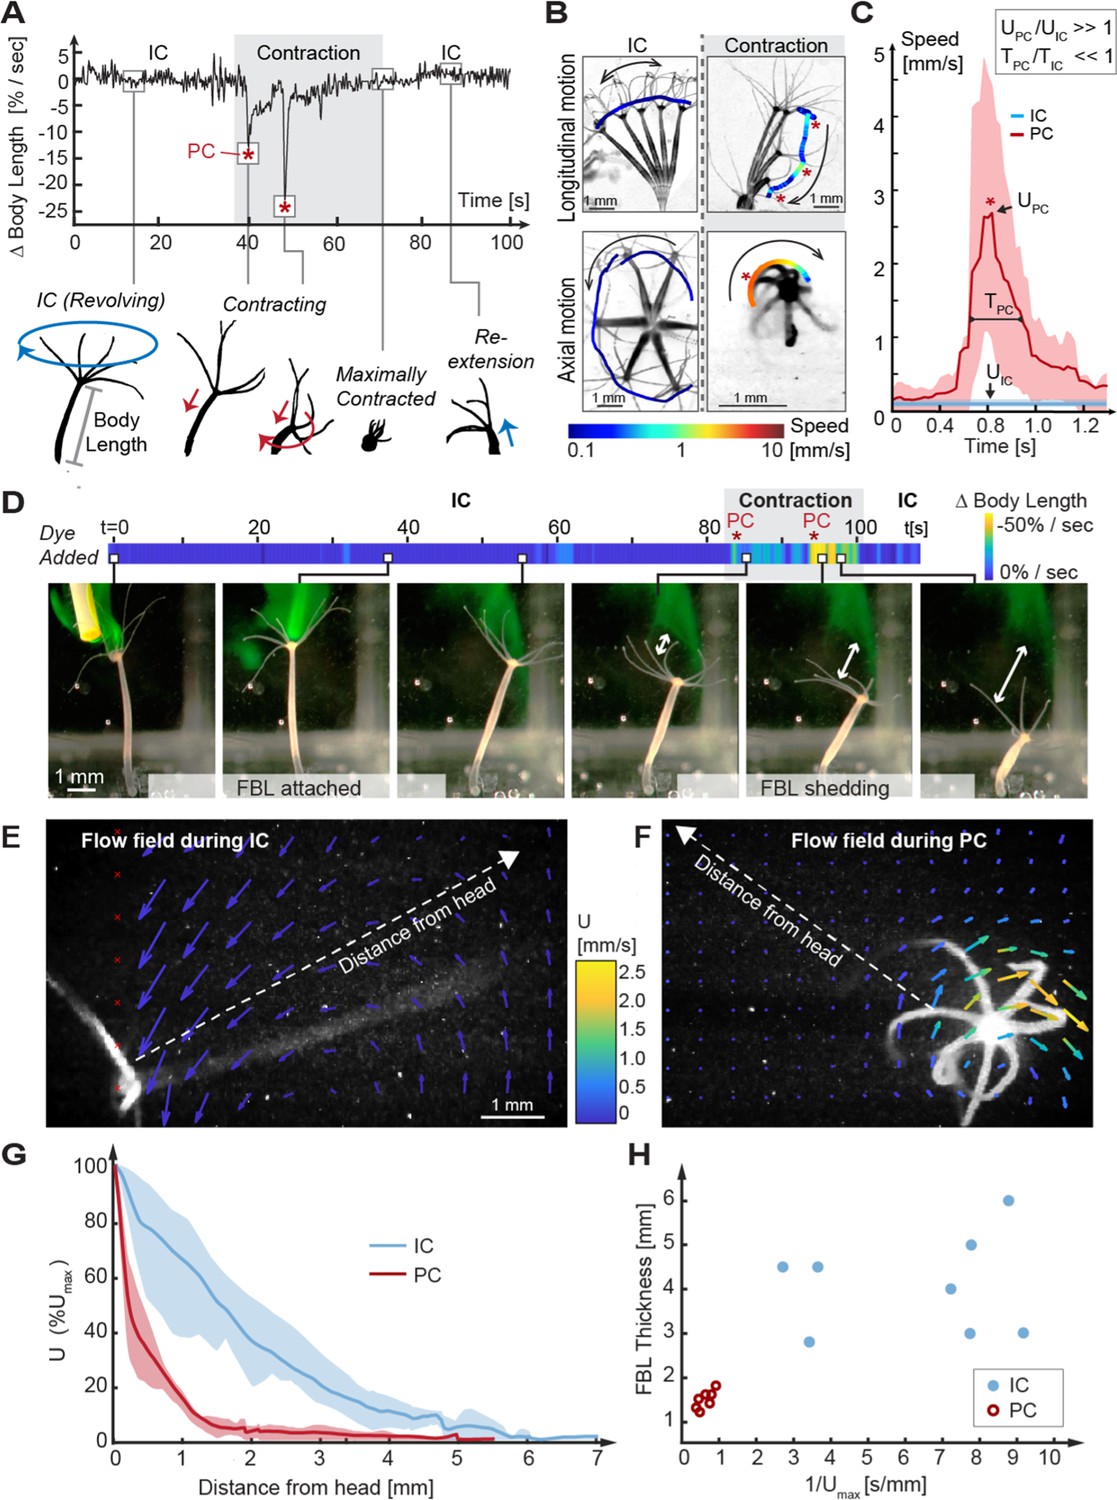
Kinematic and fluid dynamics analysis of individual contraction events reveal the shedding of the fluid boundary layer (FBL) during each spontaneous contraction event.
(A) Top: representative plot of the change in relative body length in Hydra as a function of time shows transition from an inter-contraction interval (IC) to a spontaneous contraction with two peak contraction events (PC, asterisks), and the return to an IC interval. Bottom: typical kinematic pattern associated with IC intervals and contractions. Arrows indicate distinct body trajectories during IC intervals (blue) compared to contractions (red). (B) Typical body trajectories in longitudinal and axial plane during IC intervals and spontaneous contractions visualized by time-lapse microscopy. Maximal speeds (log10 scale) are indicated by color-coded trajectories of the head (oral end or tentacles). Trajectories are slightly offset to avoid obscuring the animal. Asterisks denote PC events. (C) Comparison of maximal velocities near head reached during IC intervals (n = 3 animals) and PC (n = 5 animals). Lines: average curves. Shaded areas: interquartile range. Inset: relative scaling of PC duration (), IC interval duration (), PC velocity magnitudes (), and IC interval velocity magnitudes (). (D) Application of a fluorescent dye reveals existence of a FBL during the IC interval and its shedding upon a contraction event. A representative time-lapse series. White arrows indicate FBL shedding after PCs, that is, the growing separation between the original, stained FBL and Hydra’s head. (E) Quantification of Hydra’s flow velocity field during IC intervals and (F) during a typical PC with axial rotation (top view). Flow vectors and velocities are indicated by color-coded arrows. (G) Relative change of fluid flow speed as a function of distance from Hydra’s surface measured along dotted lines in (E, F) during IC intervals (blue) and during PCs with rotation (red). Lines: average curves. Shaded areas: interquartile range. (H) FBL thickness, defined as distance from Hydra at which 90% freestream speed is reached, is inversely correlated to maximal flow speed ().
Figure 2—figure supplement 1
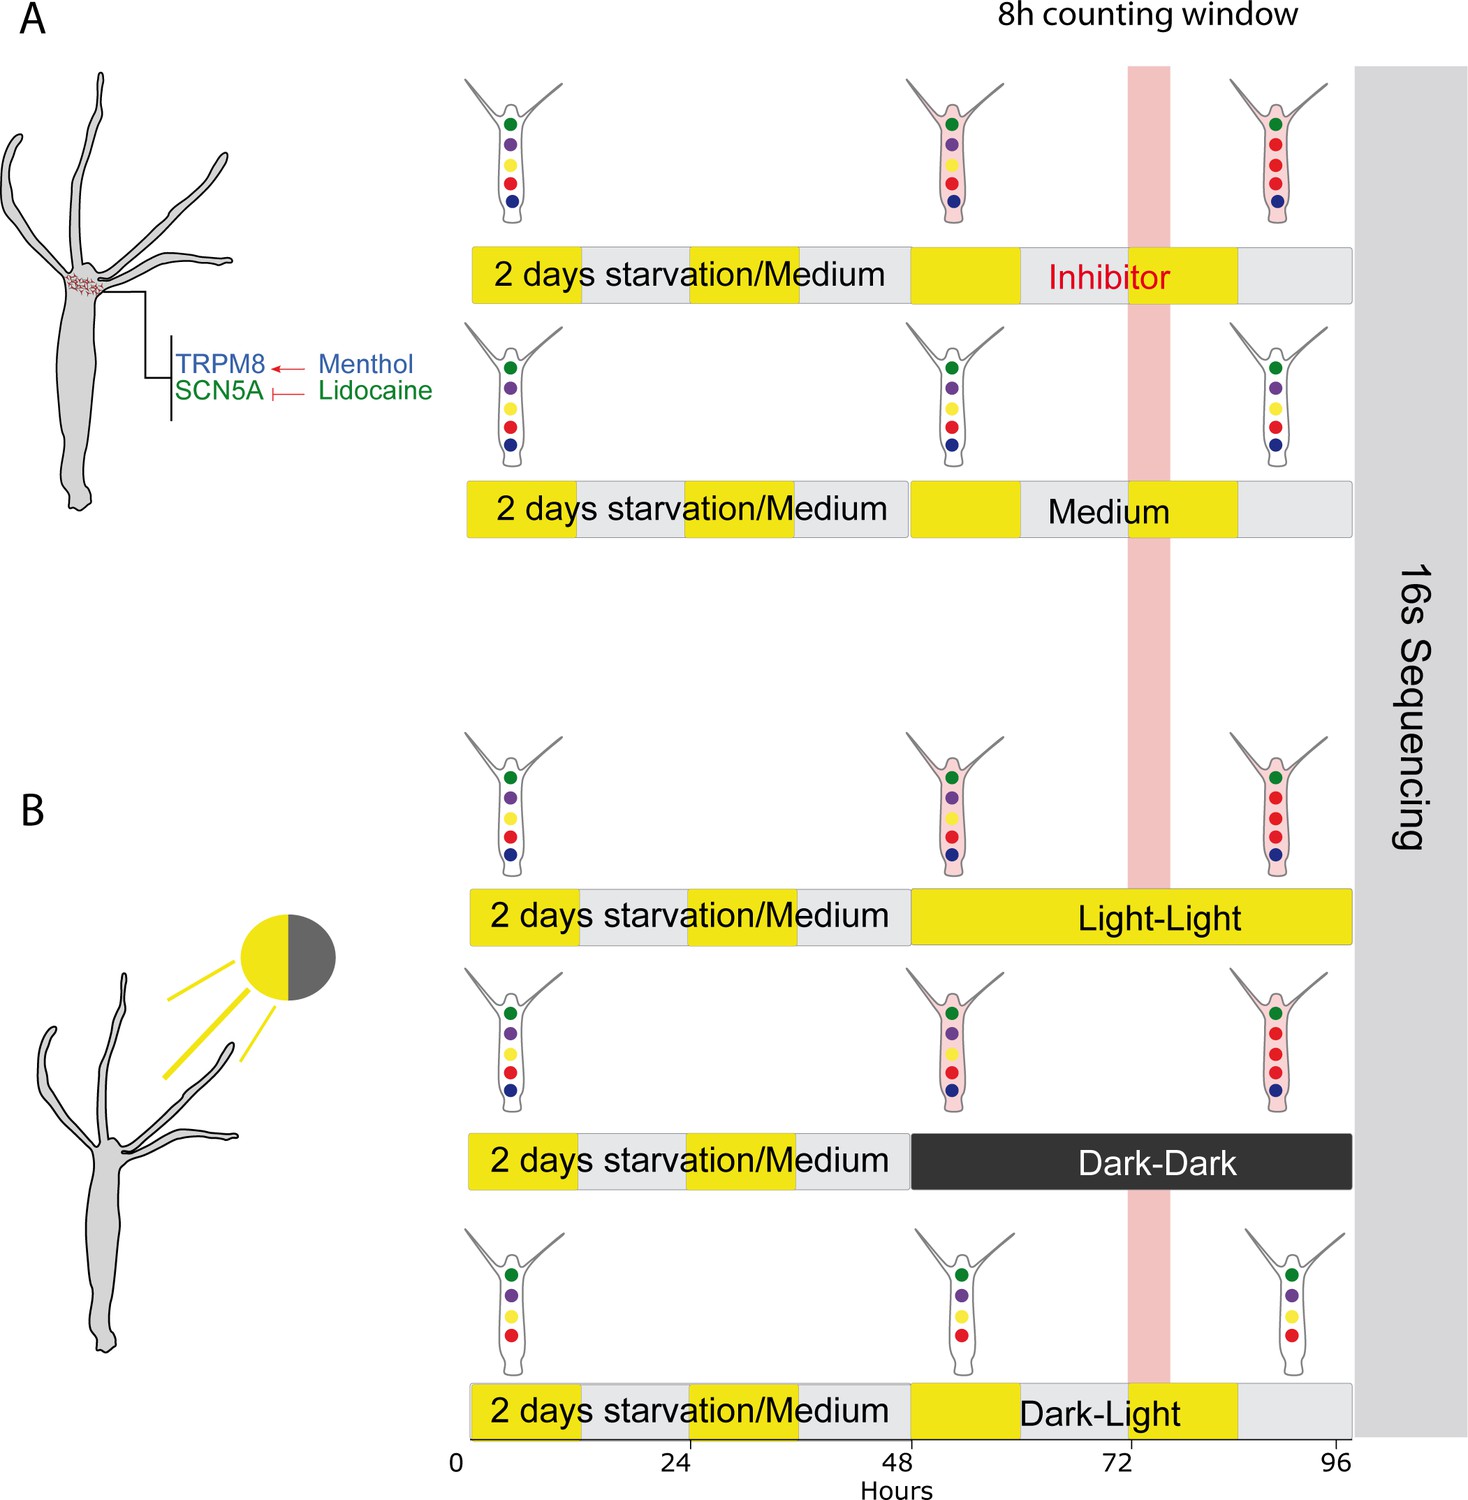
The experimental setup for measuring and manipulating the contraction rates in Hydra.
In control conditions (last row in A, B), Hydra was subjected to regular culture medium and light cycles. We used two different approaches to manipulate contractions rates in the treatment groups. (A) Use of ion channel inhibitors, which reduce spontaneous contractions. Animals were incubated for 48 hr at 18°C and 80% humidity with medium containing either lidocaine or menthol, or with medium alone (control). (B) The contractile behavior of Hydra is also light sensitive and was reduced under light–light and dark–dark conditions. In control conditions (last row), Hydra was subjected to regular light–dark cycles. (A, B) Highlighted in red is the 8 hr time window when contractions were counted in all conditions. After the 48 hr treatment, the gDNA was extracted from the polyps and send for 16S rDNA sequencing for all conditions.
Figure 2—figure supplement 2
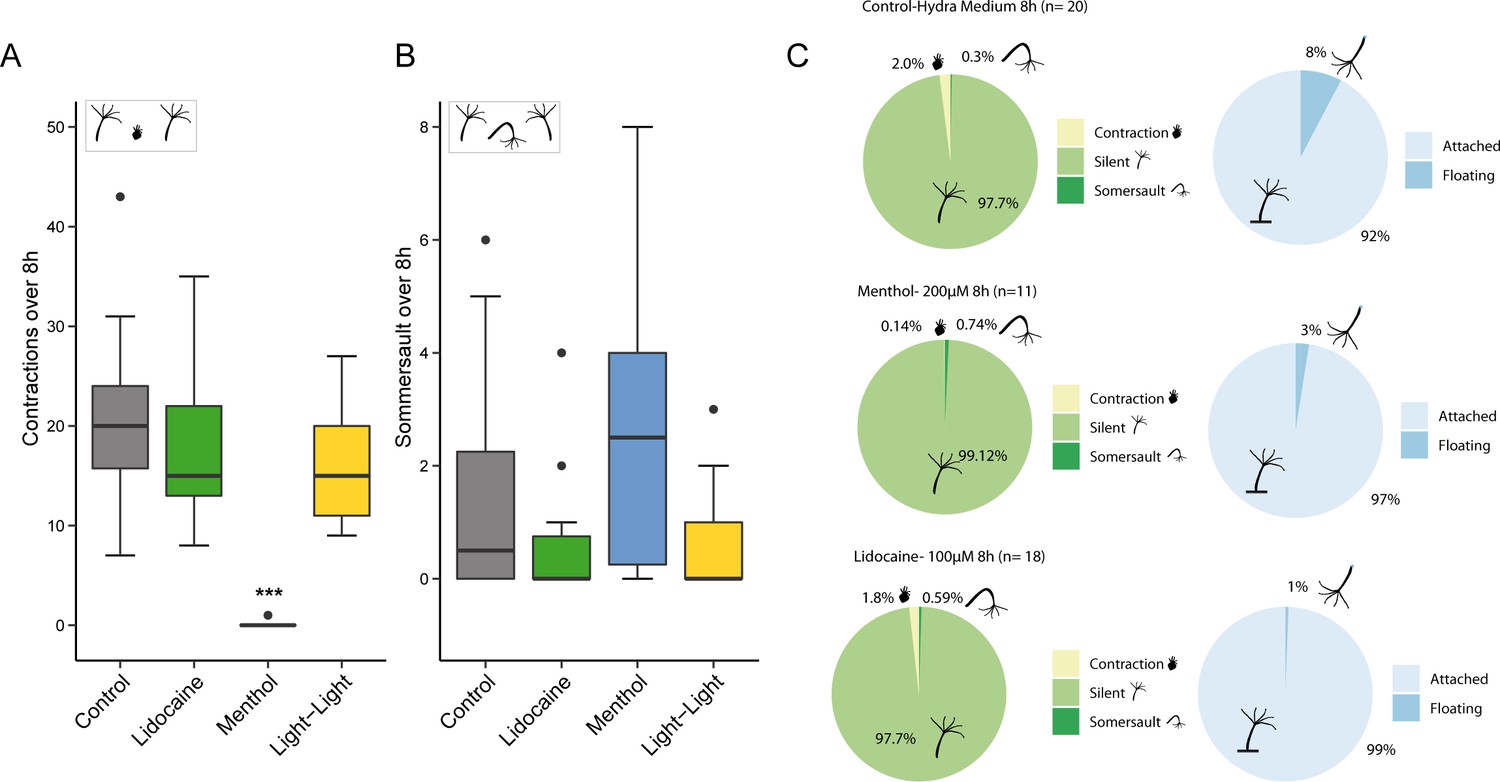
Behavioral analysis of Hydra over 8 hr.
(A, B) Quantification of the number of contractile behavior events over time. (A) The number of spontaneous contractions is reduced under the experimental treatment conditions compared to control. Menthol effectively abolishes all spontaneous contractions, whereas the other treatments are reducing the frequency (n=10-20). (B) Hydra somersault behavior is not affected by the different treatments and remains a rare event. (C) Percentage of time different Hydra behaviors occurred. The time a polyp spent in a spontaneous contraction event was reduced by the lidocaine and menthol treatment. In addition, time of floating at the surface is reduced in the menthol nd lidocaine treatments compared to the control (n=10-20). (Kruskal-Wallis, Wilcoxon test, * p≤0.05; ** p≤0.01; *** p≤0.001).
Figure 2—figure supplement 3
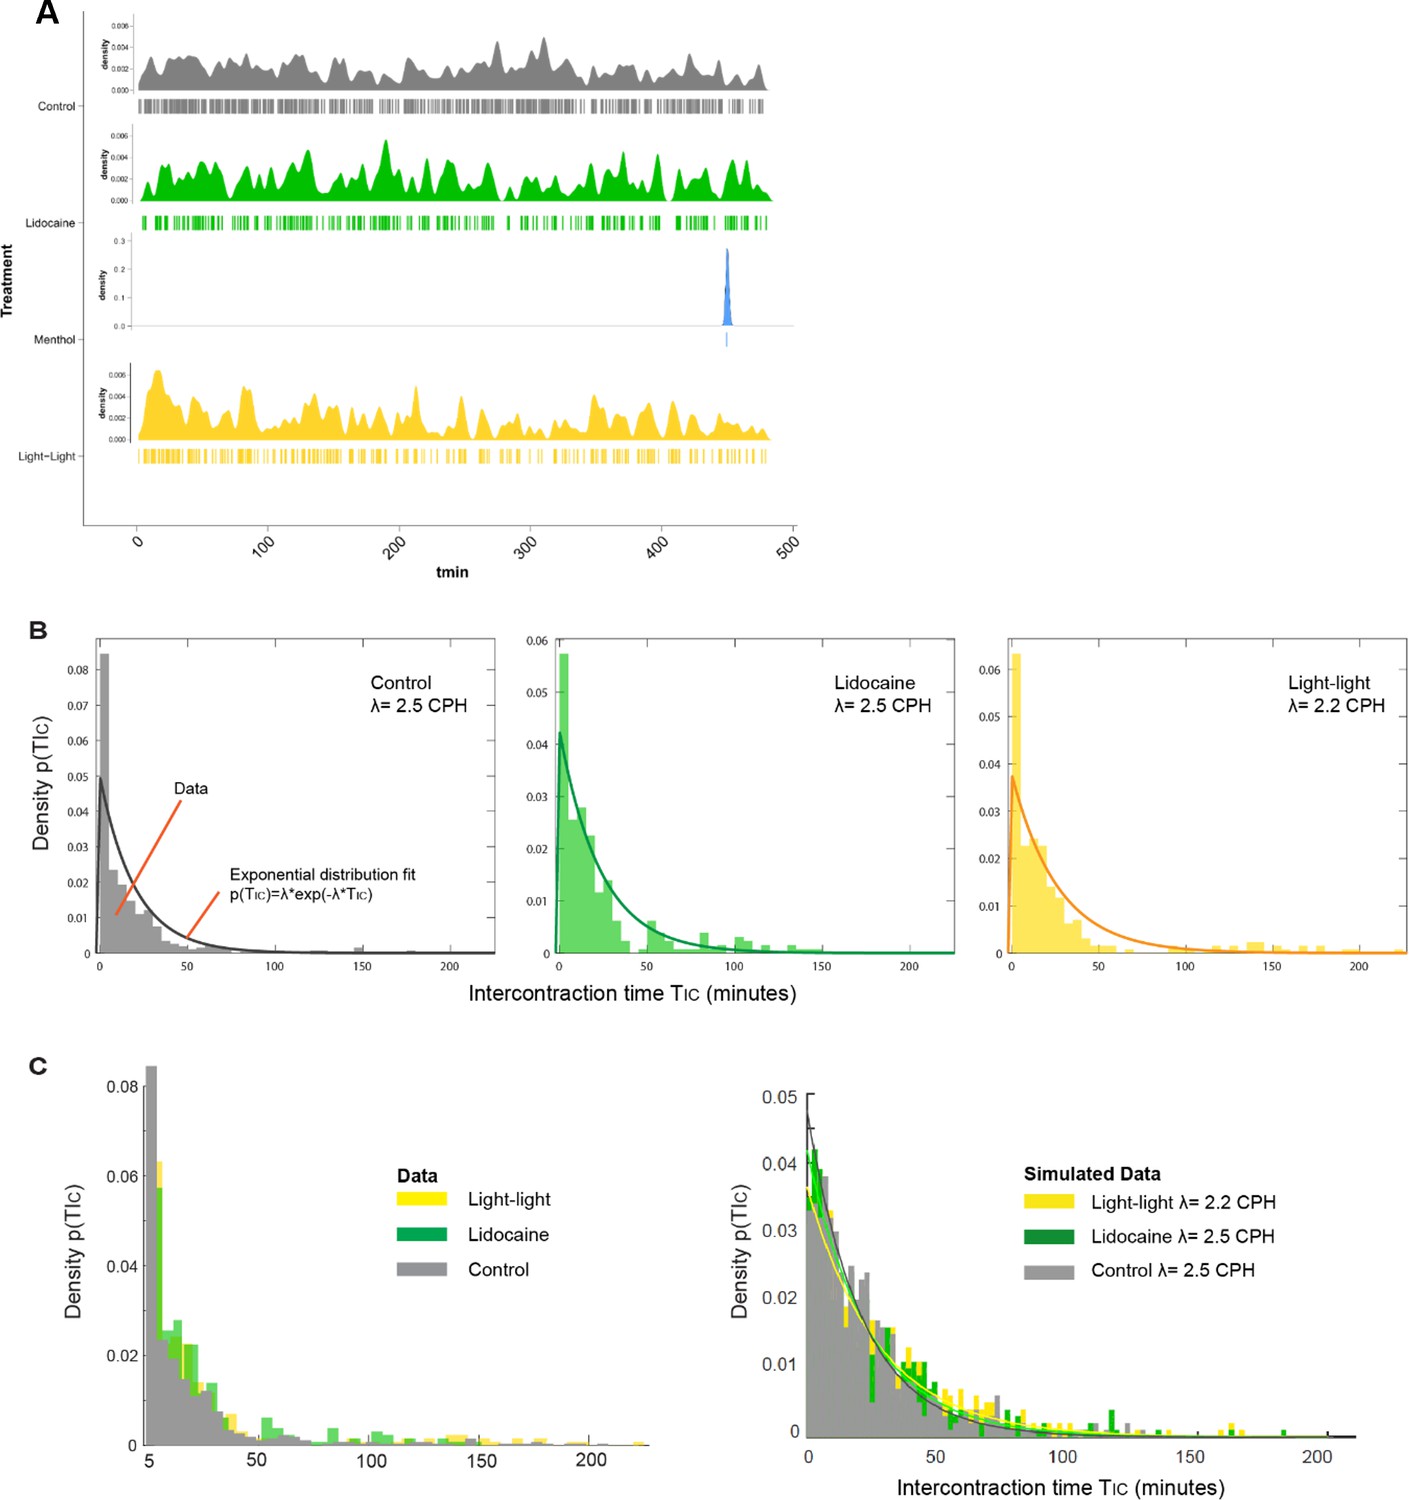
Spontaneous contractions are modeled mathematically as a Poisson process.
(A) The temporal distribution of spontaneous contraction events is shown for all treatment groups in a density plot (top) and a spike raster plot (bottom). (B) Characteristic for a Poisson-like process, the time measured between contractions (TIC) follows an exponential distribution for all conditions (except menthol), with lidocaine and light–light treatments characterized by a longer tail compared to control, reflecting lower average contraction frequencies. Shown is the best exponential distribution fit. (C) Combined histogram density plot of the experimental TIC data in all conditions (left) compared to a typical simulated data set (right) that recapitulates key experimental observations, particularly the longer tails of the treatment groups (here we show just one data set per condition, and each data set contains 10,000 randomly sampled intervals).
Figure 2—figure supplement 4
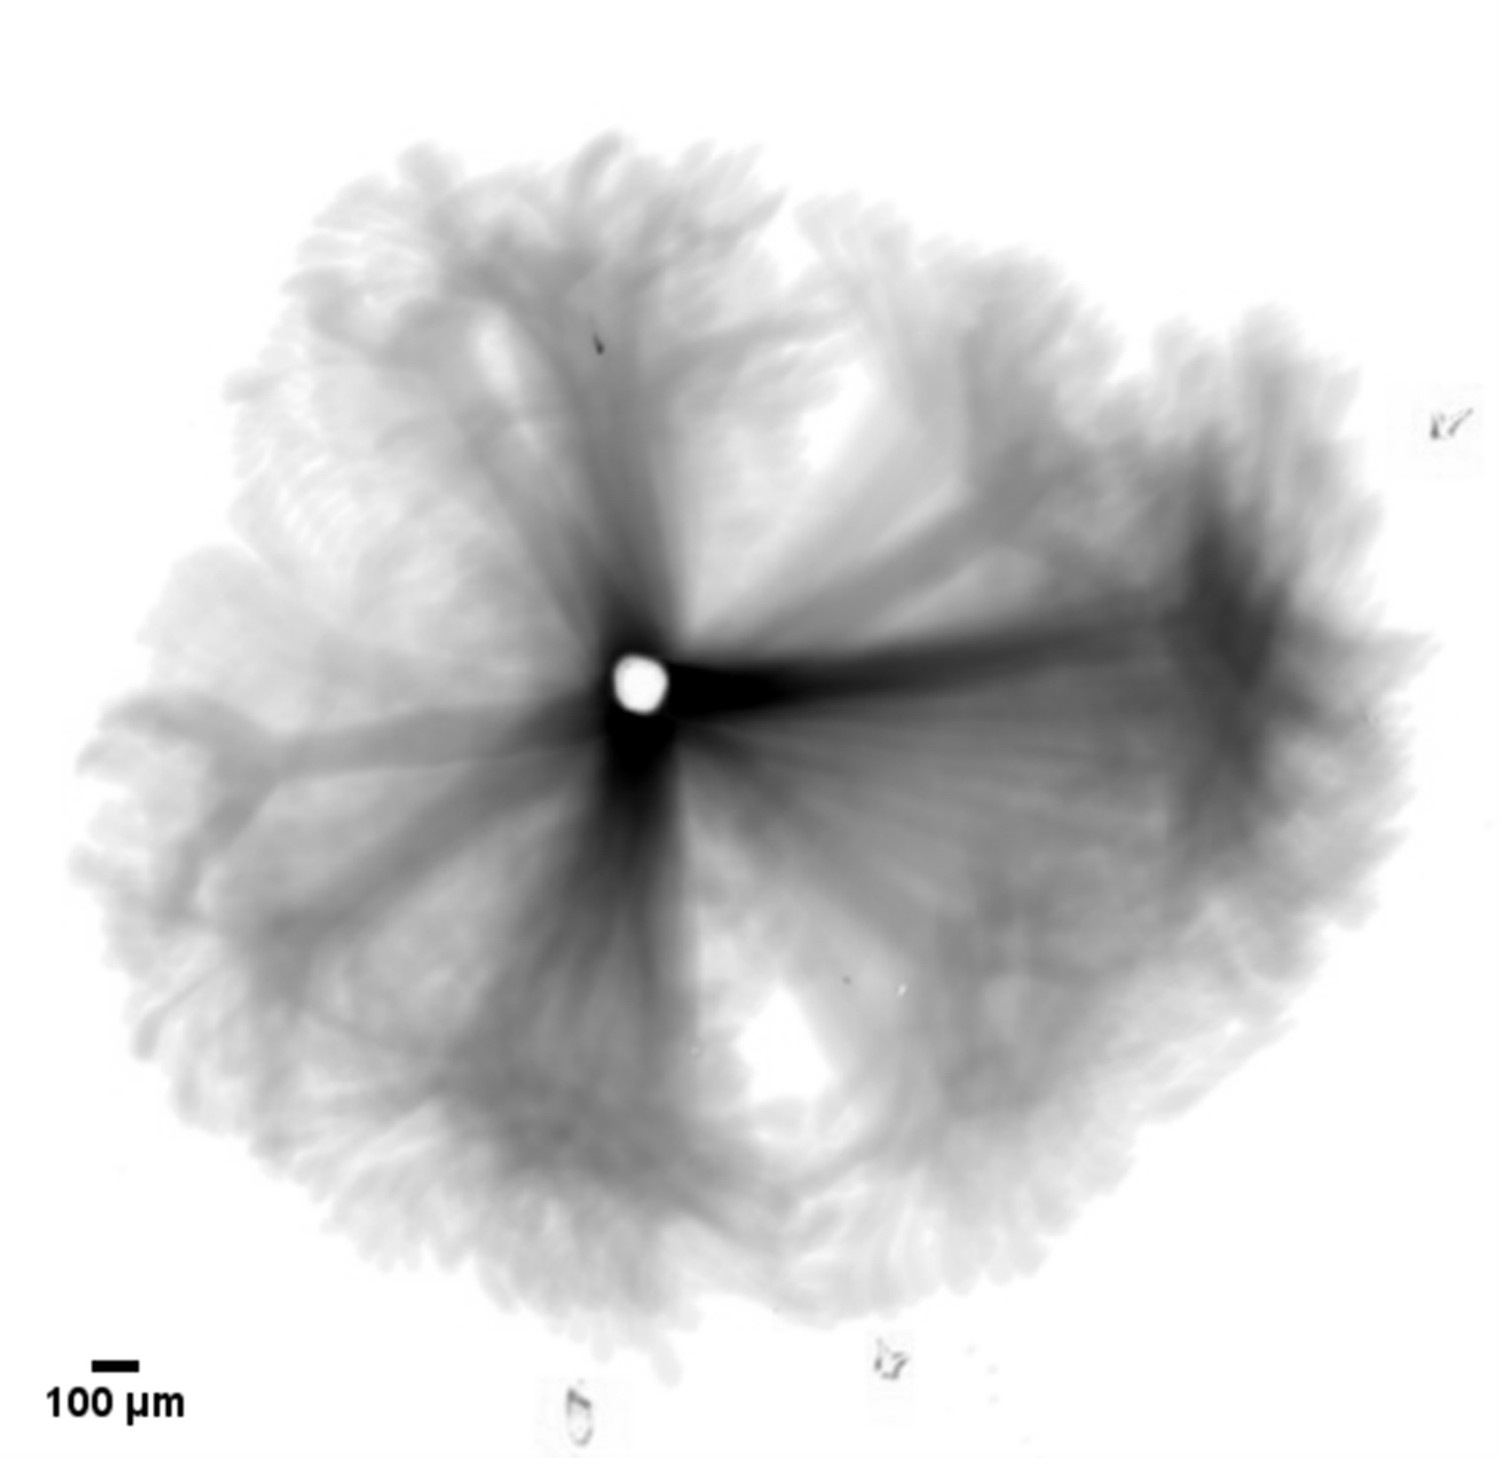
The 2D space covered by Hydra’s resting motion and re-extensions in the period of nine contractions is revealed by this overlay of detected motion.
The light spot in the center marks the foot, which stayed fixed.
Figure 2—figure supplement 5
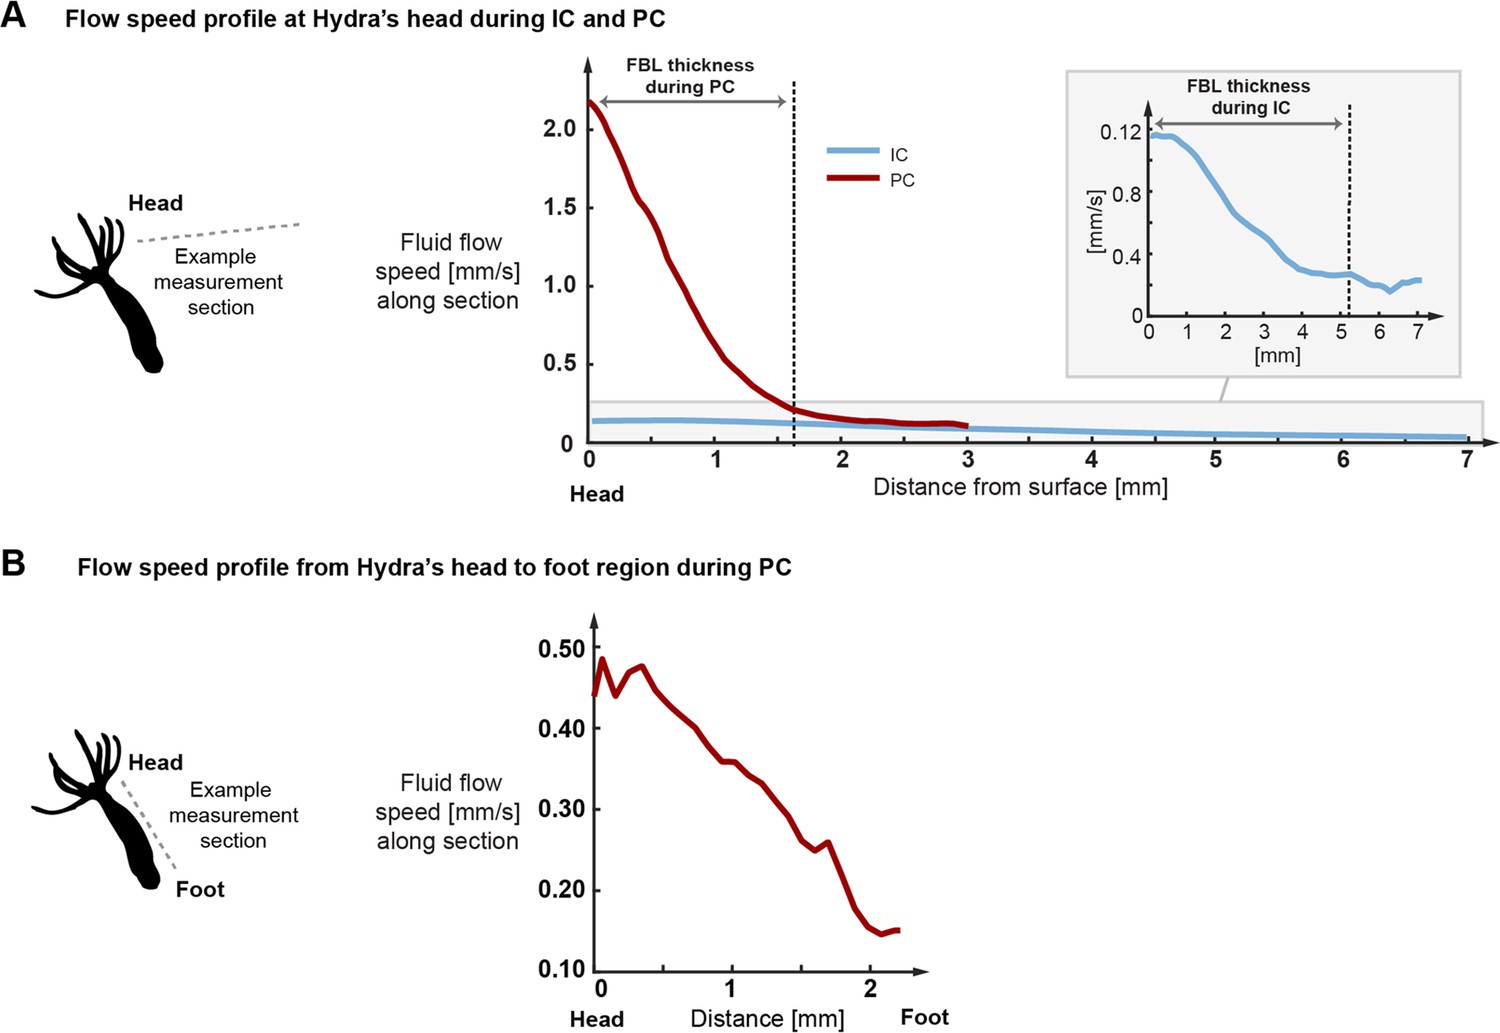
Typical flow speed profiles derived from the particle imaging velocimetry (PIV) data.
(A) Flow speed profiles during inter-contraction intervals (IC) and peak contraction events (PC) measured along the sections shown in Figure 2E and F starting at Hydra’s head and ending in the free stream flow. As indicated, fluid boundary layer (FBL) thickness is defined as the distance at which the flow speed decreases to approximately 10% of the surface speed. (B) Flow speed profile during peak contraction measured along the body column from head towards the foot region. Towards the foot, the flow declines rapidly to a fraction of maximal speed.
Figure 2—figure supplement 6

Spontaneous contraction frequencies of Hydra when placed in small liquid volumes can reach up to 12 contractions per hour (CPH).
Over time, these rates decrease substantially and converge to 3 CPH or less, comparable to the baseline rate observed in our control conditions where animals were placed in a large fluid volume.
Figure 3
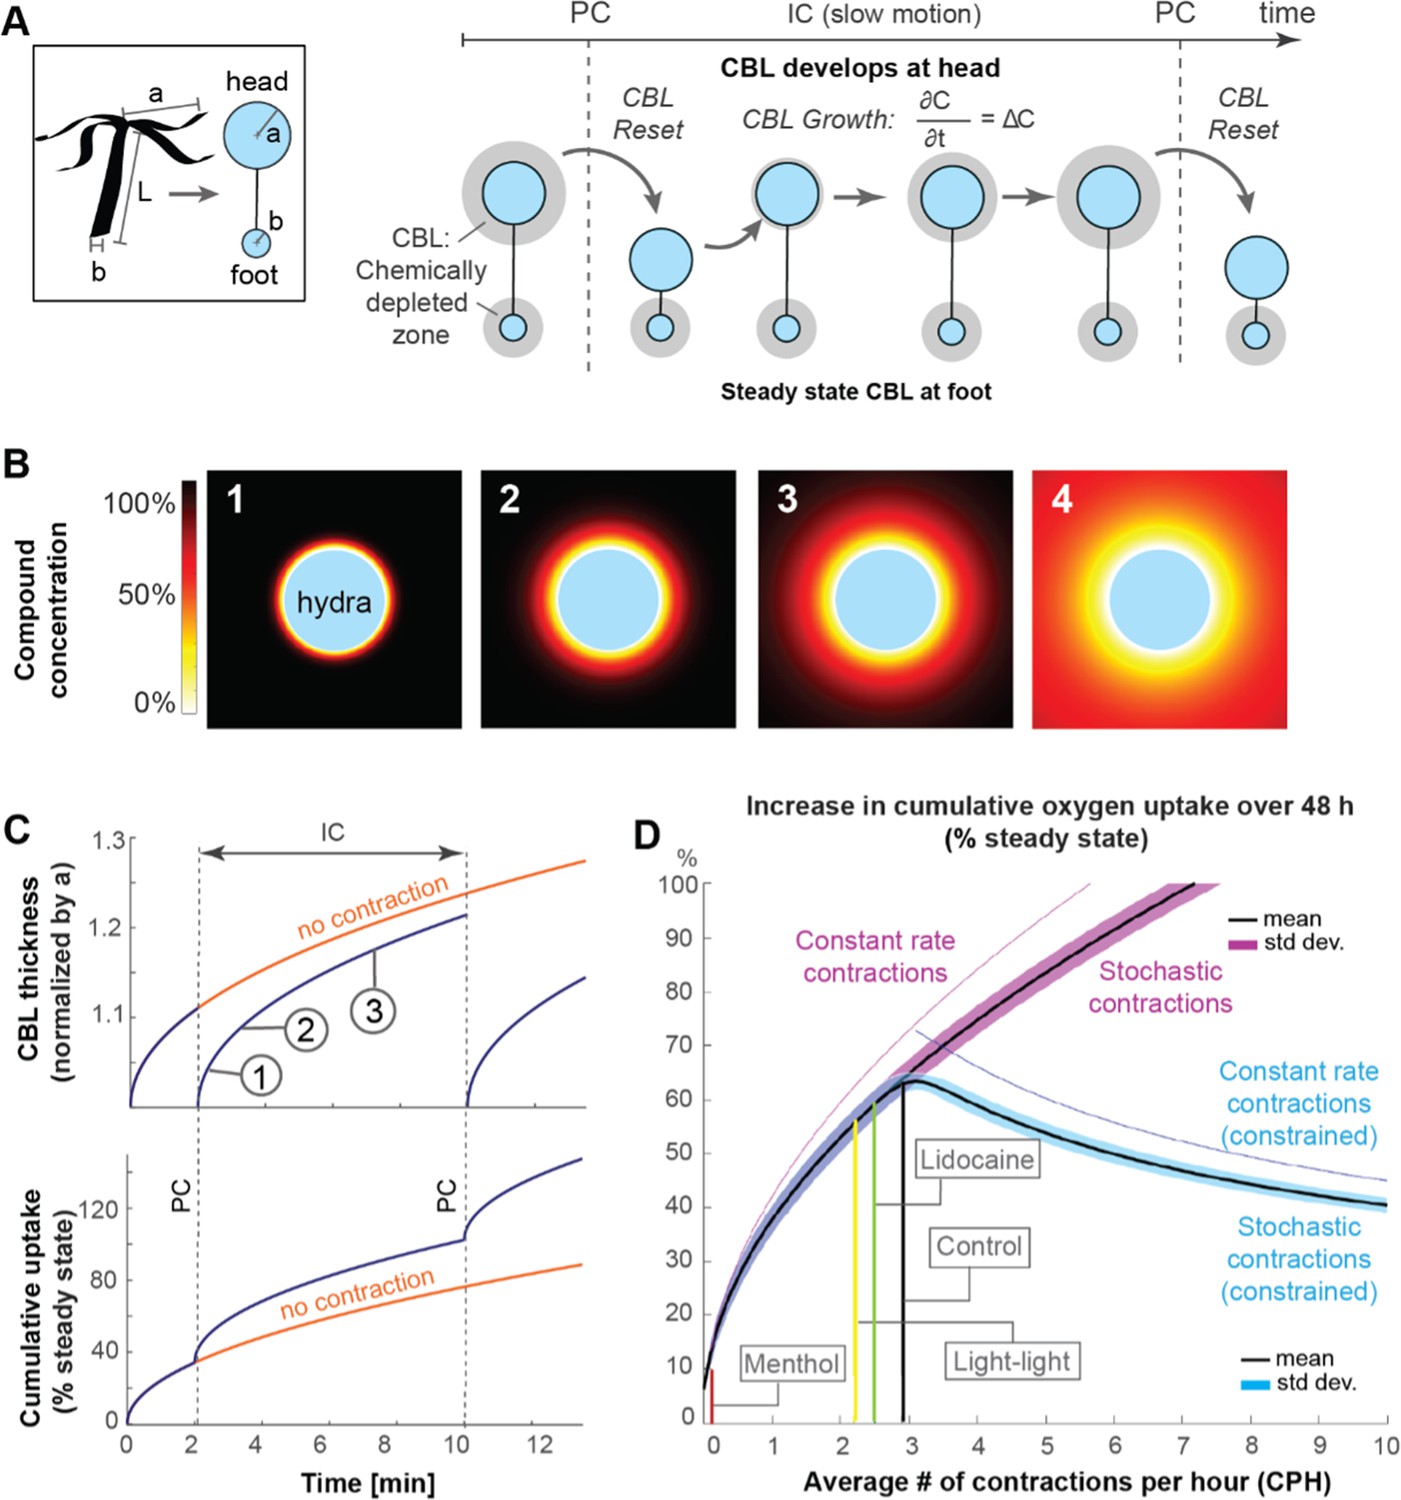
Mathematical model suggests that spontaneous contractions enhance mass transport to and from the surface.
(A) Left, box: simplified animal geometry assumed in model consists of a sphere representing the head and a smaller sphere representing the basal foot. Right: by Fick’s law, a chemically depleted concentration boundary layer (CBL) forms around Hydra’s head and foot region through continuous uptake of chemical compounds at the surface during the inter-contraction interval (IC). The CBL is shed from the head region, but not the foot region, through spontaneous contractions (PC). (B) Computationally modeled growth of chemically depleted CBL around Hydra’s head over time until steady state is reached (panel 4), assuming continuous uptake at surface and unlimited supply at far distance. (C) Top: growth of chemically depleted CBL as a function of time with and without contractions. Bottom: instantaneous and cumulative uptake rate, respectively, of a given chemical compound (here: oxygen) during the CBL dynamics above; (D) Predicted increase in cumulative uptake rate (as percentage of steady state) of a given chemical compound over 48 hr as a function of spontaneous contraction frequencies within the observed range (purple), and of increasing frequencies with unconstraint number of spontaneous contractions (magenta) compared to a constraint number of spontaneous contractions (blue graph).
Figure 4 with 5 supplements
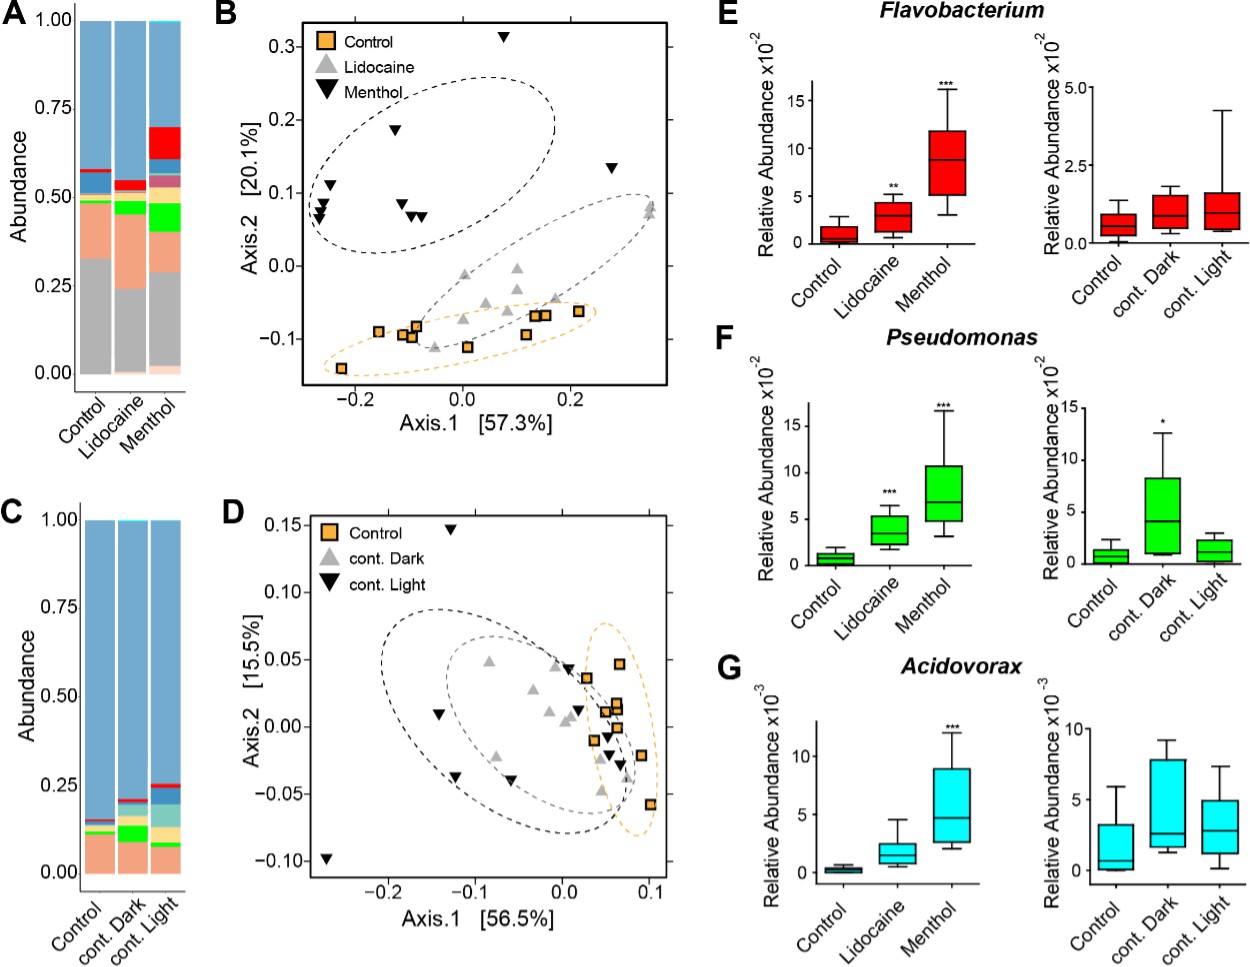
Perturbing the frequency of spontaneous contractions over extended time periods shifts the microbial composition in Hydra.
Reducing the spontaneous contraction frequency with 48 hr treatment of ion channel inhibitors (menthol and lidocaine), continuous light exposure (cont. light), or continuous dark (cont. dark) exposure significantly affects the bacterial community. Control is incubation in freshwater (Hydra medium) and 12 hr of light alternating with 12 hr of dark conditions. (A) Bar plot of the relative abundance on the genus level showing the effect of the ion channel inhibitors. (B) Bar plot of the relative abundance on the genus level showing the effect of the light treatments. (C, D) Analysis of the bacterial communities associated with the control and disturbed conditions using principal coordinate analysis of the Bray–Curtis distance matrix. The polyps with disturbed contraction frequency show distinct clustering (ellipses added manually). (E–G) Box plots displaying the fold change of the relative abundance compared to the control of Flavobacterium, Pseudomonas, and Acidovorax in response to the different treatments. (For all plots: n = 8-10) *p≤0.05; **p≤0.01; ***p≤0.001 (ANOVA and Kruskal–Wallis).
Figure 4—figure supplement 1

The microbiota changes due to reduced contraction frequency.
A. The relative abundance of the microbiota after 48h of treatment shows that lidocaine/menthol and dark-dark/light-light treatments cause shifts in microbiota composition. Flavobacterium, Pseudomonas and Acidovorax increased in their relative abundance in the treatment groups (n=8-10). B. The spatial distribution of the microbiota along the body axis under normal/undisturbed condition (n=4). C–E. The spatial distribution of the genera that are increasing in abundance after treatment. All three, Flavobacterium, Pseudomonas and Acidovorax, have a higher abundance in the foot region (n=4).
Figure 4—figure supplement 2
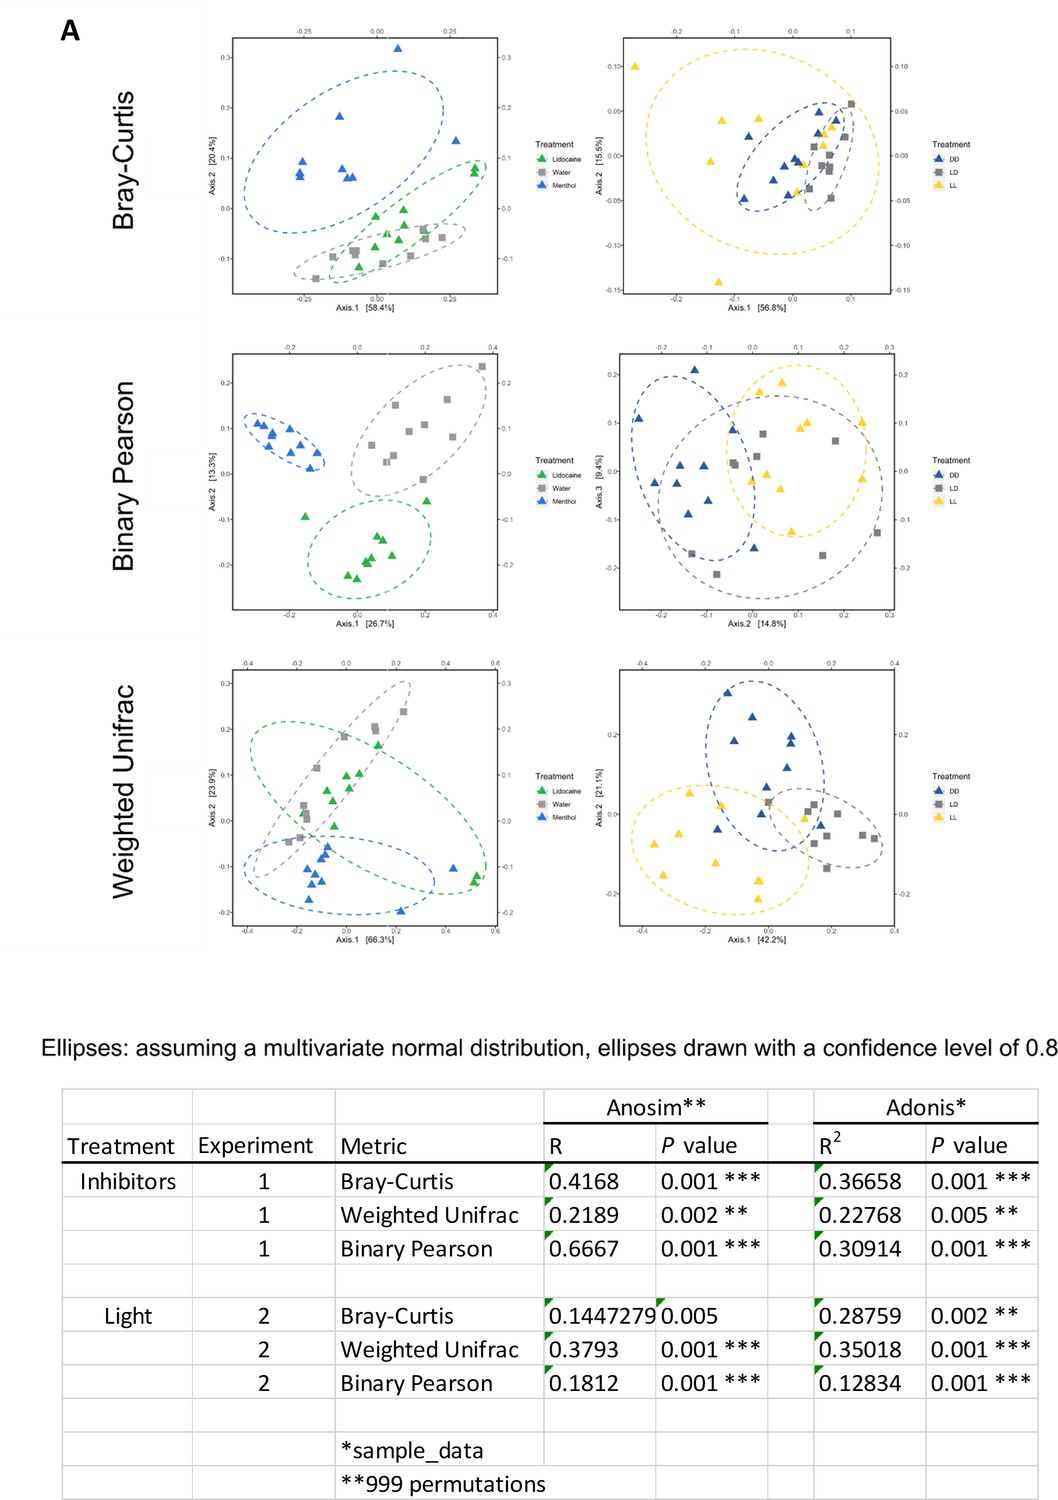
Analysis of the bacterial communities using different distance matrixes.
(A) Different principal coordinate analyses (PCoA) of the bacterial communities using different distance matrixes. Here: Bray-Curtis, Binary Pearson and Weighted Unifrac. In all three PCoA plots, a shift of the bacterial communities is visible in respond to the different treatments. Table. Statistical analysis of the PCoAs using Anosim and Adonis. Experiment-1 and -2 are two independent experiments conducted in an identical way using either the ion channel inhibitor menthol and lidocaine or different light conditions (n = 8-10).
-
Figure 4—figure supplement 2—source data 1
Statistical analysis of the PCoAs using Anosim and Adonis.
- https://cdn.elifesciences.org/articles/83637/elife-83637-fig4-figsupp2-data1-v2.xlsx
Figure 4—figure supplement 3
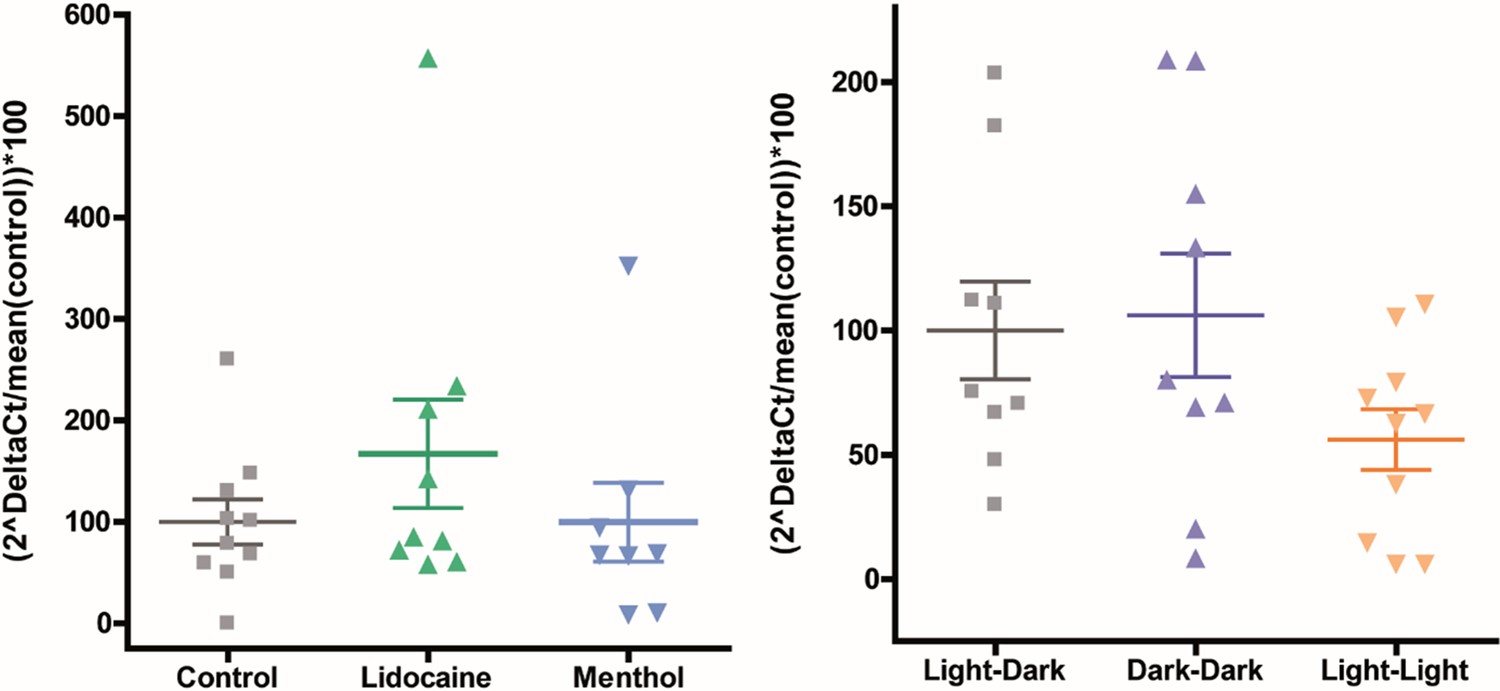
The bacterial load is not affected by ion channel inhibitors or light treatments.
The bacterial load does not show a significant difference compared to control (Kruskal–Wallis [non-parametric] and Dunn’s multiple comparison test) tested by qRT-PCR using Eub-primer (bacterial load measure) and Elon-F (gDNA host measure). The data consist of two technical replicates (two runs) and 4–5 biological replicate. The error bars show the mean with SEM. The data are normalized to the mean of the respective control and shown as percentages.
Figure 4—figure supplement 4
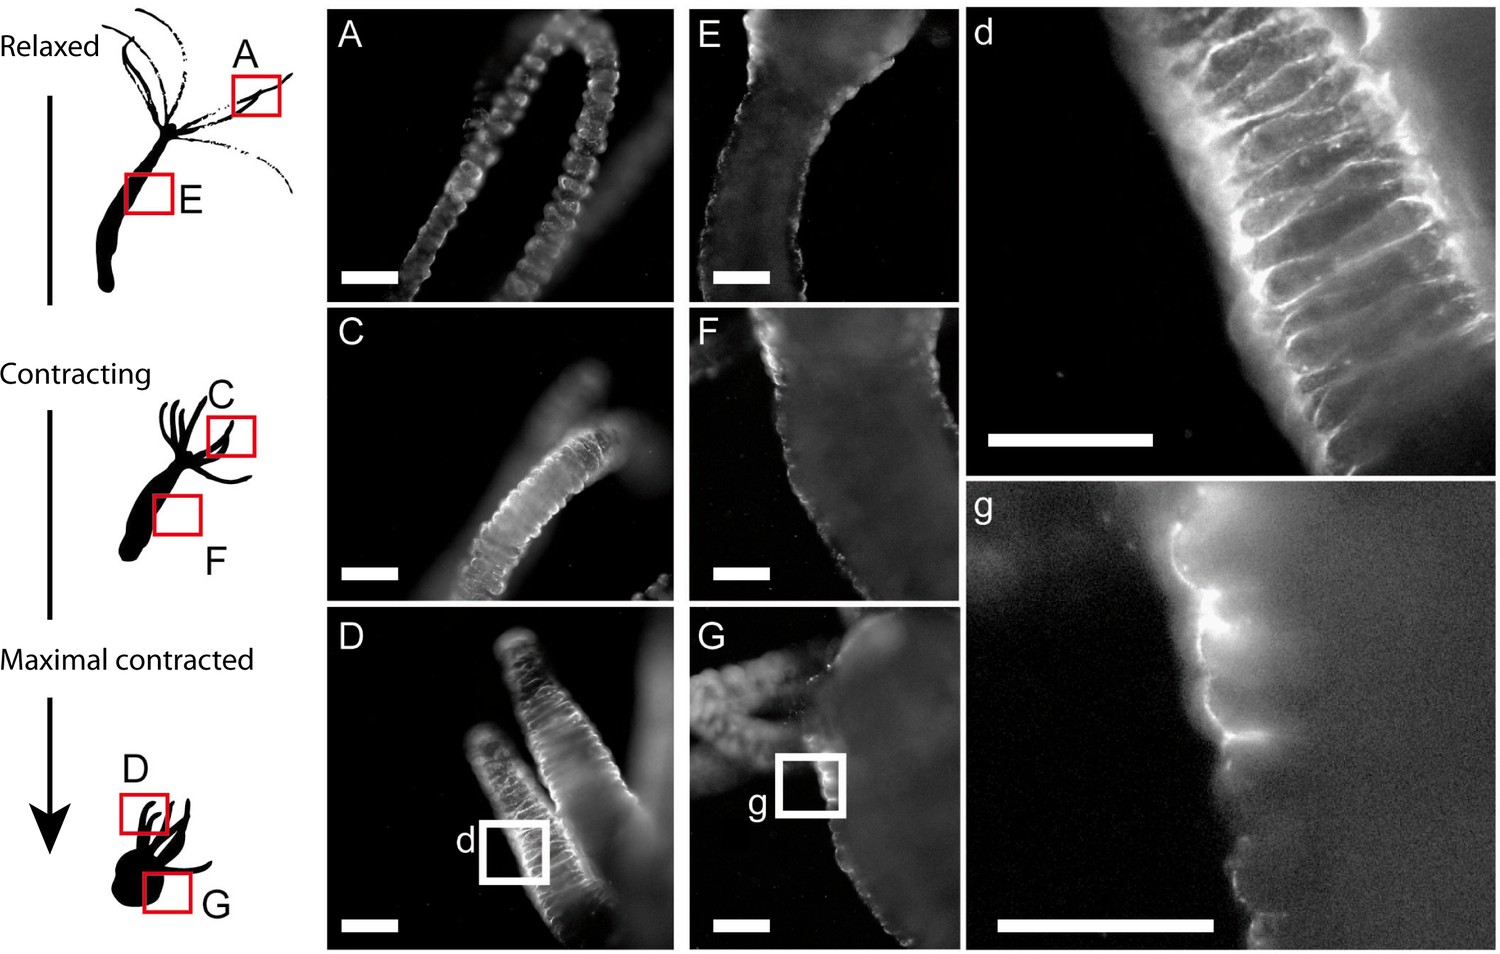
Video recording of fluorescently labeled Curvibacter reveals a very stable colonization pattern during a full contraction cycle.
We found that no bacteria are shed during a contraction cycle. Here, snapshots from video recording of Hydra vulgaris AEP recolonized with fluorescent Curvibacter AEP1.3 (white) and filmed over time (Videos 4 and 5). Here representative frames extracted from the videos are shown. (A, C, D) Tentacle in a relaxed state (A), contracting (C), and maximal contracted (D). No fluorescently labeled bacteria are seen to detach. (E–G) The body column in different stages. (E) Relaxed stage, contracting (F), and maximal contracted (G). Again, no fluorescently labeled bacteria are seen to detach. d and g are close ups of (D) and (G), respectively. Scale bar: 100µm.
Figure 4—figure supplement 5

Reduction in contraction frequency does not alter the glycocalyx of Hydra.
To visualize the glycocalyx on the surface of intact hydras and polyps incubated in menthol for 48 hr, transgenic polyps expressing GFP in the ectoderm were stained using a specific antibody against PPOD4 protein. Mid-body optical sections were made using confocal microscopy. Representative low-magnification snapshots are shown in (A, B). High-magnification images of three representative polyps for control (C–E) and menthol-treated polyps (F–H) are shown. To measure the glycocalyx thickness, the fluorescence profile across the ectoderm has been recorded and quantified (lower panel on [C–H], each graph represents an average profile from 10 transects). Average distribution of the PPOD4 signal from control (black line, on I) and menthol-treated polyps (blue line, on I) provides clear evidence that the reduction in contraction frequency by menthol does not change the glycocalyx thickness.
Author response image 1

Leftmost panels, Numerical solution (and zoom in) of the steady state concentration field around a cylindrical body of length L = 2 and radius r = 1.
Middle panels: concentration field around a spherical body of radius 1. Rightmost panel, difference in concentration outside the cylinder and sphere. The difference away from the body surface is less than 5%.
Videos
Video 1
Hydra alternating between rest (inter-contraction time) and spontaneous contractions.
Video 2
Dye visualization of fluid boundary layer (FBL) dynamics during rest (inter-contraction time), when it remains stable, and during a spontaneous contraction, when much of the FBL is shed.
Video 3
Particle image velocimetry to quantify fluid boundary layer dynamics during rest (inter-contraction time) and spontaneous contractions.
Video 4
Hydra’s tentacles during a full-body contraction colonized with fluorescent Curvibacter sp. AEP1.3 (white signal on the surface).
Video 5
Hydra’s body column during a full-body contraction colonized with fluorescent Curvibacter sp. AEP1.3 (white signal on the surface).
Tables
Table 1
Random variables.
The number of contraction events in a time period follows a Poisson distribution, and the inter-contraction times follow an exponential distribution. Combining this stochastic description of contraction events and inter-contraction times with physics-based models of chemical uptake over the interval , we arrive at a stochastic model of incremental uptake over each inter-contraction period and cumulative uptake over the interval . The p.d.f., mean (expectation) and standard deviation (stdev =square root of the variance) of the input and output random variables are listed here.
| Prob. dist. function | Mean | Stdev | |
|---|---|---|---|
| Contraction events | Poisson: | ||
| Inter-contraction time | Exponential: | ||
| Incremental uptake | |||
| Cumulative uptake |
Additional files
Download links
A two-part list of links to download the article, or parts of the article, in various formats.
Downloads (link to download the article as PDF)
Open citations (links to open the citations from this article in various online reference manager services)
Cite this article (links to download the citations from this article in formats compatible with various reference manager tools)
Spontaneous body wall contractions stabilize the fluid microenvironment that shapes host–microbe associations
eLife 12:e83637.
https://doi.org/10.7554/eLife.83637


