Development and evaluation of a live birth prediction model for evaluating human blastocysts from a retrospective study
- Department of Mechanical Engineering, University of Toronto, Canada
- School of Science and Engineering, The Chinese University of Hong Kong-Shenzhen, China
- Institute of Reproductive and Stem Cell Engineering, School of Basic Medical Science, Central South University, China
- Reproductive and Genetic Hospital of CITIC-Xiangya, China
- Department of Electrical and Computer Engineering, Canada
- Key Laboratory of Reproductive and Stem Cell Engineering, National Health and Family Planning Commission, China
- National Engineering Research Center of Human Stem Cells, China
- Institute of Biomedical Engineering, University of Toronto, Canada
- Department of Computer Science, University of Toronto, Canada
Figures
Figure 1
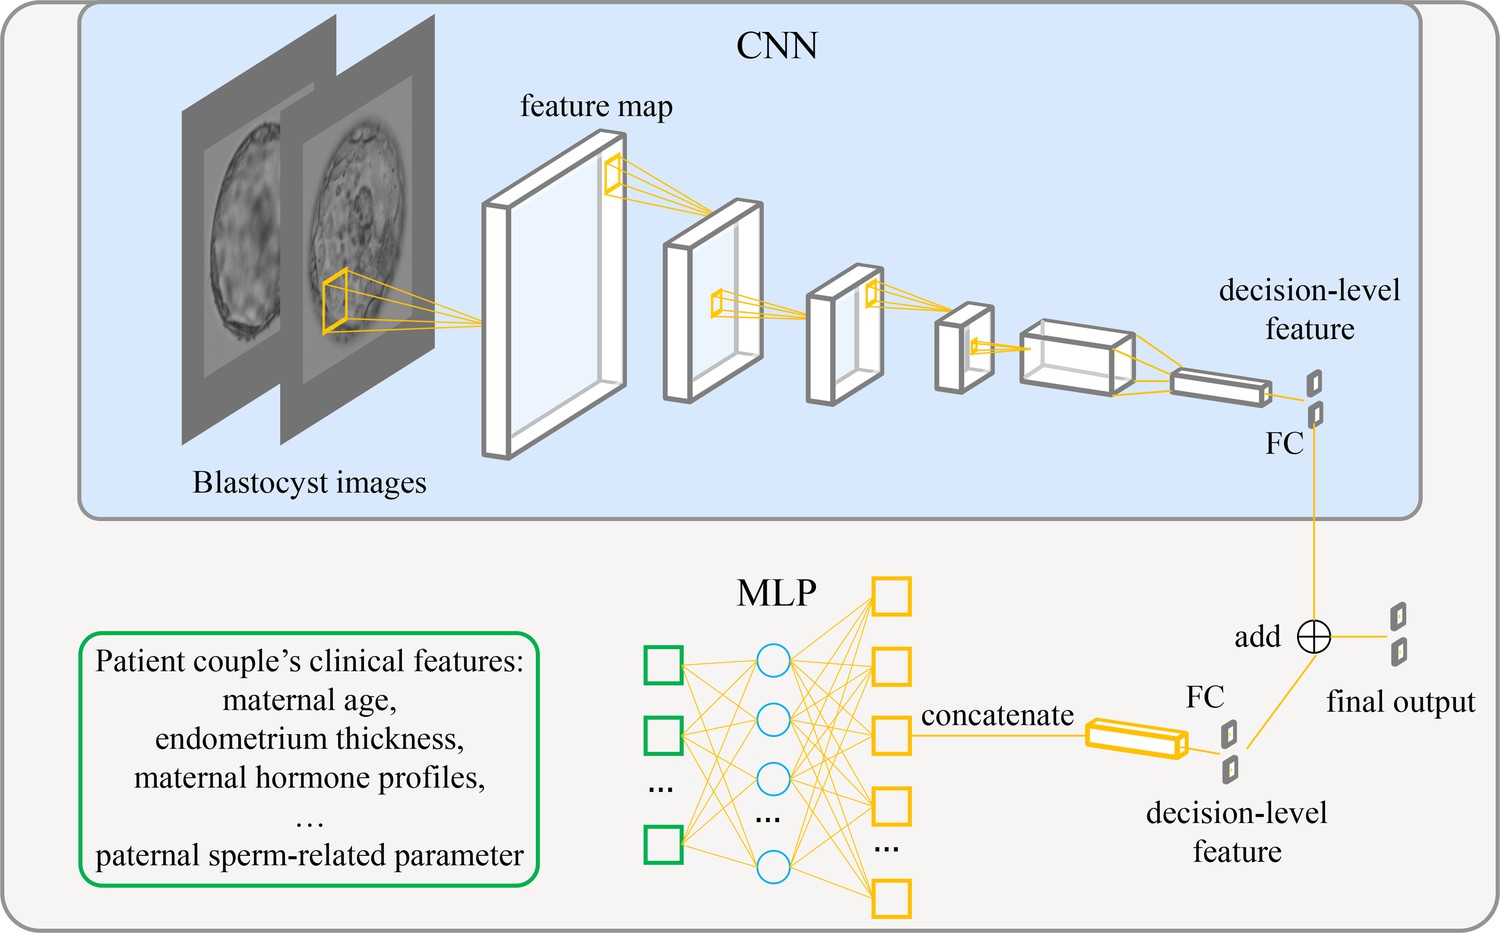
Architecture of the live birth prediction model based on multimodal blastocyst evaluation.
CNN, convolutional neural network; FC, fully connected layer; MLP, multilayer perceptron.
-
Figure 1—source data 1
Source code to reproduce the model.
- https://cdn.elifesciences.org/articles/83662/elife-83662-fig1-data1-v2.zip
Figure 2
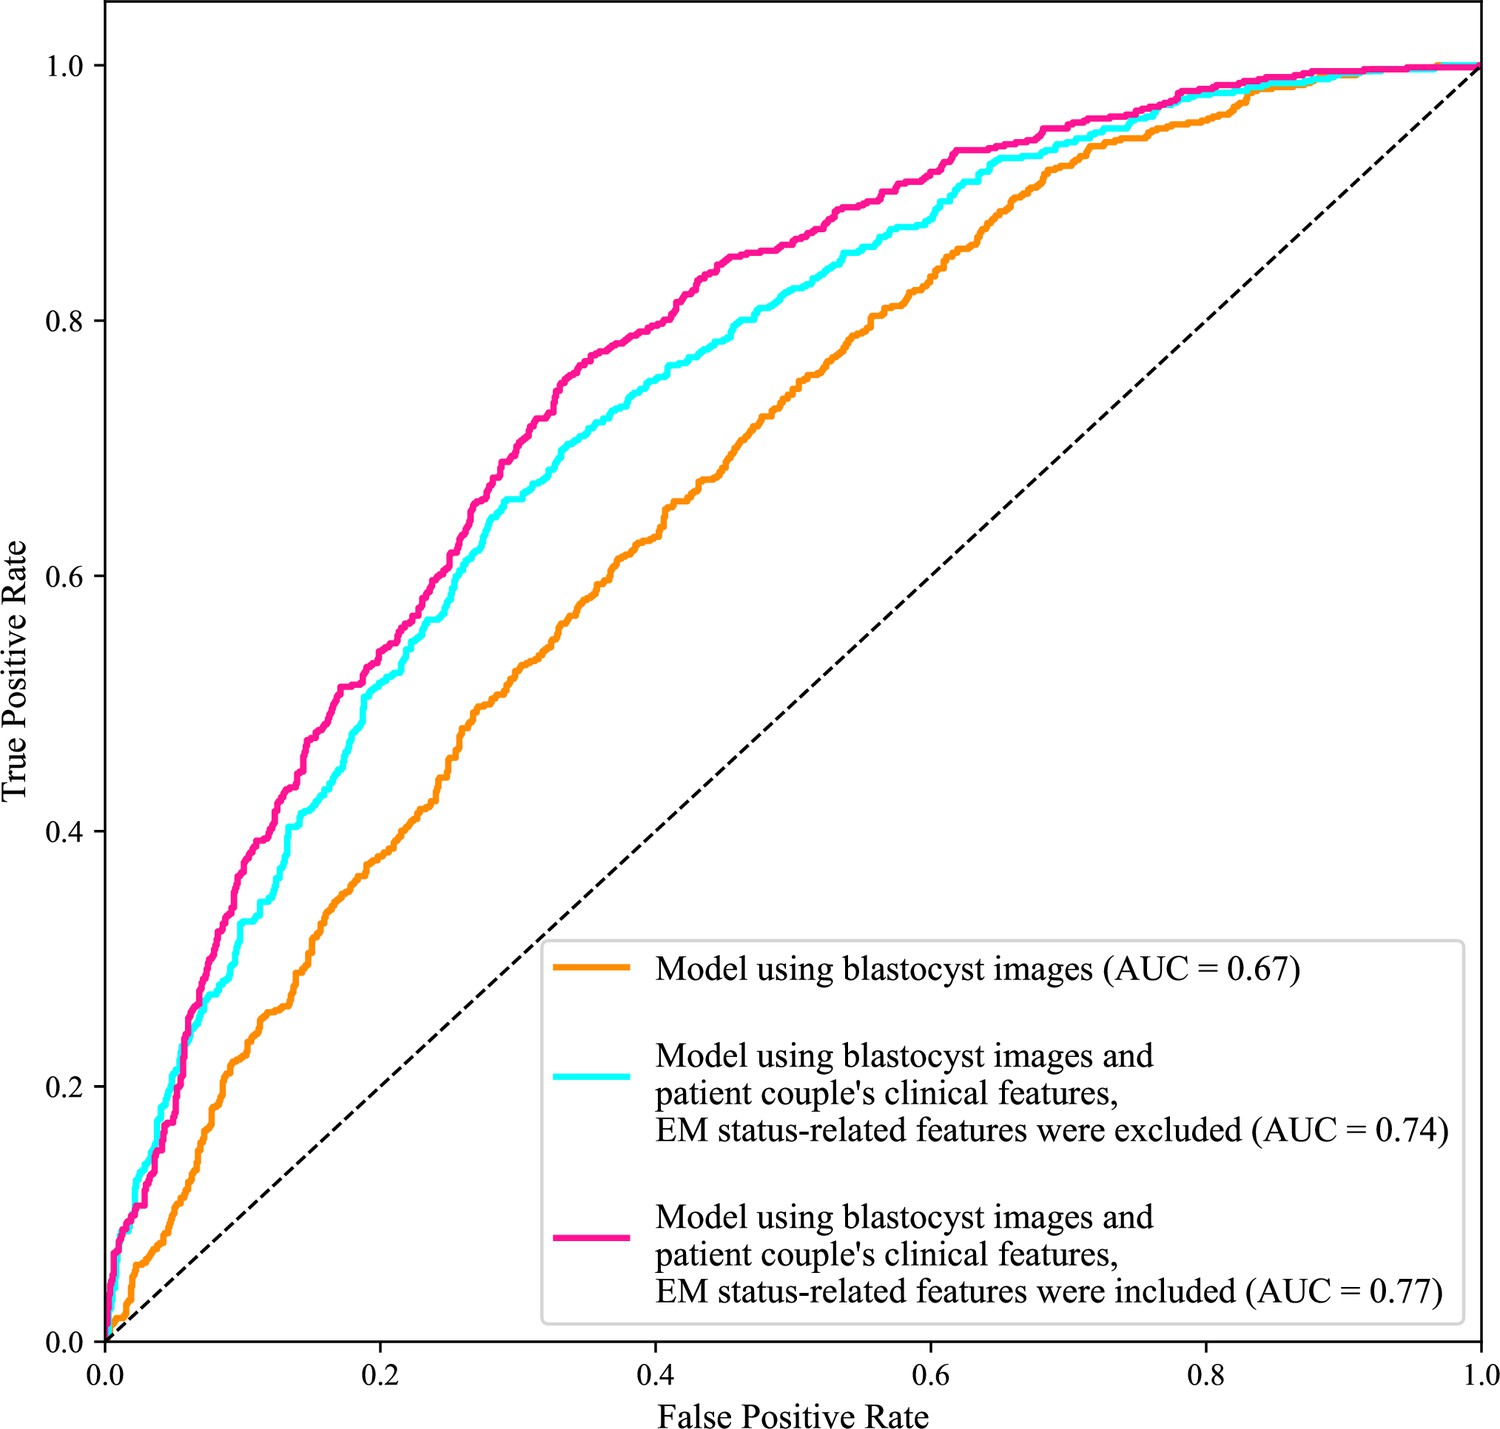
Receiver operating characteristic (ROC) analysis.
ROC curves of the model using only blastocyst images, the model using blastocyst images and patient couple’s clinical features where EM-status related features were excluded, and the model using blastocyst images and patient couple’s clinical features where EM-status related features were included to predict live birth outcomes of 1758 blastocysts in the test data set. AUC, area under the ROC curve; EM, endometrium; EM status-related features, endometrium thickness before transfer, endometrium thickness on HCG day, endometrium pattern B (yes/no) on HCG day.
-
Figure 2—source data 1
Code and data used to generate the ROC curves.
- https://cdn.elifesciences.org/articles/83662/elife-83662-fig2-data1-v2.zip
Figure 3 with 2 supplements
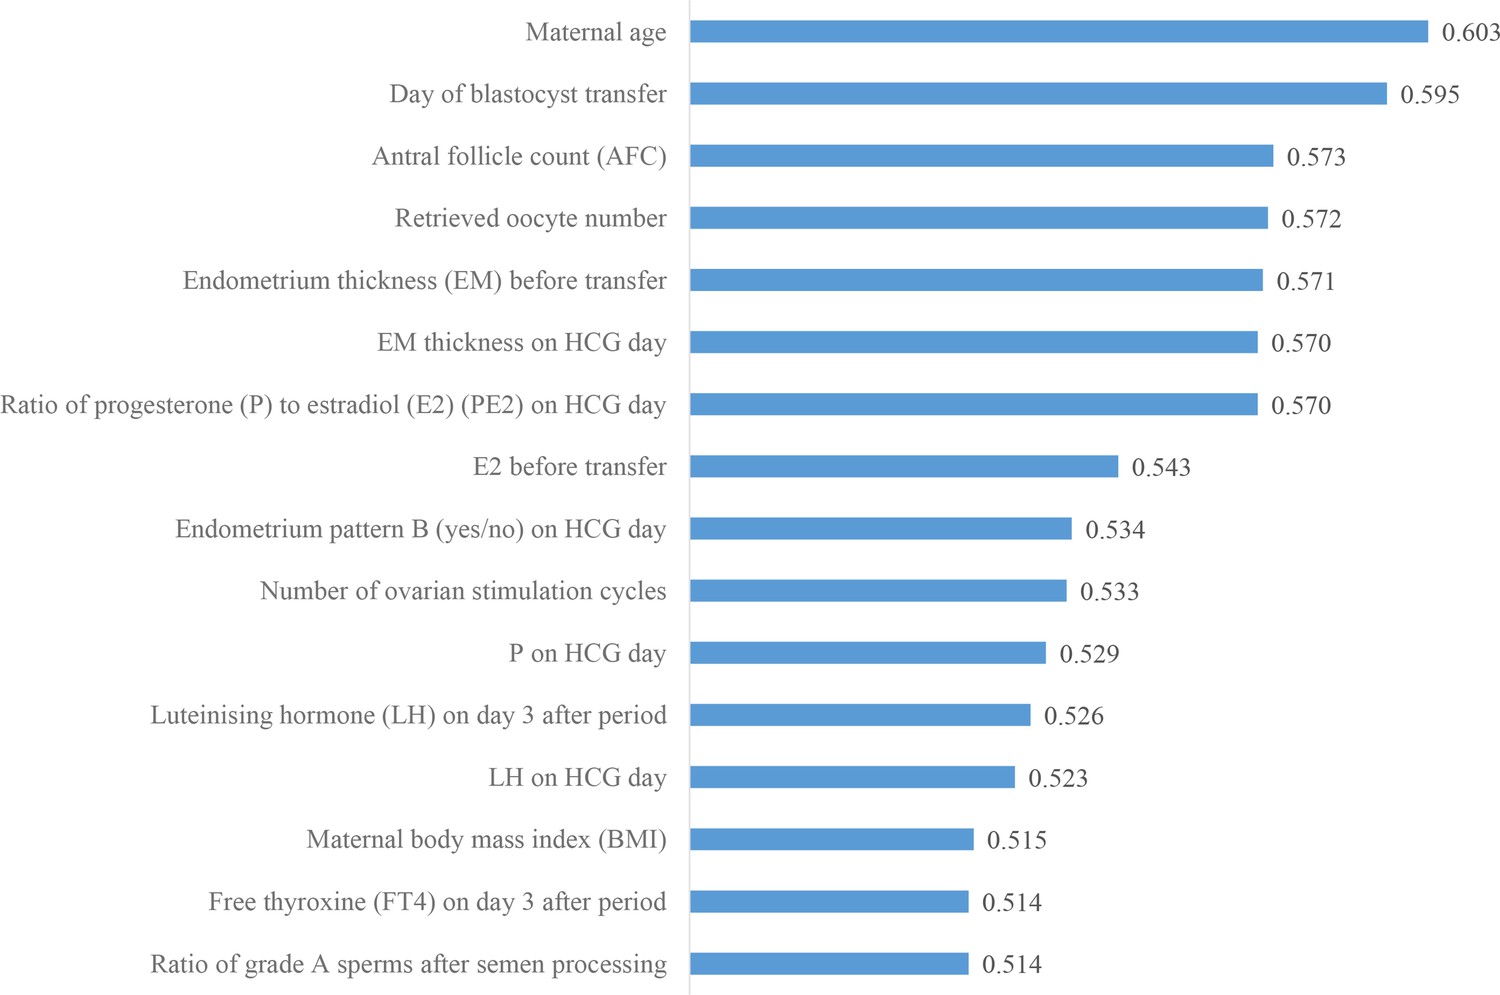
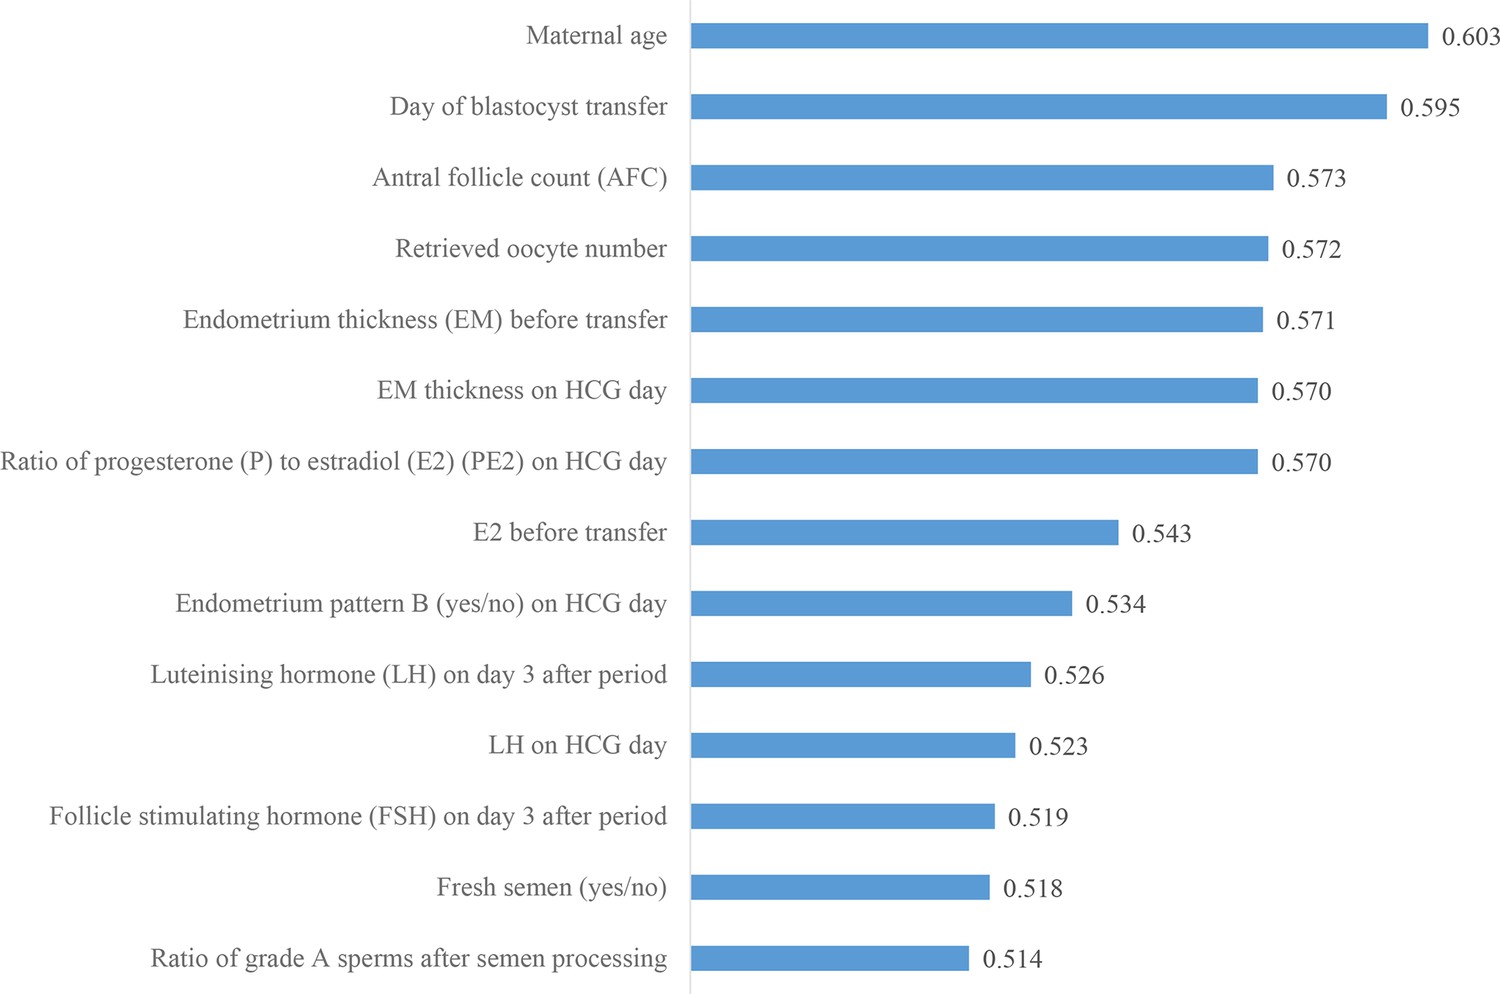
Ranking the predictive power of patient couple’s clinical features.
The 16 patient couple’s clinical features that were identified to be most related to the live birth outcomes of the blastocysts ranked by the AUC for individually predicting live birth outcome. AUC, area under the curve.
-
Figure 3—source data 1
Code and data used to generate the AUC ranking chart.
- https://cdn.elifesciences.org/articles/83662/elife-83662-fig3-data1-v2.zip
Figure 3—figure supplement 1
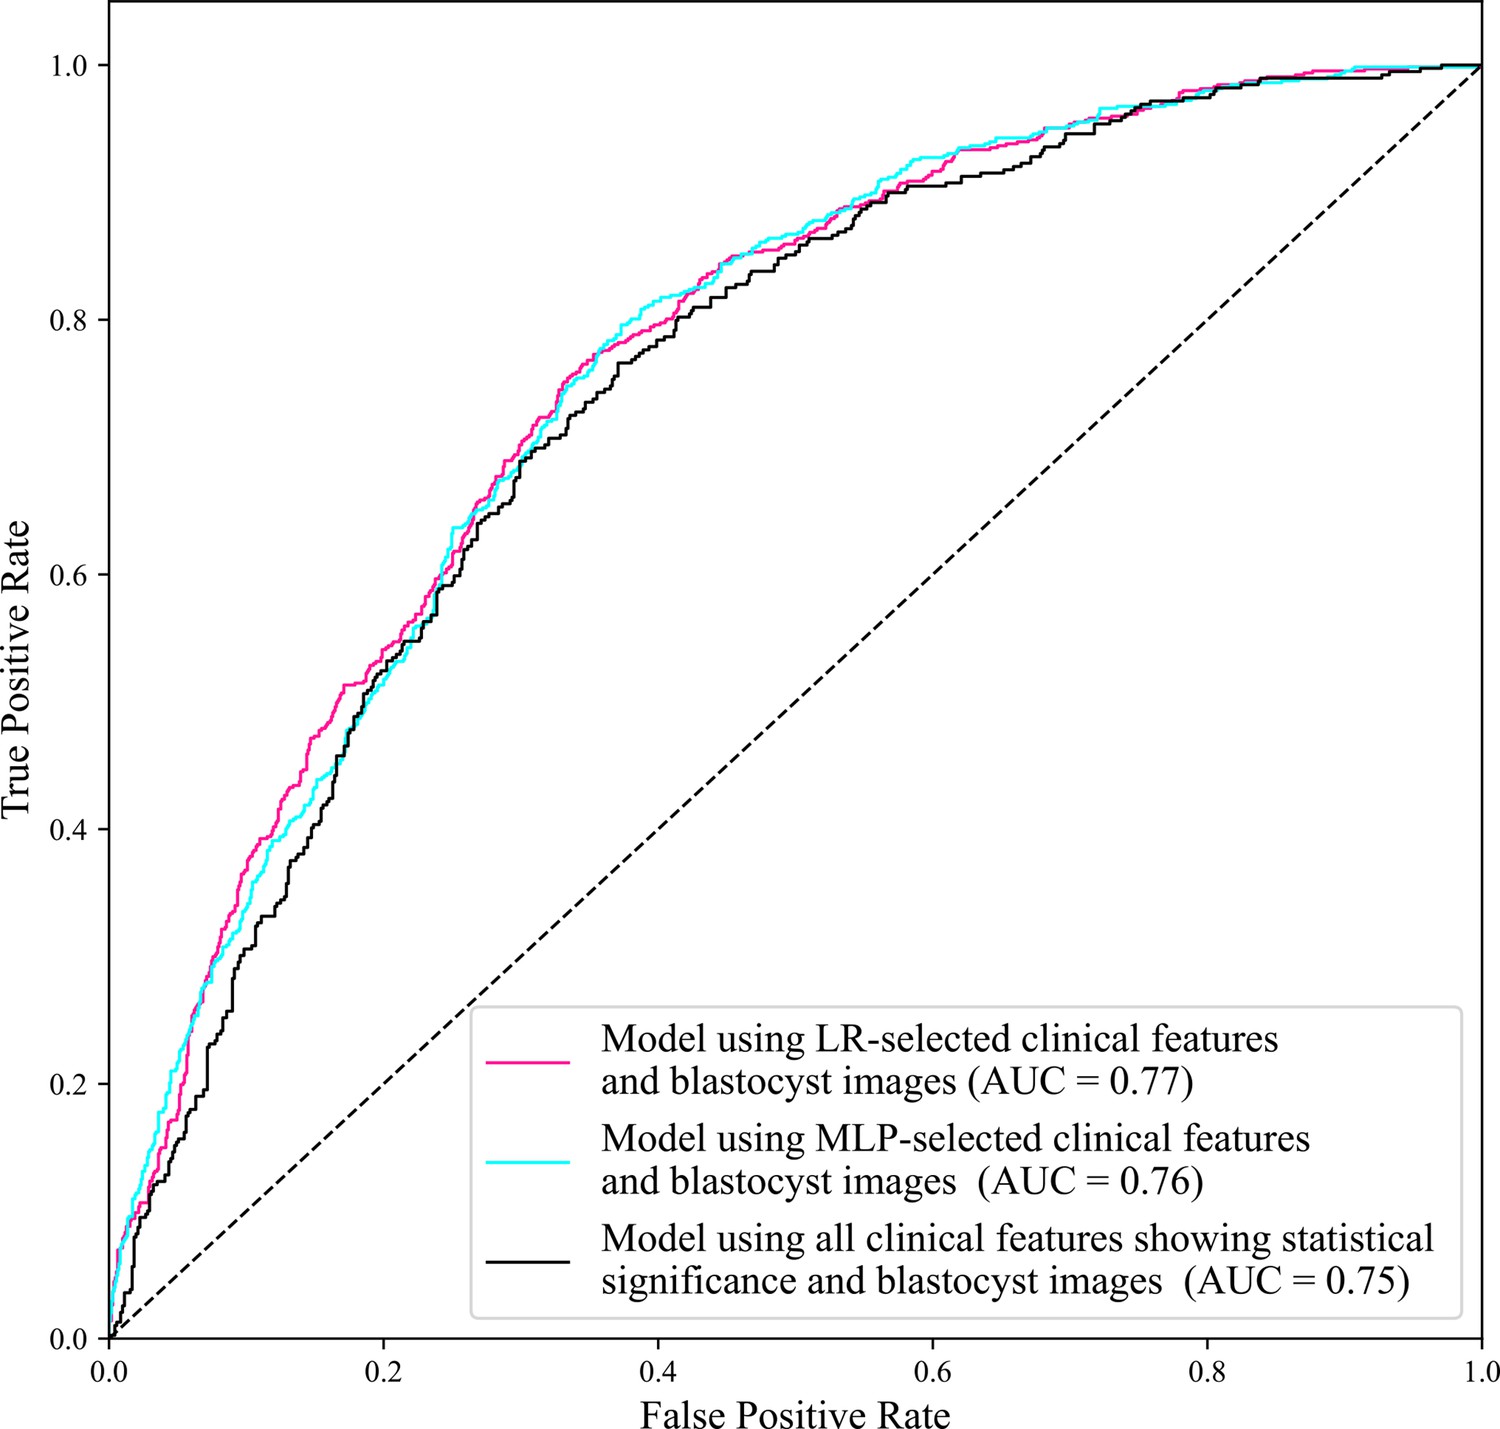
ROC curves of the model using LR-selected clinical features and blastocyst images, the model using MLP-selected clinical features and blastocyst images, and the model using all clinical features showing statistical significance and blastocyst images.
The AUC of the model using all clinical features showing statistical significance and blastocyst images is 0.75, lower than the AUC (0.77) achieved by the model using LR-selected clinical features and blastocyst images, and the AUC (0.76) achieved by the model using MLP-selected clinical features and blastocyst images. The AUC (0.77) achieved by the model using LR-selected clinical features and blastocyst images and the AUC (0.76) achieved by the model using MLP-selected clinical features and blastocyst images show no significant difference (p value=0.95>0.05). AUC, area under the curve; LR, logistic regression; MLP, multilayer perceptron; ROC, receiver operating characteristic.
Figure 3—figure supplement 2
Ranking the predictive power of multilayer perceptron (MLP)-selected patient couple’s clinical features.
The MLP-based feature selection method selected 14 clinical features. Compared with the 16 clinical features selected by LR, 12 of the 16 clinical features were selected by both MLP and LR, and the top nine features are the same. The two clinical features selected by MLP but not by LR include fresh semen (yes/no) and follicle-stimulating hormone (FSH) on day 3 after period. The four clinical features selected by LR but not MLP include number of ovarian stimulation cycles, progesterone (P) on HCG day, maternal body mass index, and free thyroxine (FT4) on day 3 after period. LR: logistic regression.
Figure 4 with 1 supplement
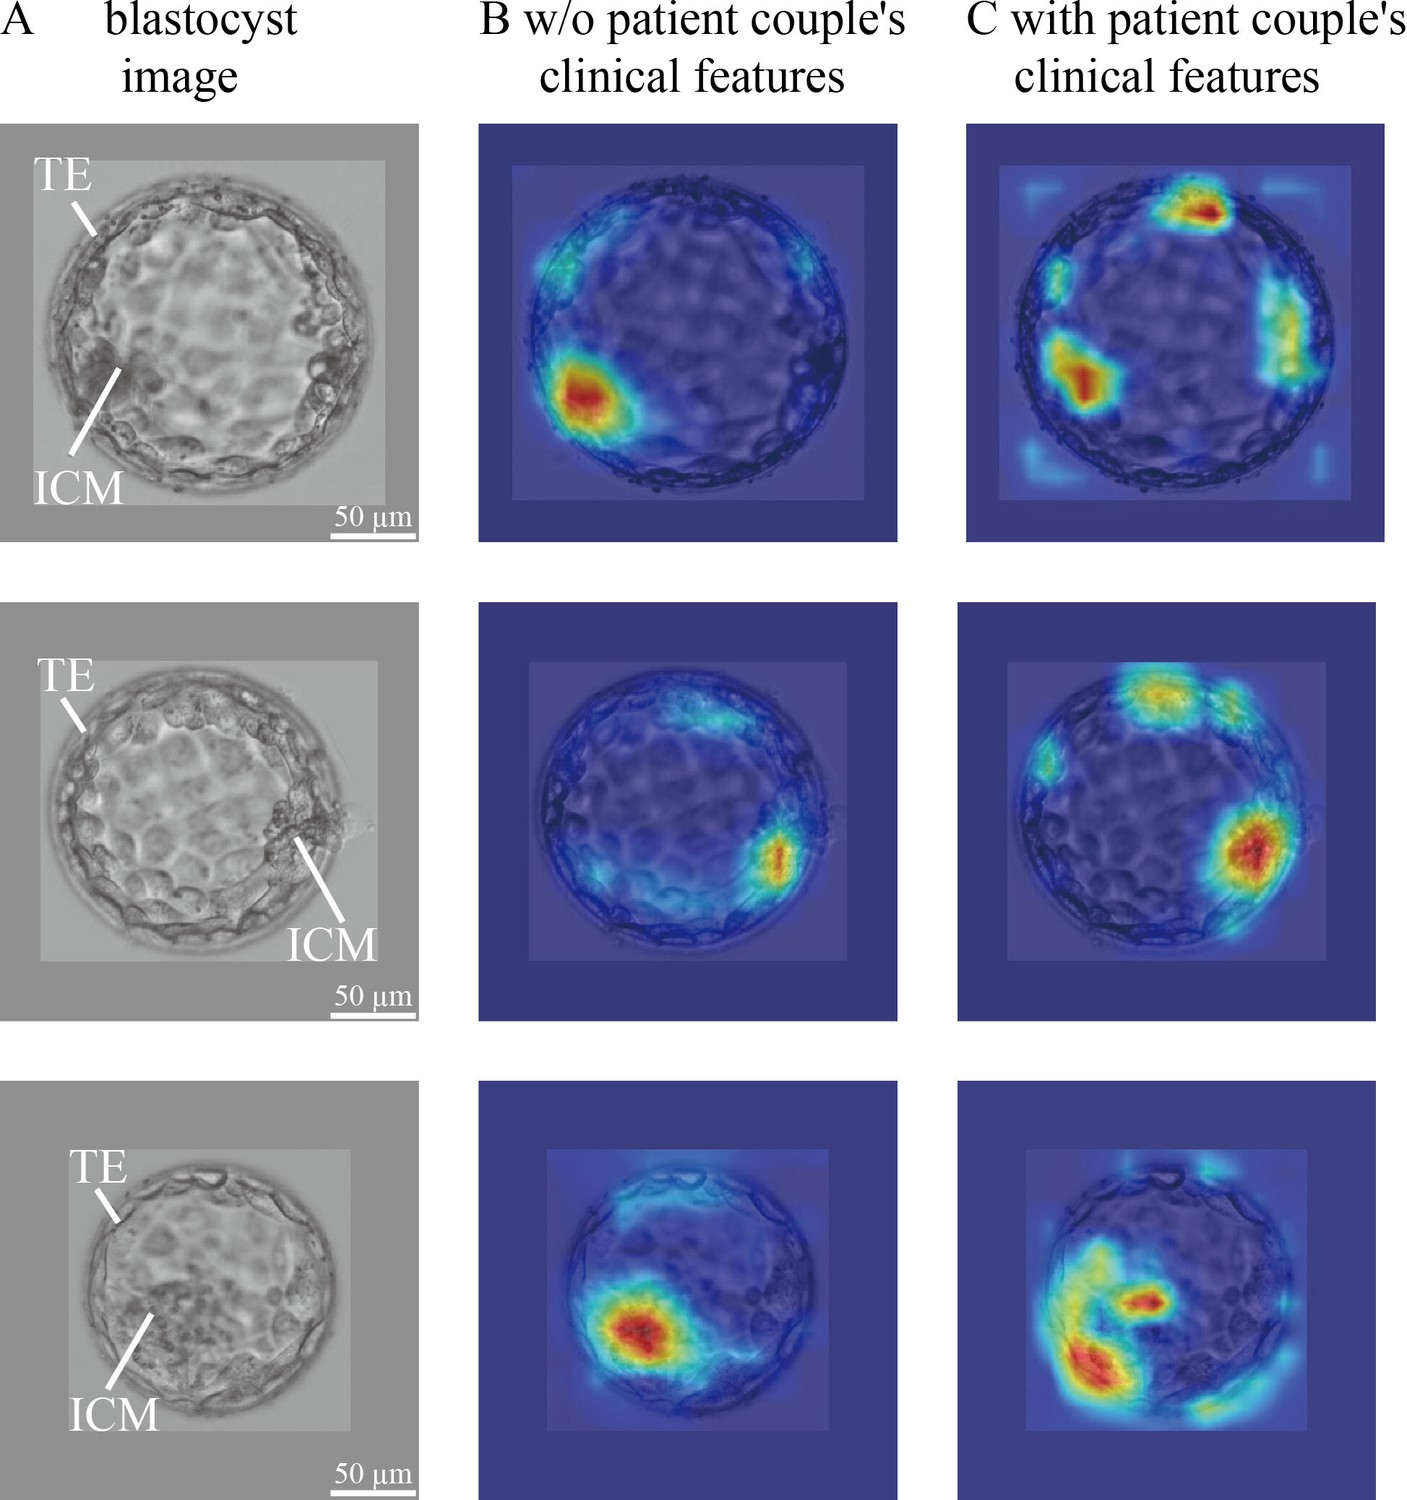
CNN heatmaps analysis.
Heatmaps of the CNN trained without and with patient couple’s clinical features. Column (A): original blastocyst images. Column (B): corresponding heatmaps of the CNN trained without including patient couple’s clinical features. Column (C): corresponding heatmaps of the CNN trained with the inclusion of patient couple’s clinical features. CNN, convolutional neural network.
-
Figure 4—source data 1
Code and data used to generate the heatmaps shown in Figure 4.
- https://cdn.elifesciences.org/articles/83662/elife-83662-fig4-data1-v2.zip
Figure 4—figure supplement 1
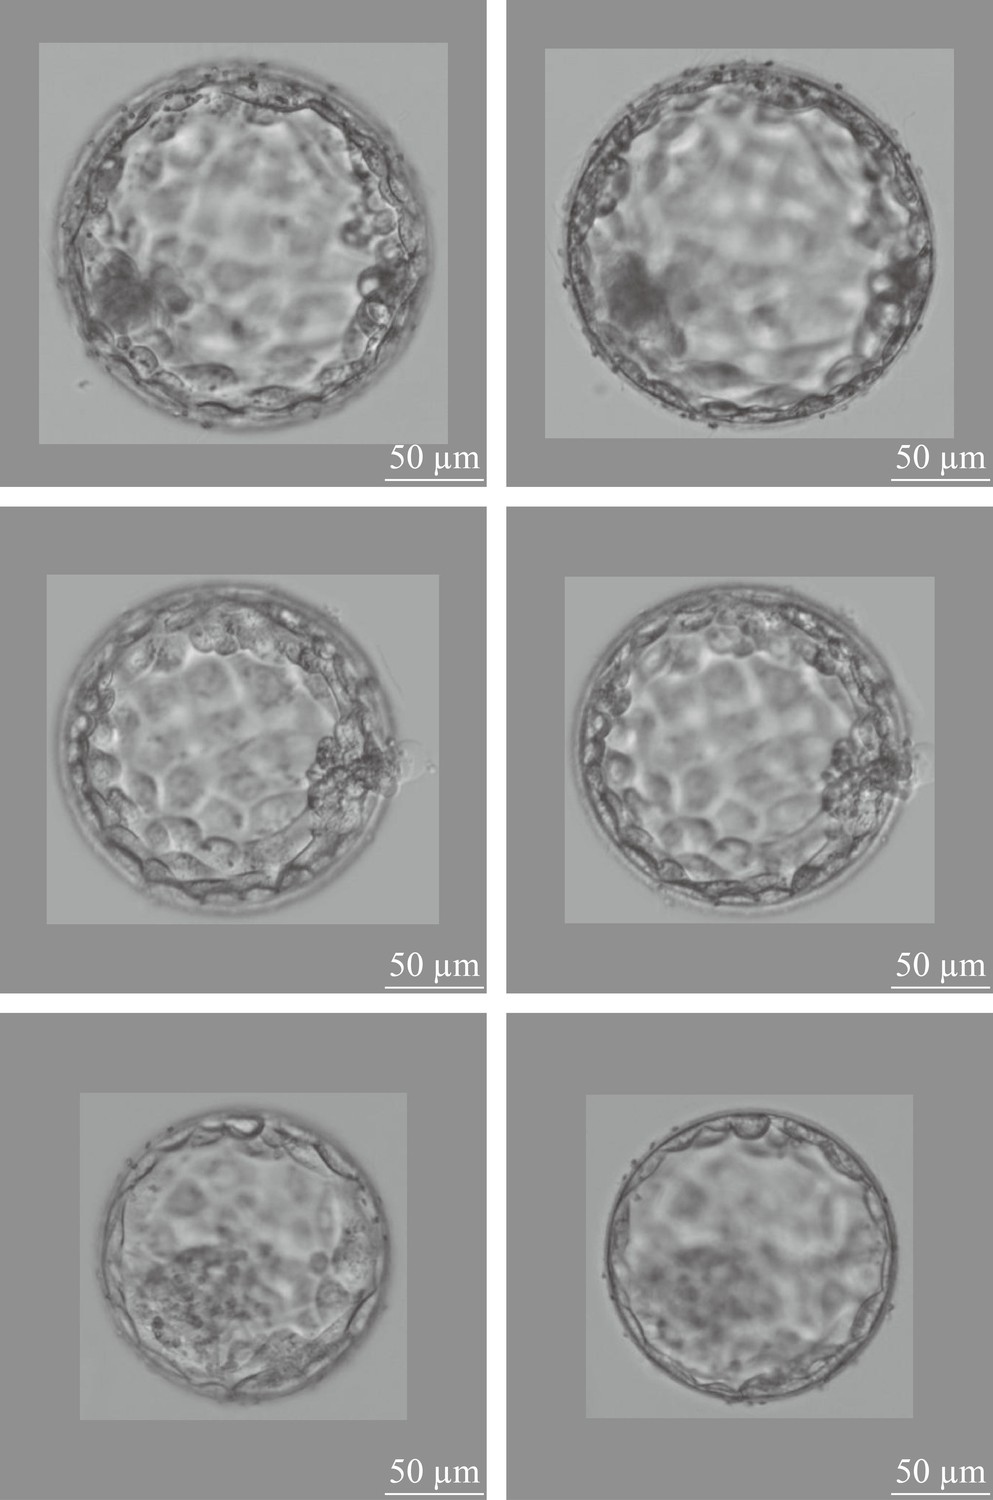
Two-channel blastocyst images, one channel focusing on the ICM, the other channel focusing on the TE of a same blastocyst.
ICM, inner cell mass; TE, trophectoderm.
-
Figure 4—figure supplement 1—source code 1
Code for Figure 4—figure supplement 1.
- https://cdn.elifesciences.org/articles/83662/elife-83662-fig4-figsupp1-code1-v2.zip
Additional files
-
MDAR checklist
- https://cdn.elifesciences.org/articles/83662/elife-83662-mdarchecklist1-v2.pdf
-
Supplementary file 1
P value analysis result of 103 patient couple's clinical features.
- https://cdn.elifesciences.org/articles/83662/elife-83662-supp1-v2.docx
Download links
A two-part list of links to download the article, or parts of the article, in various formats.
Downloads (link to download the article as PDF)
Open citations (links to open the citations from this article in various online reference manager services)
Cite this article (links to download the citations from this article in formats compatible with various reference manager tools)
Development and evaluation of a live birth prediction model for evaluating human blastocysts from a retrospective study
eLife 12:e83662.
https://doi.org/10.7554/eLife.83662


