Experience-dependent flexibility in a molecularly diverse central-to-peripheral auditory feedback system
- Department of Neurobiology, Harvard Medical School, United States
- Section on Neuronal Circuitry, National Institute on Deafness and Other Communication Disorders, United States
Figures
Figure 1 with 2 supplements
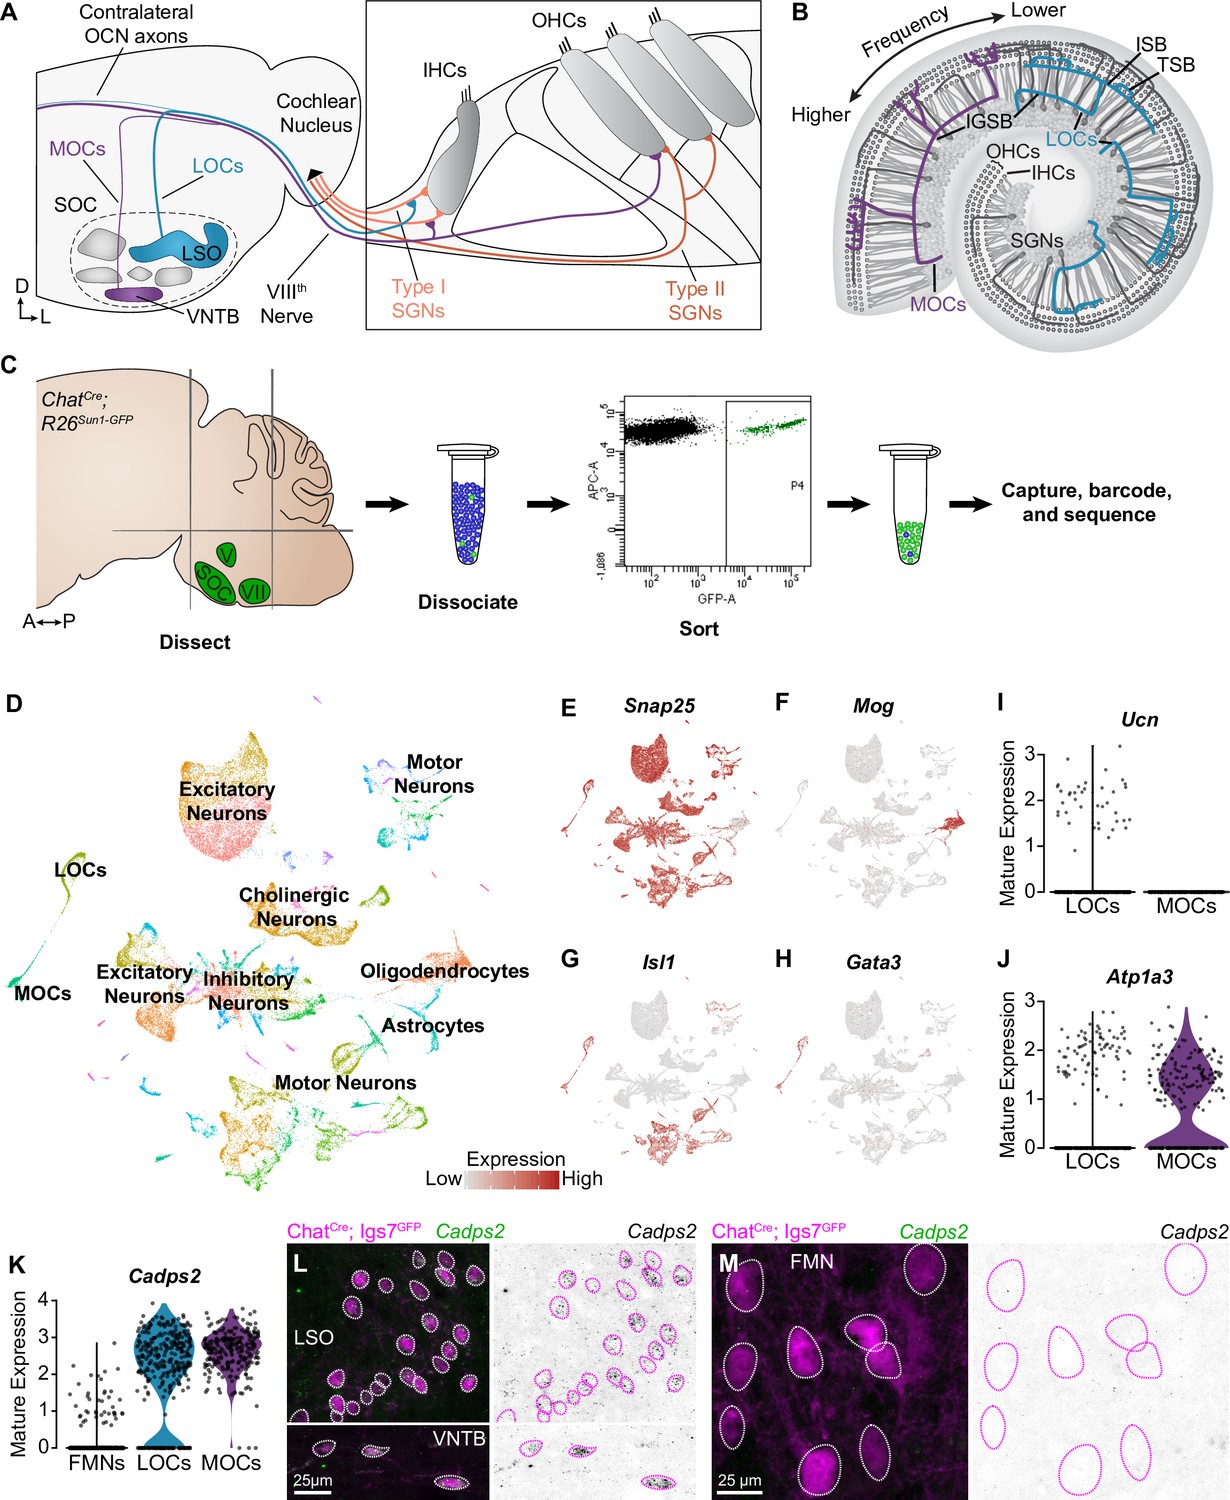
Identification of OCNs by single-nucleus sequencing of brainstem neurons.
(A, B) Schematic of medial (MOC) and lateral (LOC) olivocochlear neuron (OCN) subtypes housed in the brainstem (A) and their projections into the cochlea, shown in cross-section (A) and top-down (B). D, dorsal; L, lateral; LSO, lateral superior olive; VNTB, ventral nucleus of the trapezoid body; SOC, superior olivary complex; IHC, inner hair cell; OHC, outer hair cell; SGN, spiral ganglion neuron; IGSB, intraganglionic spiral bundle; ISB, inner spiral bundle; TSB, tunnel spiral bundle. (C) Schematic of single-nucleus collection protocol. The ventral brainstem of ChatCre; Rosa26Sun1-GFP mice was dissected, including the SOC, facial motor nucleus (VII), and trigeminal motor nucleus (V), followed by collection and sequencing of individual GFP+ nuclei. A, anterior; P, posterior. (D) UMAP plot summarizing sequencing data of 45,828 single nuclei from 61 animals across three ages. The data includes 56 clusters, including MOCs, LOCs, and several different motor neuron types, as well as a few non-neuronal populations. (E–H) Feature plots denoting normalized expression levels of selected genetic markers. For visualization purposes, high expression on the color scale is capped at the 95th percentile of gene expression. The majority of clusters express the neuronal marker Snap25 (E). The main non-neuronal population is labeled by Mog, an oligodendrocyte marker (F). Motor neuron clusters express the motor neuron determinant Isl1 (G). Among these brainstem motor neurons, OCNs are identified by expression of the transcription factor Gata3 (H). (I, J) Differential expression of known markers Ucn (I) and Atp1a3 (J) denotes LOCs and MOCs, respectively. (K–M) Cadps2 is a novel marker for OCNs that is expressed by both MOCs and LOCs but not FMNs. (K) Violin plots summarizing transcriptional expression of Cadps2 in mature LOCs, MOCs, and FMNs. (L, M) Fluorescent in situ hybridization (FISH) verifies that Cadps2 is detected in both MOCs and LOCs (L) but not in FMNs (M). Representative images are shown from a total of three animals of either sex, P28.
Figure 1—figure supplement 1
Quality-control metrics for single-nucleus sequencing data.
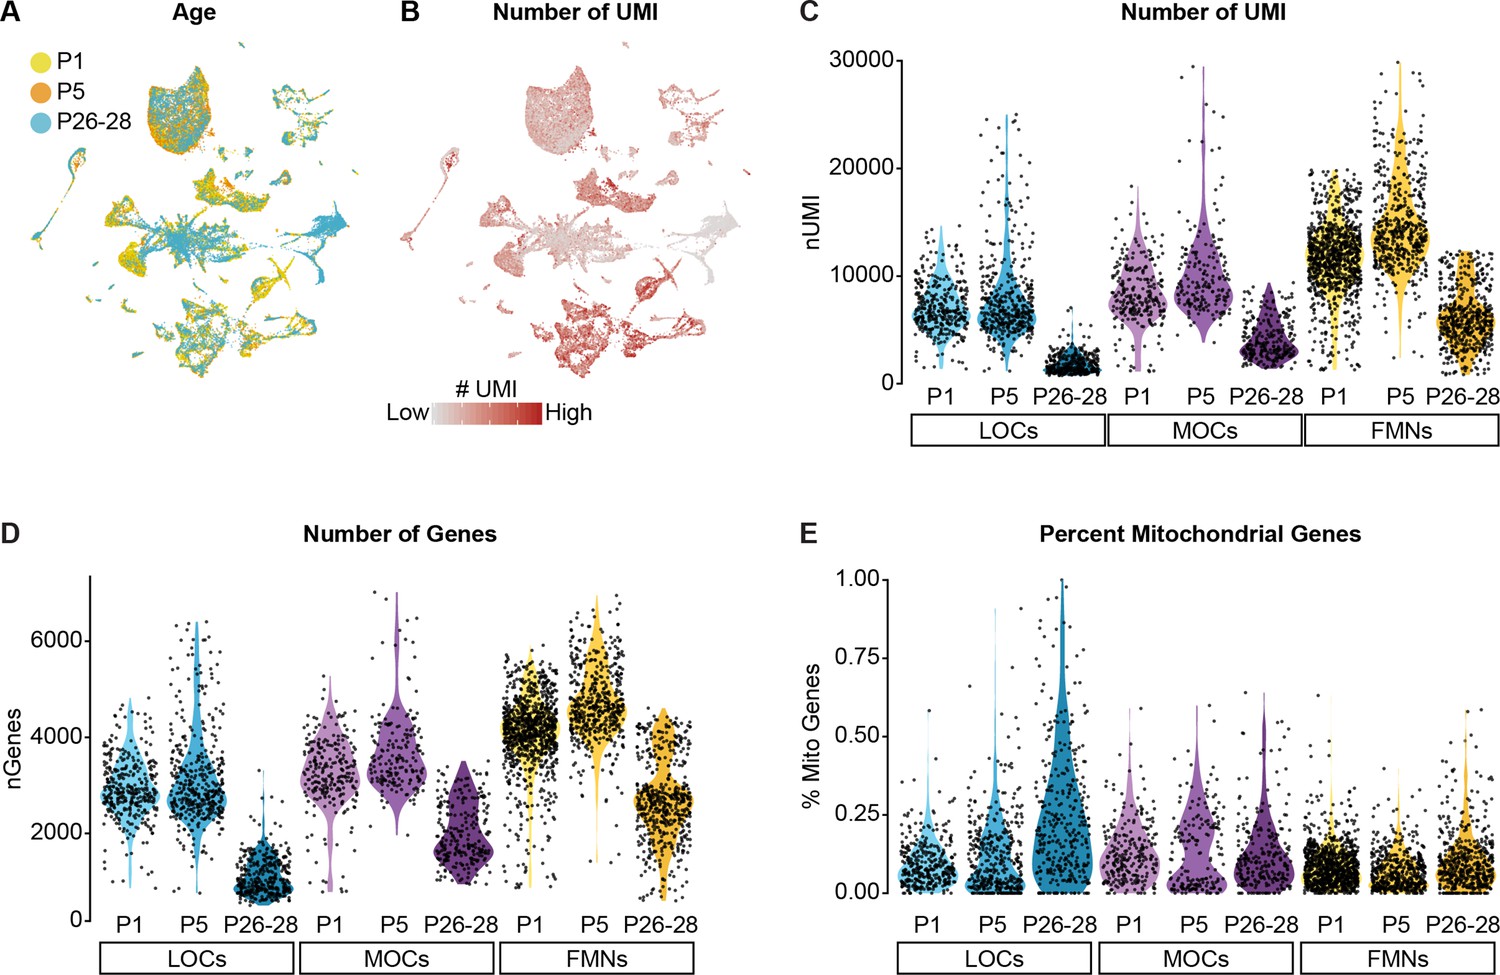
(A) UMAP plot showing contributions from each age collected. Each neuronal cluster includes cells from all three timepoints, indicating that the clusters are not being driven by variability across timepoints or batches. (B) Feature plot detailing the number of unique molecular identifiers (UMI) detected in each cell. Although some cell types vary in their gene expression levels, the architecture of the data overall is not driven primarily by differences in gene expression or read depth. (C–E) Violin plots denoting the number of UMIs (C), number of genes (D), and percentage of mitochondrial genes (E) detected per cell. Cells from P26–P28 animals collected with 10x v2 kits consistently yielded a lower number of genes and UMI detected per cell compared to P1 and P5 datasets collected with 10x v3 kits.
Figure 1—figure supplement 2
OCNs and FMNs are transcriptionally distinct.
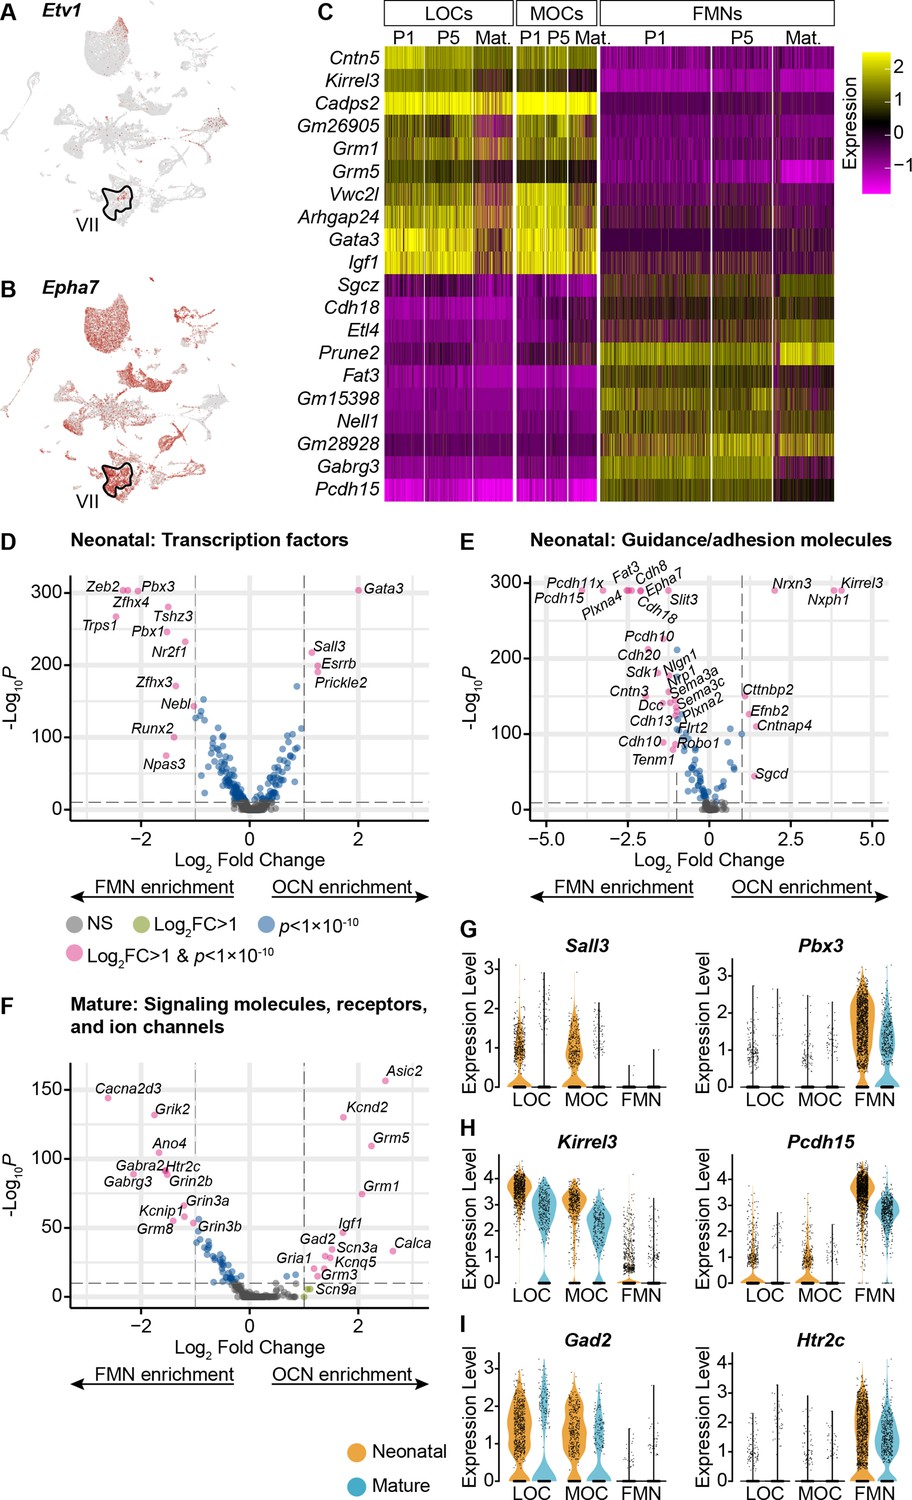
(A) Etv1 is a transcription factor selectively expressed in a subset of FMNs (VII). It is primarily expressed in only one motor neuron cluster. (B) Epha7 was previously identified as a marker for a subset of FMNs. Among the motor neurons in our dataset, it is expressed at high levels in the same cluster as Etv1, implying that cells in that cluster correspond to FMNs. (C) Heatmap denoting the expression of 20 genes with significant differences in expression between OCNs and FMNs at both neonatal and mature timepoints (p<0.05, Wilcoxon rank-sum test, Bonferroni post-hoc correction). For visualization, scaled expression levels were capped at –2.5 and 2.5. (D–F) Volcano plots denoting differential expression of transcription factors (D), guidance and adhesion molecules (E), and neuronal signaling components (F) between OCNs and FMNs at P1–P5. Wilcoxon rank-sum test, Bonferroni post-hoc correction. (G–I) Violin plots denoting differentially expressed transcription factors (G), adhesion molecules (H), or signaling components (I) between OCNs and FMNs at neonatal (P1 and P5, orange) and mature (P26–28, blue) ages.
Figure 2 with 1 supplement
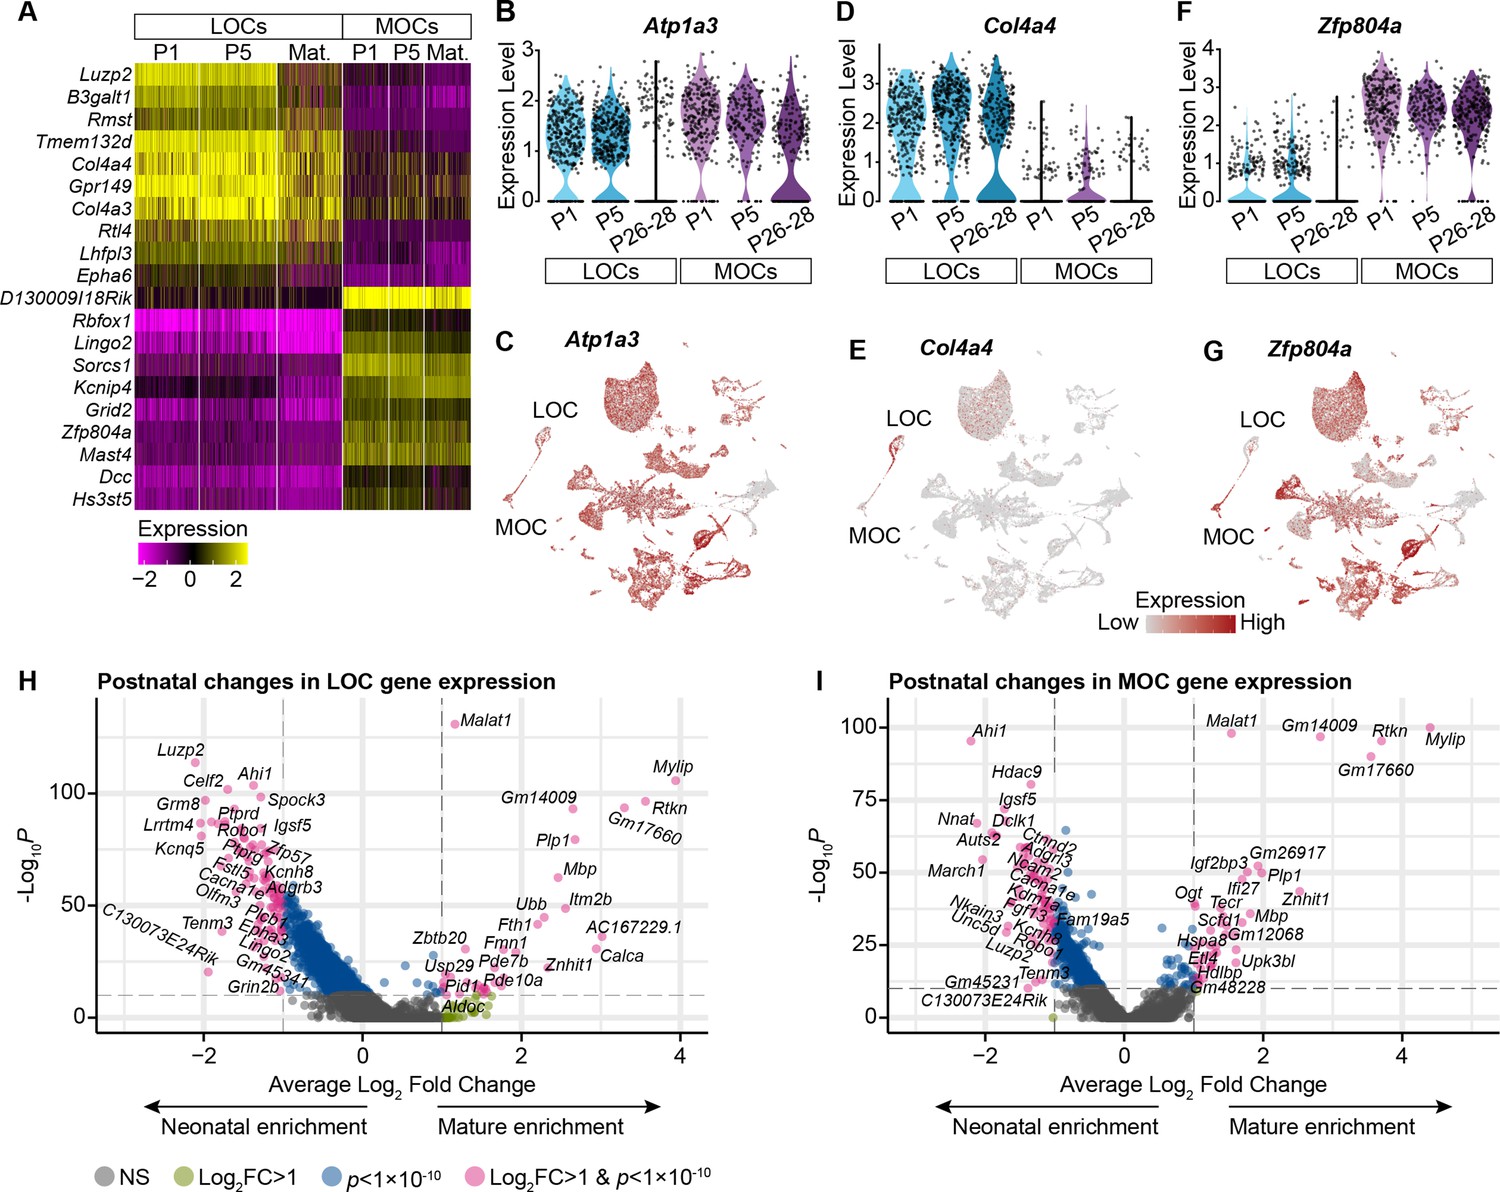
MOCs and LOCs exhibit distinct gene-expression profiles.
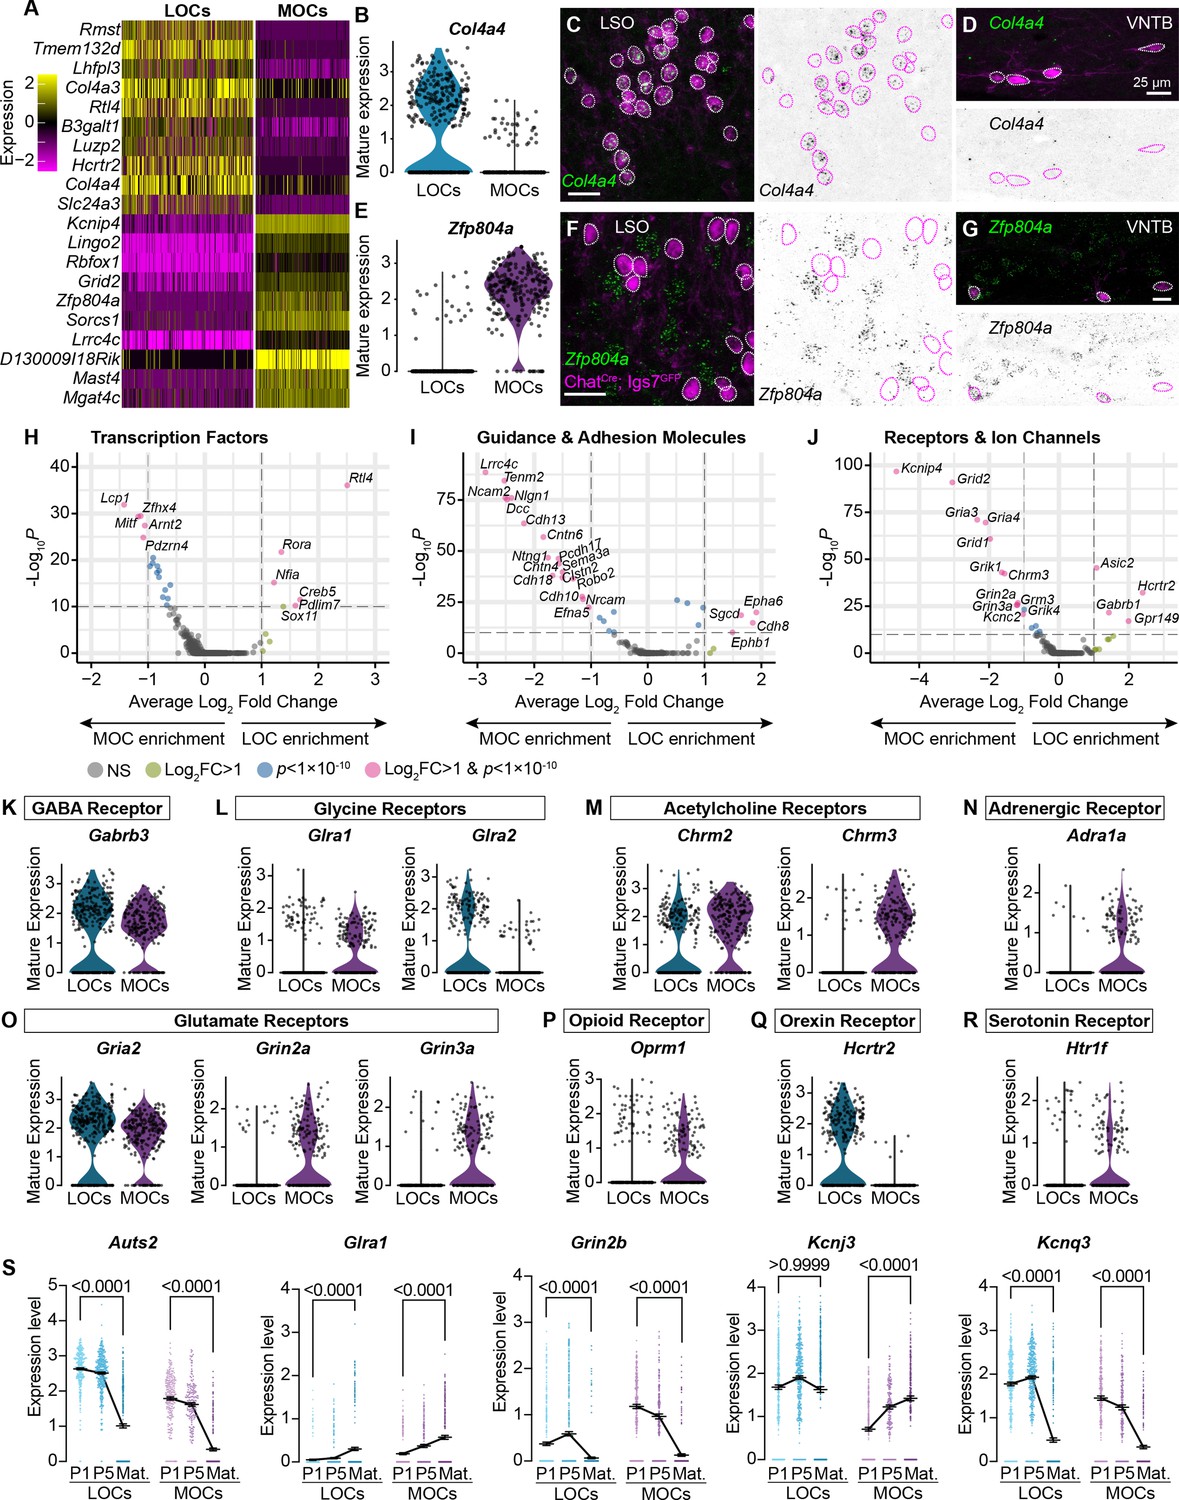
(A) Heatmap summarizing expression of the 10 genes with the highest average log-fold change for LOCs and MOCs. For visualization purposes, scaled expression levels were capped at –2.5 and 2.5. (B–G) Fluorescent in situ hybridization in ChatCre; Igs7GFP animals (C, D, F, G) validates novel markers with enriched expression in sequencing data from LOCs or MOCs, shown in violin plots (B, E). The LOC-enriched gene Col4a4 (green) is expressed by GFP+, cholinergic neurons (magenta) in the LSO (C) but not in the VNTB (D), shown also as inverted images with magenta circles around each cholinergic neuron. In contrast, the MOC-enriched gene Zfp804a is expressed in MOCs (G) but is absent from LOCs (F). Representative images are shown from three animals of either sex, P28. (H–J) Volcano plots indicating differentially expressed genes between mature MOCs and LOCs that encode transcription factors (H), guidance and adhesion molecules (I), and receptors and ion channels (J). Gene names are listed for all genes with an average log2-fold change greater than 1 and adjusted p<1 × 10⁻¹⁰ (dashed lines; Wilcoxon rank-sum test, Bonferroni post-hoc correction). (K–P) Violin plots denoting normalized expression levels of genes for neurotransmitter receptor subunits. Both MOCs and LOCs generate transcripts corresponding to receptors for numerous neurotransmitters, including GABA (K), Glycine (L), acetylcholine (M), and glutamate (O). In several cases, however, MOCs and LOCs express genes for different subunits or classes of receptors (L, M, O). MOCs and LOCs also differ in their expression of genes that encode more specialized receptors, including the adrenergic receptor Adra1 (N), mu opioid receptor Oprm1 (P), orexin receptor Hcrtr2 (Q), and serotonin receptor Htr1f (R). (S) Log-normalized counts of transcripts for the autism-related transcription factor Auts2 and several neurotransmitter receptor and ion channel genes whose expression changes across postnatal development (Glra1, Grin2b, Kcnj3, and Kcnq3). Kruskal-Wallace with Dunn’s test for multiple comparisons. Error bars, mean ± SEM.
Figure 2—figure supplement 1
OCN markers across postnatal development.
(A) Selected genes with significantly different expression between MOCs and LOCs across postnatal development. (p<0.05, Wilcoxon rank-sum test, Bonferroni post-hoc correction). For visualization purposes, scaled expression levels were capped at –2.5 and 2.5. (B, C) Atp1a3 has been used as an MOC-specific marker in adult mice, but Atp1a3 transcripts are broadly expressed in neonatal animals, including neonatal LOCs. (D, E) Col4a4 is enriched in LOCs across postnatal development. (F, G) Zfp804a is expressed in multiple motor neuron subtypes, but in OCNs is preferentially expressed in MOCs at all postnatal timepoints. (H, I) Volcano plots denoting gene-expression changes between neonatal (P1–P5) and mature (P26–P28) LOCs (H) and MOCs (I).
Figure 3 with 1 supplement
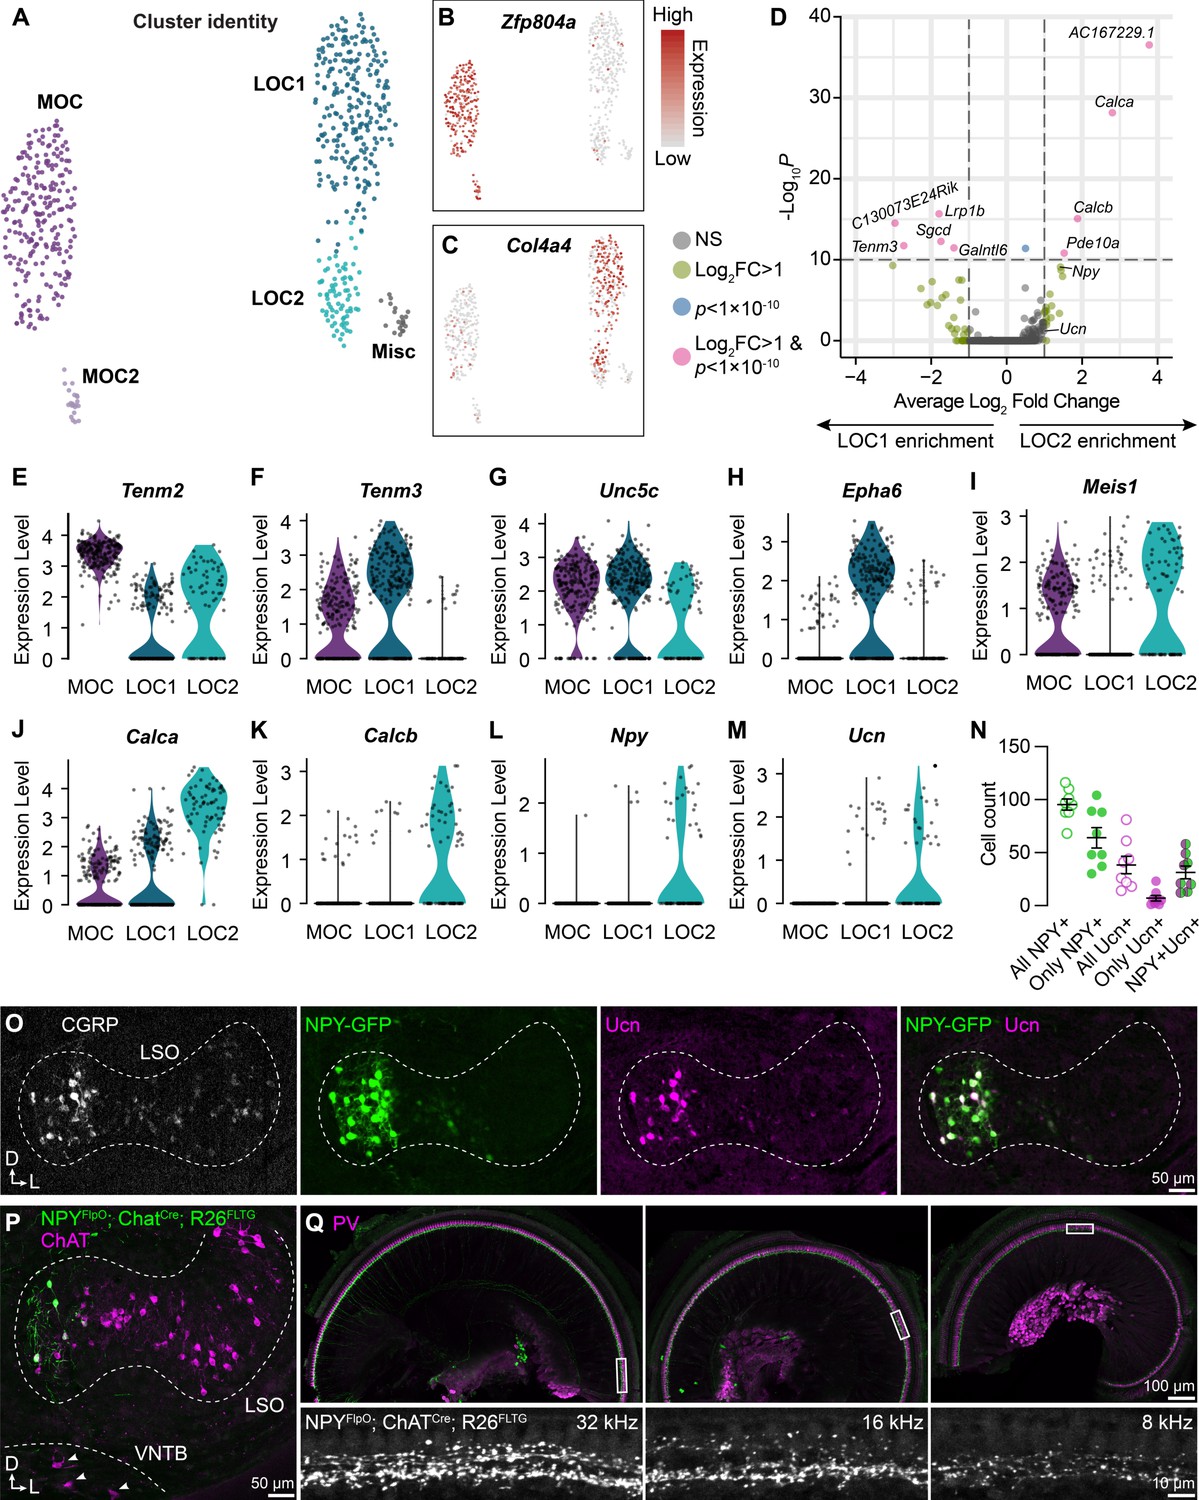
LOC neurons include a peptide-enriched subset.
(A–C) UMAPs summarizing sub-clustering results of 590 OCNs from 32 ChatCre; Rosa26Sun1-GFP animals (P26–P28). OCNs sub-cluster into five different groups (A). Feature plots denote normalized expression levels of the MOC marker Zfp804a (B) and the LOC marker Col4a4 (C). For visualization, the upper level of expression was capped at the 95th percentile. (D) Volcano plot summarizing differences in gene expression between LOC1 and LOC2 clusters. Wilcoxon rank-sum test, Bonferroni post-hoc correction. (E–M) Violin plots illustrating expression of genes encoding adhesion molecules (E–H), transcription factors (I), and neuropeptides (J–M) that differ among OCN subtypes. (N, O) Representative images (O) and quantification (N) of CGRP and Ucn antibody stains on Npy-GFP tissue showing biased expression in the medial arm of the LSO. n=4 animals of either sex, P28–P32. Error bars, mean ± SEM. (P) Representative image of ChAT antibody stain on NpyFlpO; ChatCre; Rosa26FLTG tissue illustrating intersectional genetic labeling of NPY-enriched LOCs in the medial arm of the LSO. MOCs in the VNTB (arrowheads) are never labeled in this mouse line. n=4 animals of either sex, P28–P32. (Q) Top-down view of a representative ChatCre; NpyFlpO; Rosa26FLTG cochlea (left to right: base, mid, apex) that was stained for parvalbumin (PV, magenta) to label HCs and SGNs. Insets below each panel show genetically labeled NPY+ LOCs in the ISB beneath the IHCs at three different frequency regions. n=10 animals of either sex, P28–P32.
Figure 3—figure supplement 1
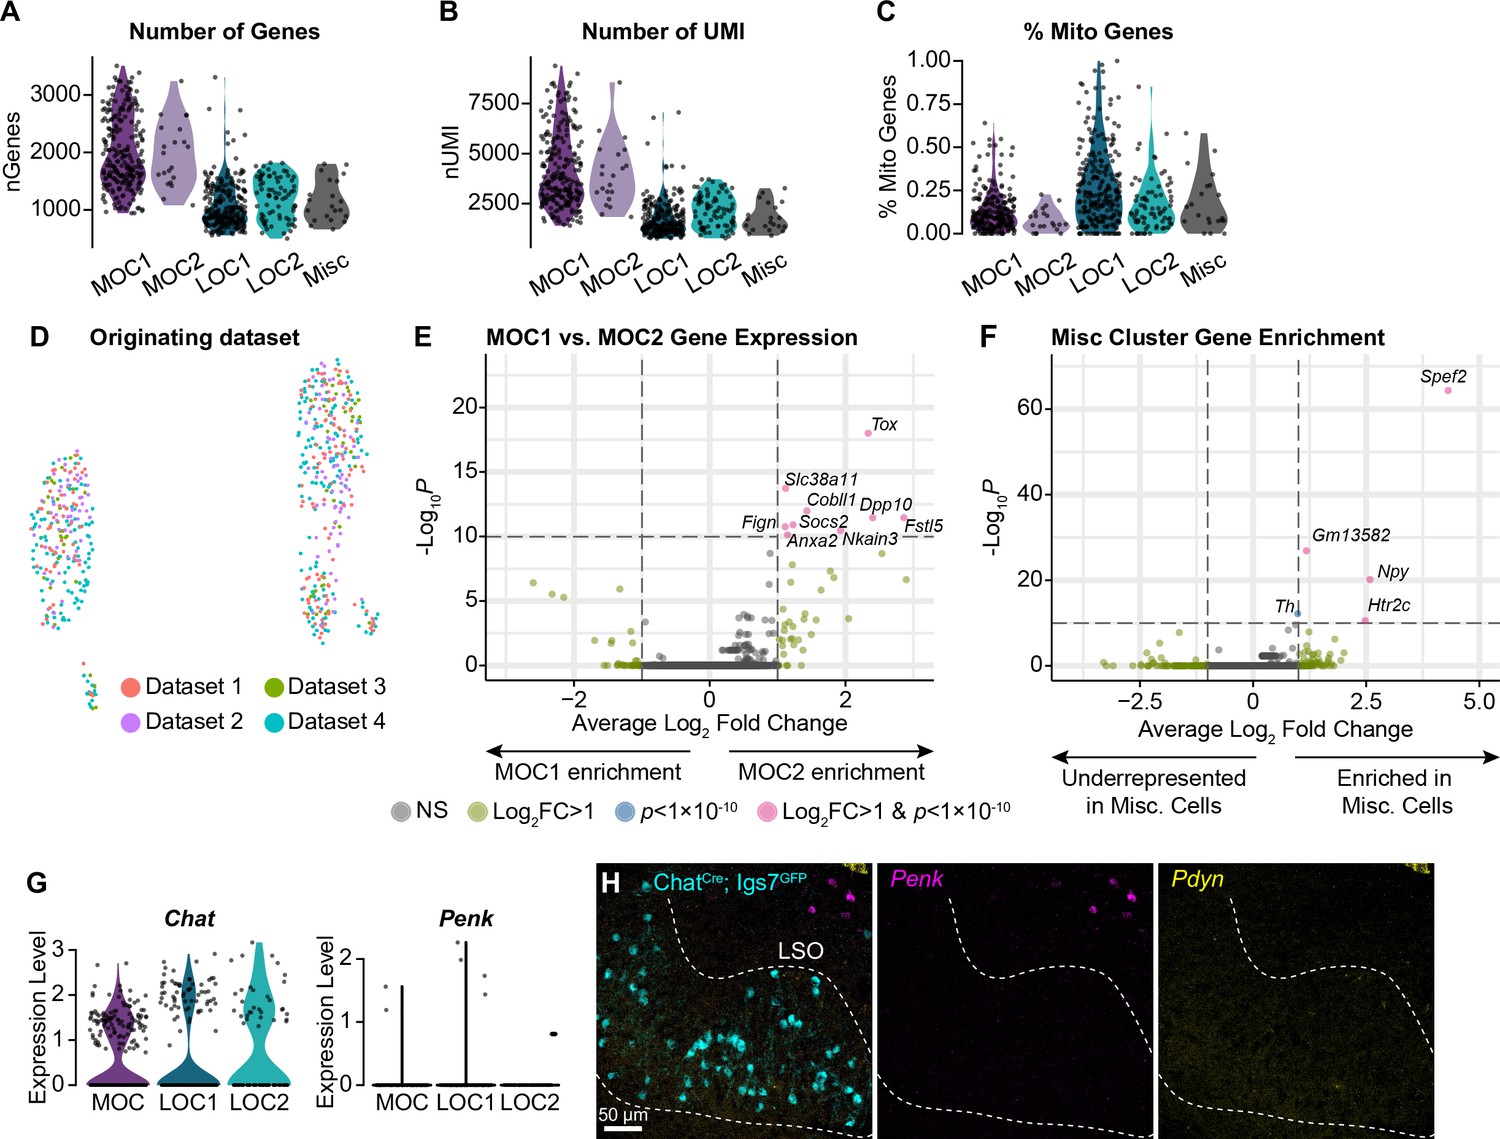
Additional metrics for OCN transcriptional subtypes.
(A–C) The number of genes detected (A), number of UMI (B), and percent of mitochondrial genes (C) is similar within MOC and LOC subtypes, indicating that differences between clusters are not reducible to technical variability. (D) Cells from multiple collection rounds are not separable on a UMAP plot, suggesting that variability in OCN gene expression is not driven by batch-to-batch variation. (E) Volcano plot summarizing gene-expression differences between MOC1 and MOC2 clusters. Wilcoxon rank-sum test, Bonferroni post-hoc correction. (F) Volcano plot showing gene enrichment in the Misc cluster. (G, H) Although our sequencing data detects similar levels of Chat in all OCN subtypes, we did not detect expression of Penk or Pdyn in either LOC subtype based on single-nucleus sequencing (G) or FISH (H). Pdyn did not pass our detection threshold for any adult OCN in our sequencing data, so no violin plot is shown. Non-LOC cells expressing Penk and Pdyn are visible in the upper right of (H). Representative images from three P28 ChatCreΔNeo; Igs7GFP mice.
Figure 4 with 1 supplement
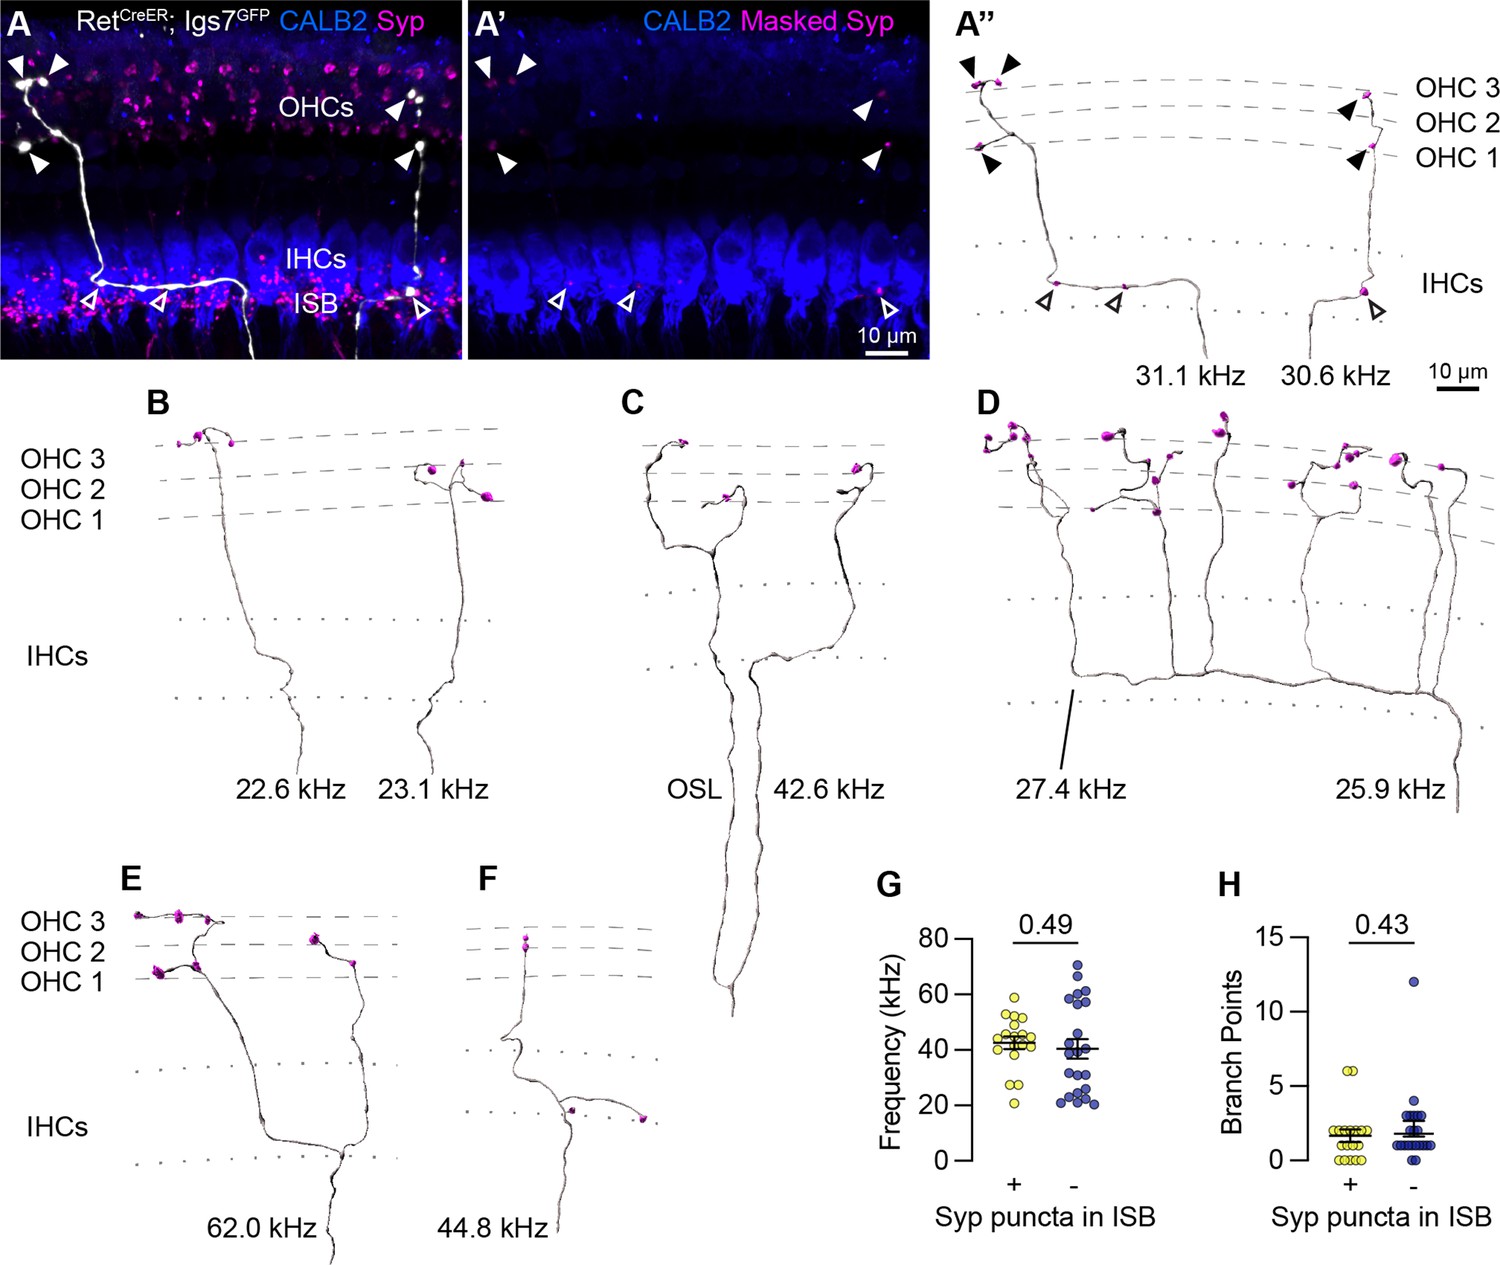
Sparse labeling of OCNs reveals MOC connectivity in the cochlea.
(A–A”) Low doses of tamoxifen in RetCreER; Igs7GFP animals sparsely labels OCNs, enabling visualization of individual MOC axons (white) as they extend along and through the row of IHCs (CALB2, blue), and form terminal swellings among the OHCs, with Syp (magenta) labeling putative pre-synaptic sites (A). Using the GFP signal to mask the Syp fluorescent signal isolates Syp puncta associated with the labeled axon (A’), shown in an Imaris reconstruction in (A”). Closed arrowheads, Syp puncta in OHC region; open arrowheads, Syp puncta beneath IHCs. Dashed lines indicate OHC rows; dotted lines indicate the top and bottom of IHCs. Additional reconstructions from this same MOC neuron are shown in Figure 5—figure supplement 1F-I. (B–F) Terminal MOC axons exhibit a range of morphologies, including simple and unbranched (B), branching in the OSL and among the OHCs (C), highly branched in both the ISB and OHC region (D), and branching in the ISB with simple collaterals innervating multiple rows of OHCs (E). Some MOC axons also have Syp puncta in the ISB, either along an axon (A’’) or on a terminal branch (F). The frequency of each axon is indicated (kHz); base is to the left. (G–H) MOCs with and without Syp puncta in the ISB do not differ in their frequency (G) or number of branch points (H). Error bars, mean ± SEM. Wilcoxon rank-sum test. All reconstructions are from P27–P30 cochleae. n=40 axons, N=9 animals of both sexes.
Figure 4—video 1
Terminal MOC axon morphology with putative synapses in the ISB and OHC region.
The full confocal z-stack volume of terminal MOC axons is shown, with CALB2 (blue) labeling IHCs and SGN peripheral fibers, the MOC axons labeled by RetCreER; Igs7GFP (white), and Syp labeling putative pre-synaptic contacts, which also delineate the three rows of OHCs (magenta). Using the GFP signal to create a mask of the Syp signal allows for reconstruction of the MOC axon and its associated putative pre-synaptic sites beneath the OHCs as well as in the ISB beneath the IHCs.
Figure 5 with 2 supplements
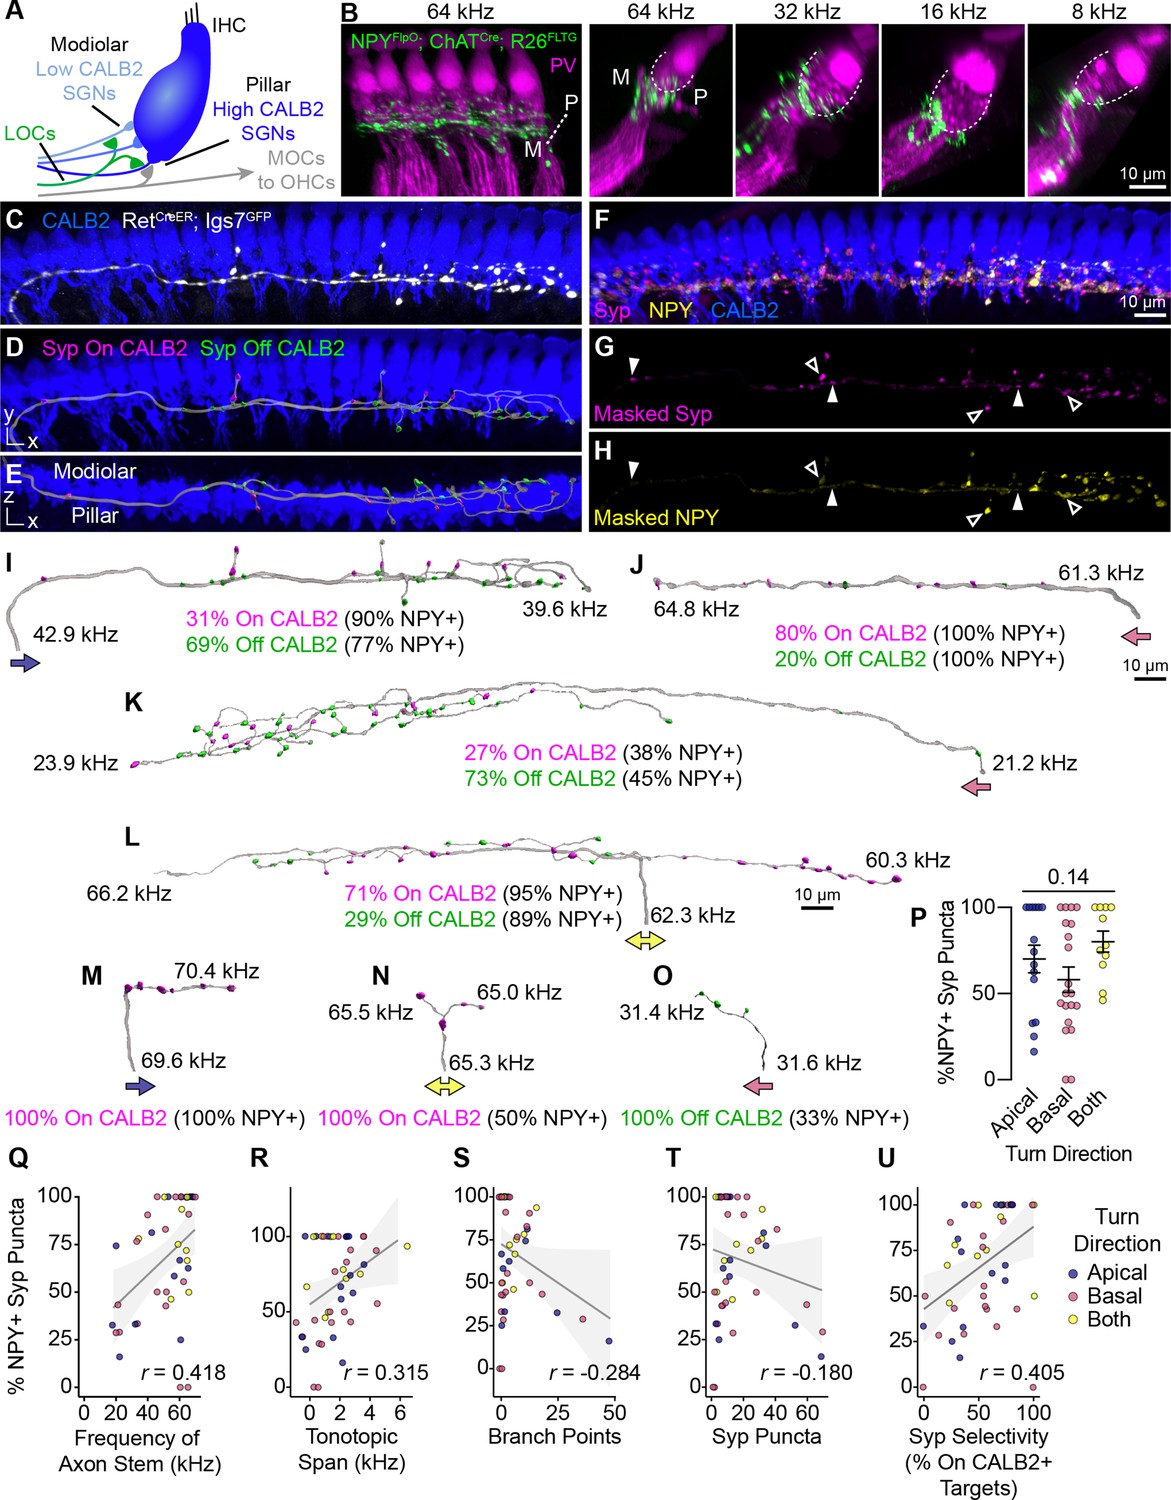
Anatomical heterogeneity in LOCs does not correlate with peptidergic identity.
(A) Schematic of the IHC region of the Organ of Corti. Peripheral fibers of Type I SGN subtypes (blue) innervate the IHCs in a low-to-high CALB2 expression gradient along the modiolar-pillar axis. (B) Intersectional genetic approach using NpyFlpO; ChatCre; Rosa26FLTG labels peptidergic LOC axons in the cochlea (green). Parvalbumin (PV, magenta) labels IHCs and SGN peripheral processes. GFP-positive peptidergic LOC axons are spread across much of the modiolar-pillar (M–P) axis in the ISB beneath IHCs, shown in orthogonal views of 1–2 IHCs at frequencies from 64 to 8 kHz. (C–I) 3D views of an individual LOC axon in a sparsely labeled RetCreER; Igs7GFP cochlea. Fluorescent signal from a genetically labeled LOC (C, white) was used to reconstruct individual terminal axons in Imaris, shown in the same perspective (D, I) and an orthogonal view looking from the top of the IHCs to the bottom (E). (F) Cochlear wholemounts were immunolabeled for CALB2 (blue), synaptophysin (Syp, magenta), and NPY (yellow). Using the fluorescent signal from the LOC, masks were created for Syp (G) and NPY (H), allowing for identification of NPY+ and NPY- (open and closed arrowheads, respectively) Syp puncta associated with an individual axon. Using a surface reconstruction of the CALB2 immunofluorescence signal, Syp puncta were also categorized by whether they directly contacted the CALB2 surface ("On CALB2" in magenta) or not ("Off CALB2" in green) (D–E). (J–O) Representative examples of reconstructed LOC axons. All reconstructions are oriented with the cochlear base to the left and labeled with a colored arrow indicating turn direction (blue: towards the apex; pink: towards the base; yellow: both/bifurcated), the frequency position of its stem and farthest terminal (kHz), and the fraction of Syp puncta On- (magenta) and Off- (green) CALB2+ targets, with the percent of those puncta that are NPY+. (P) Peptidergic identity does not correspond to turn direction. Error bars, mean ± SEM. Wilcoxon rank-sum test. (Q–U) LOC axon peptidergic identity is not predictive of morphological features or innervation patterns. NPY identity is weakly correlated with axon stem frequency (r=0.418, p=0.005) (Q), tonotopic span (r=0.315, p=0.033) (R), and selectivity for CALB2 targets (r=0.405, p=0.005) (U). There is no correlation between NPY expression and the number of branch points (r=–0.284, p=0.056) (S) or total number of Syp puncta (r=–0.180, p=0.230) (T). Color of individual data points corresponds to axonal turn direction. r, Pearson’s correlation coefficient. n=46 fibers, N=9 animals of both sexes, P27–P30.
Figure 5—figure supplement 1
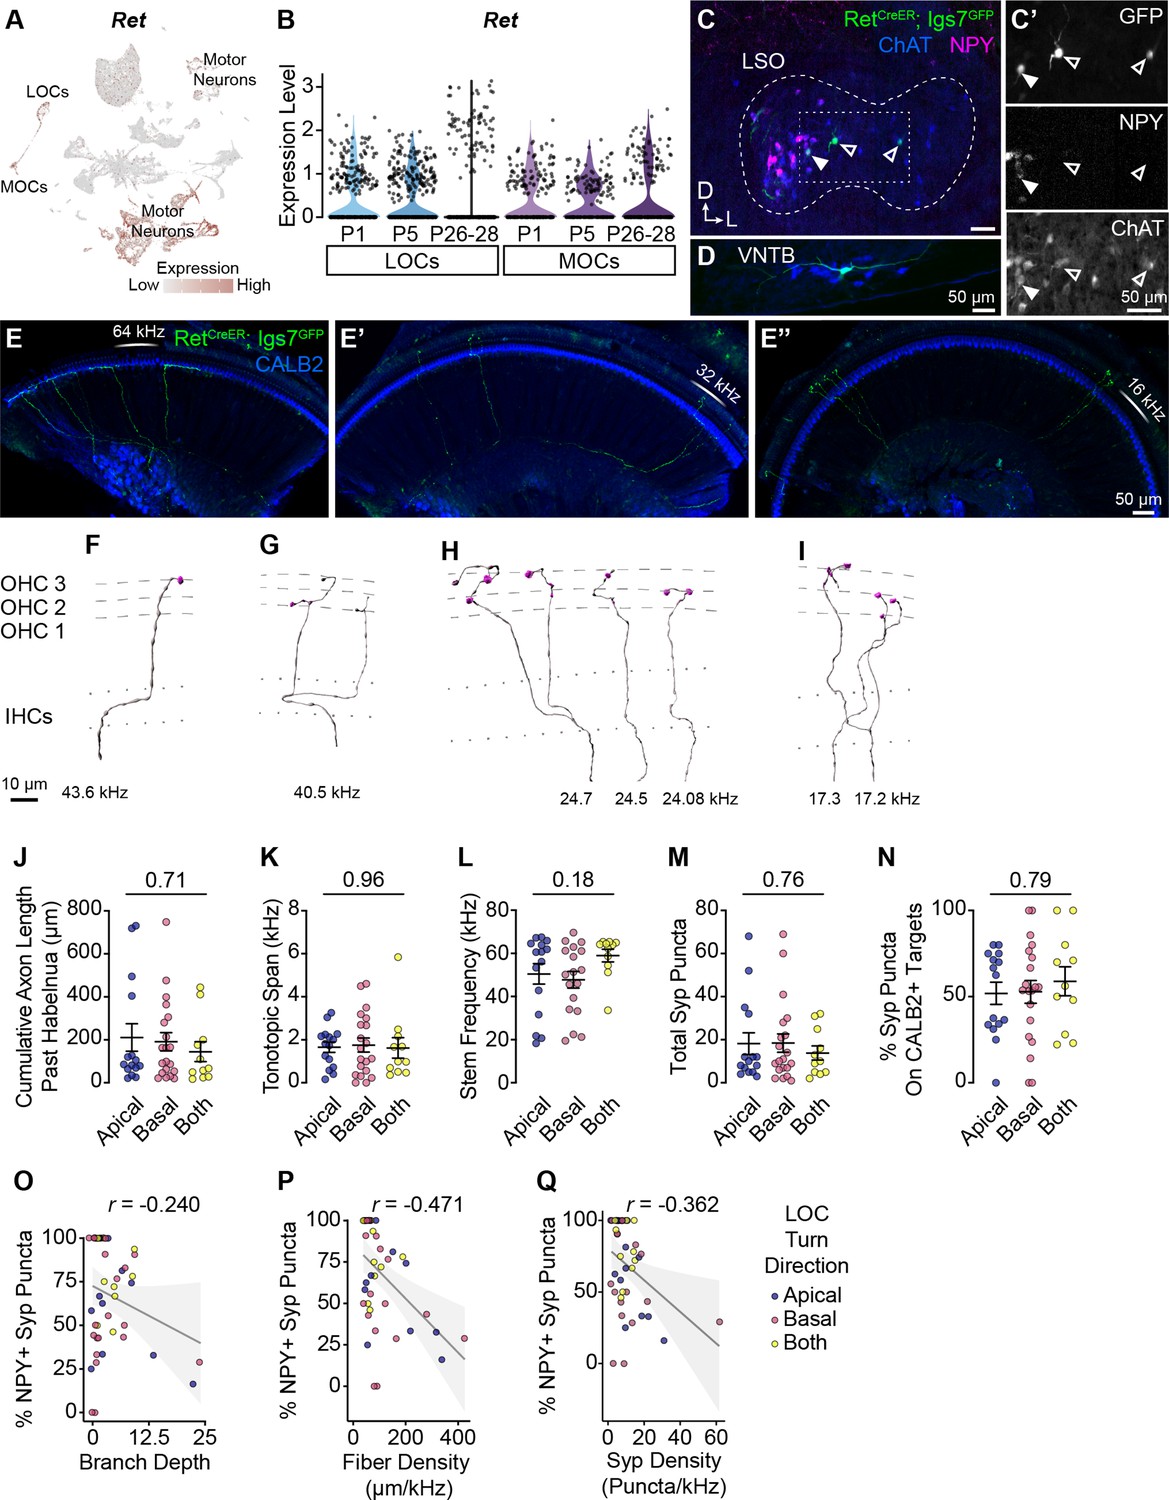
Additional morphological quantification of OCN terminal axons.
(A, B) Ret is broadly expressed in OCNs at least as early as P1. (A) UMAP plot denoting Ret expression. Ret transcripts are detected in multiple motor neuron clusters, including OCNs. For visualization purposes, high expression on the color scale is capped at the 95th percentile of gene expression. (B) Violin plots indicate that Ret is expressed in OCNs across postnatal development. (C, D) Representative sparse labeling of OCNs in the LSO (C) and VNTB (D) in RetCreER; Igs7GFP mice after a low dose of tamoxifen. Genetically labeled OCNs (green) colocalize with ChAT immunofluorescence (blue). LOC subtype is inferred based on NPY immunolabeling (magenta): both NPY+ (closed arrowhead) and NPY- (open arrowhead) LOCs are labeled (C’). (E-E’’) Three segments from one cochlea (no OCN axons were present in the apex, not shown) with sparsely labeled LOC (E) and MOC (E’-E’’) axons (green). CALB2 antibody (blue) labels SGNs and IHCs. This cochlea is from an animal with a single MOC neuron labeled in the brainstem. (F–I) Imaris reconstructions of the MOC terminal axons from the cochlea in (E-E’’), illustrating that a single MOC can have multiple branches innervating a ~27 kHz frequency range from 43–17 kHz. Dashed lines indicate OHC rows; dotted lines indicate the top and bottom of IHCs. Additional images of this same MOC are in Figure 4A–A’’. One axon from this neuron was bisected by the cut between cochlear turns and was not reconstructed. (J–N) LOC axons that turn toward the base, apex, or both directions do not differ in total axon length (J), tonotopic span (K), stem frequency (L), number of Syp puncta (M), or Syp selectivity (the fraction of Syp puncta on CALB2+ targets, N). Error bars, mean ± SEM. Wilcoxon rank-sum test, n=44 (K, L) or 46 (J, M, N) axons, N=9 animals of either sex, P27–P30. (O–Q) LOC axon peptidergic identity (% of Syp puncta that are NPY+) is not predictive of axon branch depth (r=−0.240, p=0.108) (O), and is weakly correlated with fiber density (cumulative µm of axon length/tonotopic span in kHz; r=–0.471, p=0.001) (Q) and the density of Syp puncta (r=–0.362, p=0.016) (R). r, Pearson’s correlation coefficient. n=46 fibers, N=9 animals of either sex, P27–P30. Dot color corresponds to LOC axon turn direction.
Figure 5—video 1
Terminal LOC axon morphology with complex innervation patterns.
The full confocal z-stack volume is shown first, with CALB2 (blue) labeling IHCs and SGN peripheral fibers and the single LOC axon labeled by RetCreER; Igs7GFP (white), NPY (yellow), and Syp (magenta). The GFP signal is used to create a mask of the NPY and Syp channels. The axon is reconstructed and individual Syp puncta are categorized as On or Off a CALB2+ target, with Off-CALB2 Syp puncta generally localizing along the modiolar side of the row of IHCs and On-CALB2 Syp puncta making contacts with the CALB2-high SGNs on the pillar side of the IHCs. Syp puncta are also coded as either NPY+ (lighter shade) or NPY- (more opaque).
Figure 6
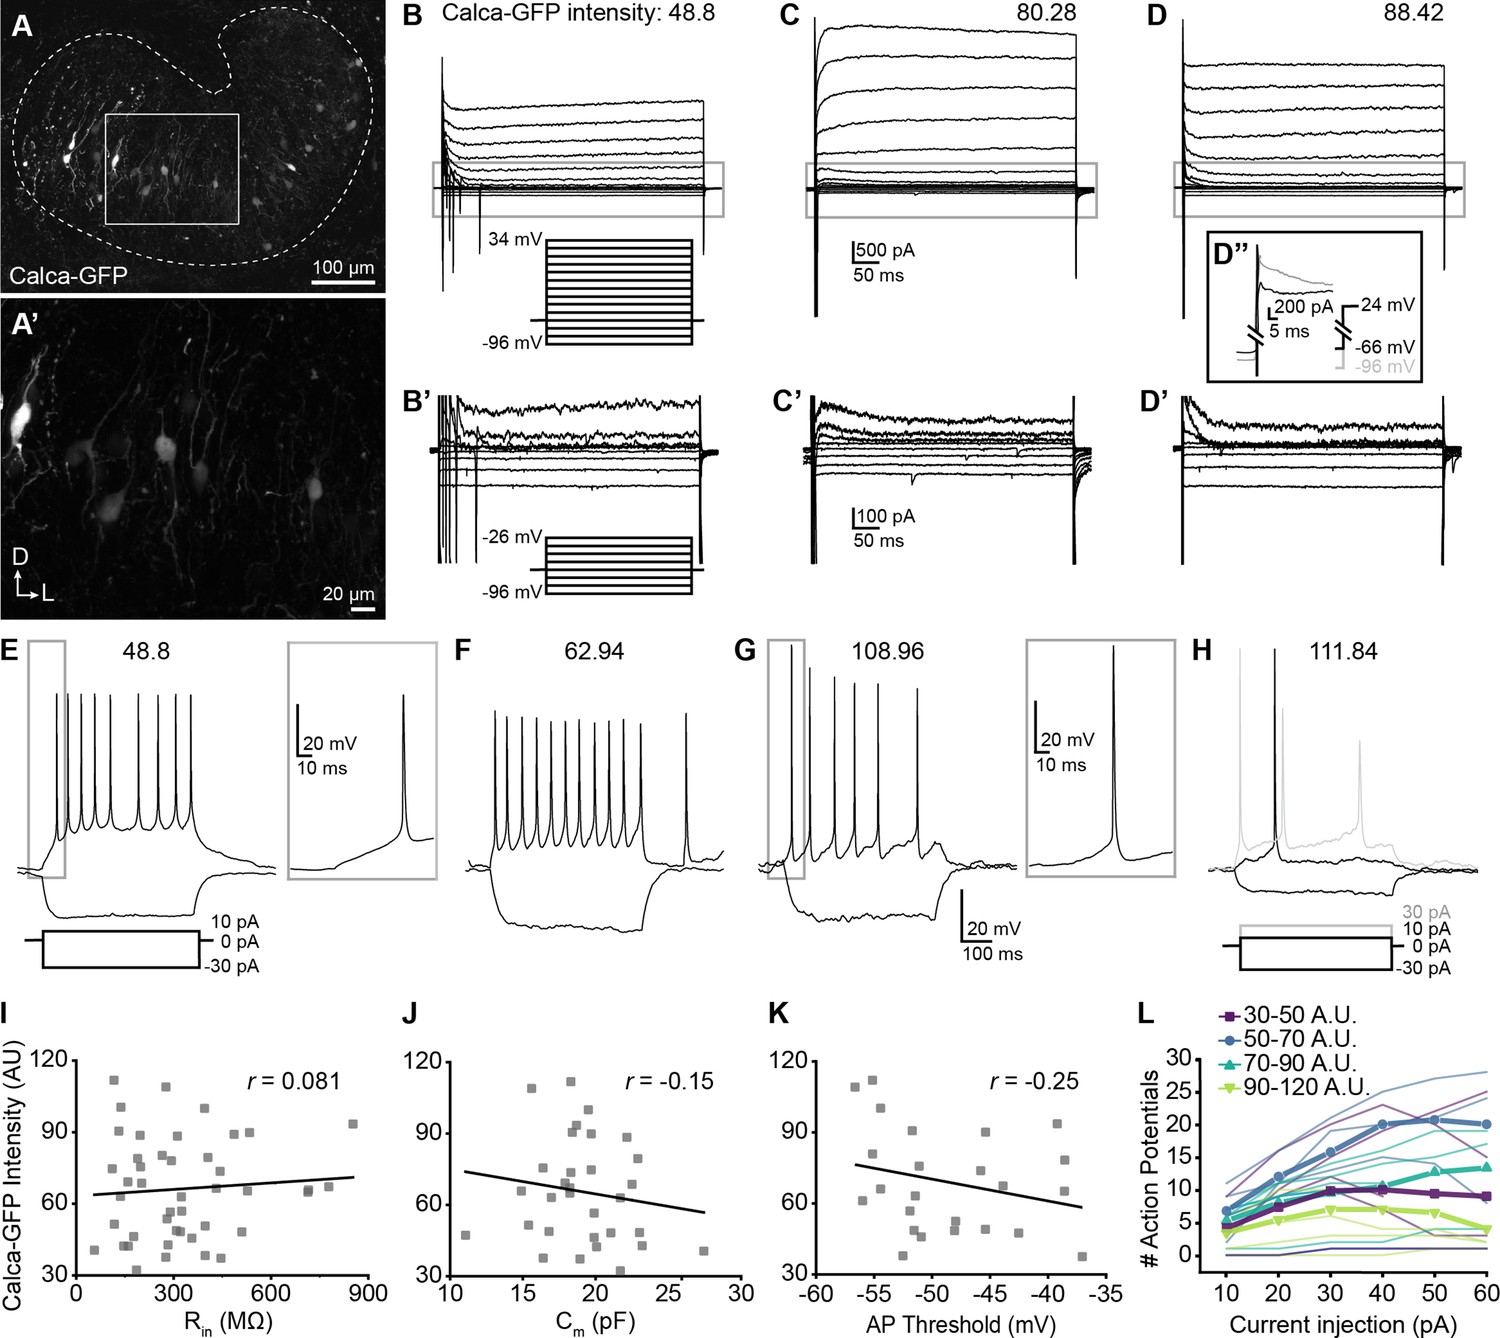
Single-cell electrophysiological measures do not correlate with GFP intensity in Calca-GFP+ LOCs.
(A–A’) Confocal Z-stack of an unfixed brain slice from a Calca-GFP mouse showing native GFP fluorescence in greyscale. Dashed line indicates boundaries of the LSO. (A’) Zoom of recording region indicated by the box in (A). D, dorsal; L, lateral. (B–D) Voltage-clamp traces from different LOC neurons in response to the voltage step protocol shown in (B, inset). Numbers indicate Calca-GFP fluorescence intensity (arbitrary units, AU). Grey box indicates regions shown in (B’–D’). (B’–D’) Zoom of responses to steps from –96 to –26 mV from the same traces as shown in (B–D), voltage step protocol shown in (B’, inset). (D’’) Inset shows voltage-clamp traces from the same cell as (D) in response to a step from –66 mV to 24 mV (black) and from –96 mV to 24 mV (grey) to reveal representative fast-inactivating outward currents. (E–H) Current-clamp traces from different LOC neurons in response to the current-step protocol shown in (E). The GFP intensity for each cell is indicated above the traces. An additional step to +30 pA is included in (H) to show multiple action potentials in response to the current injection (grey). (I–K) There is no correlation between Calca-GFP intensity and input resistance (r=0.081, p=0.60) (I), membrane capacitance (r=–0.15, p=0.42) (J), or action potential threshold (r=–0.25, p=0.26) (K). r, Pearson’s correlation coefficient. (L) Input-output curves for current steps from 10 to 60 pA. Thick lines with symbols denote group means for cells of varying Calca-GFP intensities. Thin, transparent lines represent individual cells. GFP intensity is grouped for improved visibility, color code indicated in key.
Figure 7 with 1 supplement
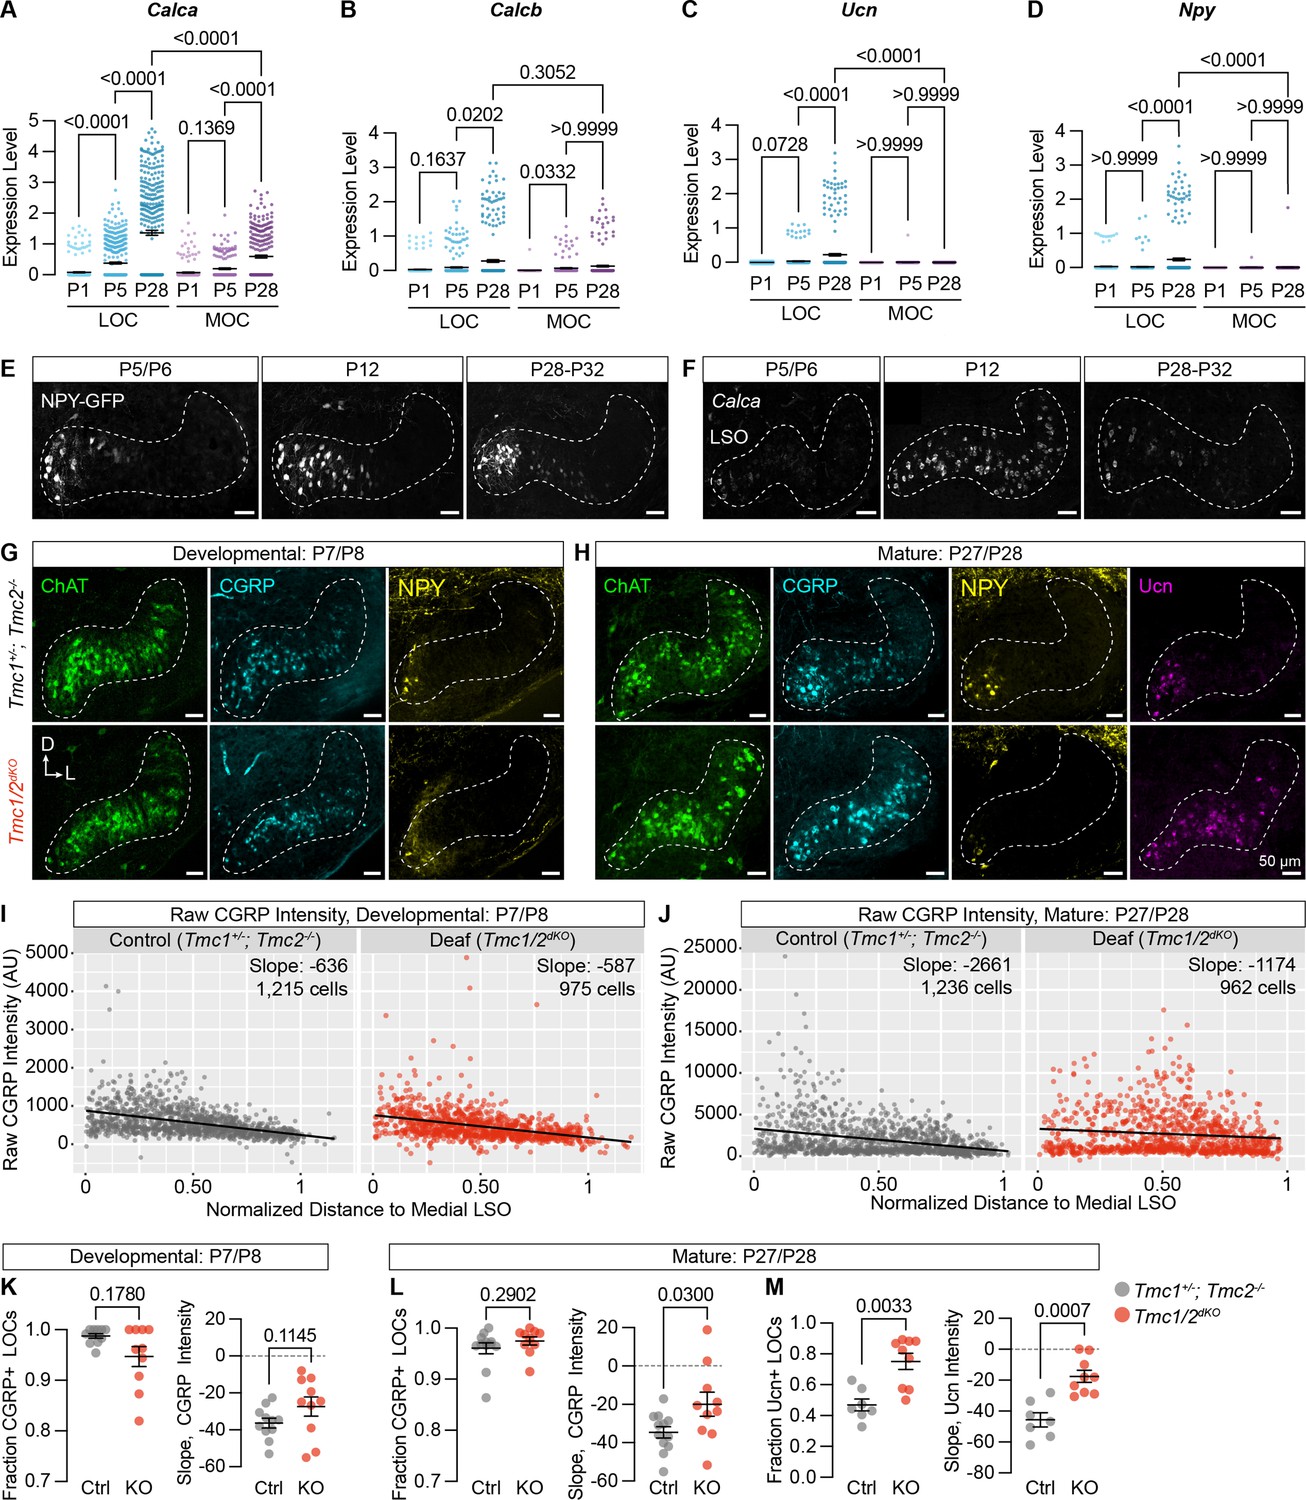
Neuropeptide expression in LOCs emerges over postnatal development and is affected by hearing.
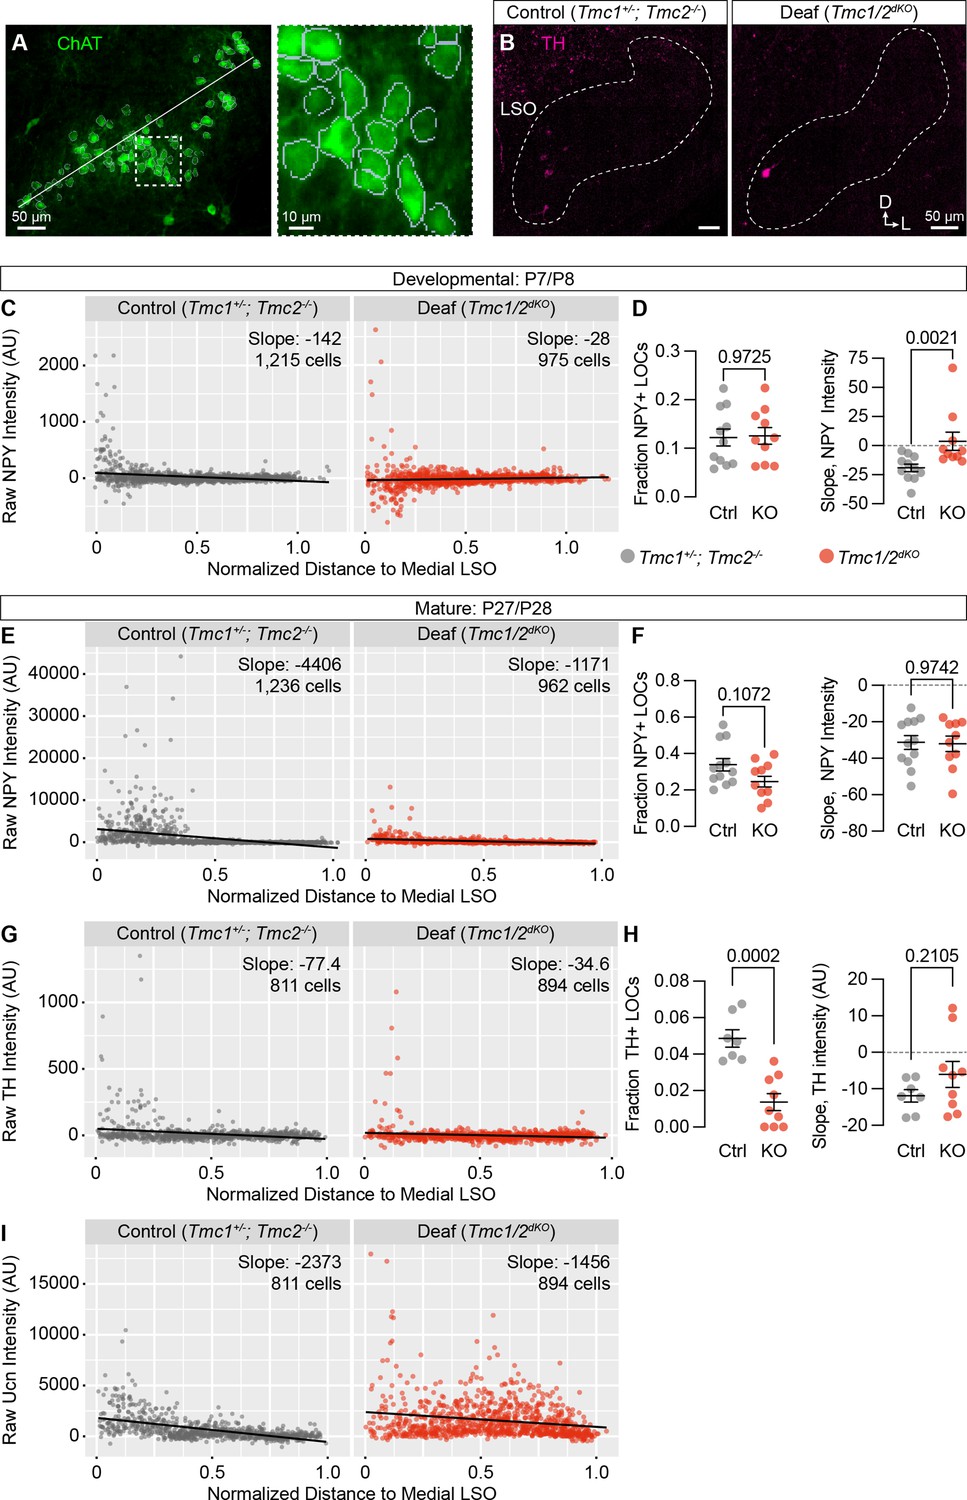
(A–D) Log-normalized counts of Calca (A), Calcb (B), Ucn (C), and Npy (D) expression across postnatal development as determined by single-nucleus sequencing. Mean ± SEM; Kruskal-Wallis with Dunn’s test for multiple comparisons. (E) Maximum-intensity projections of confocal z-stacks showing GFP signal in the LSO of Npy-GFP mice at varying ages. Representative images are shown from three to five total animals per timepoint. (F) Fluorescent in situ hybridization of Calca expression in the LSO of mice at varying ages. Representative images are shown from two to three animals per timepoint. (G, H) Neurotransmitter expression in control (Tmc1+/-; Tmc2-/-) and deaf (Tmc1-/-; Tmc2-/-, Tmc1/2dKO) mice before (G, P7–P8) and after (H, P27–P28) the onset of hearing. Representative images are shown from five to six total animals per age and condition. (E–H) Scale bars, 50 µm. Images oriented with dorsal (D) up and lateral (L) to the right. (I, J) Quantification of raw CGRP fluorescence intensity for all measured LOCs before (I, P7–P8) and after (J, P27–P28) the onset of hearing, shown as a function of position along the medial/lateral axis of the LSO. Black line denotes linear regression through all cells. Slope indicates the slope of this regression line. (K–M) Expression of CGRP and Ucn in LOC neurons is altered in mature deaf animals. Before the onset of hearing (K), the normalized slope of regression lines through the LSO and the relative fraction of CGRP-expressing LOCs does not differ between hearing and deaf animals. After the onset of hearing (L, M), the slope of CGRP intensity (L) as well as the fraction and slope of Ucn-expressing LOCs is significantly different between hearing and deaf animals. N=7–12 LSOs from four to six animals per condition; Wilcoxon rank-sum test; error bars, mean ± SEM.
Figure 7—figure supplement 1
Quantification of additional neurotransmitters in TMC1/2dKO animals.
(A) Example of the cell segmentation and LSO normalization procedure for quantifying expression of neurotransmitters in LOCs. White line indicates the length of the LSO used for distance normalization. Dashed line indicates region shown at higher power to the right, where gray boundaries indicate segmented cells. (B) Representative images showing TH expression in the LSO of control (TMC1+/-; TMC2-/-) and deaf (TMC1/2dKO) animals. (C–I) Quantification of NPY (C–F), TH (G, H), and Ucn (I) fluorescence intensity, presented as a function of location within the LSO at developmental (C,D) or mature (E–I) stages. N=7–12 LSOs from five to six animals per condition. Black line denotes regression line through all cells; slope denotes the slope of this regression line. Error bars, mean ± SEM; Wilcoxon rank-sum test.
Figure 8
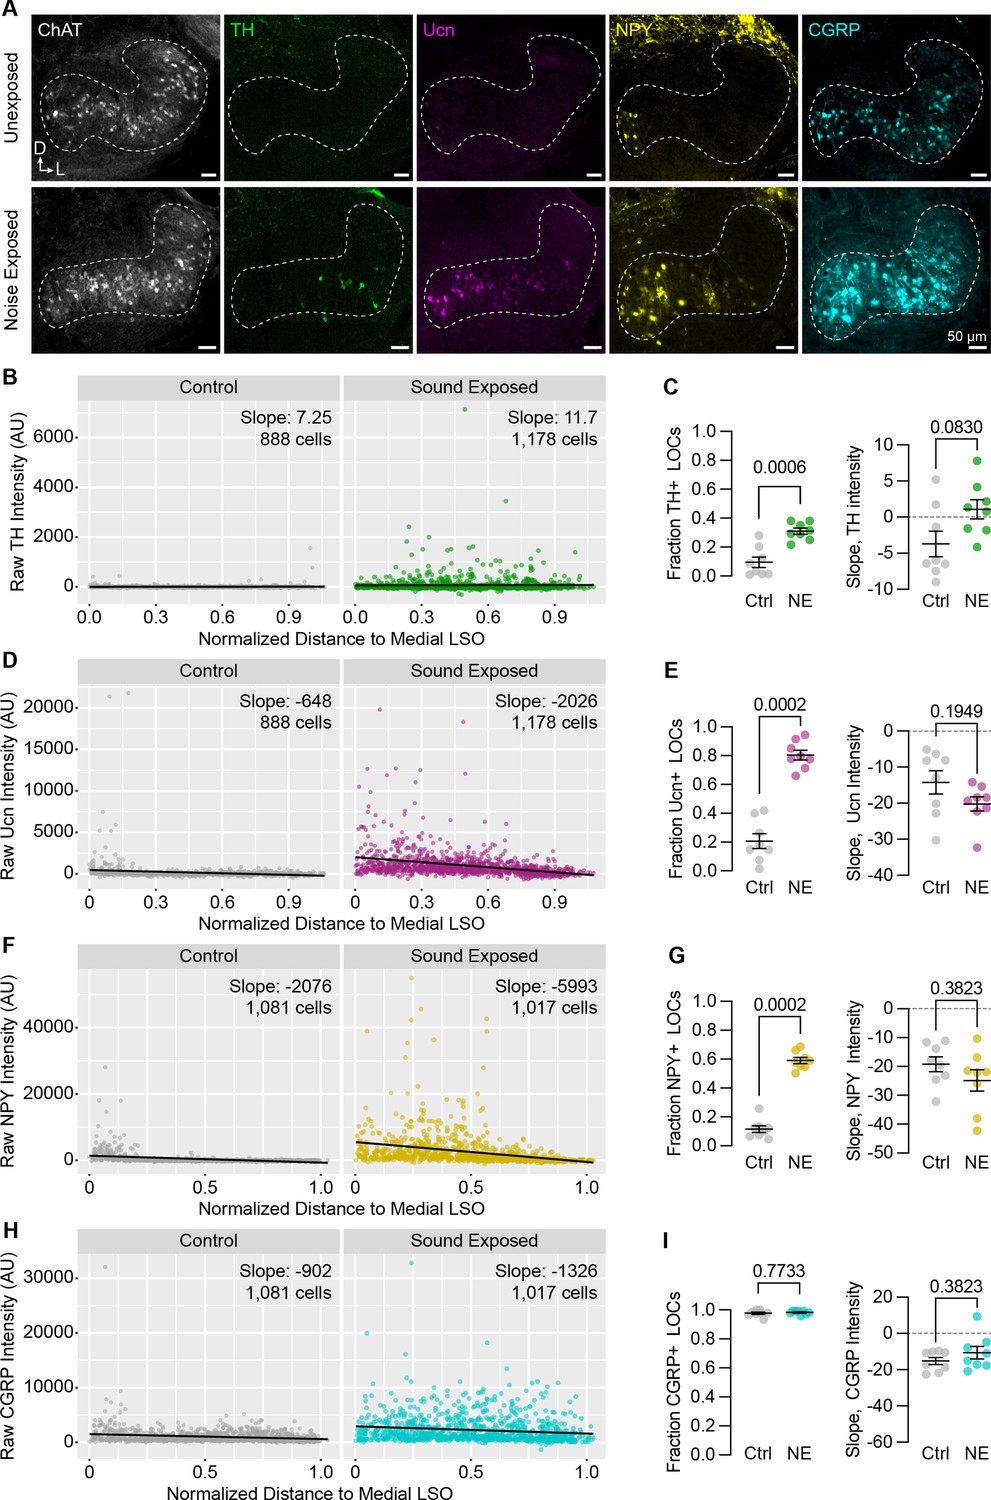
Neuropeptide expression in LOCs changes with sound exposure.
(A) Representative images of ChAT, TH, Ucn, NPY, and CGRP immunolabeling in unexposed (top) and sound-exposed (bottom) animals 9 days after a 2-hr exposure of 110 dB, 8–16 kHz noise. N=4 animals of either sex per condition. D, dorsal; L, lateral. (B–I) Quantification of TH (B, C); Ucn (D, E); NPY (F, G); and CGRP (H, I) expression. N=8 LSOs from 4 animals per condition; 888–1,178 cells. (B, D, F, H) Raw fluorescence intensity values of TH (B), Ucn (D), NPY (F), and CGRP (H) in annotated LOCs presented as a function of normalized distance to the medial LSO. Black line indicates linear regression of intensity as a function of position within the LSO; Slope denotes the slope of this regression line. (C, E, G, I) Quantification of the fraction of LOCs expressing TH (C), Ucn (E), NPY (G), and CGRP (I), along with the normalized slope of each protein. Data is presented as mean ± SEM; Wilcoxon rank-sum test.
Tables
Appendix 1—key resources table
| Reagent type (species) or resource | Designation | Source or reference | Identifiers | Additional information |
|---|---|---|---|---|
| Strain, C57Bl/6J (Mus musculus) | C57BL/6J | The Jackson Laboratory | RRID:IMSR_JAX:000664 | |
| Genetic reagent (Mus musculus) | Calca-GFP | Gensat | RRID:MMRRC_011187-UCD | Full name: Tg(Calca-EGFP)FG104Gsat/Mmucd |
| Genetic reagent (Mus musculus) | Rosa26tdTomato | The Jackson Laboratory | RRID:IMSR_JAX:007914 | Full name: B6.Cg-Gt(ROSA)26Sortm14(CAG-tdTomato)Hze/J |
| Genetic reagent (Mus musculus) | Igs7GFP | The Jackson Laboratory | RRID:IMSR_JAX:030220 | Full name: B6.Cg-Igs7tm140.1(tetO-EGFP,CAG-tTA2)Hze/J |
| Genetic reagent (Mus musculus) | Rosa26Sun1-GFP | The Jackson Laboratory | RRID:IMSR_JAX:021039 | Full name: B6;129-Gt(ROSA)26Sortm5(CAG-Sun1/sfGFP)Nat/J |
| Genetic reagent (Mus musculus) | ChatCre | The Jackson Laboratory | RRID:IMSR_JAX:006410 | Full name: B6;129S6-Chattm2(cre)Lowl/J |
| Genetic reagent (Mus musculus) | ChatCreΔNeo | The Jackson Laboratory | RRID:IMSR_JAX:031661 | Full name: B6.129S-Chattm1(cre)Lowl/MwarJ |
| Genetic reagent (Mus musculus) | NpyFlpO | The Jackson Laboratory | RRID:IMSR_JAX:030211 | Full name: B6.Cg-Npytm1.1(flpo)Hze/J |
| Genetic reagent (Mus musculus) | RetCreER | David Ginty (Harvard); Luo et al., 2009 | MGI:4437245 | Full name: Rettm2(cre/ERT2)Ddg |
| Genetic reagent (Mus musculus) | Npy-GFP | The Jackson Laboratory | RRID:IMSR_JAX:006417 | Full name: B6.FVB-Tg(Npy-hrGFP)1Lowl/J |
| Genetic reagent (Mus musculus) | Tmc1KO | David Corey (Harvard); Kawashima et al., 2011 | MGI:5427097 | Full name: Tmc1tm1.1Ajg |
| Genetic reagent (Mus musculus) | Tmc2KO | David Corey (Harvard); Kawashima et al., 2011 | MGI:5427099 | Full name: Tmc2tm1.1Ajg |
| Genetic reagent (Mus musculus) | Rosa26FLTG | The Jackson Laboratory | RRID:IMSR_JAX:026932 | Full name: B6.Cg-Gt(ROSA)26Sortm1.3(CAG-tdTomato,-EGFP)Pjen/J |
| Antibody | Goat polyclonal Anti-Calb2 antiserum | Swant | Cat#CG1; RRID: AB_10000342 | (1:1,000) |
| Antibody | Goat polyclonal Anti-ChAT | Millipore Sigma | Cat#AB144P; RRID:AB_2079751; Lot 3675895 | (1:500) |
| Antibody | Mouse monoclonal Anti-CGRP | Abcam | Cat#ab81887; RRID: AB_1658411; Lots GR3336715-4, GR3374844-3, GR3233139-4 | (1:500–1:1,000) |
| Antibody | Chicken polyclonal Anti-GFP | Aves | Cat#GFP-1020; RRID: AB_10000240; Lot GFP3717982 | (1:2,000) |
| Antibody | Rabbit monoclonal Anti-NPY | Cell Signaling | Cat#11976; RRID: AB_2716286; Lots 3, 4, 5 | (Brainstem: 1:500) (Cochlea: 1:1,000) |
| Antibody | Guinea Pig polyclonal Anti-Parvalbumin | Synaptic Systems | Cat#195–004; RRID: AB_2156476; Lots 3–33, 3–36 | (1:1,000) |
| Antibody | Mouse monoclonal Anti-Synaptophysin 1 | Synaptic Systems | Cat#101 011; RRID: AB_887824; Lot 1–58 | (1:600) |
| Antibody | Chicken polyclonal Anti-TH | Abcam | Cat#ab76442; RRID: AB_1524535; Lot GR3393939-1 | (1:1,000) |
| Antibody | Rabbit polyclonal Anti-Ucn Polyclonal | Sigma-Alridch | Cat#SAB4503058; RRID:AB_10753229; Lot 310386 | (1:500) |
| Antibody | Donkey polyclonal Anti-Chicken 488 | Jackson ImmunoResearch | Cat#703-545-155; RID:AB_2340375 | (1:1,000) |
| Antibody | Donkey polyclonal Anti-Chicken 647 | Jackson ImmunoResearch | Cat#703-605-155; RRID:AB_2340379 | (1:1,000) |
| Antibody | Donkey polyclonal Anti-Goat 405 | Jackson ImmunoResearch | Cat#705-475-003; RRID:AB_2340426 | (1:1,000) |
| Antibody | Donkey polyclonal Anti-Goat 488 | Jackson ImmunoResearch | Cat#705-545-147; RRID:AB_2336933 | (1:1,000) |
| Antibody | Donkey polyclonal Anti-Goat 647 | ThermoFisher | Cat#A21447; RRID: AB_2535864 | (1:1,000) |
| Antibody | Donkey polyclonal Anti-Mouse 488 | Abcam | Cat#ab150105; RRID: AB_2732856 | (1:1,000) |
| Antibody | Donkey polyclonal Anti-Mouse 488 | Invitrogen | Cat#A21202; RRID: AB_141607 | (1:1,000) |
| Antibody | Donkey polyclonal Anti-Mouse 568 | ThermoFisher | Cat#A10037; RRID: AB_2534013 | (1:1,000) |
| Antibody | Donkey polyclonal Anti-Mouse 647 | ThermoFisher | Cat#A31571; RRID:AB_162542 | (1:1,000) |
| Antibody | Donkey polyclonal Anti-Rabbit 568 | ThermoFisher | Cat#A10042; RRID: AB_2534017 | (1:1,000) |
| Antibody | Donkey polyclonal Anti-Rabbit 647 | ThermoFisher | Cat#A31573; RRID:AB_2536183 | (1:1,000) |
| Antibody | Donkey polyclonal Anti-Guinea Pig 647 | Jackson ImmunoResearch | Cat#706–605–148; RRID:AB_2340476 | (1:1,000) |
| Sequence-based reagent | Cadps2 FISH probe | Molecular Instruments | Custom probe | |
| Sequence-based reagent | Calca FISH probe | Molecular Instruments | Calca | |
| Sequence-based reagent | Col4a4 FISH probe | Molecular Instruments | Custom probe | |
| Sequence-based reagent | Zfp804a FISH probe | Molecular Instruments | Custom probe | |
| Sequence-based reagent | Penk FISH probe | IDT | This paper | Sequence in Supplementary file 2 |
| Sequence-based reagent | Pdyn FISH probe | IDT | This paper | Sequence in Supplementary file 2 |
| Commercial assay or kit | 3’ Single Cell Kit: 10x v2 | 10x Genomics | Cat#PN-120267 | |
| Commercial assay or kit | 3’ Single Cell Kit: 10x v3 | 10x Genomics | Cat#PN-1000092 | |
| Commercial assay or kit | HCR RNA-FISH (Tissue section kit) | Molecular Instruments | N/A | |
| Commercial assay or kit | SPRIselect Reagent Kit | Beckman Coulter | Cat#B23318 | |
| Commercial assay or kit | DynaBeads MyOne Silane Beads | ThermoFisher | Cat#37002D | |
| Chemical compound, drug | 10% Tween | Bio-Rad | Cat#1610781 | |
| Chemical compound, drug | 10x PBS | ThermoFisher | Cat#70011044 | |
| Chemical compound, drug | 16% Paraformaldehyde | Electron Microscopy Sciences | Cat#15710 | |
| Chemical compound, drug | 1x PBS | ThermoFisher | Cat#10010031 | |
| Chemical compound, drug | 50% Glycerol | Ricca Chemical Company | Cat#3290–32 | |
| Chemical compound, drug | AlexaFluor-488 hydrazide | Fisher Scientific | Cat#A10436 | |
| Chemical compound, drug | APV | Tocris | Cat#0106 | |
| Chemical compound, drug | Biocytin | Sigma-Aldrich | Cat#B4261–25MG | |
| Chemical compound, drug | BSA | Sigma-Aldrich | Cat#A2058–5G | |
| Chemical compound, drug | BSA | ThermoFisher | Cat#BP1600–100 | |
| Chemical compound, drug | Buffer EB | Qiagen | Cat#19086 | |
| Chemical compound, drug | CaCl2 | Sigma-Aldrich | Cat#C7902 | |
| Chemical compound, drug | Corn Oil | Sigma-Aldrich | Cat#C8267–500ml | |
| Chemical compound, drug | CsCl | Fisher Scientific | Cat#AC206320250 | |
| Chemical compound, drug | CsOH | Fisher Scientific | Cat#AC213601000 | |
| Chemical compound, drug | D-gluconic acid | Sigma-Aldrich | Cat#P1847–-100G | |
| Chemical compound, drug | DEPC (Diethyl Pyrocarbonate) | Sigma-Aldrich | Cat#D5758 | |
| Chemical compound, drug | Dextrose | Fisher Scientific | Cat#D16-500 | |
| Chemical compound, drug | DNQX | Sigma-Aldrich | Cat#D0540 | |
| Chemical compound, drug | DTT | Sigma-Aldrich | Cat#D0632 | |
| Chemical compound, drug | EGTA | Fisher Scientific | Cat#409910250 | |
| Chemical compound, drug | Ethanol | Decon Labs | Cat#V1016 | |
| Chemical compound, drug | Fluoromount-G | Southern Biotech | Cat#0100–01 | |
| Chemical compound, drug | Formalin | ThermoFisher | Cat#F79-500 | |
| Chemical compound, drug | Gelatin | Sigma-Aldrich | Cat#G1890–100G | |
| Chemical compound, drug | Glutaraldehyde | ThermoFisher | Cat#50–262–19 | |
| Chemical compound, drug | HEPES | Sigma-Aldrich | Cat#H3375 | |
| Chemical compound, drug | IGEPAL CA-630 | Sigma-Aldrich | Cat#I8896 | |
| Chemical compound, drug | Iodixanol, OptiPrep Density Medium | Sigma-Aldrich | Cat#D1556 | |
| Chemical compound, drug | KCl | Fisher Scientific | Cat#P217–500 | |
| Chemical compound, drug | KCl | Sigma-Aldrich | Cat#P9541–500G | |
| Chemical compound, drug | KH2PO4 | Fisher Scientific | Cat#P288-100 | |
| Chemical compound, drug | KH2PO4 | Sigma-Aldrich | Cat#P9791–500G | |
| Chemical compound, drug | KOH | Sigma-Aldrich | Cat#P4494-50ML | |
| Chemical compound, drug | Kynurenic acid | Sigma-Aldrich | Cat#K3375-5G | |
| Chemical compound, drug | Low TE Buffer | ThermoFisher | Cat#12090–015 | |
| Chemical compound, drug | Mg-ATP | Sigma-Aldrich | Cat#A9187 | |
| Chemical compound, drug | MgCl2 | Sigma-Aldrich | Cat#M2670 | |
| Chemical compound, drug | MgSO4 | Fisher Scientific | Cat#M65-500 | |
| Chemical compound, drug | Na-GTP | Sigma-Aldrich | Cat#G8877 | |
| Chemical compound, drug | Na2-phosphocreatine | Sigma-Aldrich | Cat#P7936-10MG | |
| Chemical compound, drug | Na2HPO4 | Sigma-Aldrich | Cat#S3264-1KG | |
| Chemical compound, drug | NaCl | Fisher Scientific | Cat#S271–1 | |
| Chemical compound, drug | NaCl | Sigma-Aldrich | Cat#S3014-1KG | |
| Chemical compound, drug | NaHCO3 | Sigma-Aldrich | Cat#S5761–500G | |
| Chemical compound, drug | NEG-50 | Epredia | Cat#6502 | |
| Chemical compound, drug | Normal Donkey Serum | Jackson ImmunoResearch | Cat#017–000–121 | |
| Chemical compound, drug | Nuclease-Free Water | ThermoFisher | Cat#AM9937 | |
| Chemical compound, drug | Protease inhibitor cocktail | Roche | Cat#11836170001 | |
| Chemical compound, drug | Proteinase K | Sigma-Aldrich | Cat#P-6556 | |
| Chemical compound, drug | QX-314 | Fisher Scientific | Cat#23–135–0 | |
| Chemical compound, drug | RNAsin Plus RNase Inhibitor | Promega | Cat#N2615 | |
| Chemical compound, drug | Sodium Citrate: C6H5Na3O7∙2H2O | Sigma-Aldrich | Cat#S4641–1KG | |
| Chemical compound, drug | Spermidine trihydrochloride | Sigma-Aldrich | Cat#S2501 | |
| Chemical compound, drug | Spermine tetrahydrochloride | Sigma-Aldrich | Cat#S1141 | |
| Chemical compound, drug | Sucrose | Sigma-Aldrich | Cat#S0389–500G | |
| Chemical compound, drug | Tamoxifen | Sigma-Aldrich | Cat#T5648–1G | |
| Chemical compound, drug | Tetrodotoxin (TTX) | Cayman Chemical | Cat#14964 | |
| Chemical compound, drug | Tricine | Sigma-Aldrich | Cat#T5816–100G | |
| Chemical compound, drug | Triton X-100 | Sigma-Aldrich | Cat#T9284 | |
| Chemical compound, drug | Tween 20 | Sigma-Aldrich | Cat#P9416–100ML | |
| Chemical compound, drug | β-estradiol | Sigma-Aldrich | Cat#E2758–1G | |
| Software, algorithm | MultiClamp 700B | Molecular devices | ||
| Software, algorithm | DigiData 1440 A | Molecular devices | ||
| Software, algorithm | Clampex 10.6 software | Molecular devices | ||
| Software, algorithm | Origin 2021 | OriginLabs | ||
| Software, algorithm | Adobe Illustrator 2021 | Adobe | ||
| Software, algorithm | Inkscape | inkscape.org | ||
| Software, algorithm | R | https://www.r-project.org/ | v.3.5.3–4.0.5 | |
| Software, algorithm | Seurat | Stuart et al., 2019 | v.3.1.4–3.2.3 | |
| Software, algorithm | Imaris | Bitplane AG | v.9.8–9.9.0 | |
| Software, algorithm | MATLAB | MathWorks | R2020a, R2021b | |
| Software, algorithm | cellranger | 10x Genomics | v.2.1.0–3.0.2 | |
| Software, algorithm | CellPose | Stringer et al., 2021 | v.1 | |
| Software, algorithm | Prism | GraphPad | v.9.3.1 | |
| Software, algorithm | Zeiss ZEN | Zeiss | 2.3 (blue edition) | |
| Software, algorithm | Image processing: Local Normalization | Zhang et al., 2021 | https://github.com/xzhang03/Local-normalize | |
| Software, algorithm | ImageJ | National Institutes of Health | ||
| Software, algorithm | Measure_Line ImageJ Plugin | Eaton Peabody Labs, MEEI | https://meeeplfiles.partners.org/Measure_line.class | |
| Other | Brain matrix | Zivic Instruments | Cat#BSMNS001–1 | See Methods, “Single- nucleus sequencing” |
| Other | FlowMi cell strainer | Sigma | Cat#BAH136800040 | See Methods, “Single- nucleus sequencing” |
| Other | DAPI | Invitrogen | Cat#D1306 | DNA dye, (1:10,000) See Methods, “Single-nucleus sequencing” & “Immunofluorescence” |
| Other | Draq7 | Abcam | Cat#AB109202 | DNA dye, (1:100) See Methods, “Single-nucleus sequencing” |
Additional files
-
Supplementary file 1
Cell counts of NPY- and Ucn-expressing LOCs (related to Figure 3).
LOCs were manually annotated as expressing high or low levels of NPY or Ucn. Cells where both peptides were expressed above background are considered to be co-expressing both peptides. Each row includes cell counts from a single, 40 µm-thick section.
- https://cdn.elifesciences.org/articles/83855/elife-83855-supp1-v2.xlsx
-
Supplementary file 2
Custom FISH probe sequences (related to Figure 3, Figure 3—figure supplement 1).
Oligo probe sequences used in Figure 3—figure supplement 1 for detecting Penk and Pdyn via hybridization chain reaction-based FISH.
- https://cdn.elifesciences.org/articles/83855/elife-83855-supp2-v2.xlsx
-
Supplementary file 3
Physiological properties of LOCs do not correlate with Calca-GFP fluorescence intensity (related to Figure 6).
Results of single linear regression and correlation analysis between Calca-GFP and the indicated measures.
- https://cdn.elifesciences.org/articles/83855/elife-83855-supp3-v2.docx
-
Supplementary file 4
Results of statistical tests comparing peptide expression between OCN groups at different ages (related to Figure 7).
Adjusted p-values from Kruskal-Wallis multiple-comparisons test for the indicated cell types and ages. Data is shown in Figure 7A–D.
- https://cdn.elifesciences.org/articles/83855/elife-83855-supp4-v2.docx
-
MDAR checklist
- https://cdn.elifesciences.org/articles/83855/elife-83855-mdarchecklist1-v2.docx
Download links
A two-part list of links to download the article, or parts of the article, in various formats.
Downloads (link to download the article as PDF)
Open citations (links to open the citations from this article in various online reference manager services)
Cite this article (links to download the citations from this article in formats compatible with various reference manager tools)
Experience-dependent flexibility in a molecularly diverse central-to-peripheral auditory feedback system
eLife 12:e83855.
https://doi.org/10.7554/eLife.83855


