Urotensin II-related peptides, Urp1 and Urp2, control zebrafish spine morphology
- Institute of Molecular Biology, Department of Biology, University of Oregon, United States
Figures
Figure 1 with 3 supplements
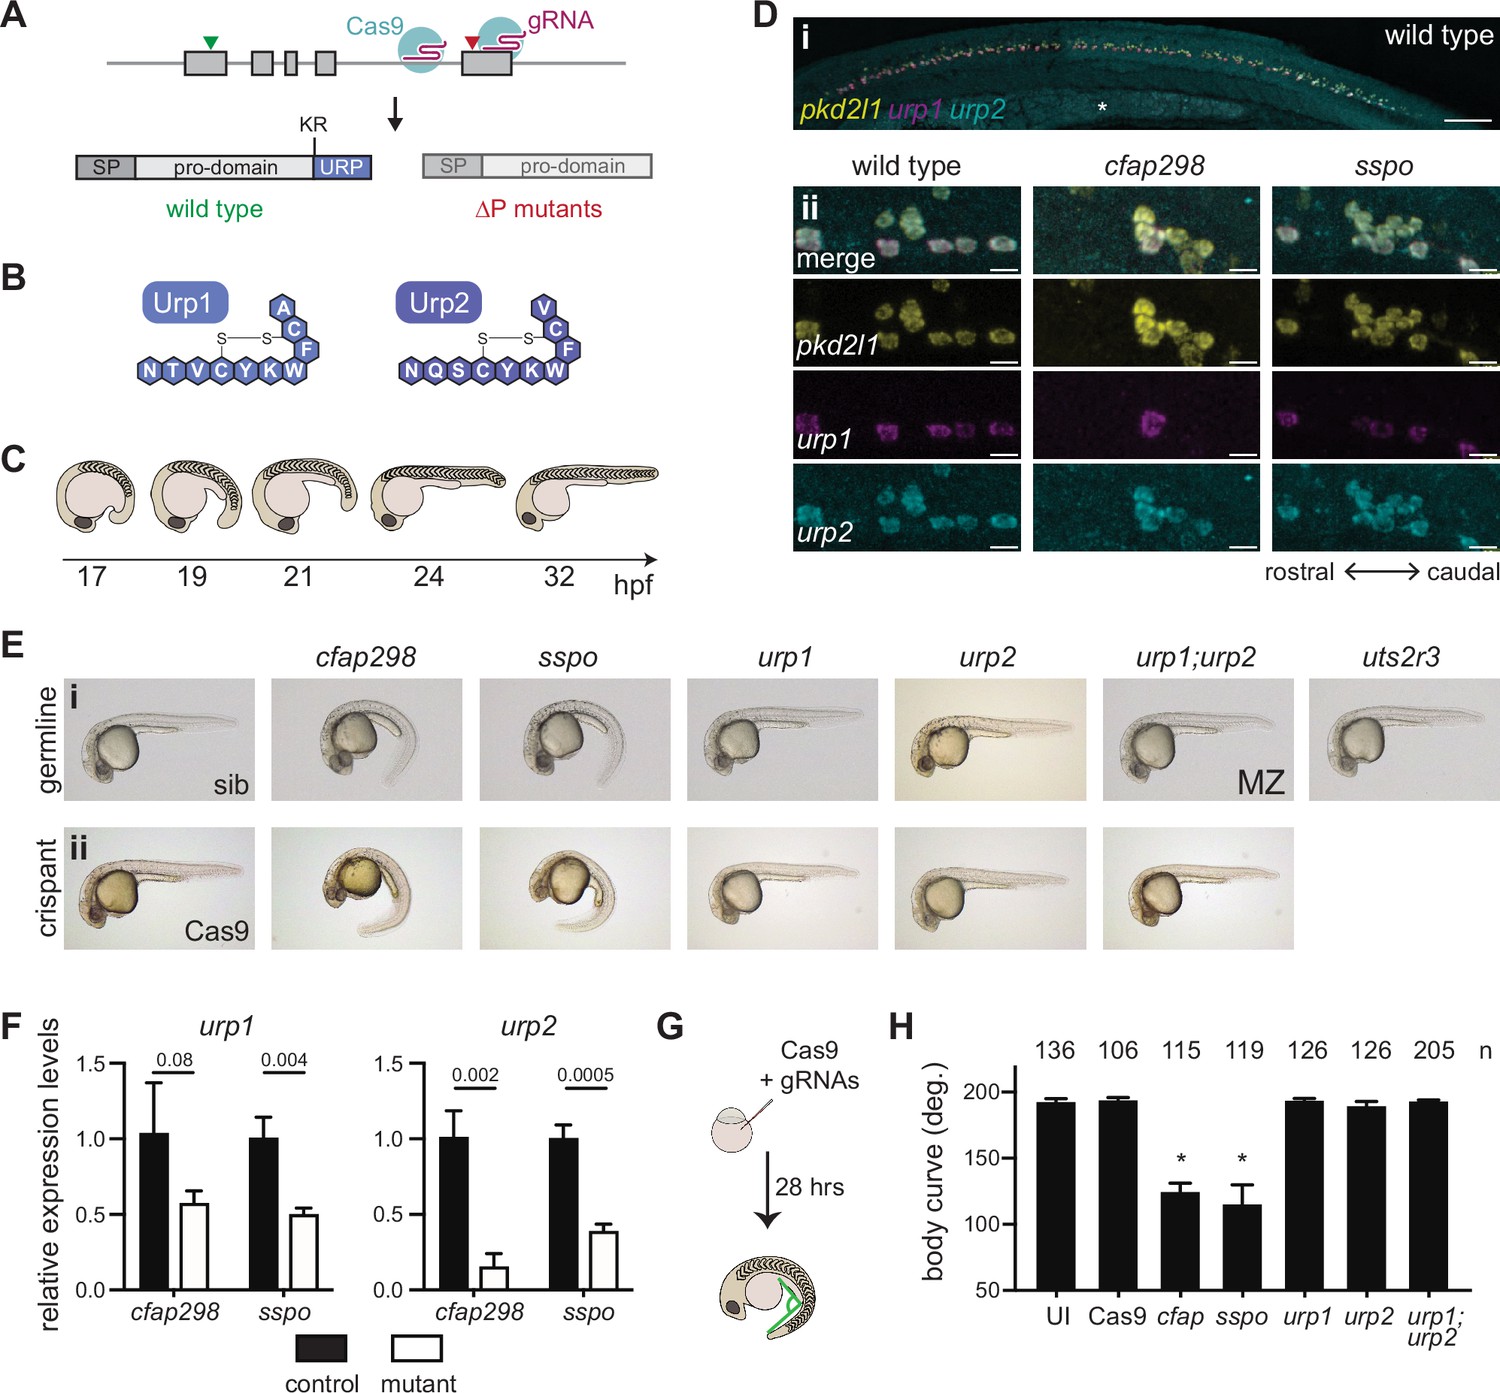
Urp1 and Urp2 are dispensable for axial straightening.
(A) urp1 and urp2 are 5-exon genes (gray boxes). The final exon codes for the 10-amino acid peptides produced after cleavage from the prodomain at a dibasic site (KR). Pairs of gRNAs were used to induce deletions of Urp1 and Urp2 peptide coding sequences, resulting in urp1∆P and urp2∆P mutants, respectively. SP – signal peptide. (B) Urp1 and Urp2 peptide sequences with identical hexacyclic regions. (C) Zebrafish posterior axial straightening, the morphogenetic process which straightens the embryonic body. (D) Fluorescence in situ hybridization based on hybridization chain reaction analysis of pkd2l1, urp1, and urp2 expression in the central canal at 28 hpf. pkd2l1 expression marks CSF-cNs. urp1 expression is restricted to ventral CSF-cNs while urp2 is expressed in all CSF-cNs. Both urp1 and urp2 are expressed in cfap298tm304 and sspob1446 mutants, though comparison of expression between samples was non-quantitative. (i) Shows the zebrafish trunk with the yolk stalk labeled (*). (ii) Shows zoomed regions taken at the rostro-caudal level at the end of the yolk stalk. Scale bars: 150 µm (i), 10 µm (ii). (E) Lateral views of 28–30 hpf germline mutants (i) and crispants (ii). The urp1∆P;urp2∆P double mutants are maternal zygotic (MZ) mutants. Sibling (sib) and Cas9-only injected embryos served as controls. All embryos were incubated at 28°C, which is a restrictive temperature for cfap298tm304. (F) Quantitative reverse transcriptase PCR (qRT-PCR) analysis of urp1 and urp2 mRNA expression levels in cfap298tm304 and sspob1446 mutants at 28 hpf. n>3 biologically independent samples. Bars represent mean ± s.e.m. Two-tailed student’s t test used to calculate p-values. (G) Schematic of crispant generation and body curve analysis. (H) Quantitation of crispant body curves where bars represent mean ± s.d. for at least three independent clutches and injection mixes. The total number of embryos analyzed is given. *p<0.0001, student’s t test applied. UI – uninjected.
-
Figure 1—source data 1
Raw data for qRT-PCR and crispant body angle measurements.
- https://cdn.elifesciences.org/articles/83883/elife-83883-fig1-data1-v2.xlsx
Figure 1—figure supplement 1
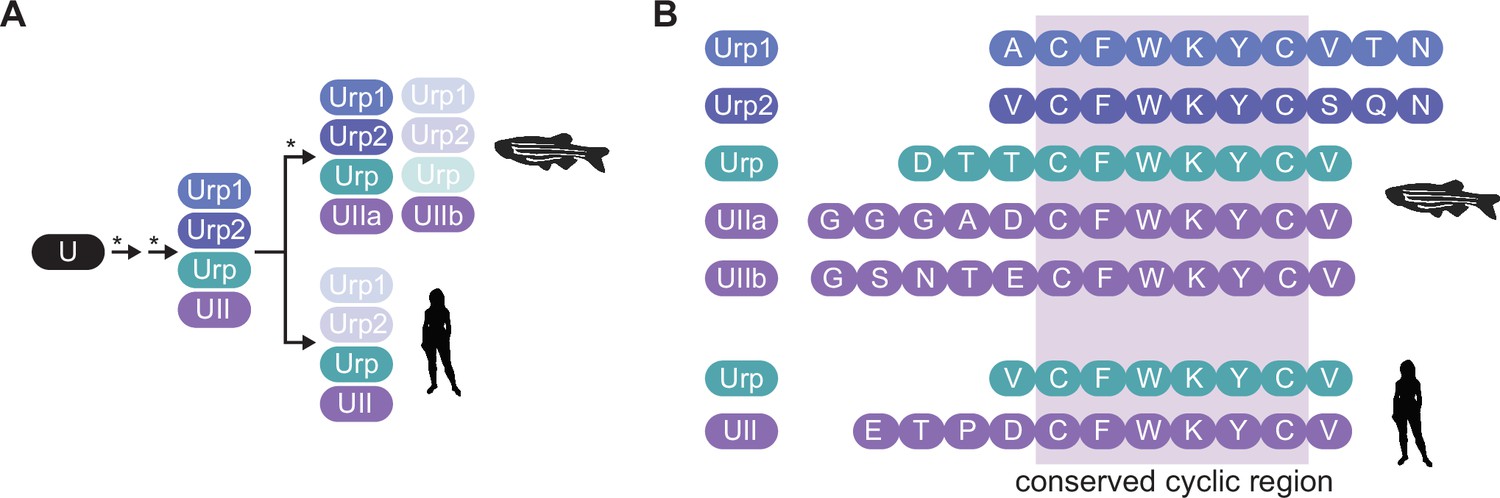
Urotensin family peptides.
(A) Successive rounds of genome duplications (*) and divergence converted an ancient urotensin protein (U) into the urotensin II (UII) and urotensin II-related (URP) proteins, some of which have subsequently been lost. (B) The UII and URP proteins in zebrafish and human are 8–12 amino acid peptides with a fully conserved hexacyclic region of sequence CFWKYC.
Figure 1—figure supplement 2
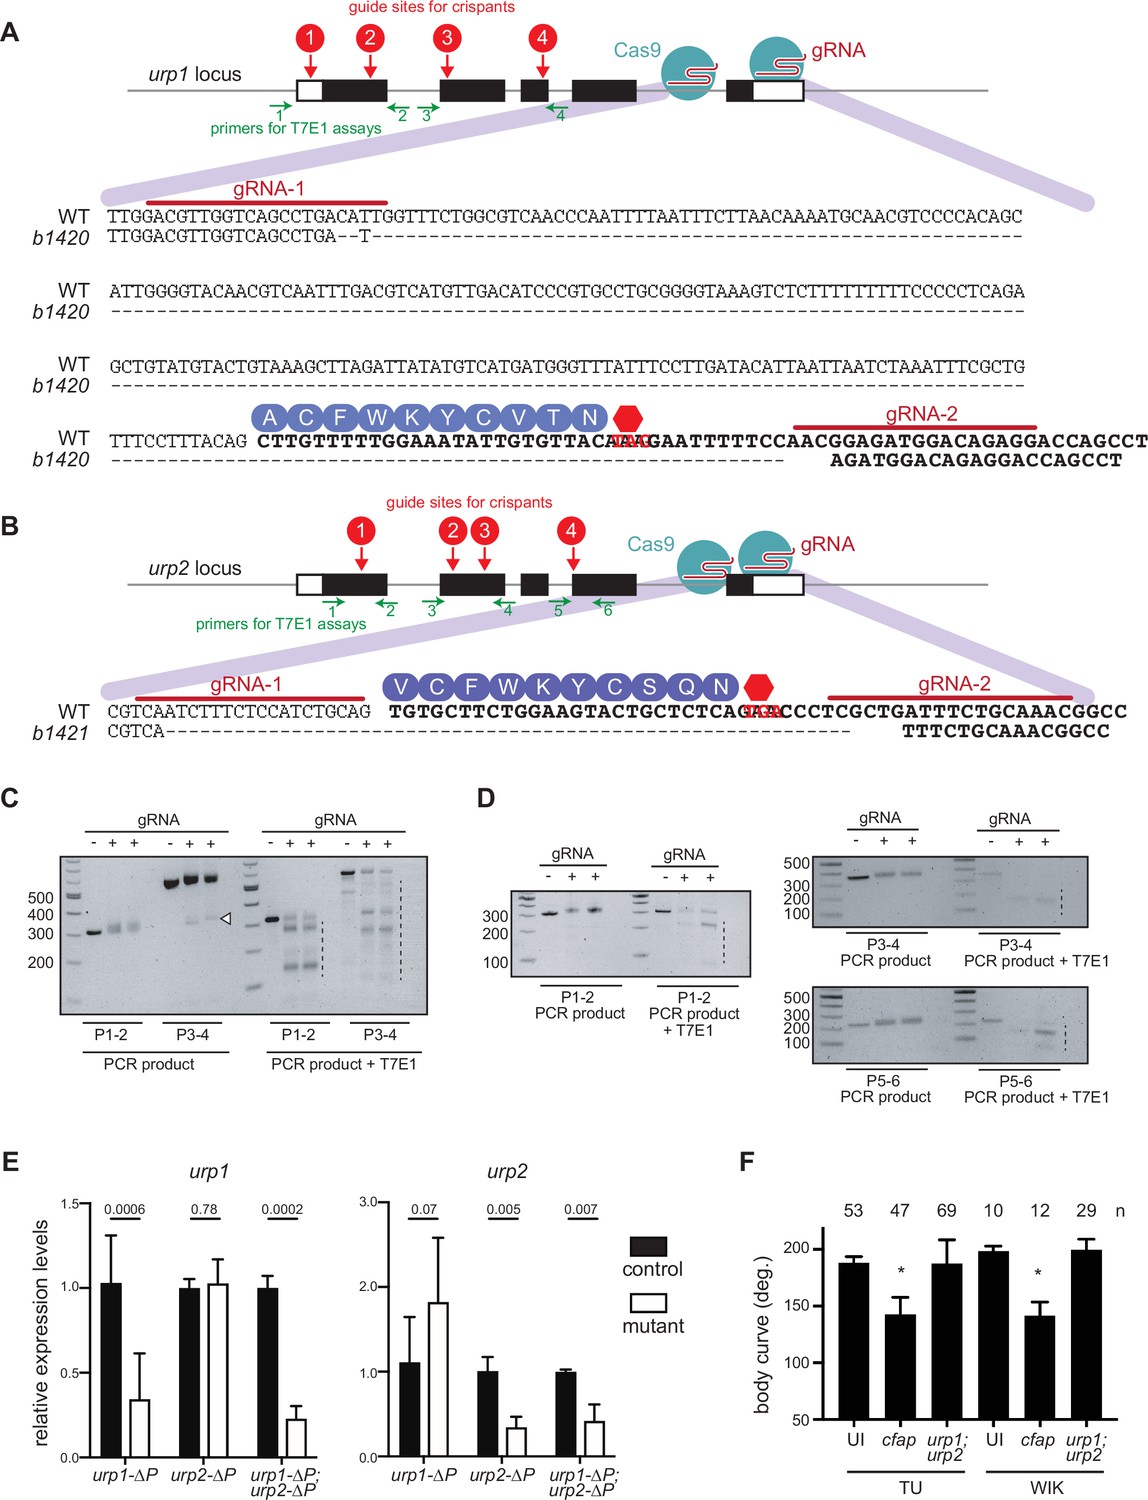
Generation of urp1∆P and urp2∆P mutants.
(A–B) Pairs of guide RNAs (gRNAs) were used to delete genomic regions coding for the Urp1 and Urp2 peptides. The urp1b1420 (urp1∆P) allele encodes a 279 bp deletion and 1 base pair insertion that removes a portion of intron 4–5 and the coding part of exon 5 including the entire region coding for the Urp1 peptide. The urp2b1421 (urp2∆P) allele encodes a 61 base pair deletion which removes the region coding for the Urp2 peptide. Red arrows show the location of gRNA sites (1–4) used to generate crispants. Green arrows show the location of PCR primers used to amplify regions around gRNA sites. (C–D) T7E1 assays show significant mutagenesis at urp1 (C) and urp2 (D) loci in crispant embryos. Embryos were injected with Cas9 only (−) or Cas9 plus gRNAs 1–4 (+) then, at 1 dpf, DNA was extracted and regions amplified using the indicated primer pairs. PCR product from crispant embryos showed wider bands, indicating insertion-deletion (indel) mutations, as well as deletion bands (white arrow head), indicating large deletions between two gRNA sites. After PCR, product was purified and subjected to digestion with T7E1, which cleaves heteroduplex DNA. Little or no cleavage was observed in Cas9 only injected embryos, but significant digestion was found in Cas9 + gRNA injected embryos (dashed lines), indicating that indels had been created. Small amounts of T7E1 digestion products in Cas9 only embryos were likely due to the presence of single nucleotide polymorphisms between chromosomes. (E) Quantitative reverse transcriptase PCR (qRT-PCR) analysis of urp1 and urp2 mRNA expression levels in urp1∆P and urp2∆P single and double mutants at 28 hpf. n>3 biologically independent samples. Bars represent mean ± s.e.m. Two-tailed student’s t test was used to calculate p-values. (F) Quantitation of crispant body curves where bars represent mean ± s.d. for at least three independent clutches and injection mixes. The total number of embryos analyzed is given. *p<0.001, student’s t test applied. UI – uninjected. cfap – cfap298.
Figure 1—figure supplement 3
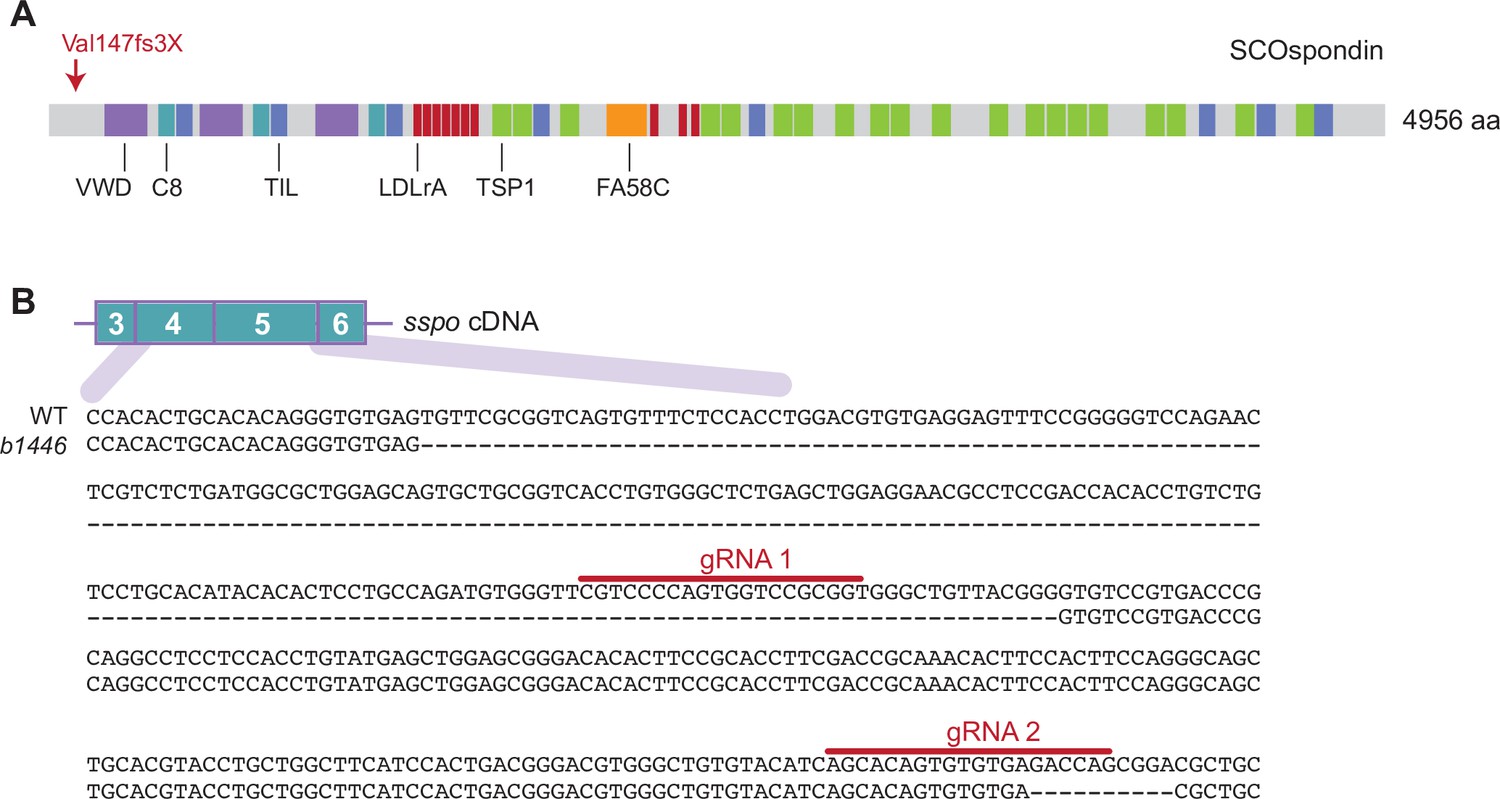
Generation of sspob1446 mutants.
(A) Schematic of zebrafish SCOspondin protein showing domain architecture based on Troutwine et al., 2020. VWD – von Willebrand factor type D domain; C8 – C8 domain; TIL – trypsin inhibitor like cysteine rich domain; LDLrA – low-density lipoprotein receptor class A domain; TSP1 – thrombospondin type 1 domain; FA58C – coagulation factor 5/8 C-terminal domain. In sspob1446 mutants, a genomic deletion results in a frame shift mutation at Valine 147 resulting in an early premature truncation codon. (B) The sspob1446 mutant line harbors a large deletion and a downstream small deletion which disrupt exons 4 and 5 causing the early truncation of Sspo.
Figure 2 with 11 supplements
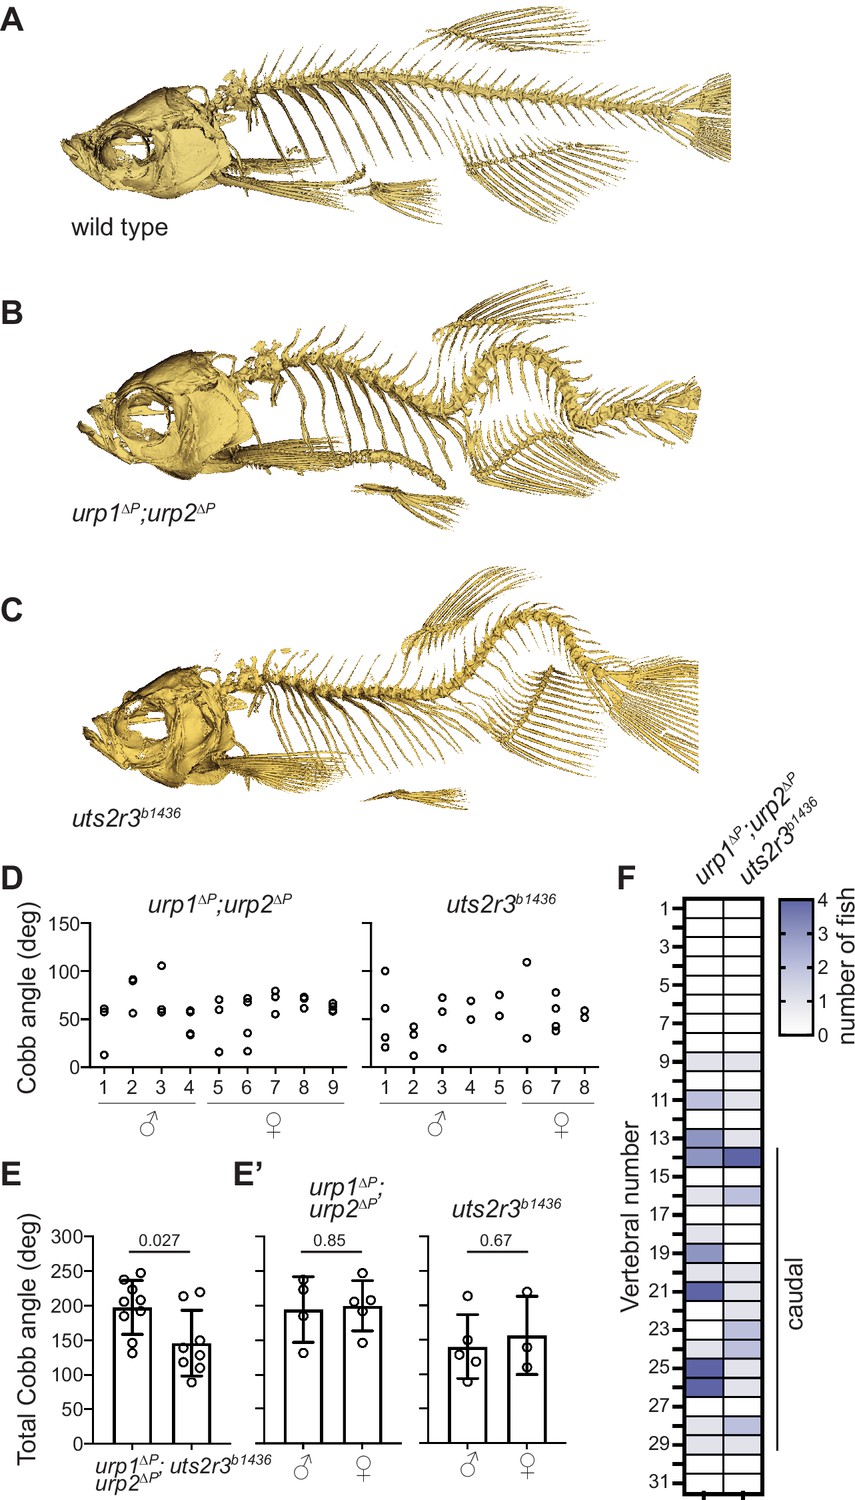
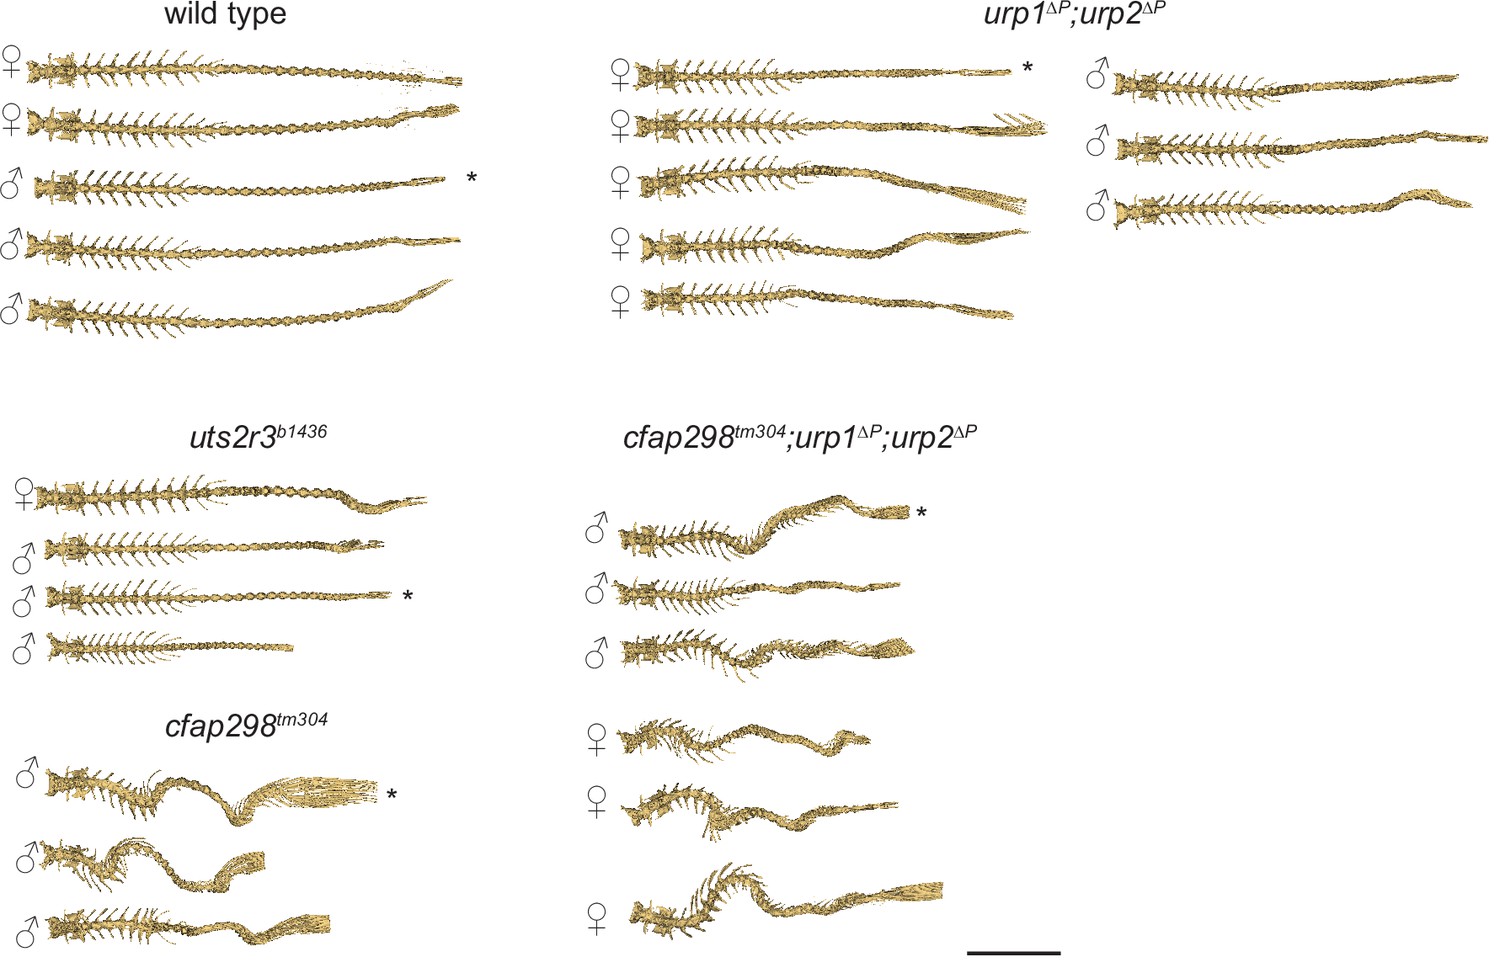
Urp1 and Urp2 are required for proper adult spine morphology.
(A–C) Lateral views of microcomputed tomography reconstitutions of wild-type (A), urp1∆P;urp2∆P (B) and uts2r3b1436 (C) mutants at 3 mpf. (D) Cobb angle measurements for individual fish in the sagittal plane for urp1∆P;urp2∆P and uts2r3b1436 mutants. Circles represent angles for individual curves. (E-E’) Total Cobb angles with each circle representing an individual fish. The mean ± s.d. is shown. (G’) is the data from G parsed for sex. p-Values are given from two-tailed unpaired student’s t tests. (F) The position of curve apex is plotted and shows that most curves are in caudal vertebrae. n=9 and 8 for urp1∆P;urp2∆P and uts2r3b1436 mutants, respectively.
-
Figure 2—source data 1
Raw data from spinal curve phenotypic measurements.
- https://cdn.elifesciences.org/articles/83883/elife-83883-fig2-data1-v2.xlsx
Figure 2—figure supplement 1
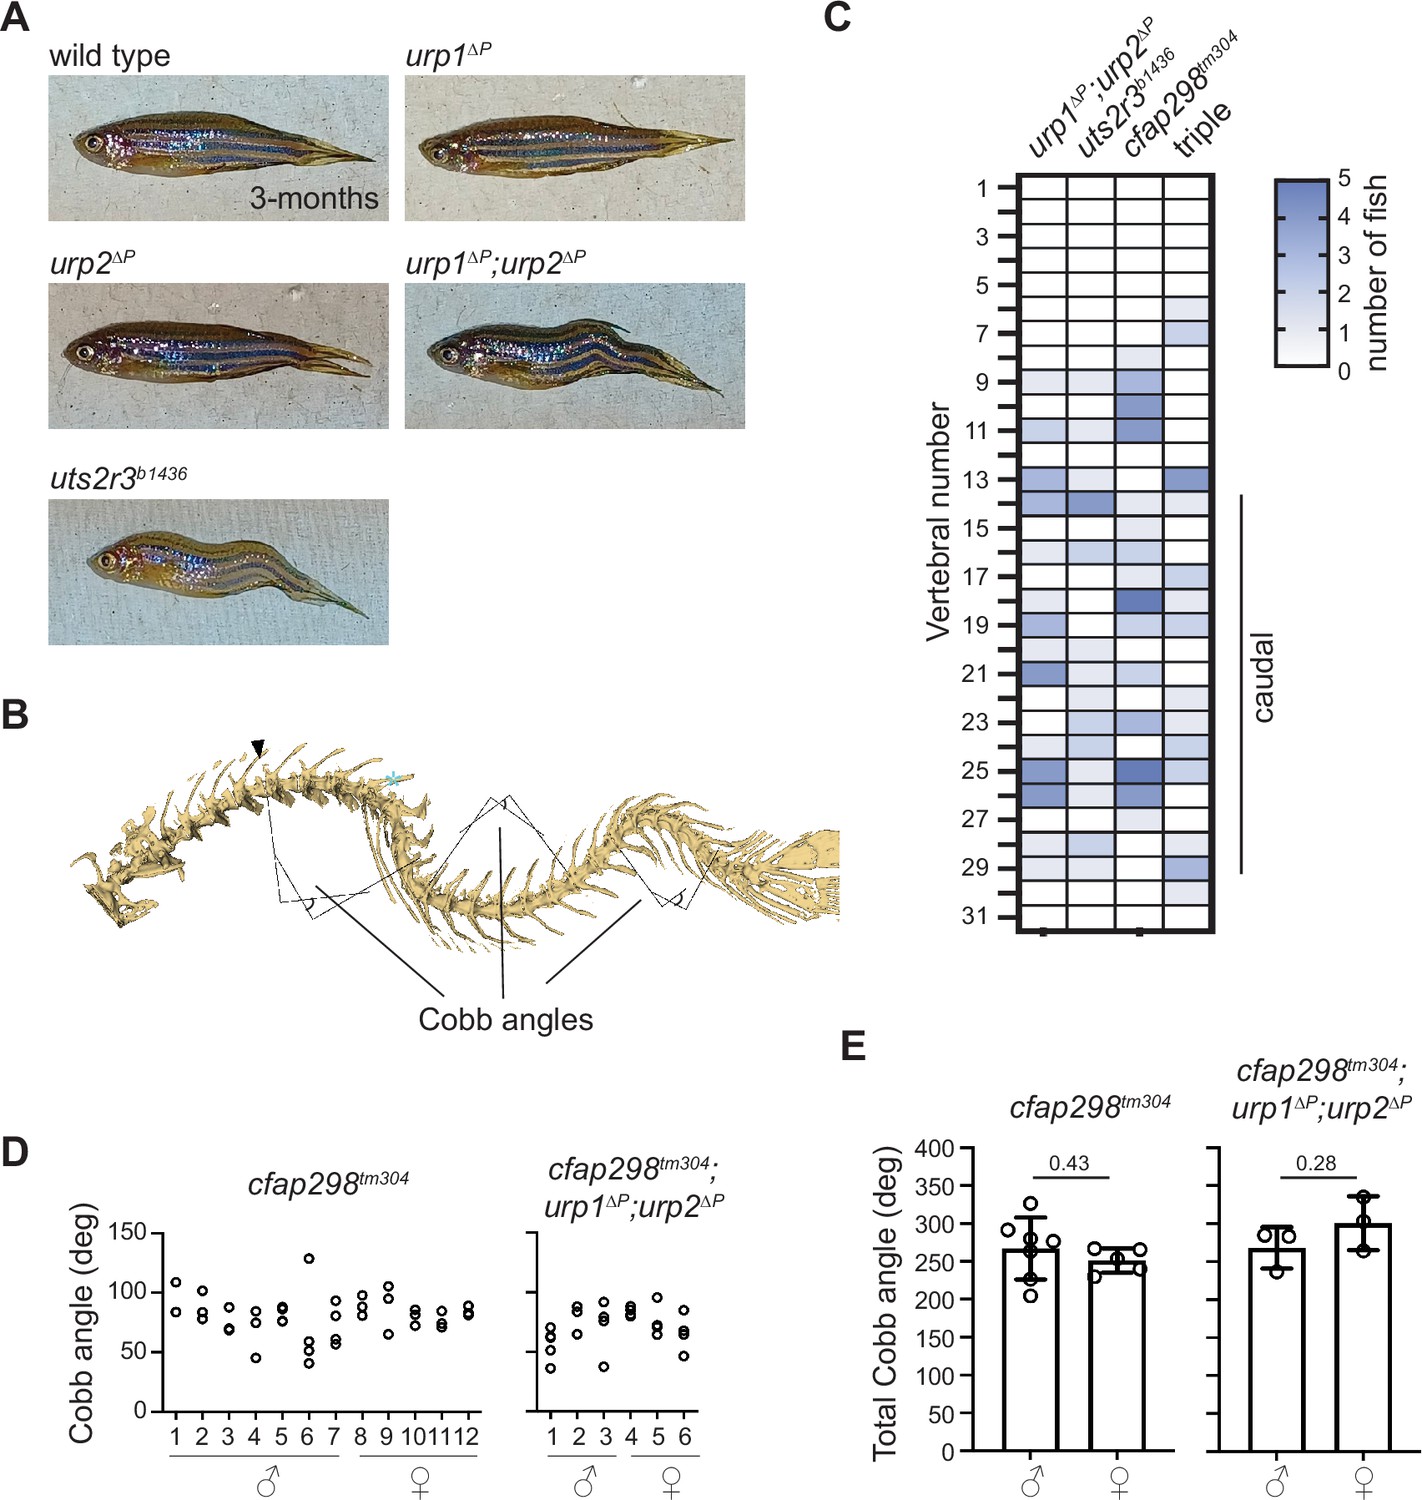
Phenotyping spinal curves.
(A) Lateral views of adult zebrafish. (B) Cobb angles were measured from lateral views of microcomputed tomography reconstitutions. Right angles are assigned parallel to the rostral and caudal face of the first and last displaced vertebra, respectively, and the external angle is taken at their intersection. The angle was assigned to its most displaced apex vertebra (cyan asterisk) in heat map representations. Note that displaced vertebrae do not always demonstrate an easily identifiable wedge in intervertebral space, as is typical in human data. In these cases, the first or last vertebrae of the curve is designated as ‘least parallel’ to the local orientation of the spine. (C) The position of curve apex is plotted for cfap298tm304 mutants and cfap298tm304;urp1∆P;urp2∆P triple mutants (triple) alongside urp1∆P;urp2∆P and uts2r3b1436 mutants for comparison. See also Figure 2F. (D) Cobb angle measurements for individual fish in the sagittal plane for cfap298tm304 and cfap298tm304;urp1∆P;urp2∆P mutants. Circles represent angles for individual curves. (E) Total Cobb angles with each circle representing an individual fish. The mean ± s.d. is shown. p-Values are given from two-tailed unpaired student’s t tests.
-
Figure 2—figure supplement 1—source data 1
Raw data from spinal curve phenotypic measurements.
- https://cdn.elifesciences.org/articles/83883/elife-83883-fig2-figsupp1-data1-v2.xlsx
Figure 2—figure supplement 2
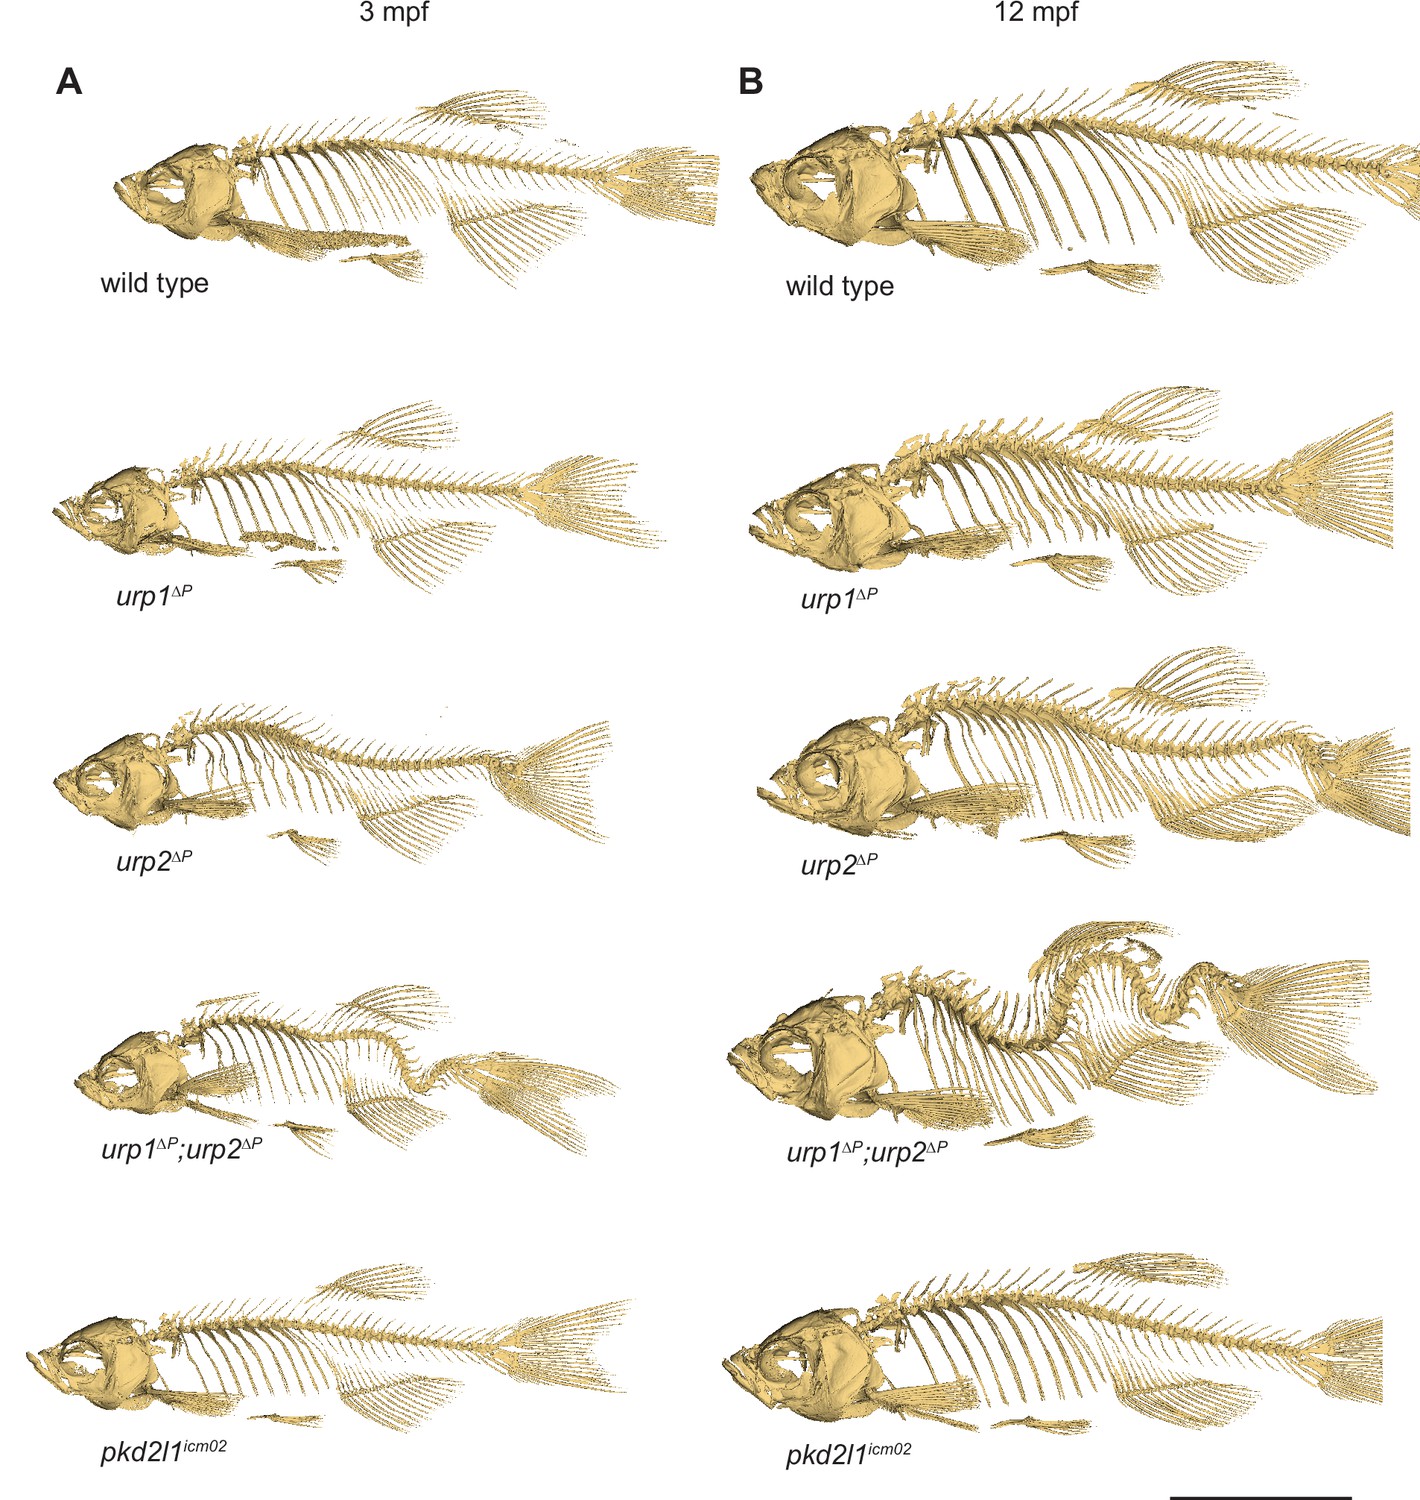
Spinal curves in urp1∆P, urp2∆P, urp1∆P;urp2∆P, and pkd2l1icm02 mutants degenerate with age.
(A–B) Lateral views of microcomputed tomography reconstituted skeletons at 3 mpf (A) and 12 mpf (B) show curves worsen with age. All fish shown are female. Scale bar: 10 mm.
Figure 2—figure supplement 3
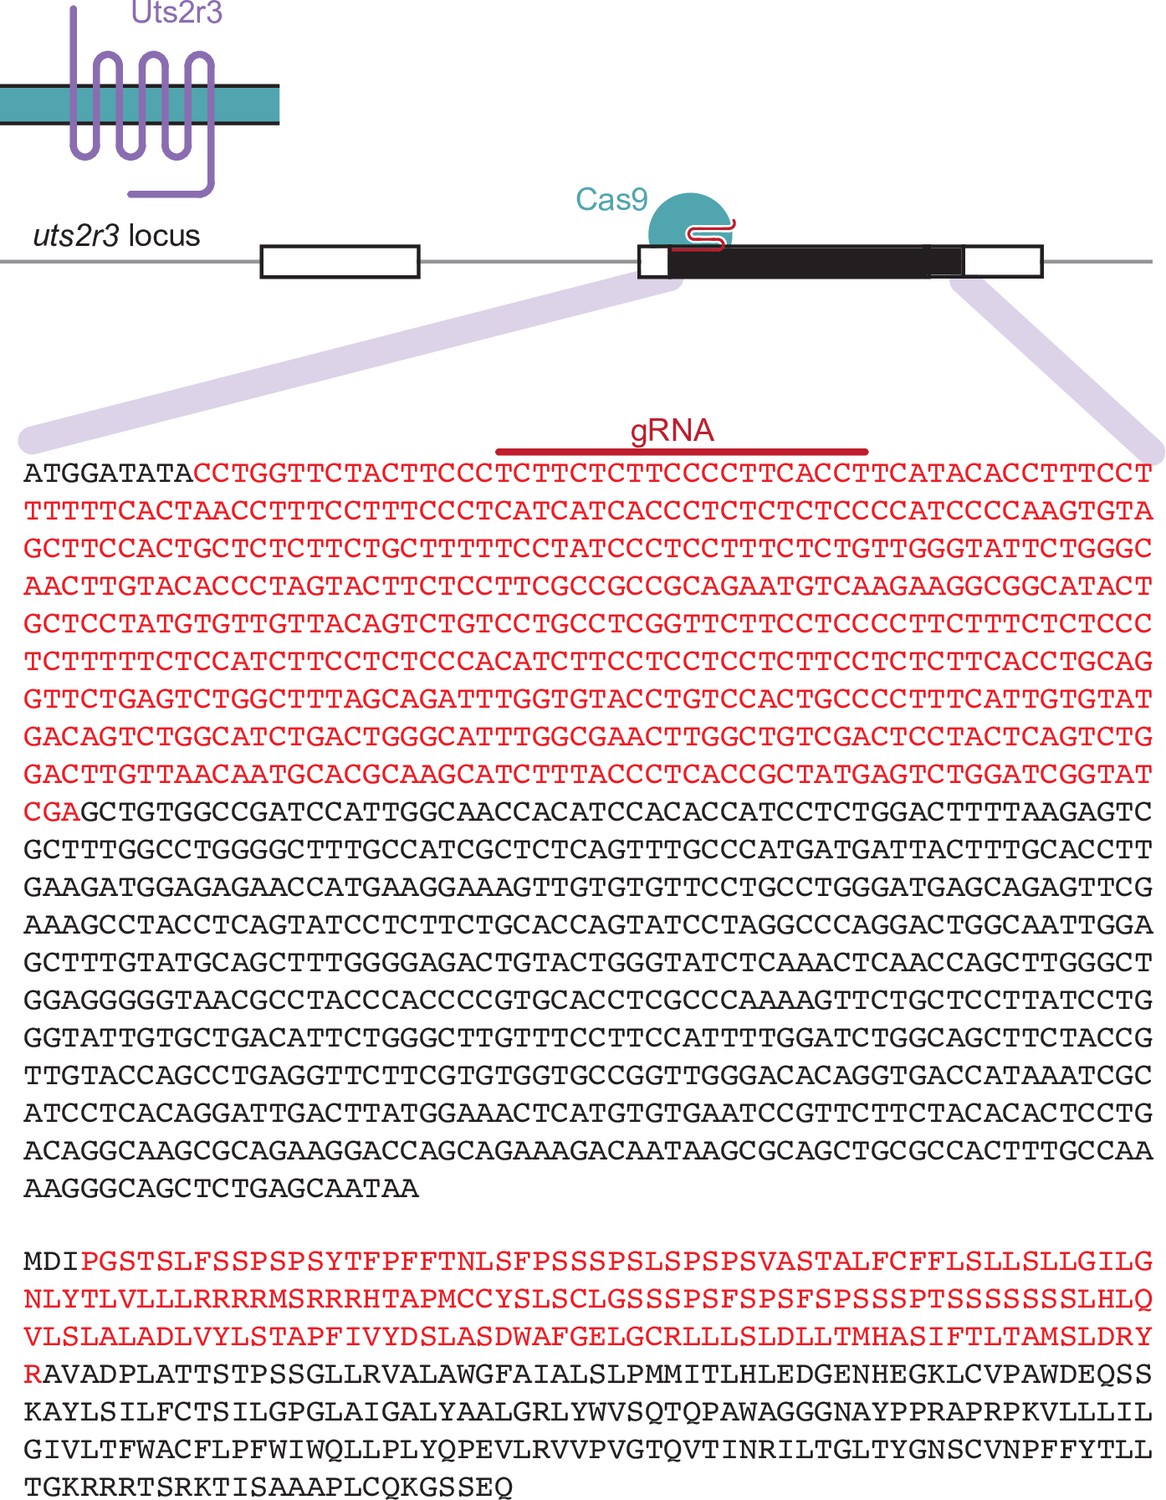
Generation of uts2r3b1436 mutants.
The uts2r3b1436 allele was generated with a single-guide RNA which induced a deletion of 534 base pairs, resulting in an in-frame 178 amino acid deletion that removes around half the protein including transmembrane regions.
Figure 2—video 1
Three-dimensional reconstitution of a 3-mpf wild-type male zebrafish.
Scans were performed using an 18-µm voxel resolution. Surface reconstructions were performed using a threshold of 3200, scales were digitally removed where necessary. The adult zebrafish spine comprised 4 Weberian vertebrae (largely obscured by the Weberian apparatus), 10 abdominal or precaudal vertebrae, 15 caudal vertebrae, and 3–4 caudal fin vertebrae. The centra exhibit an aspect ratio of approximately one, with ends aligned perpendicular to the long axis.
Figure 2—video 2
Three-dimensional reconstitution of a 3-mpf urp1∆P male zebrafish.
Scans were performed using an 18-µm voxel resolution. Surface reconstructions were performed using a threshold of 3200, scales were digitally removed where necessary.
Figure 2—video 3
Three-dimensional reconstitution of a 3-mpf urp2∆P male zebrafish.
Scans were performed using an 18-µm voxel resolution. Surface reconstructions were performed using a threshold of 3200, scales were digitally removed where necessary. Mutants demonstrate a slight caudal curve and a hook in the caudal fin vertebrae.
Figure 2—video 4
Three-dimensional reconstitution of a 3-mpf urp1∆P;urp2∆P male zebrafish.
Scans were performed using an 18-µm voxel resolution. Surface reconstructions were performed using a threshold of 3200, scales were digitally removed where necessary. Mutants exhibited planar dorsal-ventral curves in the caudal vertebrae.
Figure 2—video 5
Three-dimensional reconstitution of a 12-mpf wild-type male zebrafish.
Scans were performed using an 18-µm voxel resolution. Surface reconstructions were performed using a threshold of 3200, scales were digitally removed where necessary.
Figure 2—video 6
Three-dimensional reconstitution of a 12-mpf urp1∆P male zebrafish.
Scans were performed using an 18-µm voxel resolution. Surface reconstructions were performed using a threshold of 3200, scales were digitally removed where necessary.
Figure 2—video 7
Three-dimensional reconstitution of a 12-mpf urp2∆P male zebrafish.
Scans were performed using an 18-µm voxel resolution. Surface reconstructions were performed using a threshold of 3200, scales were digitally removed where necessary.
Figure 2—video 8
Three-dimensional reconstitution of a 3-mpf uts2r3b1436 male zebrafish.
Scans were performed using an 18-µm voxel resolution. Surface reconstructions were performed using a threshold of 3200, scales were digitally removed where necessary. Mutants exhibited planar dorsal-ventral curves in the caudal vertebrae.
Figure 3 with 3 supplements
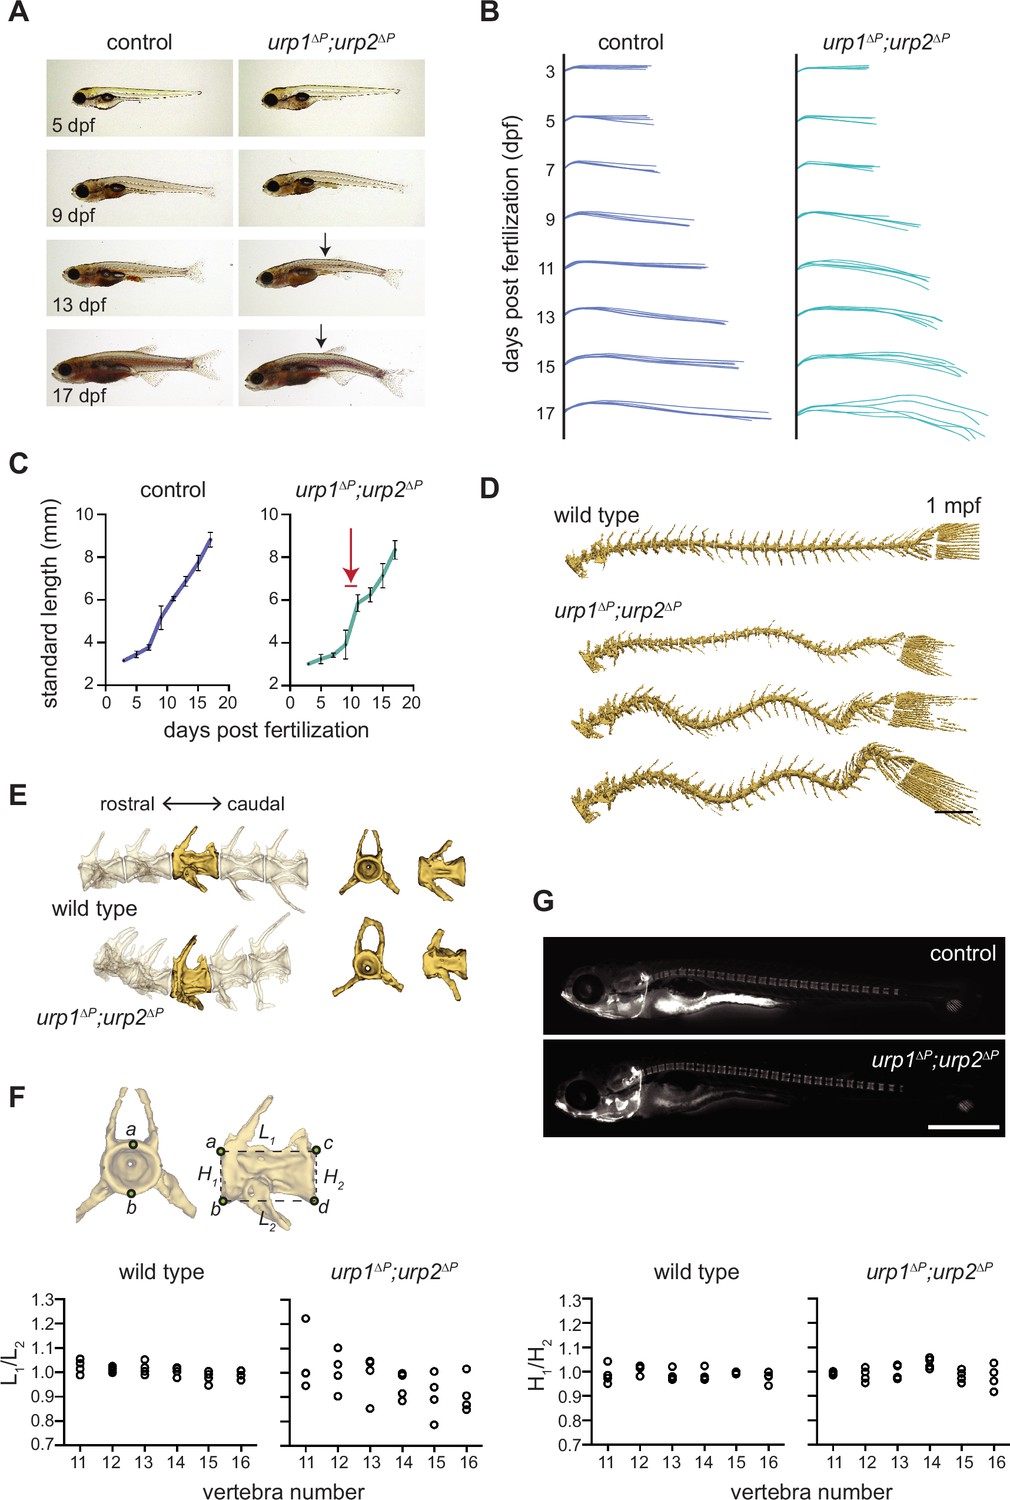
urp1∆P;urp2∆P mutants exhibit adolescent-onset spinal curves without significant structural vertebral defects.
(A) Lateral views of control fish and age-matched urp1∆P;urp2∆P mutants. Arrows point to forming body curves. (B) Traces of body shape every 2 days for 5 fish per time point from 3 to 17 dpf. (C) Growth curves for control and urp1∆P;urp2∆P mutants were indistinguishable. Arrow shows time of curve onset. Mean ± s.d. is plotted. (D) Microcomputed tomography (µCT) reconstitutions of spines at 1 mpf with heads, fins, and ribs digitally removed. Scale bar: 1 mm. (E) µCT reconstitutions of three pre-caudal and two caudal vertebrae including frontal and lateral views of the highlighted vertebra. No major structural defects such as fusions were observed in urp1∆P;urp2∆P mutants. (F) Vertebral body rostral-caudal length (L1/L2) and dorsal-ventral height (H1/H2) aspect ratios for six vertebrae of wild type (n=4) and urp1∆P;urp2∆P mutants (n=4). Length aspect ratios were significantly more variable in mutants, but height aspect ratios were unchanged (p=0.022 and 0.745, respectively, Bartlett’s test for equal variances). (G) Calcein staining revealed well-structured vertebrae forming in control (standard length 5.7 mm) and urp1∆P;urp2∆P mutant (standard length 5.7 mm) fish. n>30 fish per condition.
-
Figure 3—source data 1
Raw data from larval growth measurements and vertebral quantitation.
- https://cdn.elifesciences.org/articles/83883/elife-83883-fig3-data1-v2.xlsx
Figure 3—figure supplement 1
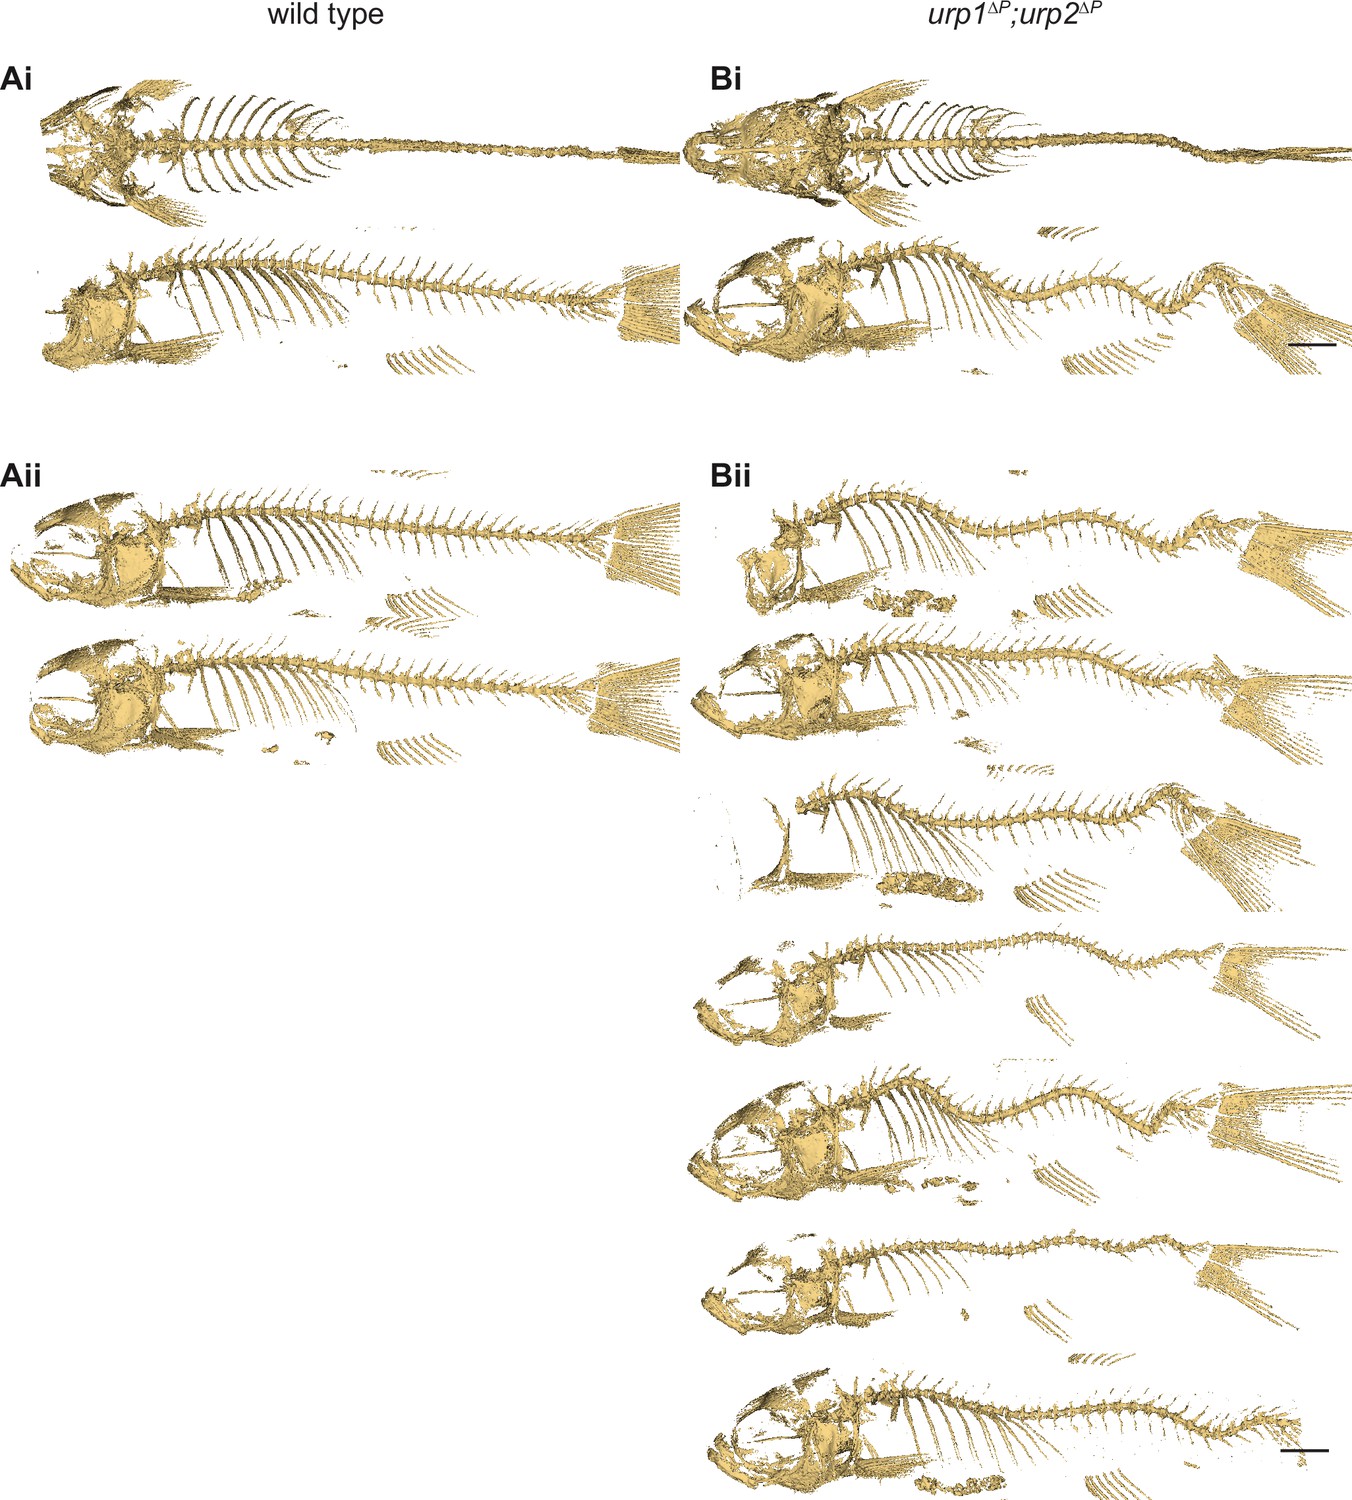
Spinal curves are variable in 1 mpf urp1∆P;urp2∆P mutants.
(Ai-Bi) Dorsal and lateral views of microcomputed tomography (µCT) reconstitutions of wild type and urp1∆P;urp2∆P mutants at 1 mpf. (Aii-Bii) Lateral views of additional examples of µCT reconstitutions. The position of curve apex is variable, with 5 of 7 urp1∆P;urp2∆P mutants exhibiting pre-caudal curves. Note that dorsal fins were digitally dissected for clarity. Scale bars: 1 mm.
Figure 3—video 1
Time course of juvenile development in wild-type and urp1∆P;urp2∆P siblings.
Fish were imaged every other day over a 2.5-week period.
Figure 3—video 2
Vertebral reconstitutions from wild-type, urp1∆P;urp2∆P and uts2r3b1436 adults.
Alternating vertebrae are shown at 25% transparency to highlight subtle vertebral shape defects, including a reduced length and slight changes to length aspect ratios.
Figure 4 with 5 supplements

urp1∆P;urp2∆P mutants and cfap298tm304 mutants are phenotypically distinct.
(A–D) Lateral views of microcomputed tomography (µCT) reconstitutions of wild-type (A), cfap298tm304 mutants (B), urp1∆P;urp2∆P double mutants (C), and cfap298tm304;urp1∆P;urp2∆P triple mutants (D). All fish shown are female. Scale bar: 10 mm. (E) Total Cobb angles with each circle representing an individual fish. The mean ± s.d. is shown. p-Values are given from two-tailed unpaired student’s t tests. U — urp1∆P;urp2∆P double mutants; C — cfap298tm304 mutants; UC — cfap298tm304;urp1∆P;urp2∆P triple mutants. (Fi) Dorsal views of µCT reconstitutions with ribs and fins removed. Scale bar: 5 mm. (Fii) Quantitation of degree of lateral curvature for wild type (n=5) and urp1∆P;urp2∆P (n=8), uts2r3b1436 (n=3), cfap298tm304 (n=3), and cfap298tm304;urp1∆Purp2∆P (n=6) mutants. y-axis is the arbitrary units.
-
Figure 4—source data 1
Raw data for quantition of spinal phenotypes.
- https://cdn.elifesciences.org/articles/83883/elife-83883-fig4-data1-v2.xlsx
Figure 4—figure supplement 1
Analysis of lateral curvature.
Dorsal views of microcomputed tomography reconstituted spines from wild type and mutants at 3 mpf. Asterisks refer to spines shown in Figure 4Fi. Scale bar: 5 mm.
Figure 4—video 1
Three-dimensional reconstitution of a 3-mpf cfap298tm304 male zebrafish.
Scans were performed using an 18-µm voxel resolution. Surface reconstructions were performed using a threshold of 3200, scales were digitally removed where necessary. Mutants develop severe three-dimensional spinal curves in precaudal and caudal vertebrae.
Figure 4—video 2
Three-dimensional reconstitution of a 3-mpf cfap298tm304;urp1∆P;urp2∆P male zebrafish.
Scans were performed using an 18-µm voxel resolution. Surface reconstructions were performed using a threshold of 3200, scales were digitally removed where necessary.
Figure 4—video 3
Three-dimensional reconstitution of a 3-mpf pkd2l1icm02 male zebrafish.
Scans were performed using an 18-µm voxel resolution. Surface reconstructions were performed using a threshold of 3200, scales were digitally removed where necessary.
Figure 4—video 4
Three-dimensional reconstitution of a 12-mpf pkd2l1icm02 male zebrafish.
Scans were performed using an 18-µm voxel resolution. Surface reconstructions were performed using a threshold of 3200, scales were digitally removed where necessary.
Figure 5

Reissner fiber (RF) breakdown in cfap298tm304 mutants but not urotensin-deficient mutants.
(A–F) Grayscale maximal intensity projection of Sspo-GFP localization in the central canal in 28 hpf embryos (A–C) and 12 dpf adolescents (D–F). RF is denoted by arrow heads in D and F. Arrows point to structures along the central canal that become GFP-positive in cfap298tm304 and uts2r3b1436 mutants. Scale bar: 10 µm. (G) Schematic of temperature shift experiment in which cfap298tm304 mutants are initially raised at permissive temperatures before being shifted to restrictive temperatures at 6 dpf, then imaged at 12 dpf. (H–I) Lateral views of cfap298tm304 (H) and uts2r3b1436 (I) mutants at 12 dpf when Sspo-GFP imaging took place. The white box in H shows the location imaged in D–F.
Tables
Appendix 1—key resources table
| Reagent type (species) or resource | Designation | Source or reference | Identifiers | Additional information |
|---|---|---|---|---|
| Commercial assay, kit | DNA Clean and Concentrator Kit | Zymo Research | Cat no: D4013 | |
| Commercial assay, kit | RNA Clean and Concentrator Kit | Zymo Research | Cat no: R1016 | |
| Commercial assay, kit | Direct-zol RNA MiniPrep Kit | Zymo Research | Cat no: R2050 | |
| Commercial assay, kit | GeneJET Gel Extraction Kit | Thermo Fisher Scientific | Cat no: K0691 | |
| Commercial assay, kit | High Capacity RNA-to-cDNA Kit | Thermo Fisher Scientific | Cat no: 4387406 | |
| Commercial assay, kit | MEGAshortscript T7 Transcription Kit | Thermo Fisher Scientific | Cat no: AM1354 | |
| Commercial assay, kit | HiScribe T7 High Yield RNA Synthesis Kit | New England Biolabs | Cat no: E2040 | |
| Commercial assay, kit | FS DNA Library Prep Kit for Illumina | New England Biolabs | Cat no: E7805 | |
| Commercial assay, kit | HCR-RNA FISH Hybridization Buffer | Molecular Instruments | ||
| Commercial assay, kit | T7 Endonuclease I | New England Biolabs | Cat no: E3321 | |
| Commercial assay, kit | HCR-RNA FISH Amplification Buffer | Molecular Instruments | ||
| Commercial assay, kit | AlexaFluor-647 Hairpins | Molecular Instruments | ||
| Commercial assay, kit | AlexaFluor-546 Hairpins | Molecular Instruments | ||
| Commercial assay, kit | AlexaFluor-488 Hairpins | Molecular Instruments | ||
| Commercial assay, kit | urp1 HCR-RNA FISH probe | Molecular Instruments | Project-specific design | |
| Commercial assay, kit | urp2 HCR-RNA FISH probe | Molecular Instruments | Project-specific design | |
| Commercial assay, kit | pkd2l1 HCR-RNA FISH probe | Molecular Instruments | Project-specific design | |
| Commercial assay, kit | Taq Polymerase | New England Biolabs | Cat no: M0273 | |
| Commercial assay, kit | TURBO DNase | Thermo Fisher Scientific | Cat no: AM2238 | |
| Commercial assay, kit | Phusion High-Fidelity DNA Polymerase | New England Biolabs | Cat no: M0530 | |
| Commercial assay, kit | Phusion High-Fidelity PCR Master Mix | New England Biolabs | Cat no: M0531 | |
| Commercial assay, kit | SYBR Green PCR Master Mix | Thermo Fisher Scientific | Cat no: 4309155 | |
| Strain, strain background (Danio rerio) | AB strain | University of Oregon | ||
| Strain, strain background (D. rerio) | WIK strain | University of Oregon | ||
| Strain, strain background (D. rerio) | TU strain | University of Oregon | ||
| Strain, strain background (D. rerio) | cfap298tm304 line | Jaffe et al., 2016 | ZDB-FISH-150901–23024 | |
| Strain, strain background (D. rerio) | pkd2l1icm02 line | Sternberg et al., 2018 | ZDB-FISH-160811–9 | |
| Strain, strain background (D. rerio) | sspob1446 line | This study | Figure 1—figure supplement 3 | |
| Strain, strain background (D. rerio) | sspo-GFPut24 line | Troutwine et al., 2020 | ZDB-FISH-190313–20 | |
| Strain, strain background (D. rerio) | urp1b1420 line | This study | Figure 1—figure supplement 2 | |
| Strain, strain background (D. rerio) | urp2b1421 line | This study | Figure 1—figure supplement 2 | |
| Strain, strain background (D. rerio) | uts2r3b1436 line | This study | Figure 2—figure supplement 3 | |
| Software, algorithm | 3D Slicer | Fedorov et al., 2012 | ||
| Software, algorithm | IMARIS 9.9 | Oxford Instruments | ||
| Software, algorithm | NIS-Elements | Nikon Instruments Inc | ||
| Software, algorithm | ZEN Software | Carl Zeiss AG | ||
| Software, algorithm | QuantStudio Design and Analysis Software | Applied Biosystems | ||
| Software, algorithm | Integrated Genome Viewer (version 2.13.1) | Robinson et al., 2011 | ||
| Sequence-based reagent | Bottom strand ultramer_1 | This study | Tail ultramer for generating singe gRNA oligos | AAAAGCACCGACTCG GTGCCACTTTTTC AAGTTGATAACGGACT AGCCTTATTTT AACTTGCTAT |
| Sequence-based reagent | urp1_gRNA_1 | This study | gRNA_1 oligo for generating urp1b1420 line | taatacgactcactataGGCGT TGGTCAGCCTGACAT gttttagagctagaa |
| Sequence-based reagent | urp1_gRNA_2 | This study | gRNA_2 oligo for generating urp1b1420 line | taatacgactcactataGGG TCCTCTGTCCATCTCCG gttttagagctagaa |
| Sequence-based reagent | urp2_gRNA_1 | This study | gRNA_1 oligo for generating urp2b1421 line | taatacgactcactataGGCA GATGGAGAAAGATTGA gttttagagctagaa |
| Sequence-based reagent | urp2_gRNA_2 | This study | gRNA_2 oligo for generating urp2b1421 line | taatacgactcactataGGC GTTTGCAGAAATCAGCG gttttagagctagaa |
| Sequence-based reagent | uts2r3_gRNA | This study | gRNA oligo for generating uts2r3b1436 line | taatacgactcactataGGG TGAAGGGGAAGAGAAGA gttttagagctagaa |
| Sequence-based reagent | sspo_gRNA_1 | This study | gRNA_1 oligo for generating sspob1446 line | taatacgactcactataGGT CCCCAGTGGTCCGCG GTgttttagagctagaa |
| Sequence-based reagent | sspo_gRNA_2 | This study | gRNA_2 oligo for generating sspob1446 line | taatacgactcactataGGCAC AGTGTGTGAGACCAG gttttagagctagaa |
| Sequence-based reagent | Bottom strand ultramer_2 | This study | Tail ultramer for generating multiplexed gRNA oligos | AAAAGCACCGACTCGG TGCCACTTTTTC AAGTTGATAA CGGACTAGCCTTATT TTAACTTGCTATTTC TAGCTCTAAAAC |
| Sequence-based reagent | urp1_F0_gRNA_1 | Wu et al., 2018 | gRNA_1 oligo for generating urp1 F0 embryos | TAATACGACTCACTAT AGGAAAGTGAAGAT CGCGGCCGTTTTAG AGCTAGAAATAGC |
| Sequence-based reagent | urp1_F0_gRNA_2 | Wu et al., 2018 | gRNA_2 oligo for generating urp1 F0 embryos | TAATACGACTCACT ATAGGACACGG CTCTGCC ACAACGTTTTAGA GCTAGAAATAGC |
| Sequence-based reagent | urp1_F0_gRNA_3 | Wu et al., 2018 | gRNA_3 oligo for generating urp1 F0 embryos | TAATACGACTCACTA TAGGTTCAGAAGC TGGTAGCAGGTTTTA GAGCTAGAAATAGC |
| Sequence-based reagent | urp1_F0_gRNA_4 | Wu et al., 2018 | gRNA_4 oligo for generating urp1 F0 embryos | TAATACGACTCACT ATAGGGAAAATAAAT AACATGGTGTTTTA GAGCTAGAAATAGC |
| Sequence-based reagent | urp2_F0_gRNA_1 | Wu et al., 2018 | gRNA_1 oligo for generating urp2 F0 embryos | TAATACGACTCACTA TAGGTGACTGTCGC TTCAATCGGTTTTAG AGCTAGAAATAGC |
| Sequence-based reagent | urp2_F0_gRNA_2 | Wu et al., 2018 | gRNA_2 oligo for generating urp2 F0 embryos | TAATACGACTCACT ATAGGGACATTTCCT GACGGAGAGTTTTA GAGCTAGAAATAGC |
| Sequence-based reagent | urp2_F0_gRNA_3 | Wu et al., 2018 | gRNA_3 oligo for generating urp2 F0 embryos | TAATACGACTCACTA TAGGTGGACACGA GGAGACCGAGTTTT AGAGCTAGAAATAGC |
| Sequence-based reagent | urp2_F0_gRNA_4 | Wu et al., 2018 | gRNA_4 oligo for generating urp2 F0 embryos | TAATACGACTCACT ATAGGTCACCAGGTAG TGACGGAGTTTTAG AGCTAGAAATAGC |
| Sequence-based reagent | sspo_F0_gRNA_1 | Wu et al., 2018 | gRNA_1 oligo for generating sspo F0 embryos | TAATACGACTCACT ATAGGTTCGTCCCC AGTGGTCCGGTTTT AGAGCTAGAAATAGC |
| Sequence-based reagent | sspo_F0_gRNA_2 | Wu et al., 2018 | gRNA_2 oligo for generating sspo F0 embryos | TAATACGACTCACT ATAGGAAACGG CCGTCAGTGTCGGT TTTAGAGCTAGAAATAGC |
| Sequence-based reagent | sspo_F0_gRNA_3 | Wu et al., 2018 | gRNA_3 oligo for generating sspo F0 embryos | TAATACGACTCAC TATAGGTGTTGC AACACCAACCGGGT TTTAGAGCTAGAAATAGC |
| Sequence-based reagent | sspo_F0_gRNA_4 | Wu et al., 2018 | gRNA_4 oligo for generating sspo F0 embryos | TAATACGACTCACT ATAGGAGCCTAGACC TGCTCACGGTTTTA GAGCTAGAAATAGC |
| Sequence-based reagent | cfap298_F0_gRNA_1 | Wu et al., 2018 | gRNA_1 oligo for generating cfap298 F0 embryos | TAATACGACTCAC TATAGGTTCTCTT CAACACTACGGGT TTTAGAGCTAGAAATAGC |
| Sequence-based reagent | cfap298_F0_gRNA_2 | Wu et al., 2018 | gRNA_2 oligo for generating cfap298 F0 embryos | TAATACGACTCAC TATAGGGCTCC ACAATCTGATCATG TTTTAGAGCTA GAAATAGC |
| Sequence-based reagent | cfap298_F0_gRNA_3 | Wu et al., 2018 | gRNA_3 oligo for generating cfap298 F0 embryos | TAATACGACTCAC TATAGGCATTC TTATTGGATCATGG TTTTAGAGCTA GAAATAGC |
| Sequence-based reagent | cfap298_F0_gRNA_4 | Wu et al., 2018 | gRNA_4 oligo for generating cfap298 F0 embryos | TAATACGACTCACT ATAGGTCTCTGG CAGGTGCGCCCGTT TTAGAGCTAGAAATAGC |
| Sequence-based reagent | pkd2l1_geno_1 | Sternberg et al., 2018 | pkd2l1icm02 genotyping oligo 1 | TGTGTGCTAGG ACTGTGGGG |
| Sequence-based reagent | pkd2l1_geno_2 | Sternberg et al., 2018 | pkd2l1icm02 genotyping oligo 2 | AGGGCAAGAGAA TGGCAAGACG |
| Sequence-based reagent | urp1_geno_1 | This Study | urp1b1420 genotyping oligo 1 | GCACCCAAAAT CCAACGACT |
| Sequence-based reagent | urp1_geno_2 | This Study | urp1b1420 genotyping oligo 2 | TGTATGGGGAA AACAAAGGCA |
| Sequence-based reagent | urp2_geno_1 | This Study | urp2b1421 genotyping oligo 1 | TTGGGGTTGT AACAGGTAGTG |
| Sequence-based reagent | urp2_geno_2 | This Study | urp2b1421 genotyping oligo 2 | AACAAGGAAGA CGCTGCAAG |
| Sequence-based reagent | uts2r3_geno_1 | This Study | uts2r3b1436 genotyping oligo 1 | ATGGATCCCC TGATGTCCTG |
| Sequence-based reagent | uts2r3_geno_2 | This Study | uts2r3b1436 genotyping oligo 2 | TCGAACTCTGC TCATCCCAG |
| Sequence-based reagent | sspo_geno_1 | This Study | sspob1446 genotyping oligo 1 | CGCAAACACTT CCACTTCCA |
| Sequence-based reagent | sspo_geno_2 | This Study | sspob1446 genotyping oligo 2 | TTGAAGCCAGATGT AAAGGATGAGTGT |
| Sequence-based reagent | urp1_gRNA1+2_T7E1_F | This Study | Forward primer to amplify genomic DNA for T7E1 assay in crispants | GACAGCGCAC CCTTAATTGT |
| Sequence-based reagent | urp1_gRNA1+2_T7E1_R | This Study | Reverse primer to amplify genomic DNA for T7E1 assay in crispants | ACATTTAGCCTT AACAAGCACAA |
| Sequence-based reagent | urp1_gRNA3+4_T7E1_F | This Study | Forward primer to amplify genomic DNA for T7E1 assay in crispants | CAGACAAGGG AACAGAGAGGA |
| Sequence-based reagent | urp1_gRNA3+4_T7E1_R | This Study | Reverse primer to amplify genomic DNA for T7E1 assay in crispants | CCACTGCTTTTA AATCATCCACC |
| Sequence-based reagent | urp2_gRNA1_T7E1_F | This Study | Forward primer to amplify genomic DNA for T7E1 assay in crispants | ATCTTAGAGG CGCATTGGTG |
| Sequence-based reagent | urp2_gRNA1_T7E1_R | This Study | Reverse primer to amplify genomic DNA for T7E1 assay in crispants | GCATGAGGCG GTTTGTTTTG |
| Sequence-based reagent | urp2_gRNA2+3_T7E1_F | This Study | Forward primer to amplify genomic DNA for T7E1 assay in crispants | TGAAGCAACT GAGGAGCAAA |
| Sequence-based reagent | urp2_gRNA2+3_T7E1_R | This Study | Reverse primer to amplify genomic DNA for T7E1 assay in crispants | ACAGTACAGTT CAGCACACCT |
| Sequence-based reagent | urp2_gRNA4_T7E1_F | This Study | Forward primer to amplify genomic DNA for T7E1 assay in crispants | TGACCTATACATC AAAGCCAAGG |
| Sequence-based reagent | urp2_gRNA4_T7E1_R | This Study | Reverse primer to amplify genomic DNA for T7E1 assay in crispants | CCTGGGCTGA TCATACCTCT |
| Sequence-based reagent | rpl13_qPCR_F | This Study | Forward primer for quantitative RT-PCR | TAAGGACGGAG TGAACAACCA |
| Sequence-based reagent | rpl13_qPCR_R | This Study | Reverse primer for quantitative RT-PCR | CTTACGTCTGC GGATCTTTCTG |
| Sequence-based reagent | urp1_qPCR_F | This Study | Forward primer for quantitative RT-PCR | ACATTCTGG CTGTGGTTTG |
| Sequence-based reagent | urp1_qPCR_R | This Study | Reverse primer for quantitative RT-PCR | GTCCGTCTTCA ACCTCTGCTAC |
| Sequence-based reagent | urp2_qPCR_F | This Study | Forward primer for quantitative RT-PCR | AGAGGAAACA GCAATGGACG |
| Sequence-based reagent | urp2_qPCR_R | This Study | Reverse primer for quantitative RT-PCR | TGTTGGTTTTG GTTGACG |
Author response table 1
| 3-months | 12-months | Position of curve | |
|---|---|---|---|
| urp1∆P | no curves | mild D/V curves | Mostly caudal |
| urp2∆P | mild D/V curves | intermediate D/V curves | Mostly caudal |
| urp1∆P;urp2∆P | severe D/V curves | severe D/V curves | Mostly caudal |
| uts2r3b1436 | severe D/V curves | severe D/V curves | Mostly caudal |
| cfap298tm304 | severe 3D curves | severe 3D curves | Caudal and pre-caudal |
| pkd2l1icm02 | no curves | very mild D/V curves | Mostly pre-caudal |
Additional files
Download links
A two-part list of links to download the article, or parts of the article, in various formats.
Downloads (link to download the article as PDF)
Open citations (links to open the citations from this article in various online reference manager services)
Cite this article (links to download the citations from this article in formats compatible with various reference manager tools)
Urotensin II-related peptides, Urp1 and Urp2, control zebrafish spine morphology
eLife 11:e83883.
https://doi.org/10.7554/eLife.83883


