Calcium and bicarbonate signaling pathways have pivotal, resonating roles in matching ATP production to demand
- Center for Biomedical Engineering and Technology, University of Maryland School of Medicine, United States
- Department of Physiology, University of Marylan School of Medicine, United States
- Claude D. Pepper Older Americans Independence Center, University of Maryland School of Medicine, United States
- Department of Biochemistry and Molecular Biology, University of Maryland School of Medicine, United States
- Marlene and Stewart Greenebaum Comprehensive Cancer Center, University of Maryland Baltimore School of Medicine, United States
- Division of Cardiovascular Medicine, Department of Medicine, University of Maryland School of Medicine, United States
Figures
Figure 1 with 1 supplement
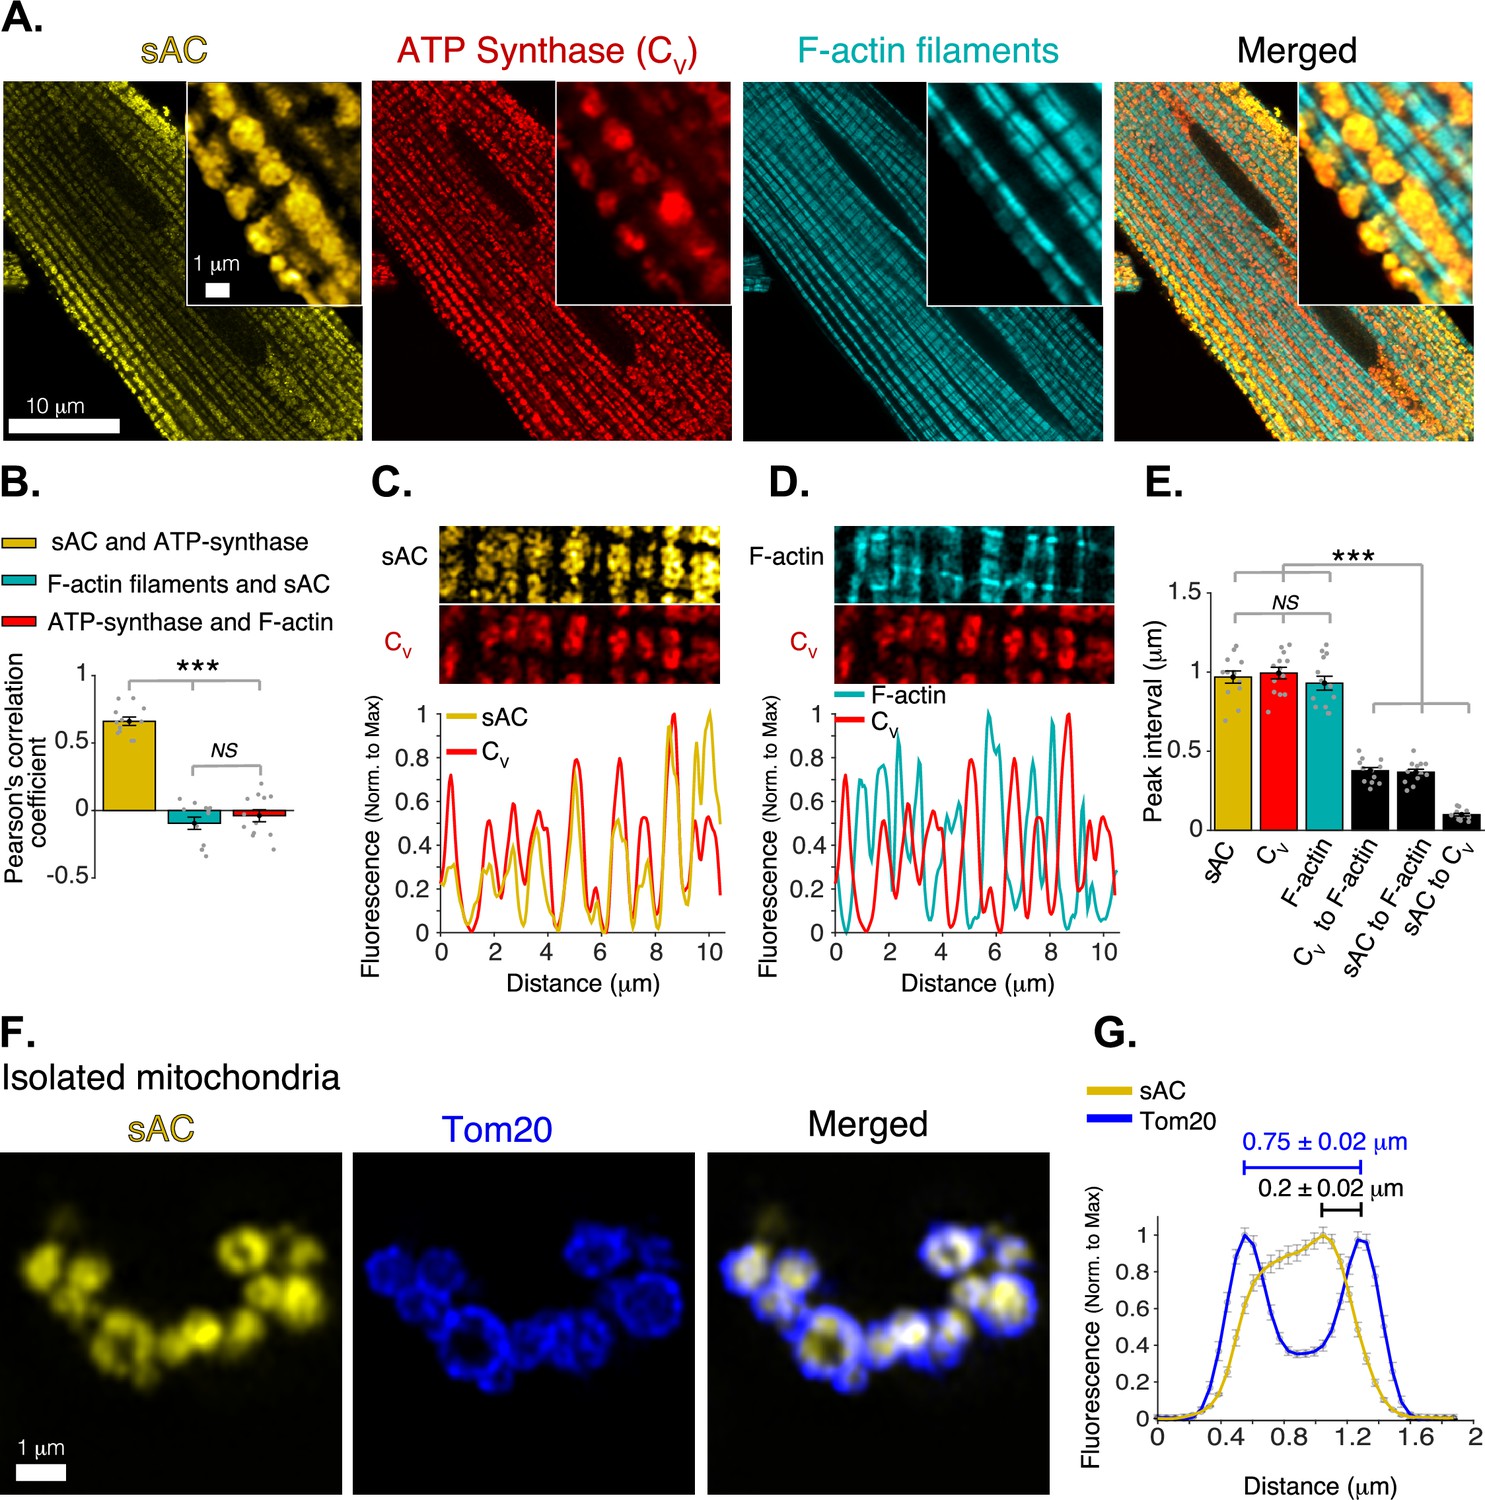
Mitochondrial localization of soluble adenylyl cyclase (sAC).
(A) Airyscan super-resolution fluorescence images of a cardiomyocyte (left to right) immuno-labeled for sAC (yellow) and ATP synthase (red), and loaded with Alexa Fluor 488 phalloidin (1 M) to label the F-actin within the contractile filaments (cyan). Merged image (far right) shows superimposed labeling of sAC, ATP synthase, and F-actin. (B) Pearson’s correlation analysis of subcellular colocalization of sAC with ATP synthase (yellow), sAC with F-actin filaments (cyan), and ATP synthase with F-actin filaments (red), (n = 12 cells). (C) Fluorescence profile of sAC (yellow) and ATP synthase (red). (D) Fluorescence profile of F-actin (cyan) and ATP synthase (red). (E) Mean of peak interval for data as in (C, D) (n = 13 cells). (F) Airyscan super-resolution images of isolated cardiac mitochondria immuno-labeled for sAC (yellow, left), Tom20 (blue, center), and merged images (right). (G) Fluorescence profile of sAC (yellow) and Tom20 (blue) for individual mitochondrial images as in F (n = 36). Mean peak intervals (inμm) are indicated (n = 36 mitochondria). Data in (B, E and G) are mean ± standard error of the mean (SEM). One-way two-tailed analysis of variance (ANOVA) with Bonferroni correction in B, E. ***p < 0.001. NS = not significant (p > 0.05).
-
Figure 1—source data 1
Numeric source data for Figure 1.
- https://cdn.elifesciences.org/articles/84204/elife-84204-fig1-data1-v2.xlsx
Figure 1—figure supplement 1
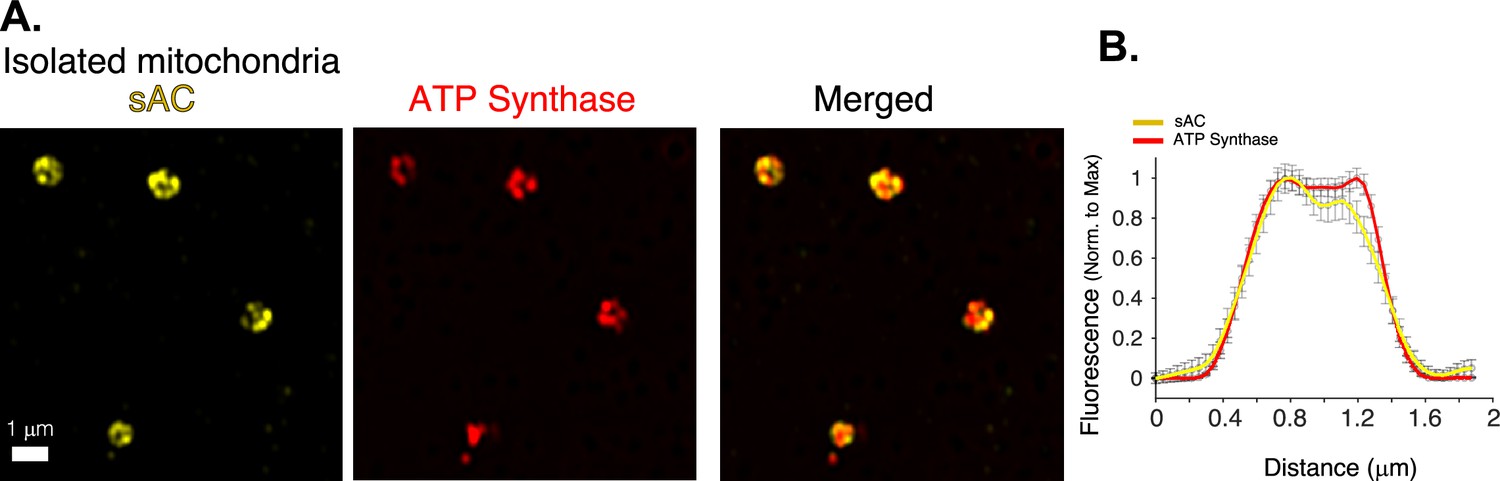
Mitochondrial localization of bicarbonate-activated soluble adenylyl cyclase (sAC).
(A) Airyscan ‘super-resolution’ images of isolated cardiac mitochondria immuno-labeled for sAC (yellow) and ATP synthase (red). (B) Immunofluorescence profile of sAC (yellow) and ATP synthase (red) for images as in A (n = 36 mitochondria). Data in (B) are mean ± standard error of the mean (SEM).
Figure 2 with 2 supplements
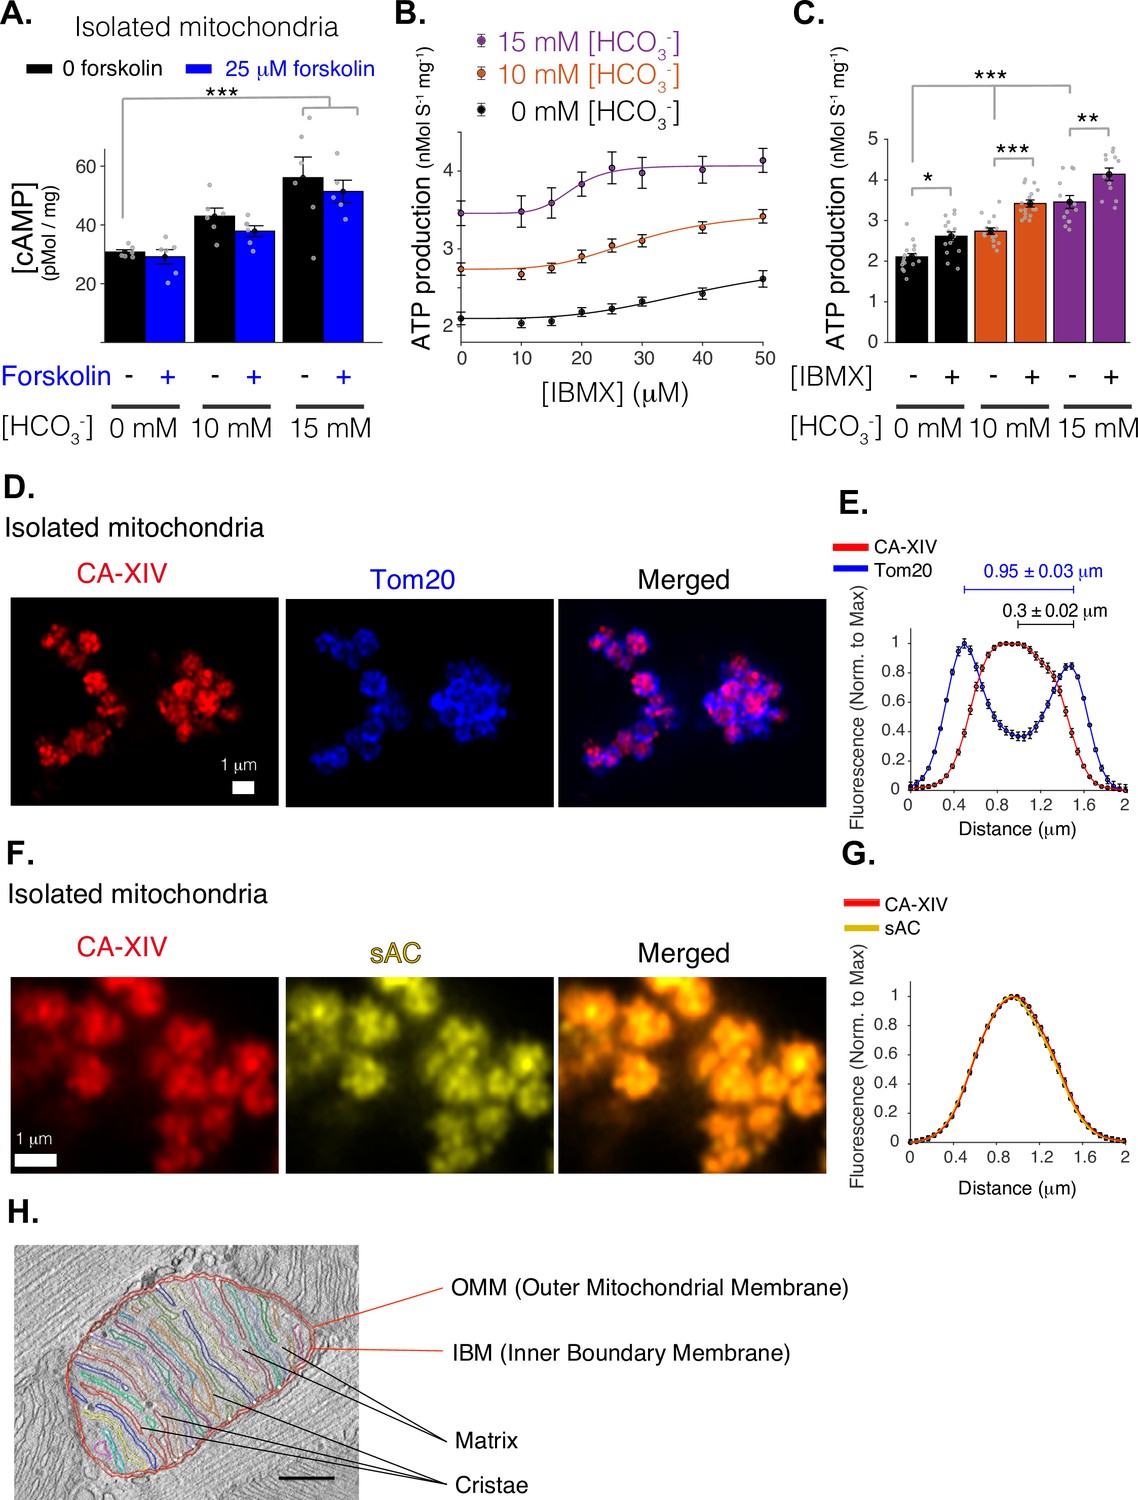
Mitochondrial function of soluble adenylyl cyclase (sAC).
(A) Quantitative ELISA measurements of cAMP inside isolated mitochondria (pmol/mg). cAMP is measured following treatment with indicated concentrations of bicarbonate (HCO3−), which activates sAC, and forskolin, which activates transmembrane adenylyl cyclases (tmACs) (n = 6, 6, 5 for 0, 10, and 15 mM [HCO3−], respectively, mitochondria are isolated independently from four hearts). (B) The dependence of ATP production on [HCO3−] and [IBMX]. Sigmoidal fits to the data are shown. (C) The sensitivity of ATP production to phosphodiesterase inhibition (with 50 μM IBMX) at different concentrations of [HCO3−]. (D) Airyscan super-resolution images of isolated cardiac mitochondria immuno-labeled for CAXIV (red, left), Tom20 (blue, center), and merged images (right). (E) Fluorescence profile of CAXIV (red) and Tom20 (blue) for individual mitochondrial images as in D. Mean peak intervals (in μm) are indicated (n = 32 mitochondria). (F) Airyscan super-resolution images of isolated cardiac mitochondria immuno-labeled for CAXIV (red, left), sAC (yellow, center), and merged images (right). (G) Fluorescence profile of CAXIV (red) and sAC (yellow) for individual mitochondrial images as in F (n = 32). For (B, C), n = 12–16 independent experiments per group, mitochondria are isolated independently from four hearts. Data in (A–C) are mean ± standard error of the mean (SEM). One-way two-tailed analysis of variance (ANOVA) with Bonferroni correction in (A, C). *p < 0.05, **p < 0.01, ***p < 0.001. (H) Structure of a typical mitochondria from a rat cardiomyocyte showing the intimate arrangement and packing of the cristae and matrix and the IMS. The image is a slice from an electron microscopic tomogram with membranes traced for clarity and quantitation. As shown in the accompanying video of a similar tomogram (Figure 2—video 1), crista compartments are formed by closely spaced parallel membranes that extend out of the plane of this image. The functional ‘intermembrane space’ (IMS) consists of the narrow peripheral space between the inner boundary membrane (IBM) and the outer mitochondrial membrane (OMM) plus the spaces inside the cristae that connect to the peripheral space through narrow (20–40 nm) crista junctions (represented by small white circles) (Frey and Mannella, 2000). Stereological analysis (Smith and Page, 1976) indicates the cristae contain 85% of the total IMS in this mitochondrion, a value that increases to 91% for a mitochondrion with similar crista packing and an area ×2.5 larger. Scale bar is 250 nm.
-
Figure 2—source data 1
Numeric source data for Figure 2.
- https://cdn.elifesciences.org/articles/84204/elife-84204-fig2-data1-v2.xlsx
Figure 2—figure supplement 1
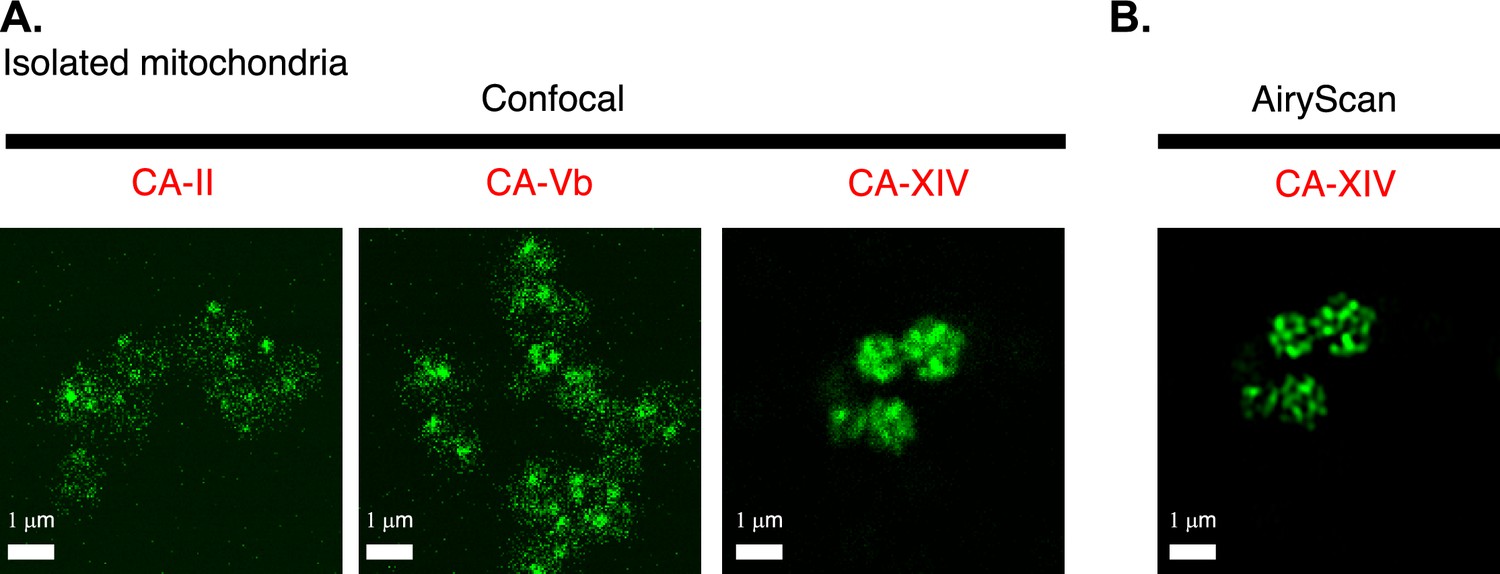
Intra-mitochondrial localization of carbonic anhydrase 14 (CAXIV).
(A) Confocal images of isolated cardiac mitochondria immuno-labeled for either CA-II (left), or CA-Vb (middle), or CA-XIV (right). While three different primary antibodies were used to immuno-label the three different isoforms of carbonic anhydrase, all staining, confocal image acquisition, and image presentation were the same. (B) Airyscan ‘super-resolution’ image of isolated cardiac mitochondria immuno-labeled for CA-XIV (same imaging field as in the right panel of A).
Figure 2—video 1
Electron tomogram of a mitochondrion in the interfibrillar region of a rat cardiomyocyte.
Video is a slice-by-slice view of a subvolume of cardiac muscle (1840 × 1840 × 250 nm3) reconstructed by electron tomography.
Figure 3
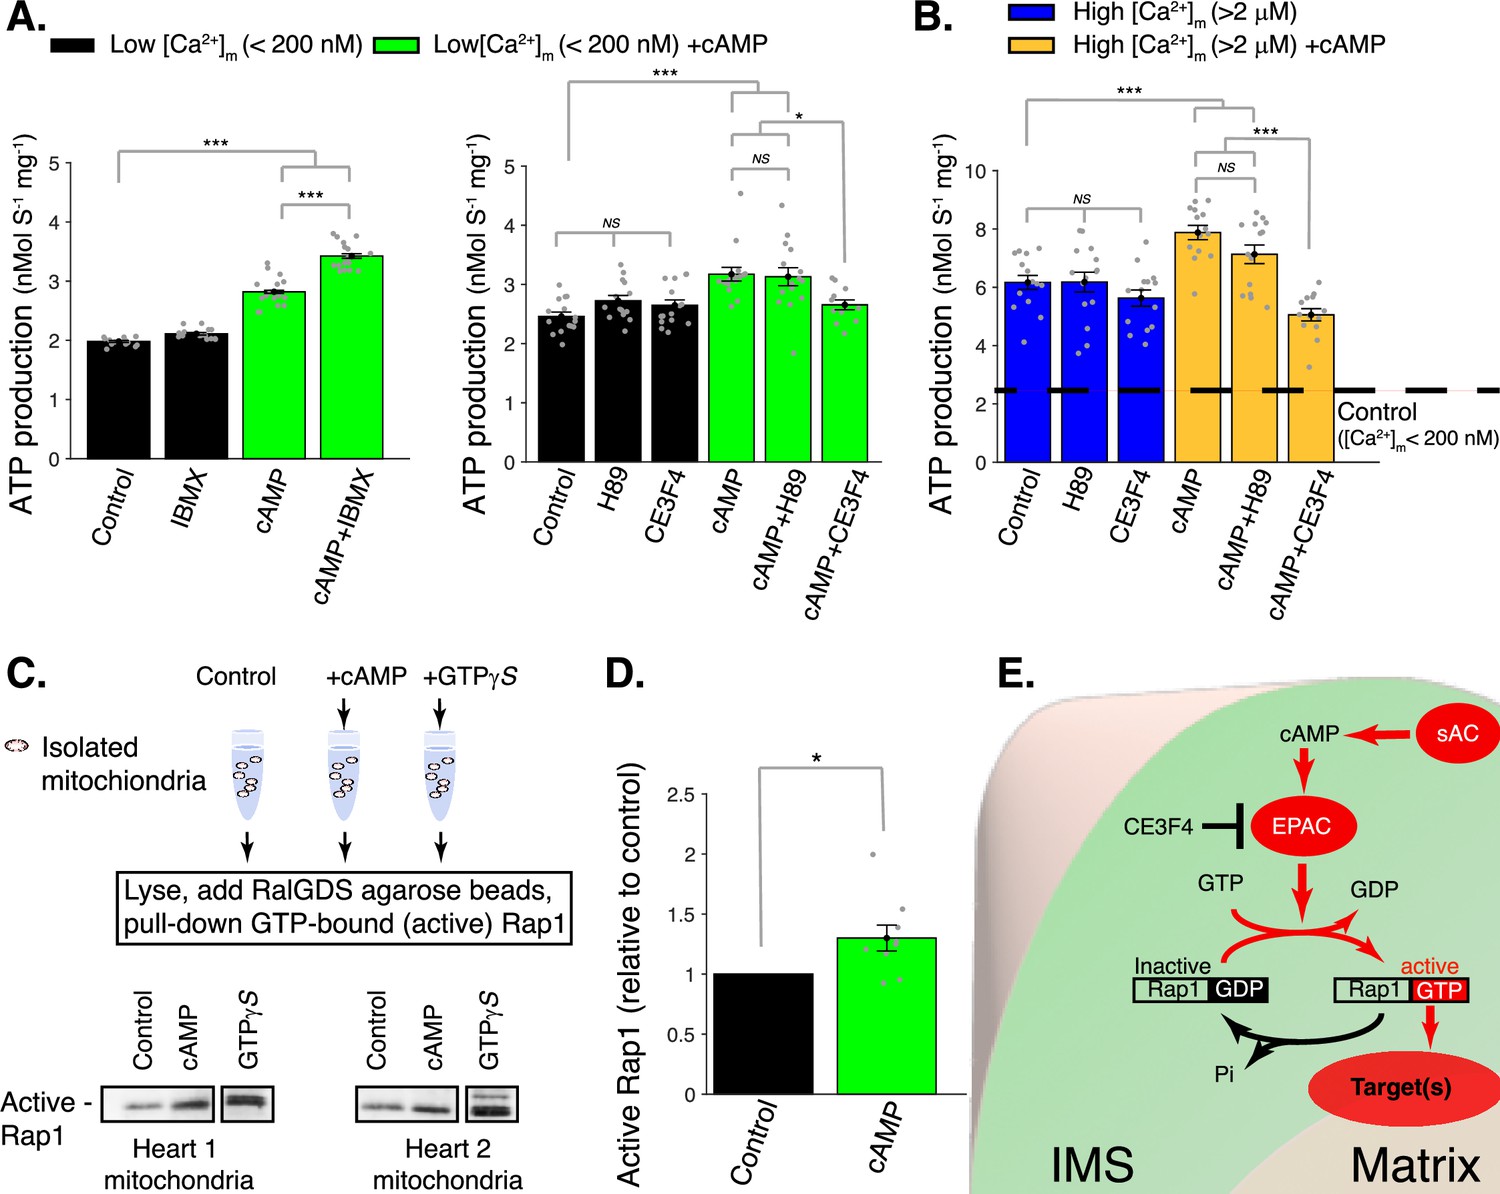
cAMP control of mitochondrial ATP production.
(A) Left, sensitivity of mitochondrial ATP production to cAMP and phosphodiesterase inhibition (with 50 μM IBMX). Measurements are carried out at low [Ca2+]m (<200 nM). Right, sensitivity of mitochondrial ATP production to cAMP, EPAC1 inhibition (25 μM CE3F4), and protein kinase A (PKA) inhibition (1 μM H89). Measurements were carried out at low [Ca2+]m (<200 nM). (B) Same as A but at high [Ca2+]m (>2 μM). (C) Pull-down and immunoblot analysis for the active form of Rap1 (GTP-bound Rap1) in isolated mitochondria stimulated with cAMP. γ-GTP is used to maximally activate Rap1. (D) The relative amounts of active Rap1 (mitochondria isolated independently from n = 9 hearts). (E) Schematic diagram showing the likely locations of key proteins in soluble adenylyl cyclase (sAC) mitochondrial signaling. While sAC is clearly located within the intermembrane space (IMS), and both EPAC and Rap1 have signaling domains in the IMS, it is uncertain how the ‘target’ protein(s) are activated to increase ATP production. For (A, B), n = 12–16 independent experiments per group, mitochondria are isolated independently from four hearts. In (D), mitochondria are isolated independently from nine hearts. Data in (A, B) and (D) are mean ± standard error of the mean (SEM). One-way two-tailed analysis of variance (ANOVA) with Bonferroni correction in (A, B). One-sample t-test for (D). *p < 0.05, **p < 0.01, ***p < 0.001.
-
Figure 3—source data 1
Western blot analysis in Figure 3C, D (anti-Rap1).
- https://cdn.elifesciences.org/articles/84204/elife-84204-fig3-data1-v2.zip
-
Figure 3—source data 2
Original file No. 1 for western blot analysis in Figure 3C, D (anti-Rap1).
- https://cdn.elifesciences.org/articles/84204/elife-84204-fig3-data2-v2.zip
-
Figure 3—source data 3
Original file No. 2 for western blot analysis in Figure 3C, D (anti-Rap1).
- https://cdn.elifesciences.org/articles/84204/elife-84204-fig3-data3-v2.zip
-
Figure 3—source data 4
Original file No. 3 for western blot analysis in Figure 3C, D (anti-Rap1).
- https://cdn.elifesciences.org/articles/84204/elife-84204-fig3-data4-v2.zip
-
Figure 3—source data 5
Original file No. 4 for western blot analysis in Figure 3C, D (anti-Rap1).
- https://cdn.elifesciences.org/articles/84204/elife-84204-fig3-data5-v2.zip
Figure 4
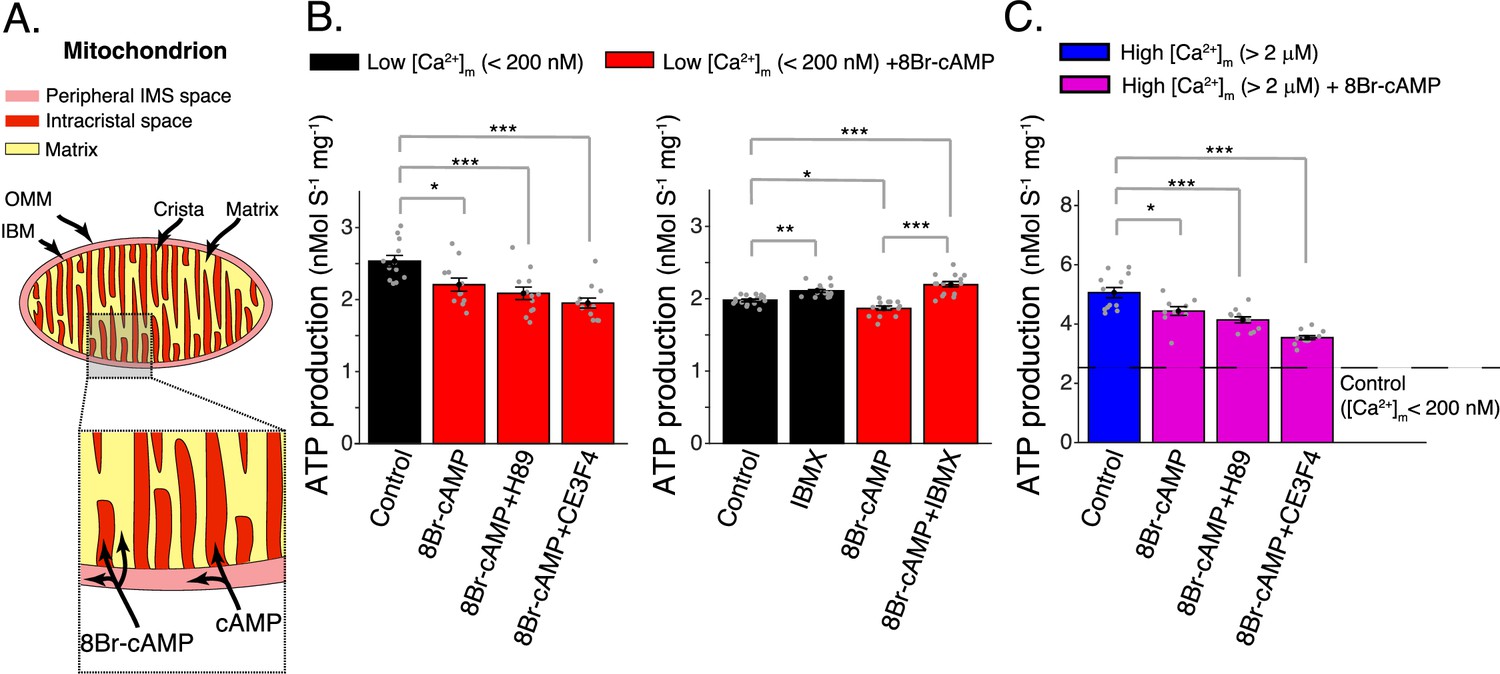
Elevated matrix [cAMP] inhibits mitochondrial ATP production.
(A) Diagram showing mitochondrial compartments accessible to cAMP and the membrane permeant analog, 8Br-cAMP. (B) Left, mitochondrial ATP production was decreased by application of 8Br-cAMP. This effect was not changed by either EPAC1 inhibition (25 μM CE3F4) or protein kinase A (PKA) inhibition (1 μM H89). Measurements were carried out at low [Ca2+]m (<200 nM). Right, application of phosphodiesterase inhibitor (50 μM IBMX) produced a small increase in ATP production. Measurements were carried out at low [Ca2+]m (<200 nM). (C) Same as (B) (left panel) but at high [Ca2+]m (>2 μM). For (B, C), n = 12–16 independent experiments per group, mitochondria are isolated independently from four hearts. Data in (B, C) are mean ± standard error of the mean (SEM). One-way two-tailed analysis of variance (ANOVA) with Bonferroni correction in (A–C). *p < 0.05, **p < 0.01, ***p < 0.001.
-
Figure 4—source data 1
Numeric source data for Figure 4.
- https://cdn.elifesciences.org/articles/84204/elife-84204-fig4-data1-v2.xlsx
Figure 5
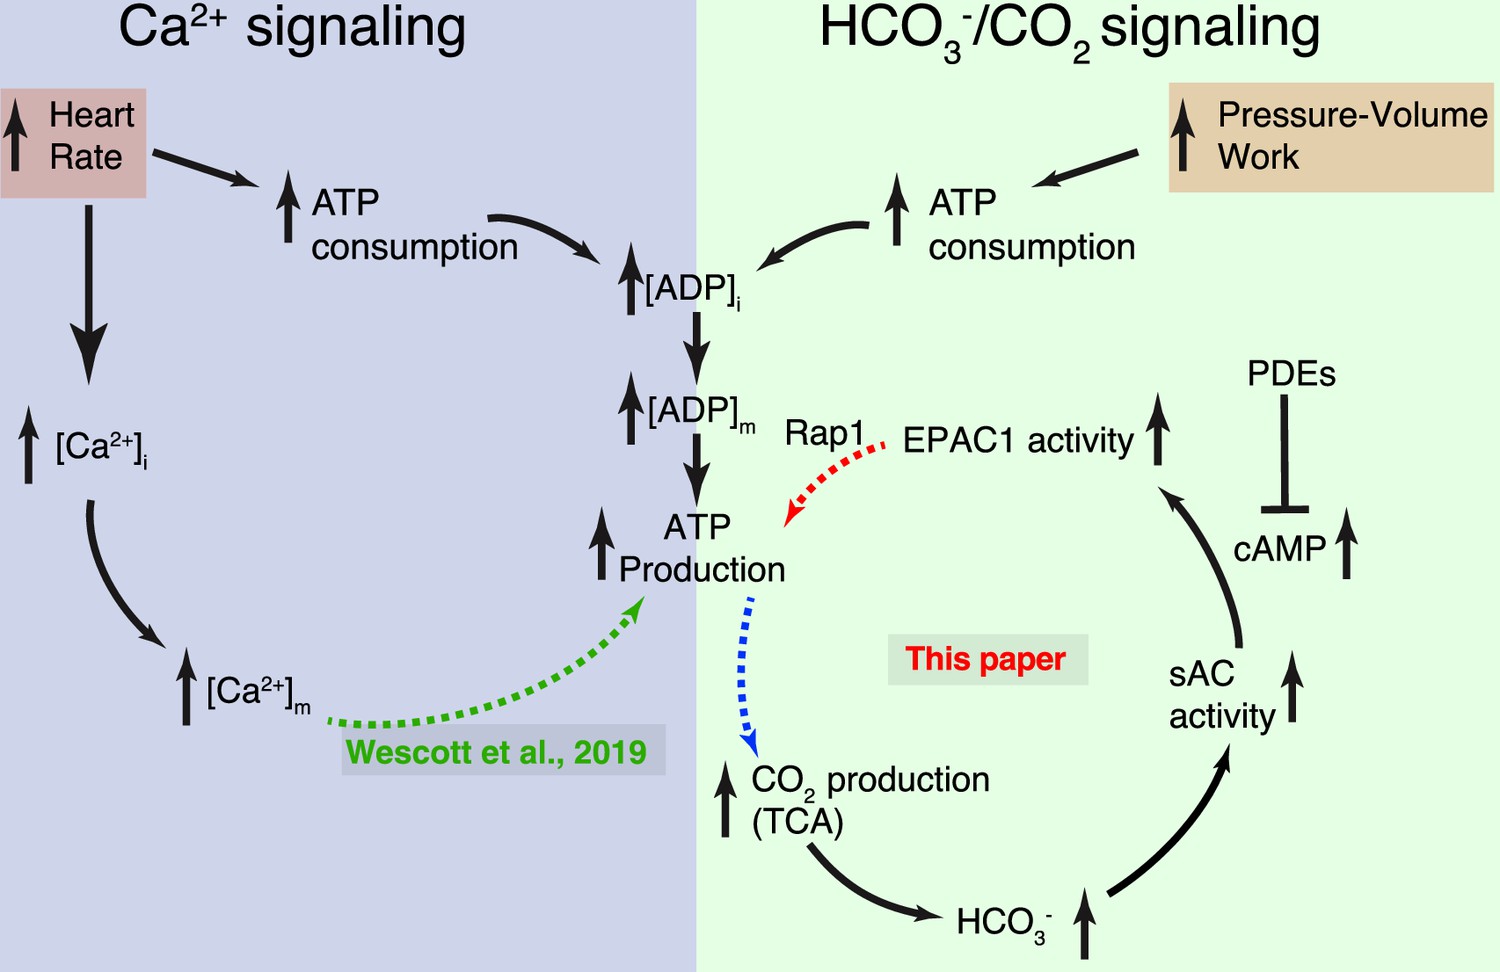
Dynamic control of mitochondrial ATP production by Ca2+ and bicarbonate.
Schematic diagram of the two complementary signaling arms that control mitochondrial ATP production. Left: The Ca2+ arm depends on heart rate. With higher heart rates, increased mitochondrial matrix Ca2+ ([Ca2+]m) augments ATP production via a mechanism described in detail in Wescott et al., 2019. Right: The bicarbonate arm responds to pressure/volume work, highlighting the pivotal role played by CO2 (in dynamic equilibrium with bicarbonate). This signaling arm is centered in the IMS (intermembrane space between the inner mitochondrial membrane [IMM] and the outer mitochondrial membrane [OMM]) with the final link (involving Rap1) reaching across the IMM and probably into the matrix. Neither the Ca2+ nor the HCO3− signaling arm alone accounts for the full scale of enhancement of ATP production during normal physiological function. Each arm can be stimulated by distinct signals, keeping ATP production in sync with heart rate and pressure–volume work. Importantly, it is the resonance signaling between this two signaling arms that properly matches ATP production to actual energy consumption.
Figure 6 with 2 supplements
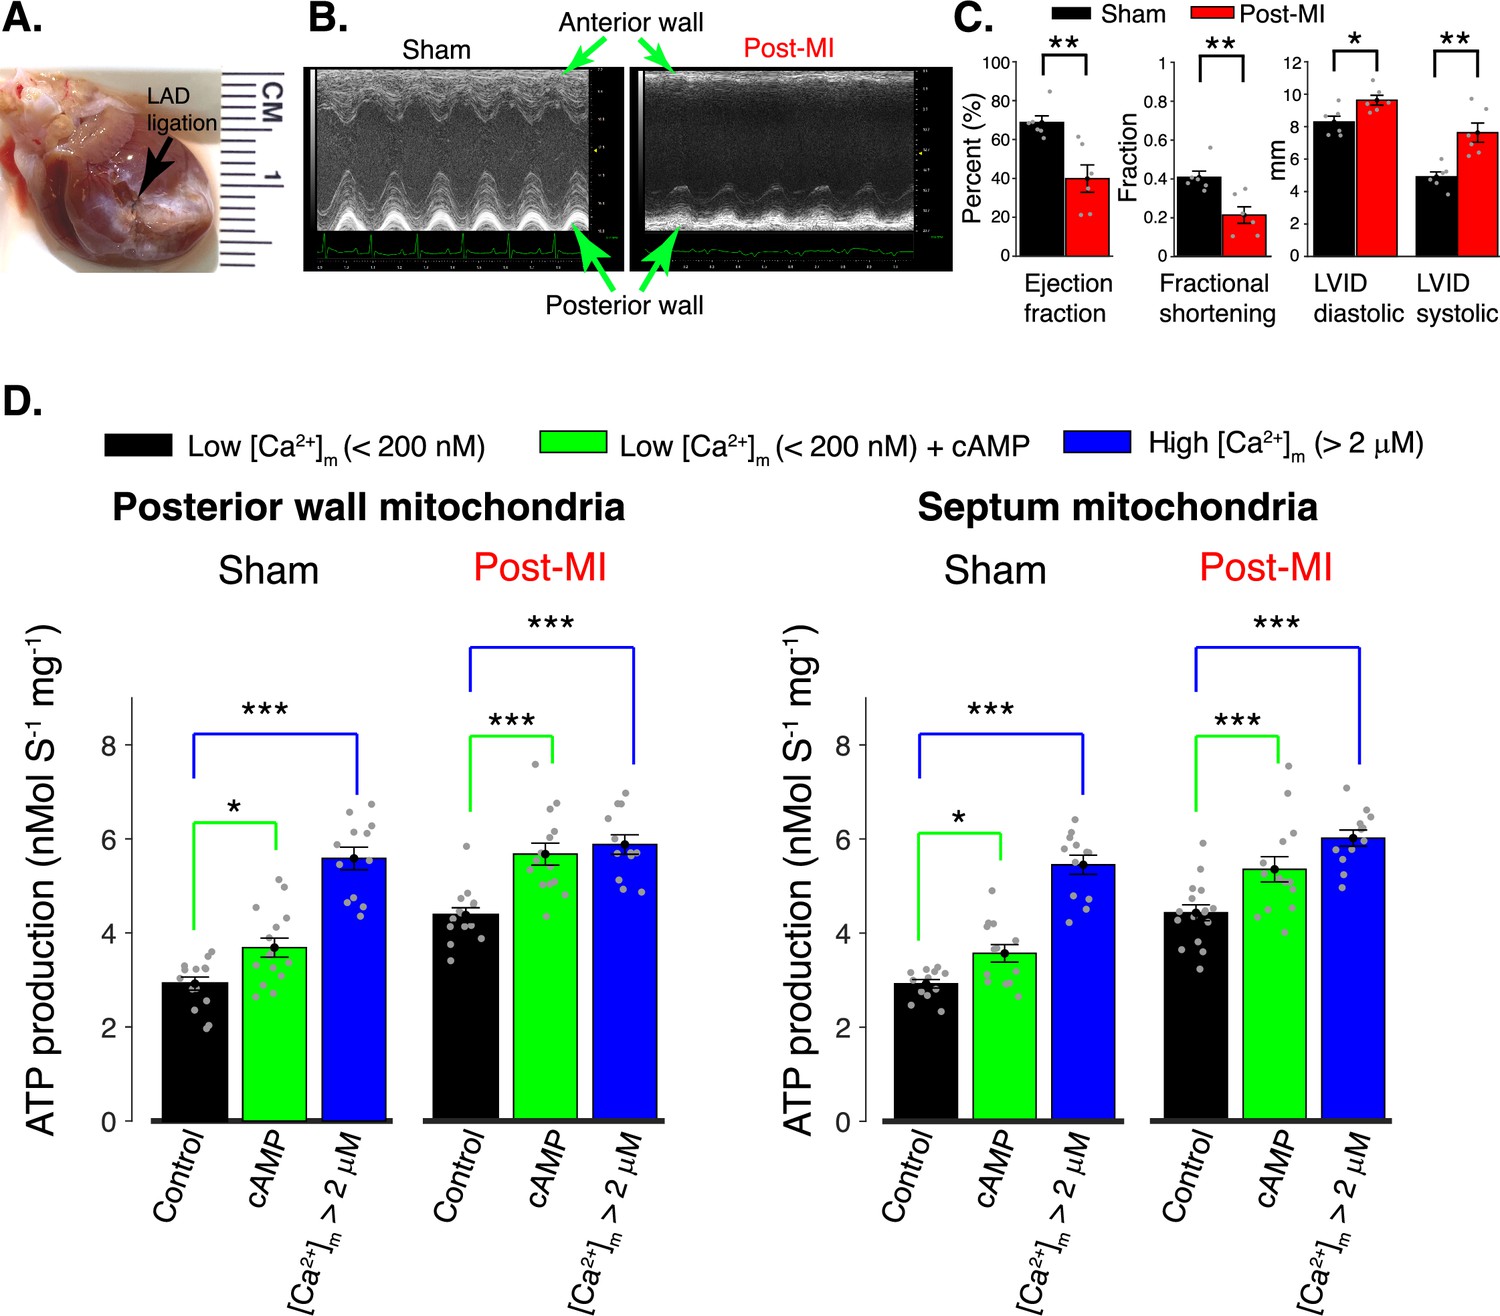
Regulation of mitochondrial ATP production in the post myocardial infarction (MI) heart by [Ca2+]m and [cAMP].
(A) Anterior view of rat heart 8 weeks after induction of MI by ligation of left anterior descending (LAD) coronary artery. The black arrow indicates the location of the ligation and the distal, white-colored, region shows scar tissue. (B) Parasternal short-axis M-mode echocardiographic images 8 weeks after surgery involving no ligation (Sham) and 8 weeks after genuine LAD ligation (Post-MI). (C) Left ventricular echocardiographic measurements from six sham rats (black bars) and from six genuine MI rats (red bars). Data are shown as gray circles. Left chart: Left ventricle ejection fractions and fractional shortening. Right chart: Actual diastolic and systolic left ventricular internal dimensions (LVID). All echocardiographic measurements were carried out under light sedation (1% isoflurane in 100% oxygen). Heart rate (BPM ± SD): sham 318 ± 28, post-MI 317 ± 12. (D) ATP production rate in isolated mitochondria at low [Ca2+]m (<200 nm, black bars), at low [Ca2+]m plus cAMP (green bars), and at high [Ca2+]m (>2 μM, blue bars). Mitochondria were isolated from healthy tissue in the septal wall or posterior wall 8 weeks post-MI or post sham operation, as indicated. For all data, n = 12–16 independent experiments per group, four post-MI hearts and four sham hearts. Data in (C, D) are mean ± standard error of the mean (SEM). Two-tailed unpaired t-test in (C). One-way two-tailed analysis of variance (ANOVA) with Bonferroni correction in (D). *p < 0.05, **p < 0.01, ***p < 0.001.
-
Figure 6—source data 1
Numeric source data for Figure 6.
- https://cdn.elifesciences.org/articles/84204/elife-84204-fig6-data1-v2.xlsx
Figure 6—figure supplement 1
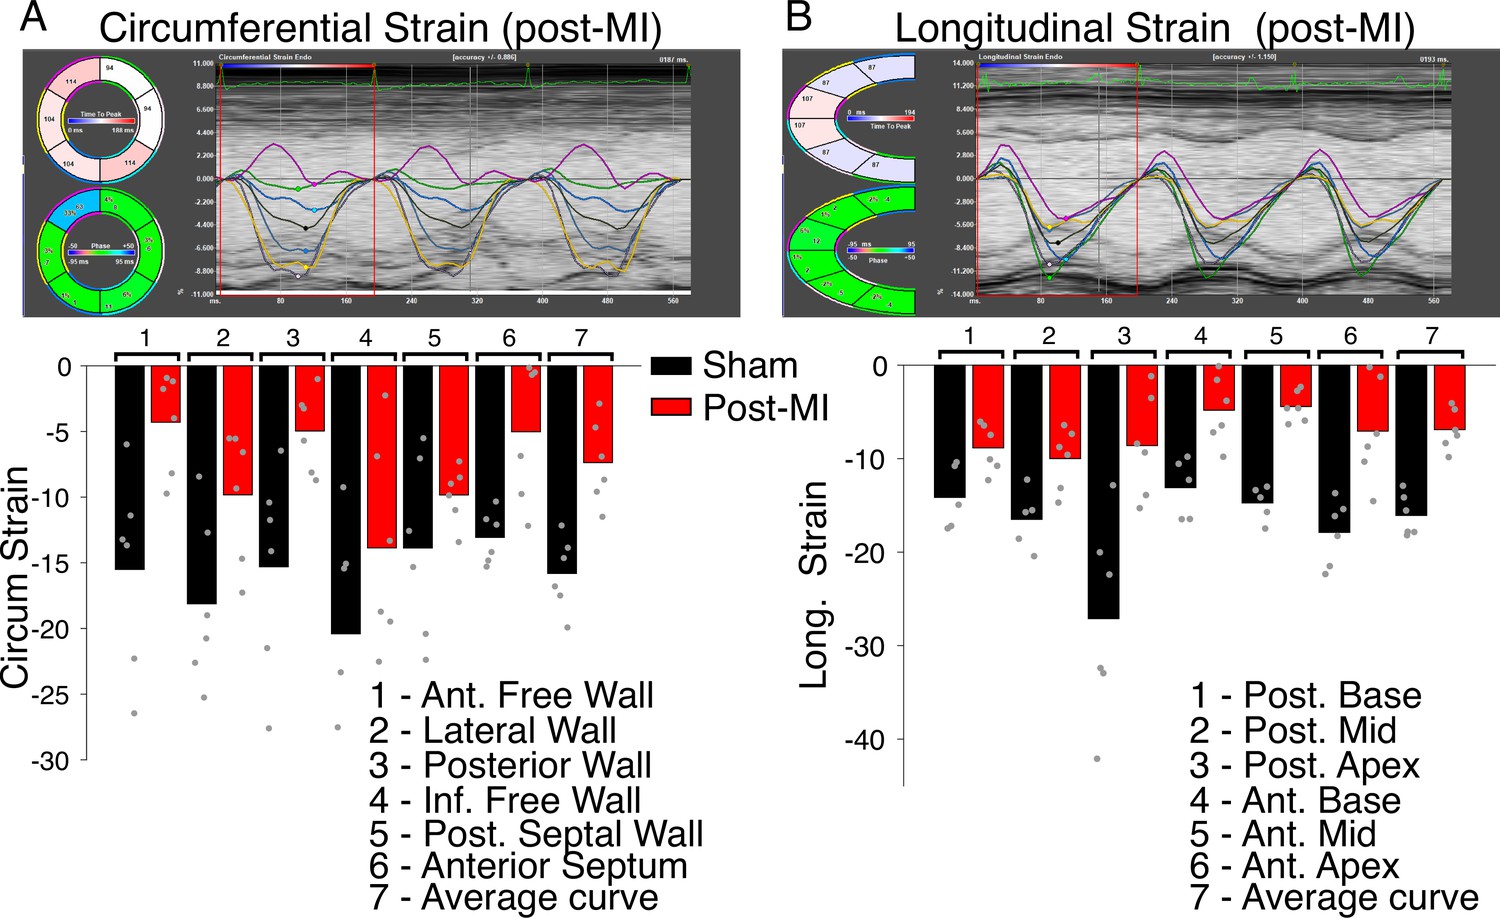
Regional contractile failure detected with speckle-tracking based strain analysis.
Time-resolved tracking of myocardial deformation for direct tracking of myocardial strain. (A) Top panel shows measurements carried out along the circumferential axis 8 weeks post-MI. Six regional strain curves are shown, a seventh black line is the average (global) strain at each time point. Bottom panel shows bar charts of the regional and average strain measures (as %) as indicated. Data are from six sham operated hearts (black bars) and from six hearts with permanent left anterior descending (LAD) ligation (red bars). Individual data are shown as gray circles. (B) The same as (A) but measurements taken along the longitudinal axis.
Figure 6—figure supplement 2
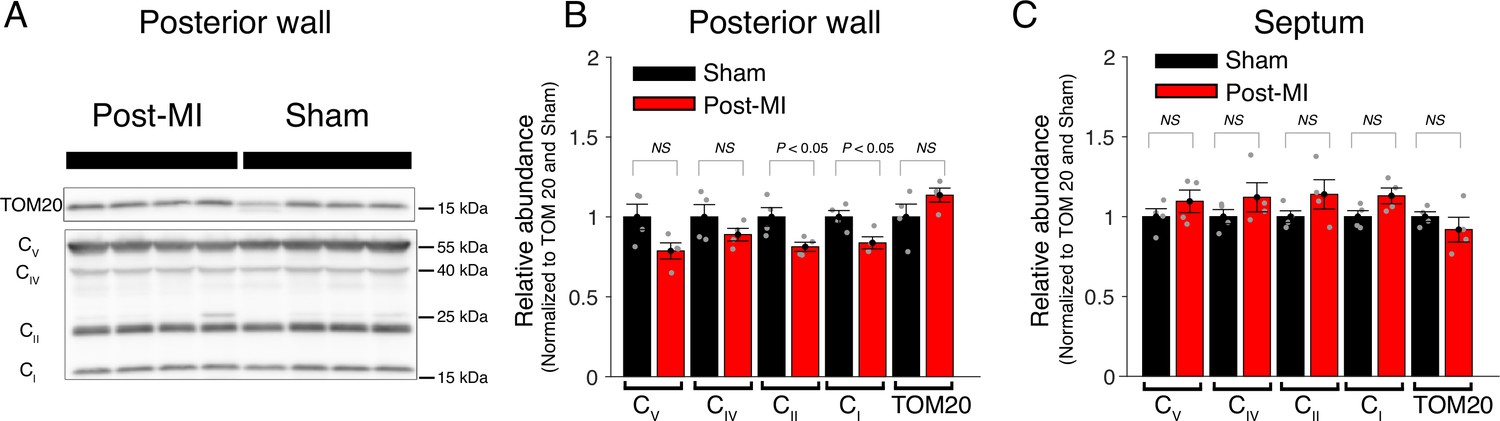
Central components of mitochondrial ATP production are largely unchanged post-MI.
(A) Western blot analysis of mitochondria from the posterior wall 8 weeks after surgery (Post-MI or Sham). Tom20 is used as loading control. CV (ATP synthase subunit 5 A), CIV (complex 4 MTCO1), CII (complex 2 SDHB), and CI (complex 1 NDUFB8). (B) Relative abundance of respiratory chain proteins in mitochondria isolated from the posterior wall 8 weeks after surgery (red bars = Post MI, black bars = Sham). (C) Same as B but mitochondria are isolated from the septum. Data are mean ± standard error of the mean (SEM). Two-tailed t-test.
-
Figure 6—figure supplement 2—source data 1
Western blot analysis in Figure 3 (anti-Cv, anti-Civ, anti-Cii, anti-Ci, and anti-TOM20).
- https://cdn.elifesciences.org/articles/84204/elife-84204-fig6-figsupp2-data1-v2.zip
-
Figure 6—figure supplement 2—source data 2
Original file for western blot analysis of posterior wall in Figure 3 (anti-Cv, anti-Civ, anti-Cii, and anti-Ci).
- https://cdn.elifesciences.org/articles/84204/elife-84204-fig6-figsupp2-data2-v2.zip
-
Figure 6—figure supplement 2—source data 3
Original file for western blot analysis of posterior wall in Figure 3 (anti-TOM20).
- https://cdn.elifesciences.org/articles/84204/elife-84204-fig6-figsupp2-data3-v2.zip
-
Figure 6—figure supplement 2—source data 4
Original file for western blot analysis of septal wall in Figure 3 (anti-Cv, anti-Civ, anti-Cii, and anti-Ci).
- https://cdn.elifesciences.org/articles/84204/elife-84204-fig6-figsupp2-data4-v2.zip
-
Figure 6—figure supplement 2—source data 5
Original file for western blot analysis of septal wall in Figure 3 (anti-TOM20).
- https://cdn.elifesciences.org/articles/84204/elife-84204-fig6-figsupp2-data5-v2.zip
Additional files
-
Supplementary file 1
Mechanistic findings by investigations of sAC and its role in mitochondria.
- https://cdn.elifesciences.org/articles/84204/elife-84204-supp1-v2.docx
-
MDAR checklist
- https://cdn.elifesciences.org/articles/84204/elife-84204-mdarchecklist1-v2.docx
Download links
A two-part list of links to download the article, or parts of the article, in various formats.
Downloads (link to download the article as PDF)
Open citations (links to open the citations from this article in various online reference manager services)
Cite this article (links to download the citations from this article in formats compatible with various reference manager tools)
Calcium and bicarbonate signaling pathways have pivotal, resonating roles in matching ATP production to demand
eLife 12:e84204.
https://doi.org/10.7554/eLife.84204


