National Institutes of Health research project grant inflation 1998 to 2021
- National Institutes of Health Office of the Director, United States
- National Institutes of Health Office of Extramural Research, United States
Figures
Figure 1
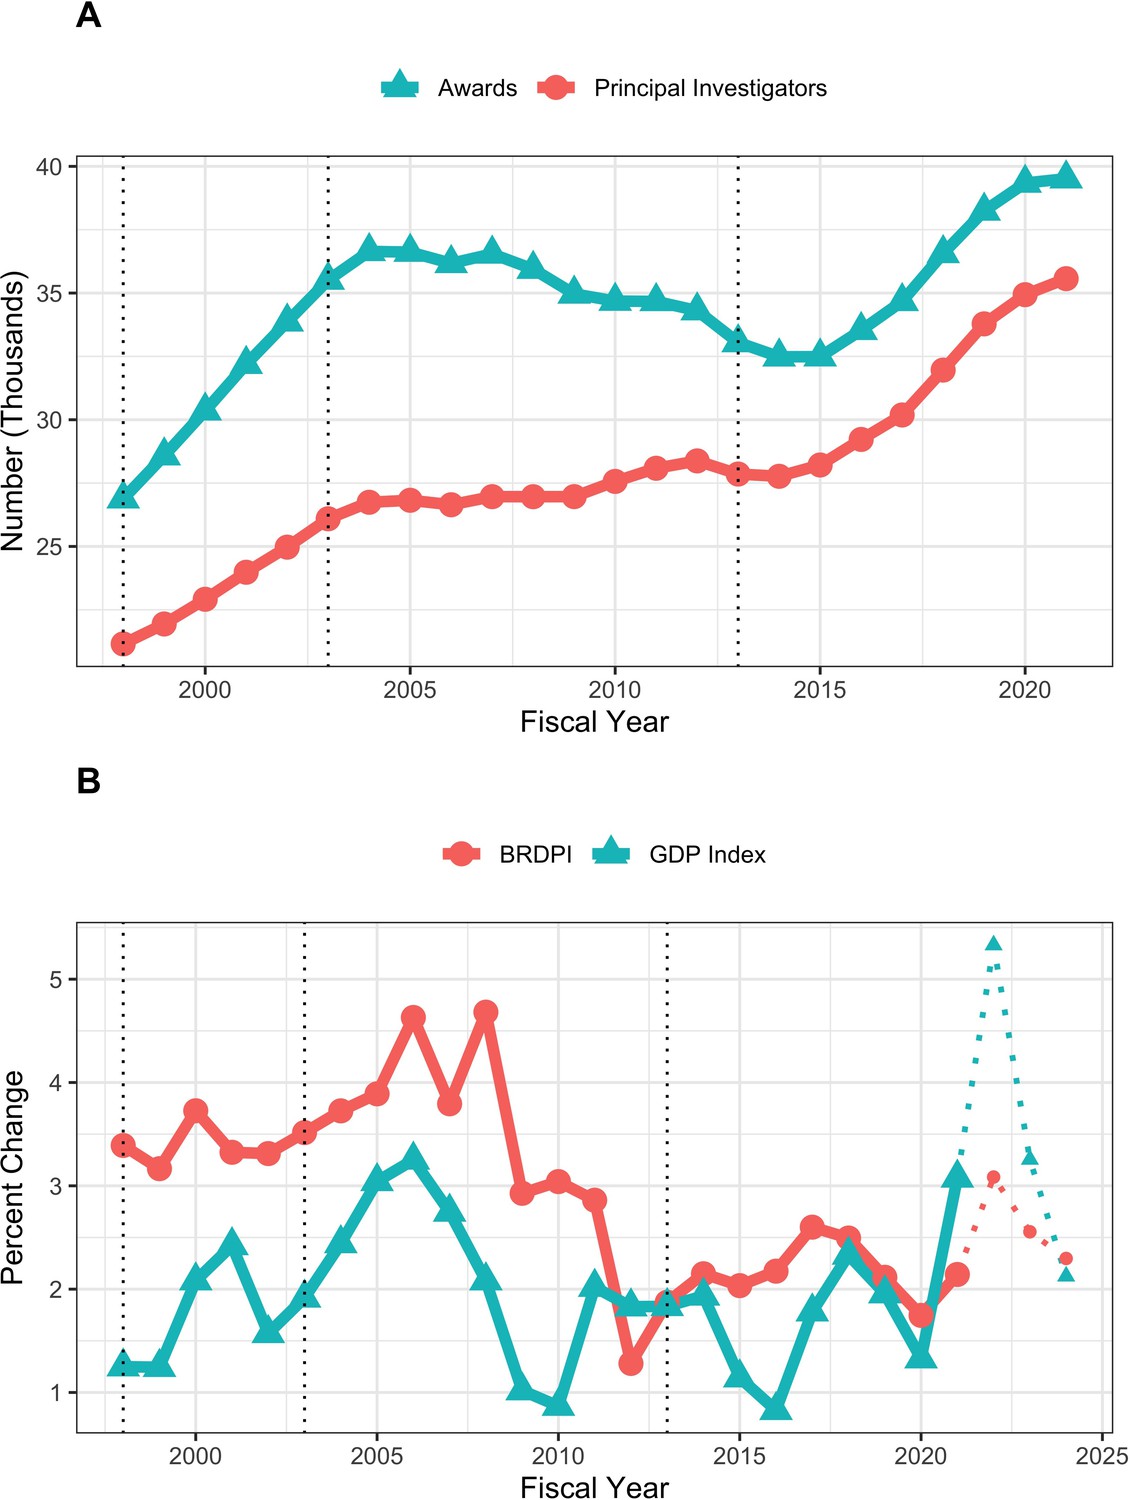
Number of funded RPGs and RPG Principal Investigators (panel A) and inflationary indices (panel B) by fiscal year.
The vertical dotted lines refer to the beginning and end of the NIH budget-doubling (FY1998 and FY2003) and the year of budget sequestration (FY2013). Indices shown in Panel B for fiscal years 2022, 2023, and 2024 are projected and therefore diplayed with thinner dotted lines.
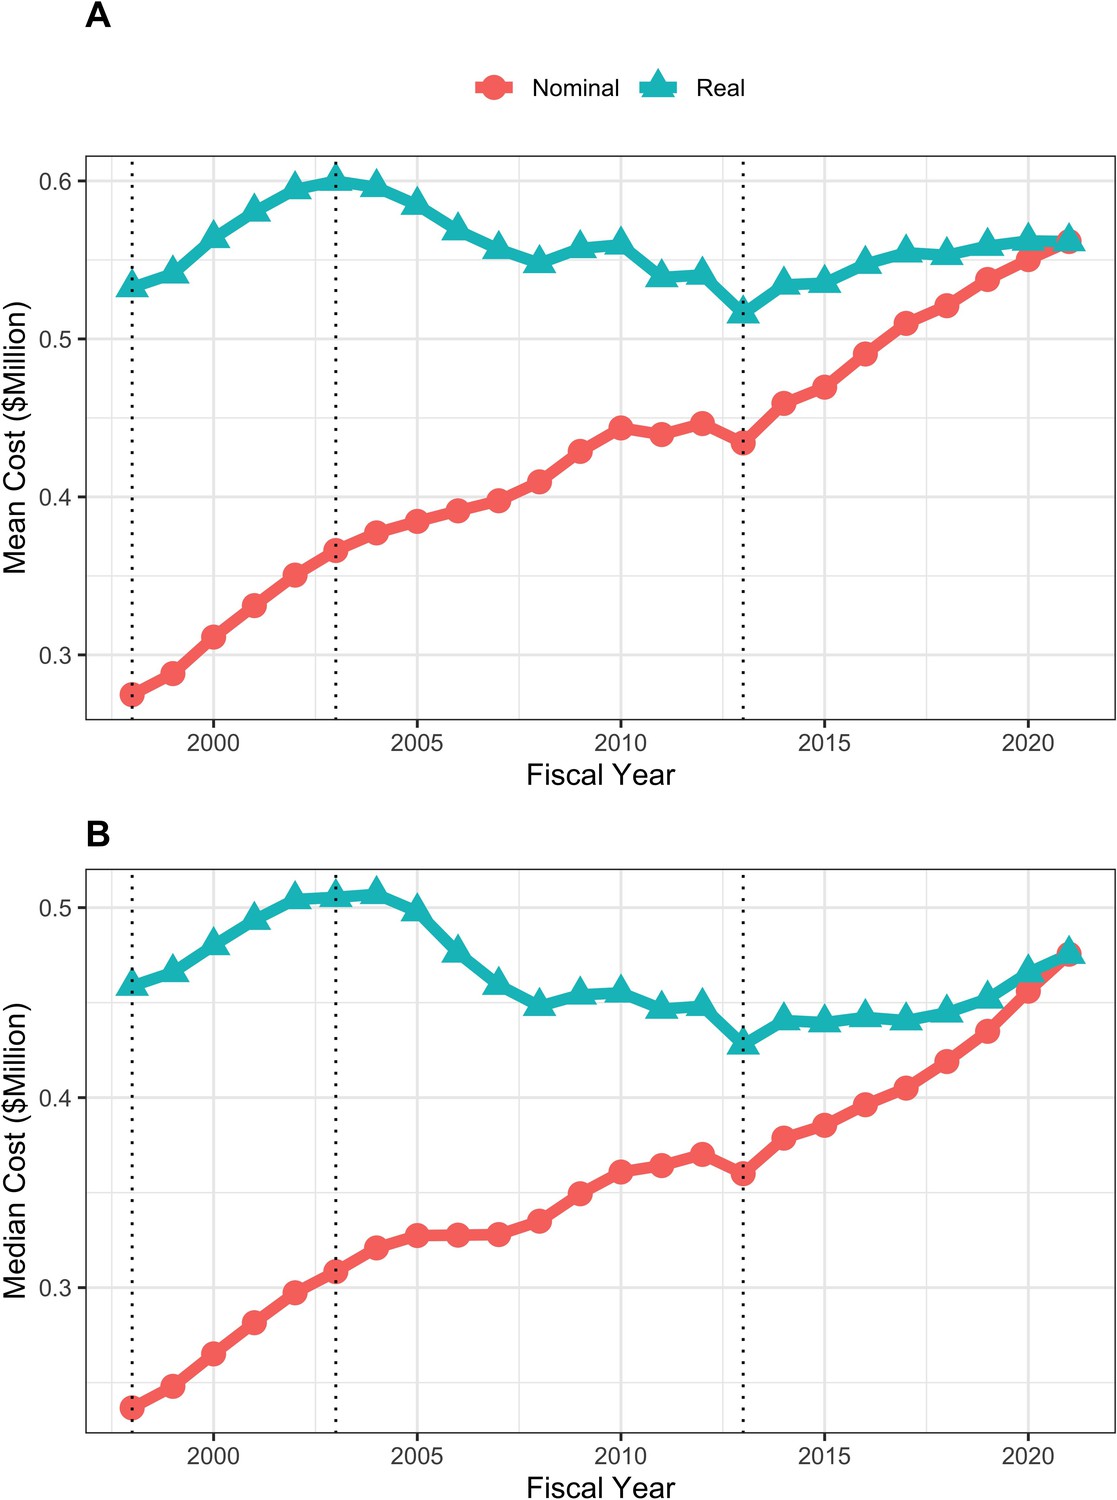
Figure 2

Mean (panel A) and median (panel B) nominal and real (BRDPI-adjusted in 2021 dollars) costs for NIH-funded RPGs, FY1998 to FY2021.
The vertical dotted lines refer to the beginning and end of the NIH budget-doubling (FY1998 and FY2003) and the year of budget sequestration (FY2013).
Figure 3

Mean (panel A) and median (panel B) nominal and real (BRDPI-adjusted in 2021 dollars) indirect costs for NIH-funded RPGs, FY1998 to FY2021.
TThe vertical dotted lines refer to the beginning and end of the NIH budget-doubling (FY1998 and FY2003) and the year of budget sequestration (FY2013).
Figure 4
Mean (panel A) and median (panel B) nominal and real (BRDPI-adjusted in 2021 dollars) costs for NIH-funded R01-equivalent awards, FY1998 to FY2021.
The vertical dotted lines refer to the beginning and end of the NIH budget-doubling (FY1998 and FY2003) and the year of budget sequestration (FY2013).
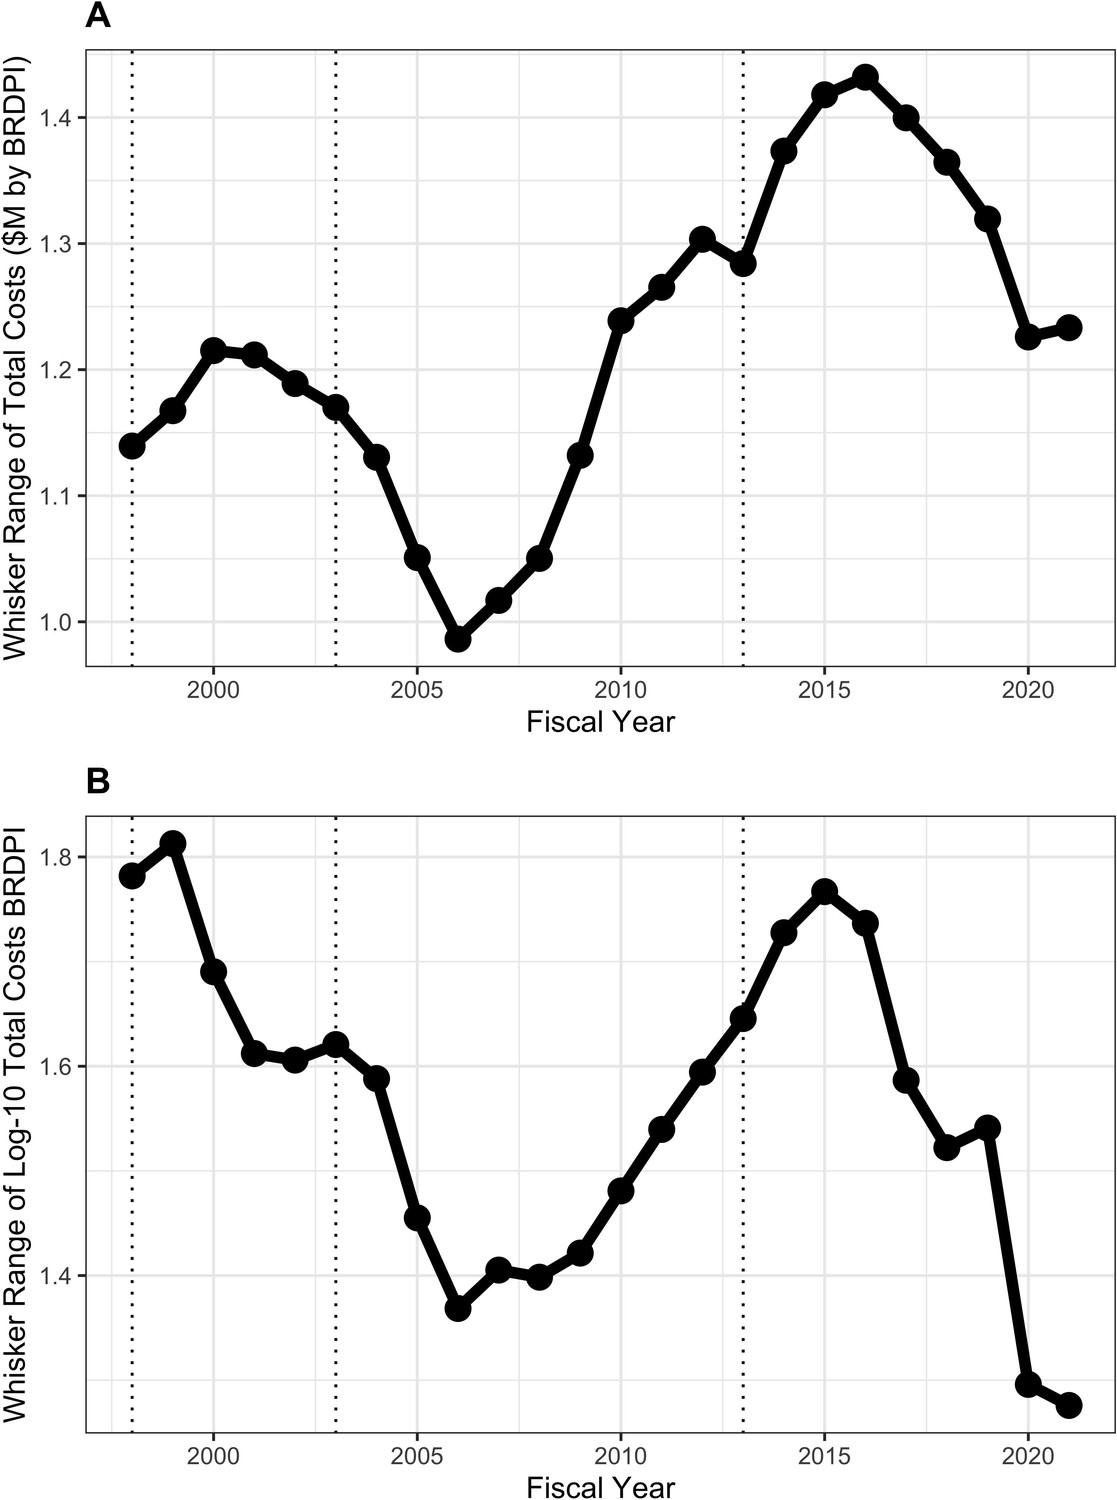
Figure 5
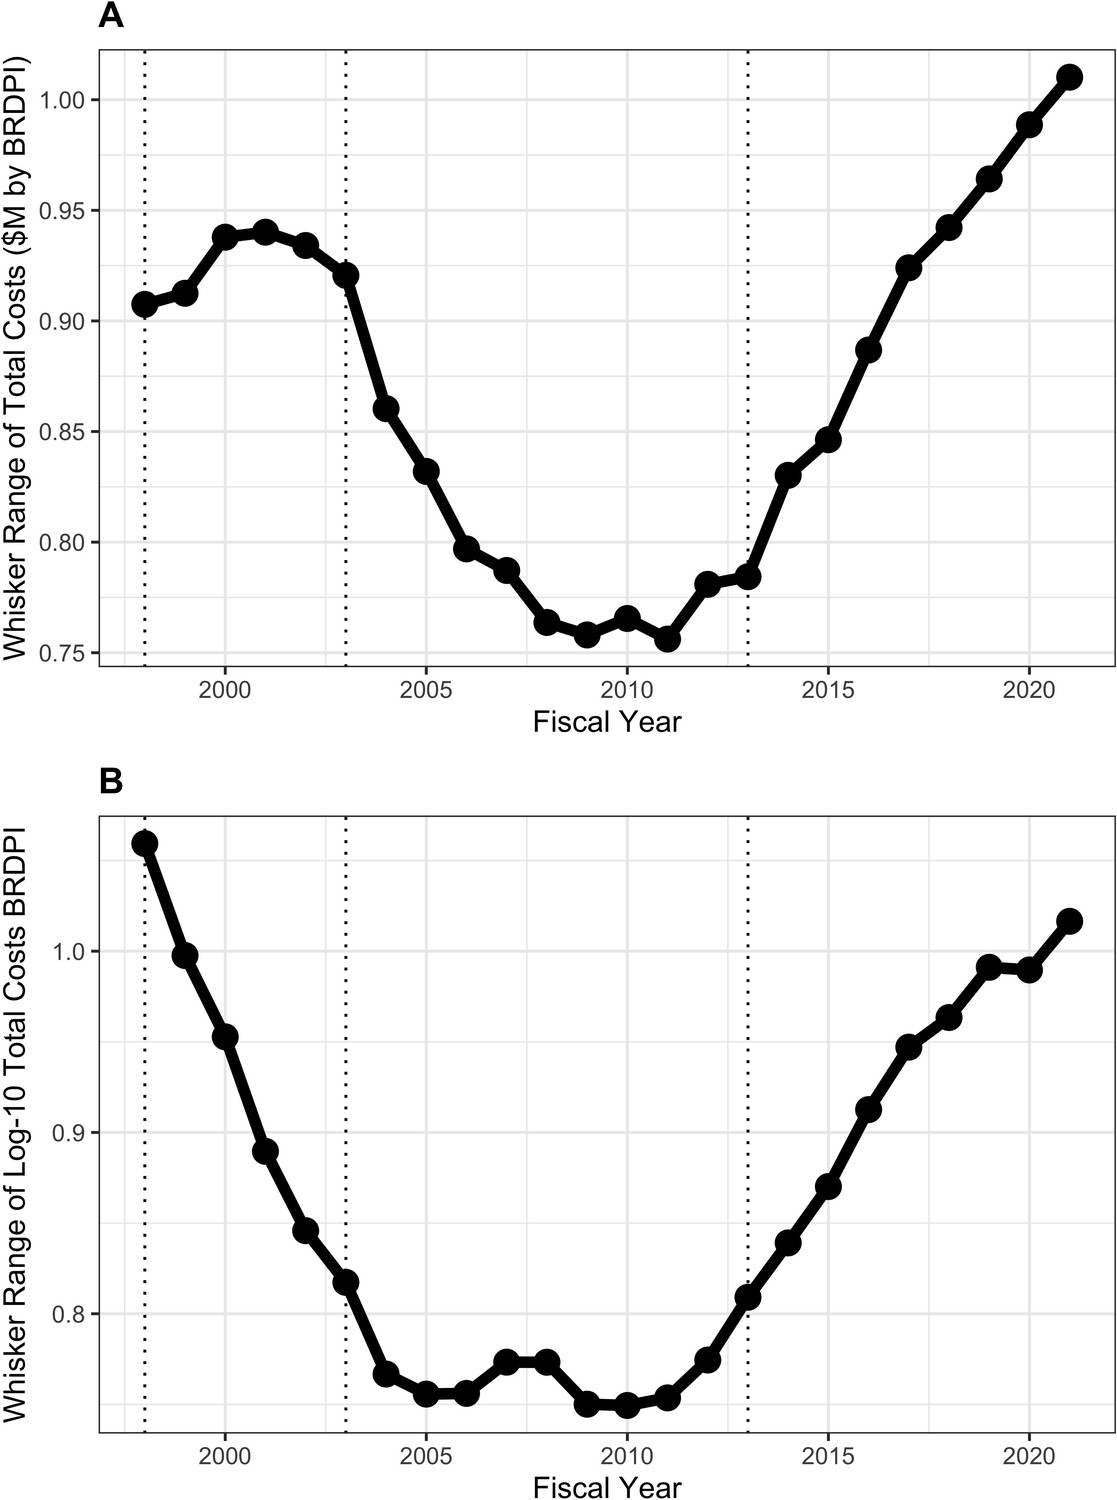
Whisker ranges, that is the distance between the tips of upper and lower whiskers, of box plots shown in Appendix 1—figure 2.
All costs are FY2021 BRDPI-adjusted. Panel A is based on untransformed real costs, while Panel B is based on log-10 transformed real costs. The vertical dotted lines refer to the beginning and end of the NIH budget-doubling (FY1998 and FY2003) and the year of budget sequestration (FY2013).
Figure 6
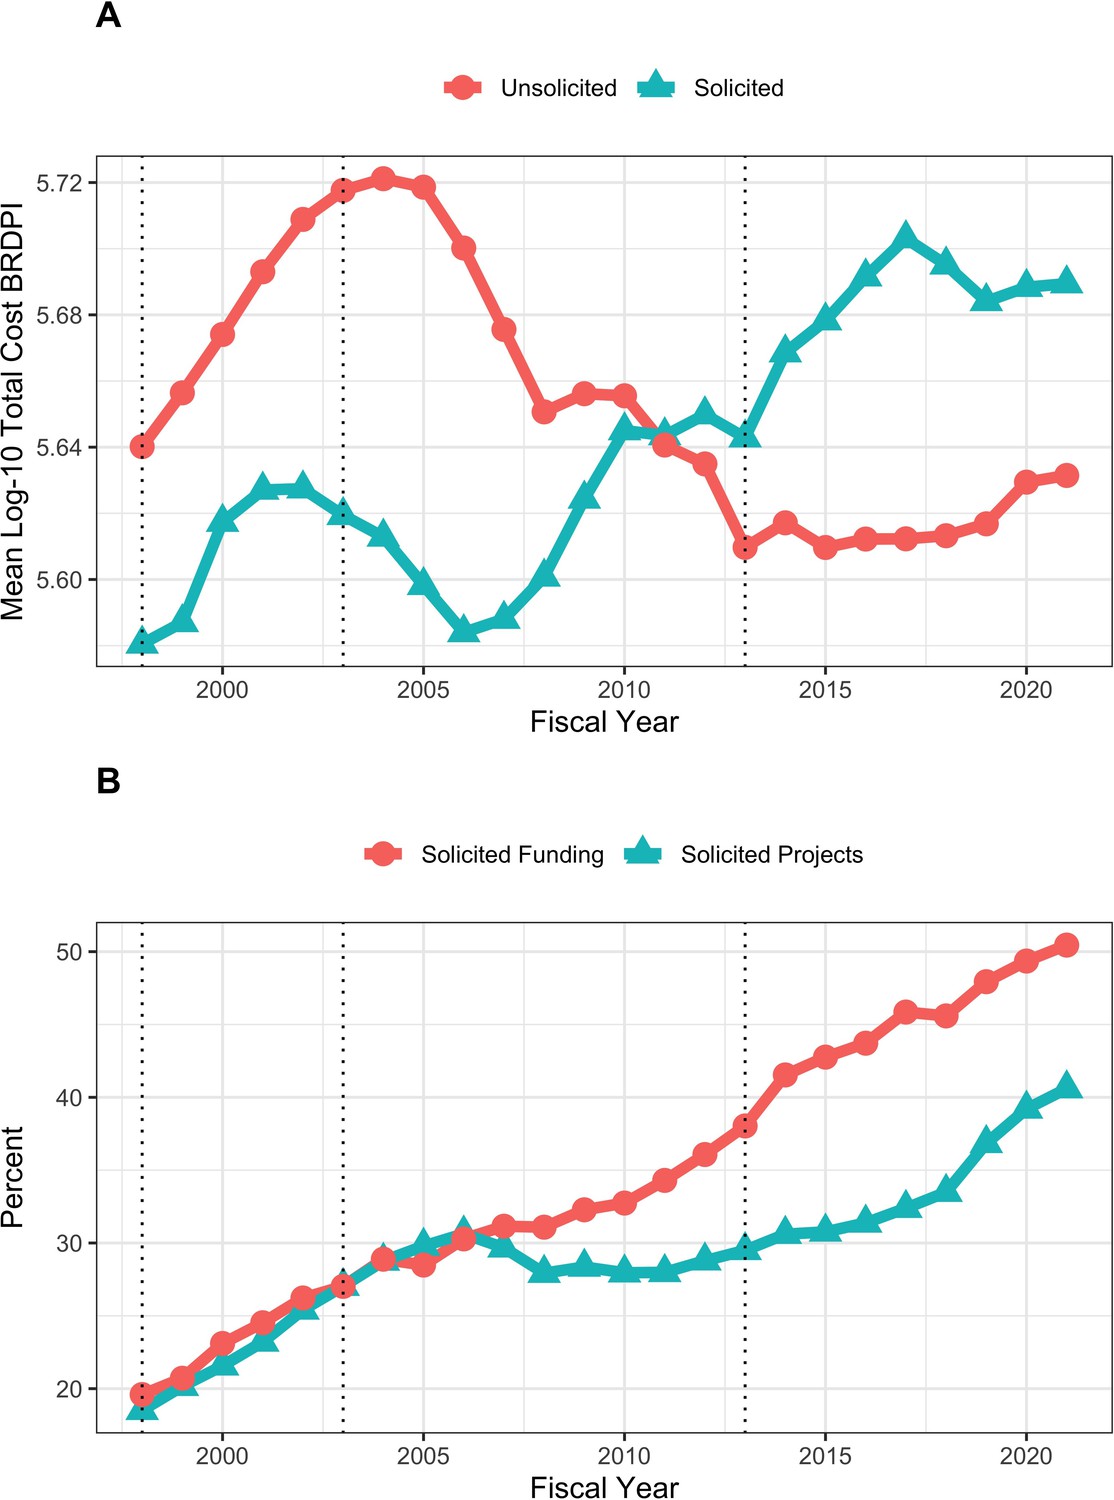
Trends in solicited and unsolicited RPGs FY1998 to FY2021.
(A): Log-transformed costs according to NIH solicitation. All costs are FY2021 BRDPI-adjusted. (B): Percent of RPG projects and percent of RPG funding going to solicited awards. The vertical dotted lines refer to the beginning and end of the NIH budget-doubling (FY1998 and FY2003) and the year of budget sequestration (FY2013).
Figure 7

Whisker ranges, that is the distance between the tips of upper and lower whiskers of box plots showing distribution of costs of unsolicited RPG awards (Appendix 1—figure 4).
All costs are FY2021 BRDPI-adjusted. Panel A is based on untransformed real costs, while Panel B is based on log-10 transformed real costs. The vertical dotted lines refer to the beginning and end of the NIH budget-doubling (FY1998 and FY2003) and the year of budget sequestration (FY2013).
Figure 8
Whisker ranges, that is the distance between the tips of upper and lower whiskers of box plots showing distribution of costs of solicited RPG awards (Appendix 1—figure 4).
All costs are FY2021 BRDPI-adjusted. Panel A is based on untransformed real costs, while Panel B is based on log-10 transformed real costs. The vertical dotted lines refer to the beginning and end of the NIH budget-doubling (FY1998 and FY2003) and the year of budget sequestration (FY2013).
Figure 9
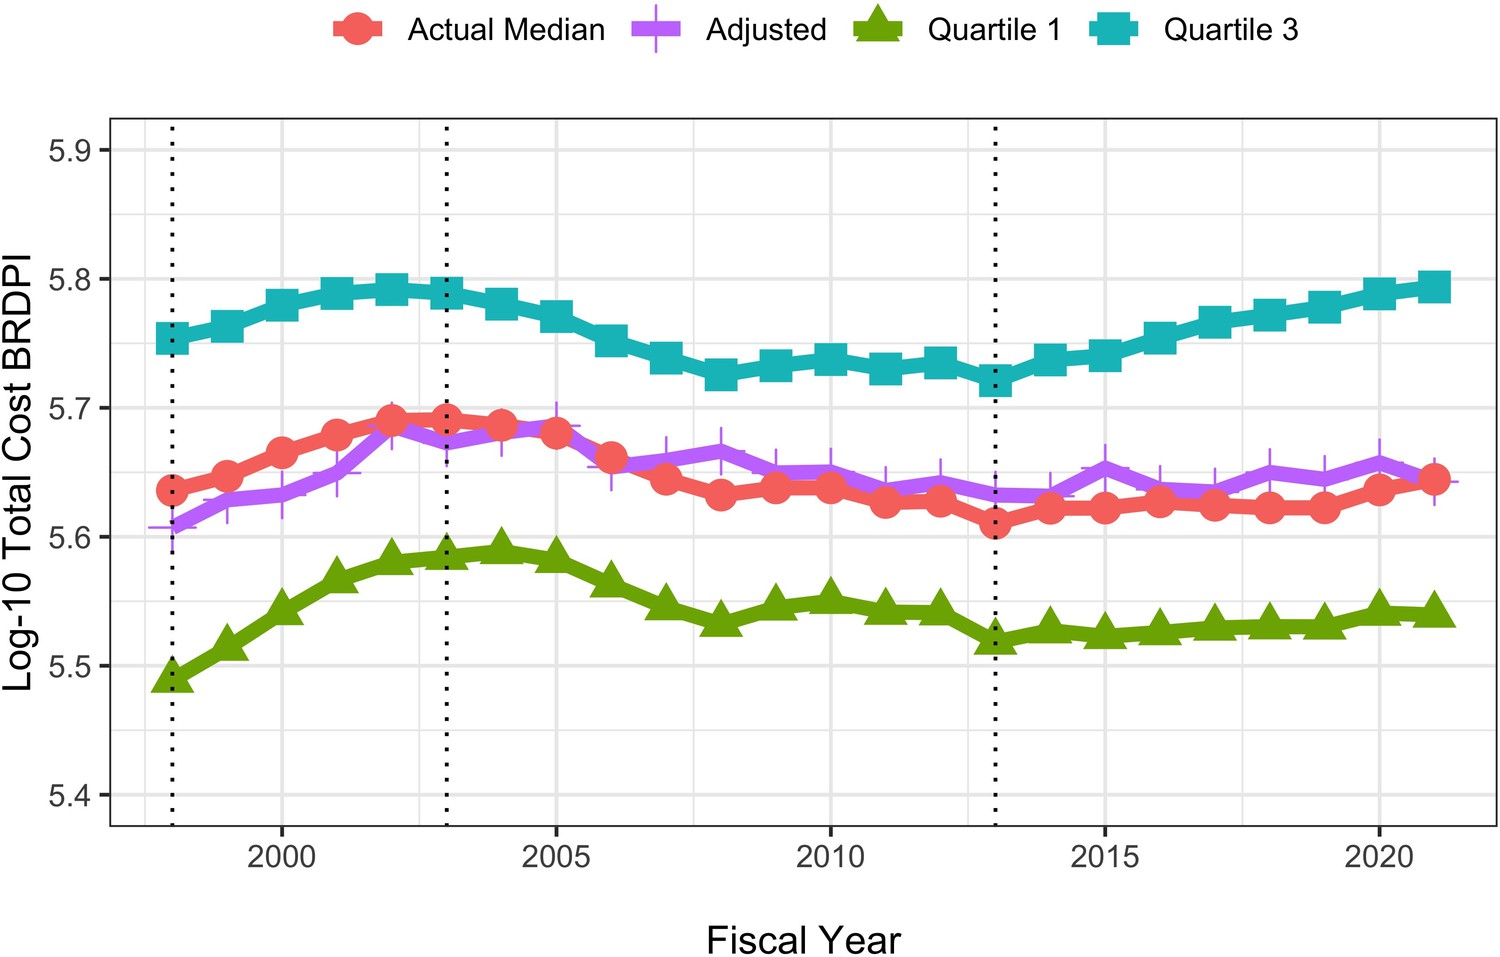
Actual and random-forest regression log-transformed costs for NIH-funded RPGs, FY1998 to FY2021.
All costs are FY2021 BRDPI-adjusted. The vertical dotted lines refer to the beginning and end of the NIH budget-doubling (FY1998 and FY2003) and the year of budget sequestration (FY2013).
Appendix 1—figure 1

Number of funded R01-equivalent awards by fiscal year.
The vertical dotted lines refer to the beginning and end of the NIH budget-doubling (FY1998 and FY2003) and the year of budget sequestration (FY2013).
Appendix 1—figure 2
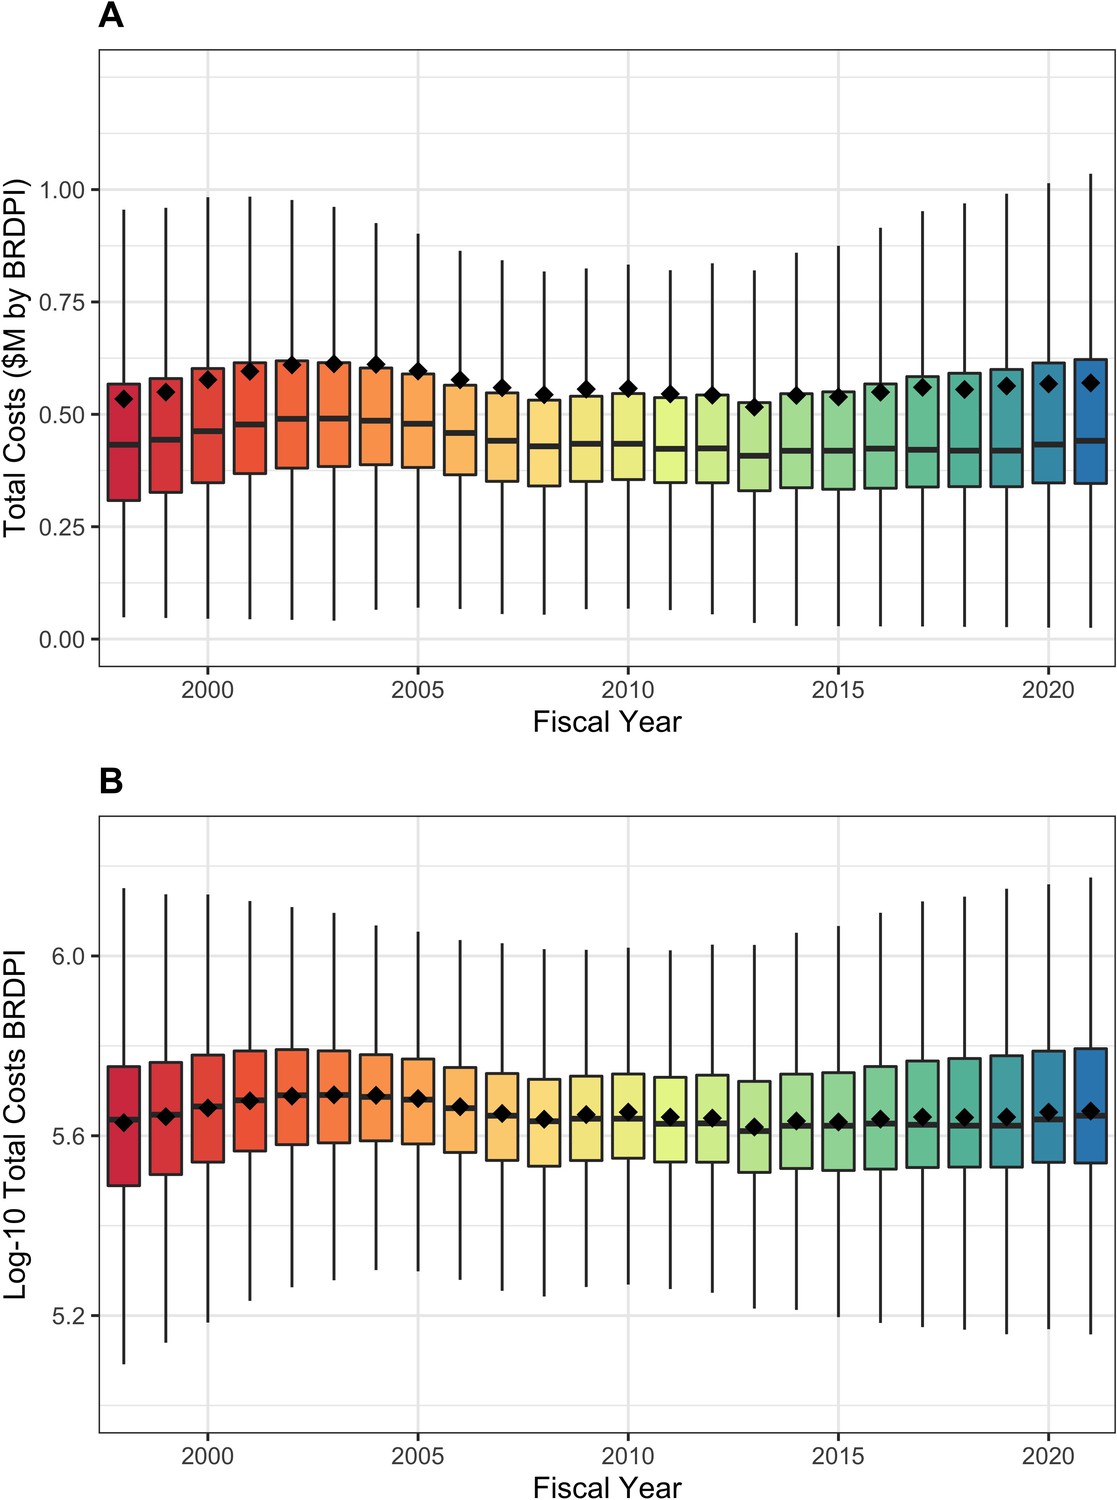
Box plot distributions of total costs (panel A) and log-transformed costs (panel B) for NIH-funded RPGs, FY1998 to FY2021.
The diamonds refer to mean values. All costs are FY2021 BRDPI-adjusted.
Appendix 1—figure 3

Distribution of total funds to the top and bottom centiles (A) and deciles (B) of NIH-funded RPGs, FY1998 to FY2021.
The vertical dotted lines refer to the beginning and end of the NIH budget-doubling (FY1998 and FY2003) and the year of budget sequestration (FY2013).
Appendix 1—figure 4
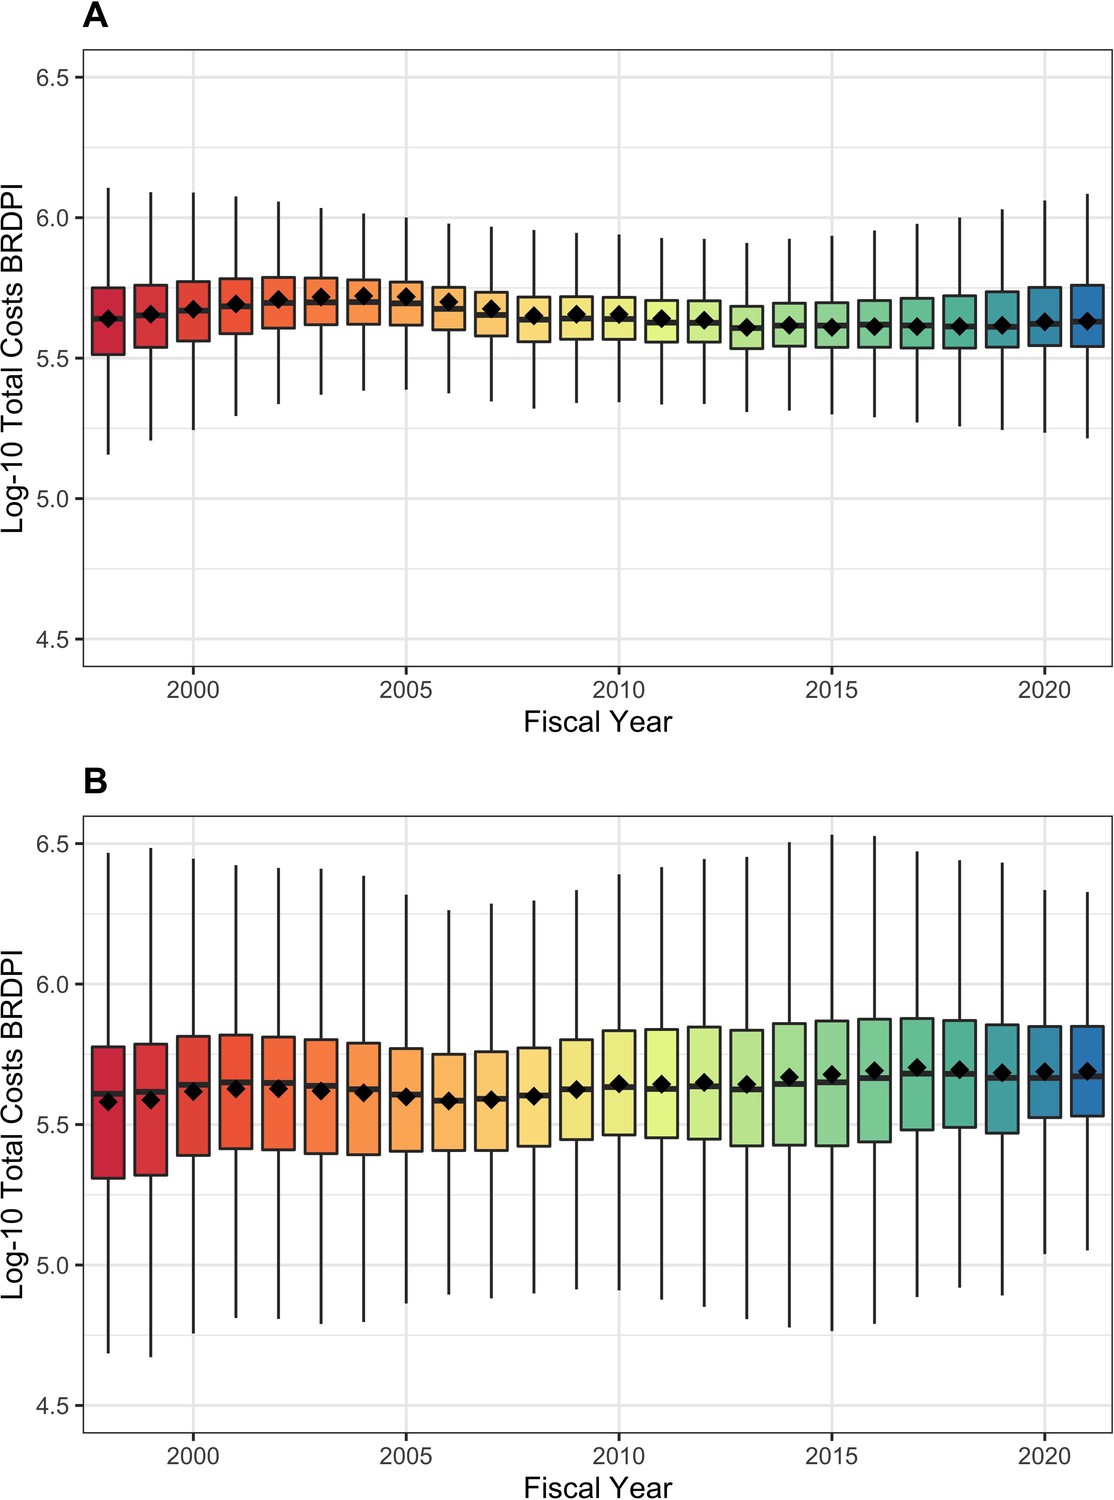
Box plot distributions of log-transformed costs for unsolicited (panel A) and solicited (panel B) NIH-funded RPGs, FY1998 to FY2021.
The diamonds refer to mean values. Y-axes are similarly scaled for easier comparison. All costs are FY2021 BRDPI-adjusted.
Appendix 1—figure 5
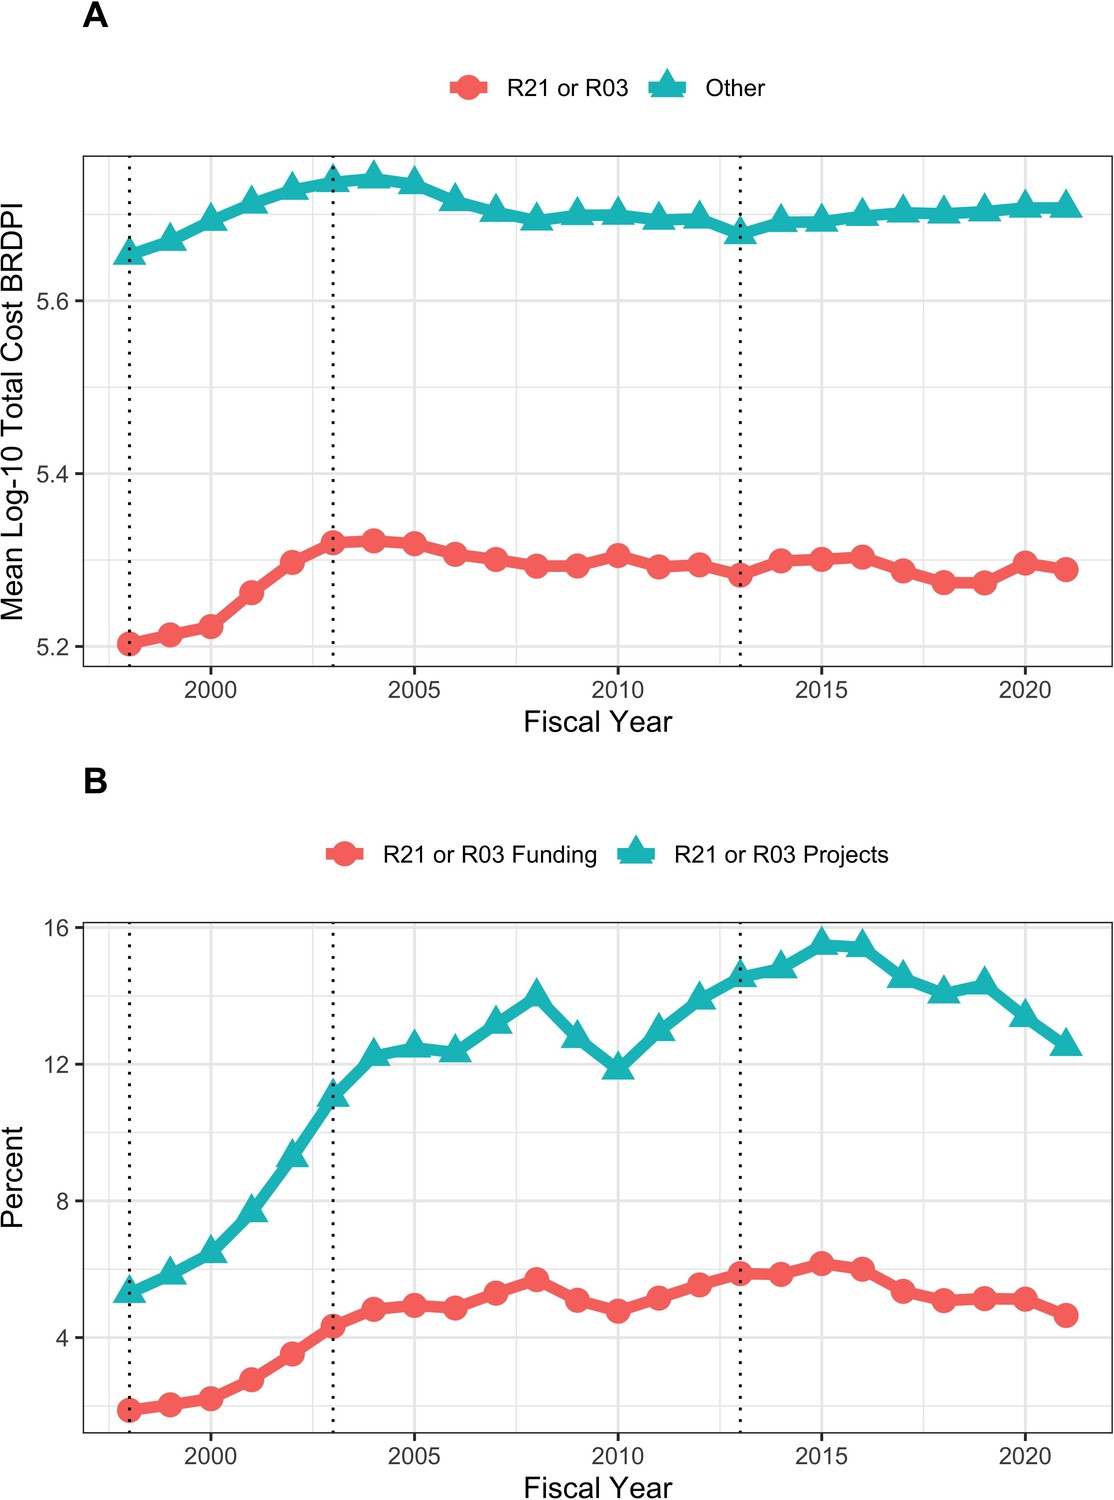
Trends in R21 and R03 projects and funding FY1998 to FY2021.
(A): Costs according to R21 and R03 projects versus of all others. All costs are FY2021 BRDPI-adjusted. (B): Percent of RPG projects and percent of RPG funding going to R21 and R03 projects. The vertical dotted lines refer to the beginning and end of the NIH budget-doubling (FY1998 and FY2003) and the year of budget sequestration (FY2013).
Appendix 1—figure 6
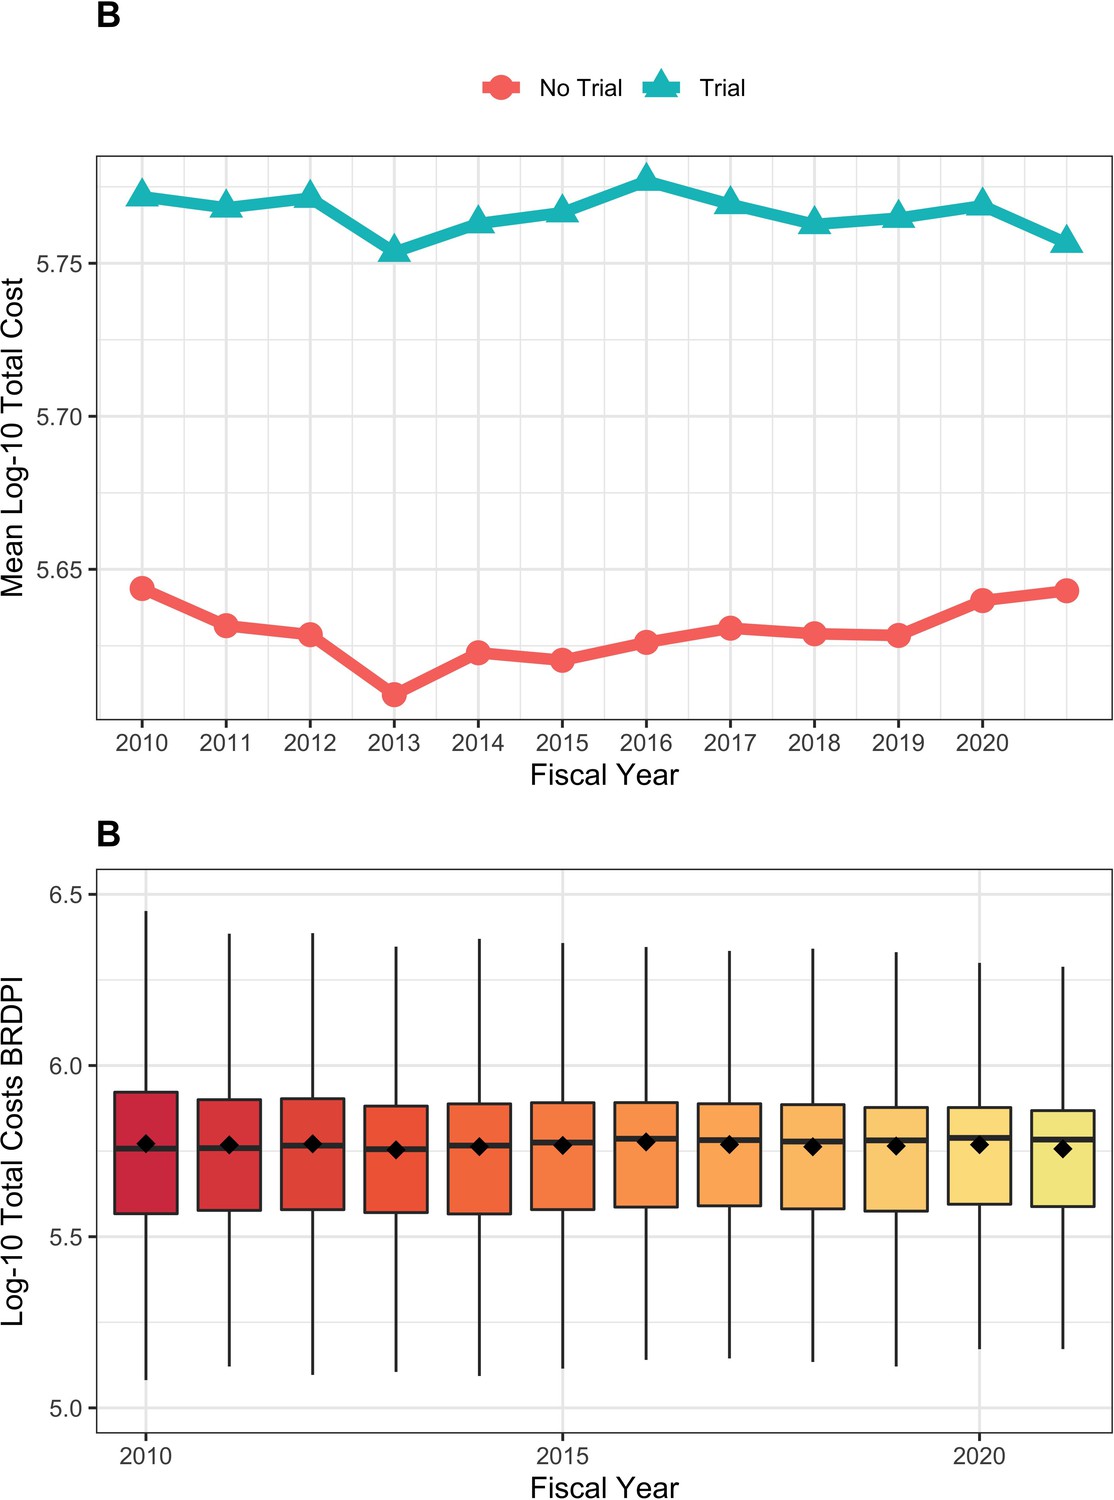
Trends in costs for RPGs involving and not involving clinical trials FY2010 to FY2021.
(A): Log-transformed costs according to clinical trials for NIH-funded RPGs, FY2010 to FY2021. (B): Box-plot distributions of log-transformed total costs for NIH-funded RPGs supporting clinical trials, FY2010 to FY2021. All costs are FY2021 BRDPI-adjusted.
Appendix 1—figure 7
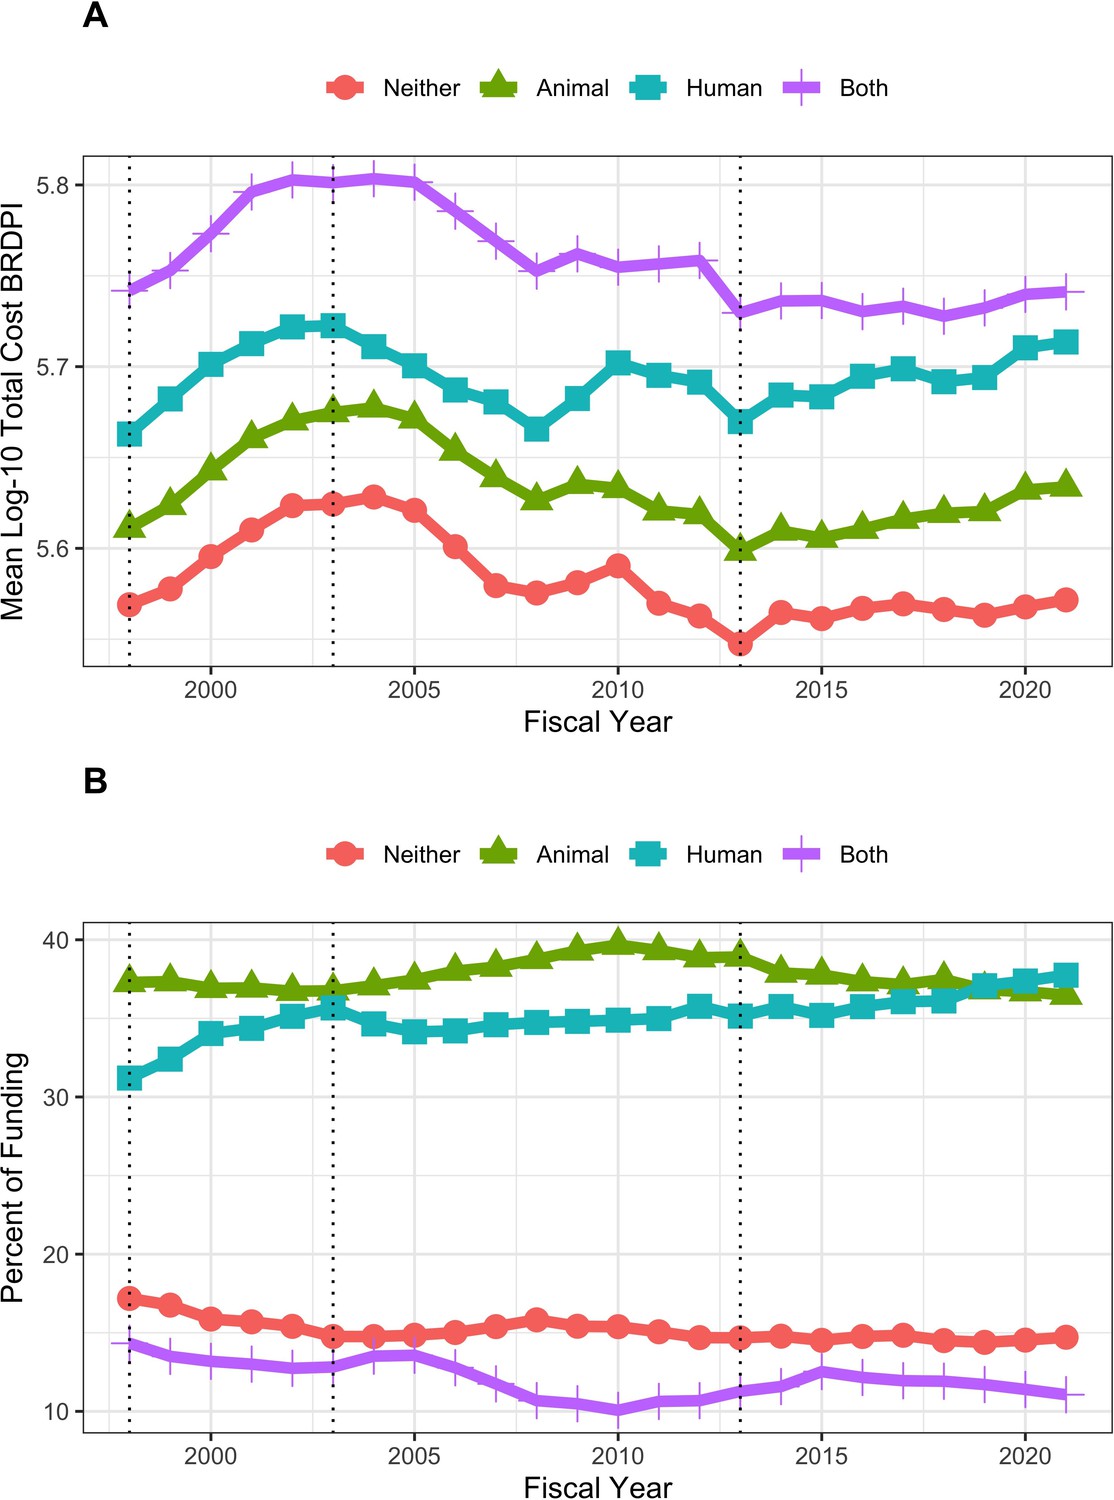
Trends in funding and costs for RPGs according to whether projects did or did not involve animal models and / or human participants FY1998 to FY2021.
(A): Log-transformed costs of NIH-funded RPGs according to involvement of human participants and/or animal models, FY1998 to FY2021. All costs are FY2021 BRDPI-adjusted. (B): Proportion of RPG-funding going to different types of projects according to involvement of human participants and/or animal models, FY1998 to FY2021. The vertical dotted lines refer to the beginning and end of the NIH budget-doubling (FY1998 and FY2003) and the year of budget sequestration (FY2013).
Tables
Table 1
Characteristics of RPGs in selected fiscal years.
| Characteristic | 1998 | 2003 | 2013 | 2019 | 2021 | |
|---|---|---|---|---|---|---|
| Total N (%) | 26882 (15.5) | 35513 (20.5) | 33047 (19.1) | 38241 (22.1) | 39513 (22.8) | |
| Total Costs ($M BRDPI) | Mean (SD) | 0.53 (0.58) | 0.61 (0.76) | 0.52 (0.70) | 0.56 (0.88) | 0.57 (0.90) |
| Log-10 Total Costs BRDPI | Mean (SD) | 5.63 (0.27) | 5.69 (0.26) | 5.62 (0.25) | 5.64 (0.27) | 5.65 (0.26) |
| Indirect Costs ($M BRDPI) | Mean (SD) | 0.17 (0.17) | 0.19 (0.19) | 0.16 (0.16) | 0.17 (0.22) | 0.17 (0.21) |
| Unsolicited | Yes | 21905 (81.5) | 25913 (73.0) | 23300 (70.5) | 24153 (63.2) | 23471 (59.4) |
| R01-Equivalent | Yes | 21543 (80.1) | 30124 (84.8) | 26199 (79.3) | 29341 (76.7) | 31258 (79.1) |
| R21 or R03 | Yes | 1424 (5.3) | 3920 (11.0) | 4805 (14.5) | 5478 (14.3) | 4949 (12.5) |
| Program Grant | Yes | 811 (3.0) | 984 (2.8) | 595 (1.8) | 374 (1.0) | 328 (0.8) |
| Cooperative Agreement | Yes | 623 (2.3) | 1493 (4.2) | 1709 (5.2) | 2437 (6.4) | 2404 (6.1) |
| Costs > $5 million BRDPI | Yes | 38 (0.1) | 102 (0.3) | 70 (0.2) | 140 (0.4) | 135 (0.3) |
| Clinical Trial | Yes | 2389 (7.2) | 3706 (9.7) | 4176 (10.6) | ||
| Human or Animal | Neither | 5715 (21.3) | 6799 (19.1) | 6197 (18.8) | 7207 (18.8) | 7627 (19.3) |
| Animal | 11357 (42.2) | 14877 (41.9) | 14842 (44.9) | 16231 (42.4) | 16633 (42.1) | |
| Human | 7063 (26.3) | 10529 (29.6) | 9424 (28.5) | 11275 (29.5) | 11820 (29.9) | |
| Both | 2747 (10.2) | 3308 (9.3) | 2584 (7.8) | 3528 (9.2) | 3433 (8.7) | |
| Organization Type | Institute of Higher Education | 22005 (81.9) | 28911 (81.4) | 27041 (81.8) | 31434 (82.2) | 32564 (82.4) |
| Research Organization | 2287 (8.5) | 3105 (8.7) | 2626 (7.9) | 2634 (6.9) | 2598 (6.6) | |
| Independent Hospital | 2097 (7.8) | 2634 (7.4) | 2641 (8.0) | 3367 (8.8) | 3495 (8.8) | |
| Other | 493 (1.8) | 863 (2.4) | 739 (2.2) | 806 (2.1) | 856 (2.2) |
-
RPG = Research Project Grant. BRDPI = Biomedical Research andDevelopment Price Index. All BRDPI-adjusted costs are based on an FY2021 reference (in other words, based on 2021 dollars).
Table 2
Characteristics of R01 equivalent grants in selected fiscal years.
| Characteristic | 1998 | 2003 | 2013 | 2019 | 2021 | |
|---|---|---|---|---|---|---|
| Total N (%) | 21543 (15.6) | 30124 (21.8) | 26199 (18.9) | 29341 (21.2) | 31258 (22.6) | |
| Total Costs ($M BRDPI) | Mean (SD) | 0.53 (0.48) | 0.60 (0.70) | 0.52 (0.48) | 0.56 (0.52) | 0.56 (0.50) |
| Log-10 Total Costs BRDPI | Mean (SD) | 5.67 (0.19) | 5.72 (0.20) | 5.66 (0.18) | 5.69 (0.19) | 5.70 (0.19) |
| Nominal Direct Costs ($M) | Mean (SD) | 0.19 (0.20) | 0.25 (0.36) | 0.30 (0.35) | 0.37 (0.41) | 0.39 (0.41) |
| Nominal Direct Costs $250 K or Less | Yes | 18962 (88.0) | 23701 (78.7) | 16288 (62.2) | 11824 (40.3) | 10351 (33.1) |
| Nominal Direct Costs $500 K or More | Yes | 485 (2.3) | 1243 (4.1) | 1652 (6.3) | 3625 (12.4) | 4450 (14.2) |
| Indirect Costs ($M BRDPI) | Mean (SD) | 0.17 (0.12) | 0.19 (0.15) | 0.16 (0.10) | 0.17 (0.13) | 0.18 (0.12) |
| Unsolicited | Yes | 18445 (85.6) | 24337 (80.8) | 19873 (75.9) | 20642 (70.4) | 20637 (66.0) |
| Costs > $5 million BRDPI | Yes | 23 (0.1) | 69 (0.2) | 33 (0.1) | 41 (0.1) | 47 (0.2) |
| Clinical Trial | Yes | 1818 (6.9) | 2581 (8.8) | 3046 (9.7) | ||
| Human or Animal | Neither | 4612 (21.4) | 5923 (19.7) | 4830 (18.4) | 5299 (18.1) | 5773 (18.5) |
| Animal | 9331 (43.3) | 12966 (43.0) | 12209 (46.6) | 12991 (44.3) | 13621 (43.6) | |
| Human | 5535 (25.7) | 8632 (28.7) | 7110 (27.1) | 8207 (28.0) | 9023 (28.9) | |
| Both | 2065 (9.6) | 2603 (8.6) | 2050 (7.8) | 2844 (9.7) | 2841 (9.1) | |
| Organization Type | Institute of Higher Education | 17646 (81.9) | 24616 (81.7) | 21461 (81.9) | 24119 (82.2) | 25811 (82.6) |
| Research Organization | 1814 (8.4) | 2567 (8.5) | 2068 (7.9) | 2006 (6.8) | 2007 (6.4) | |
| Independent Hospital | 1679 (7.8) | 2218 (7.4) | 2076 (7.9) | 2597 (8.9) | 2784 (8.9) | |
| Other | 404 (1.9) | 723 (2.4) | 594 (2.3) | 619 (2.1) | 656 (2.1) |
-
BRDPI = Biomedical Research and Development Price Index.All BRDPI-adjusted costs are based on an FY2021 reference (in other words, based on 2021 dollars).
Table 3
Characteristics of FY2021 and FY2010 RPGs according to solicitation status.
| Characteristic | Solicited 2021 | Unsolicited 2021 | Solicited 2010 | Unsolicited 2010 | |
|---|---|---|---|---|---|
| Total N (%) | 16042 (40.6) | 23471 (59.4) | 9697 (28.0) | 24986 (72.0) | |
| Total Costs ($M BRDPI) | Mean (SD) | 0.71 (1.36) | 0.48 (0.31) | 0.65 (1.28) | 0.52 (0.47) |
| Log-10 Total Costs BRDPI | Mean (SD) | 5.69 (0.33) | 5.63 (0.20) | 5.65 (0.35) | 5.66 (0.20) |
| R01-Equivalent | Yes | 10621 (66.2) | 20637 (87.9) | 6677 (68.9) | 22196 (88.8) |
| R21 or R03 | Yes | 2750 (17.1) | 2199 (9.4) | 2248 (23.2) | 1857 (7.4) |
| Costs > $5 million BRDPI | Yes | 121 (0.8) | 14 (0.1) | 55 (0.6) | 32 (0.1) |
| Cooperative Agreement | Yes | 2327 (14.5) | 77 (0.3) | 1478 (15.2) | 208 (0.8) |
| Clinical Trial | Yes | 3104 (19.3) | 1072 (4.6) | 1335 (13.8) | 1067 (4.3) |
| Human or Animal | Neither | 3407 (21.2) | 4220 (18.0) | 1632 (16.8) | 5096 (20.4) |
| Animal | 4579 (28.5) | 12054 (51.4) | 3151 (32.5) | 12696 (50.8) | |
| Human | 6823 (42.5) | 4997 (21.3) | 4287 (44.2) | 5347 (21.4) | |
| Both | 1233 (7.7) | 2200 (9.4) | 627 (6.5) | 1847 (7.4) | |
| Organization Type | Institute of Higher Education | 12983 (80.9) | 19581 (83.4) | 7662 (79.0) | 20848 (83.4) |
| Research Organization | 1214 (7.6) | 1384 (5.9) | 902 (9.3) | 1836 (7.3) | |
| Independent Hospital | 1419 (8.8) | 2076 (8.8) | 824 (8.5) | 1824 (7.3) | |
| Other | 426 (2.7) | 430 (1.8) | 309 (3.2) | 478 (1.9) |
-
RPG = Research Project Grant. BRDPI = Biomedical Research and Development Price Index. All BRDPI-adjusted costs are based on an FY2021 reference (in other words, basedon 2021 dollars).
Table 4
Characteristics of FY2021 and FY2010 R01 equivalent grant awards according to solicitation status.
| Characteristic | Solicited 2021 | Unsolicited 2021 | Solicited 2010 | Unsolicited 2010 | |
|---|---|---|---|---|---|
| Total N (%) | 10621 (34.0) | 20637 (66.0) | 6677 (23.1) | 22,196 (76.9) | |
| Total Costs ($M BRDPI) | Mean (SD) | 0.67 (0.73) | 0.51 (0.30) | 0.74 (1.19) | 0.50 (0.38) |
| Log-10 Total Costs BRDPI | Mean (SD) | 5.74 (0.24) | 5.67 (0.15) | 5.75 (0.27) | 5.67 (0.15) |
| Nominal Direct Costs ($M) | Mean (SD) | 0.47 (0.62) | 0.34 (0.23) | 0.42 (0.78) | 0.27 (0.26) |
| Nominal Direct Costs $250 K or Less | Yes | 3049 (28.7) | 7302 (35.4) | 3121 (46.7) | 15,702 (70.7) |
| Nominal Direct Costs $500 K or More | Yes | 2460 (23.2) | 1990 (9.6) | 1191 (17.8) | 832 (3.7) |
| Costs > $5 million BRDPI | Yes | 35 (0.3) | 12 (0.1) | 44 (0.7) | 26 (0.1) |
| Clinical Trial | Yes | 2126 (20.0) | 920 (4.5) | 976 (14.6) | 927 (4.2) |
| Human or Animal | Neither | 2337 (22.0) | 3436 (16.6) | 1017 (15.2) | 4525 (20.4) |
| Animal | 2902 (27.3) | 10719 (51.9) | 2202 (33.0) | 11,451 (51.6) | |
| Human | 4656 (43.8) | 4367 (21.2) | 3055 (45.8) | 4686 (21.1) | |
| Both | 726 (6.8) | 2115 (10.2) | 403 (6.0) | 1534 (6.9) | |
| Organization Type | Institute of Higher Education | 8650 (81.4) | 17161 (83.2) | 5259 (78.8) | 18,519 (83.4) |
| Research Organization | 791 (7.4) | 1216 (5.9) | 632 (9.5) | 1639 (7.4) | |
| Independent Hospital | 904 (8.5) | 1880 (9.1) | 579 (8.7) | 1604 (7.2) | |
| Other | 276 (2.6) | 380 (1.8) | 207 (3.1) | 434 (2.0) |
-
BRDPI = BiomedicalResearch and Development Price Index. All BRDPI-adjusted costs are based on an FY2021 reference (in other words, based on 2021dollars).
Appendix 1—table 1
Linear Regression Models for log-10 transformed BRDPI-adjusted (or real) total costs of RPGs funded from FY1998 to FY2021.
Values shown for each variable are regression coefficients (standard errors). Model 1 considers time (fiscal year) only, while Model 2 factors in other variables. Model 1 explained only 0.6% of total variance, while Model 2 explained 47% of variance. Regression diagnostics indicated poor fit due largely to fat tails, which were present even after log-10 transformation. Table constructed using the R package texreg; see Leifeld, 2013, Journal of Statistical Software, 55(8), 1–24.
| Model 1 | Model 2 | |
|---|---|---|
| Intercept | ||
| FY1999 | ||
| FY2000 | ||
| FY2001 | ||
| FY2002 | ||
| FY2003 | ||
| FY2004 | ||
| FY2005 | ||
| FY2006 | ||
| FY2007 | ||
| FY2008 | ||
| FY2009 | ||
| FY2010 | ||
| FY2011 | ||
| FY2012 | ||
| FY2013 | ||
| FY2014 | ||
| FY2015 | ||
| FY2016 | ||
| FY2017 | ||
| FY2018 | ||
| FY2019 | ||
| FY2020 | ||
| FY2021 | ||
| Unsolicited before 2010 | ||
| Unsolicited after 2010 | ||
| R01 Equivalent | ||
| Clinical Trial | ||
| Human Only | ||
| Animal Only | ||
| Both Human and Animal | ||
| Research Organization | ||
| Indepdent Hospital | ||
| Other Organization | ||
| Cooperative Agreement | ||
| Program Grant | ||
| R21 or R03 | ||
| R2 | 0.006 | 0.471 |
| Adj. R2 | 0.006 | 0.471 |
| Num. obs. | 827815 | 827815 |
| ; ; . | ||
-
∗∗∗p < 0.001;∗∗p < 0.01;∗p < 0.05.
Appendix 1—table 2
Results of random forest regression for log-10 transformed BRDPI-adjusted (or real) total costs of a 1% random sample of RPGs funded from FY1998 to FY2021.
A model that consider fiscal year as the sole variable only explained 0.3% of total variance. A model that included the 10 variables listed in the table explained 47% of the total variance. The variable importance reflects the deterioration in prediction error when the value for a variable is determined randomly, as opposed to its actual value. Variables reflecting compositional factors (like the type of award mechanism) were much more important than time (that is fiscal year) in predicting real total grant costs.
| Variable | Importance |
|---|---|
| Program Grant | 0.2615546 |
| R21 or R03 | 0.0990313 |
| Cooperative Agreement | 0.0954948 |
| R01 Equivalent | 0.0599555 |
| Fiscal Year | 0.0093220 |
| Organizational Type | 0.0091677 |
| Human | 0.0070634 |
| Unsolicited | 0.0037442 |
| Clinical Trial | 0.0034817 |
| Animal | 0.0030754 |
Additional files
-
MDAR checklist
- https://cdn.elifesciences.org/articles/84245/elife-84245-mdarchecklist1-v3.docx
-
Source data 1
BRDPI_change_2021 xlsx; data file with values for the Biomedical Research and Development Price Index (BRDPI) used to generate Figure 1, panel B.
- https://cdn.elifesciences.org/articles/84245/elife-84245-data1-v3.xlsx
-
Source data 2
GDP_change_2021 xlsx; data file with value for the Gross Domestic Product (GDP) Price Index used to generate Figure 1, panel B.
- https://cdn.elifesciences.org/articles/84245/elife-84245-data2-v3.xlsx
-
Source data 3
rpg_anon_id RData; anonymized source data (in format) used to generate all text, tables, and figures (except Figure 1, panel B and the red line with circles in Figure 1, panel A) in the main manuscript and appendix.
- https://cdn.elifesciences.org/articles/84245/elife-84245-data3-v3.zip
-
Source data 4
awardee_summary RData; source data (in format) used to generate the red line (with circles) in Figure 1, panel A.
- https://cdn.elifesciences.org/articles/84245/elife-84245-data4-v3.zip
-
Source code 1
RPG inflation 1 16 23 Rmd: markdown file which contains a data dictionary and code used to generate all text, tables, and figures in the main manuscript.
- https://cdn.elifesciences.org/articles/84245/elife-84245-code1-v3.zip
-
Source code 2
RPG inflation 1 16 23 appendix Rmd: markdown file which contains a data dictionary and code used to generate all text, tables, and figures in the appendix.
- https://cdn.elifesciences.org/articles/84245/elife-84245-code2-v3.zip
Download links
A two-part list of links to download the article, or parts of the article, in various formats.
Downloads (link to download the article as PDF)
Open citations (links to open the citations from this article in various online reference manager services)
Cite this article (links to download the citations from this article in formats compatible with various reference manager tools)
National Institutes of Health research project grant inflation 1998 to 2021
eLife 12:e84245.
https://doi.org/10.7554/eLife.84245


