Complementary CRISPR screen highlights the contrasting role of membrane-bound and soluble ICAM-1 in regulating antigen-specific tumor cell killing by cytotoxic T cells
- Department of Cancer Immunology and Immune Modulation, Boehringer Ingelheim, Germany
- Department of Drug Discovery Sciences, Boehringer Ingelheim, Germany
- Ardigen SA, Poland
- Department of Global Computational Biology and Digital Sciences, Boehringer Ingelheim, Germany
- Drug Discovery Sciences, Boehringer Ingelheim, Germany
Figures
Figure 1
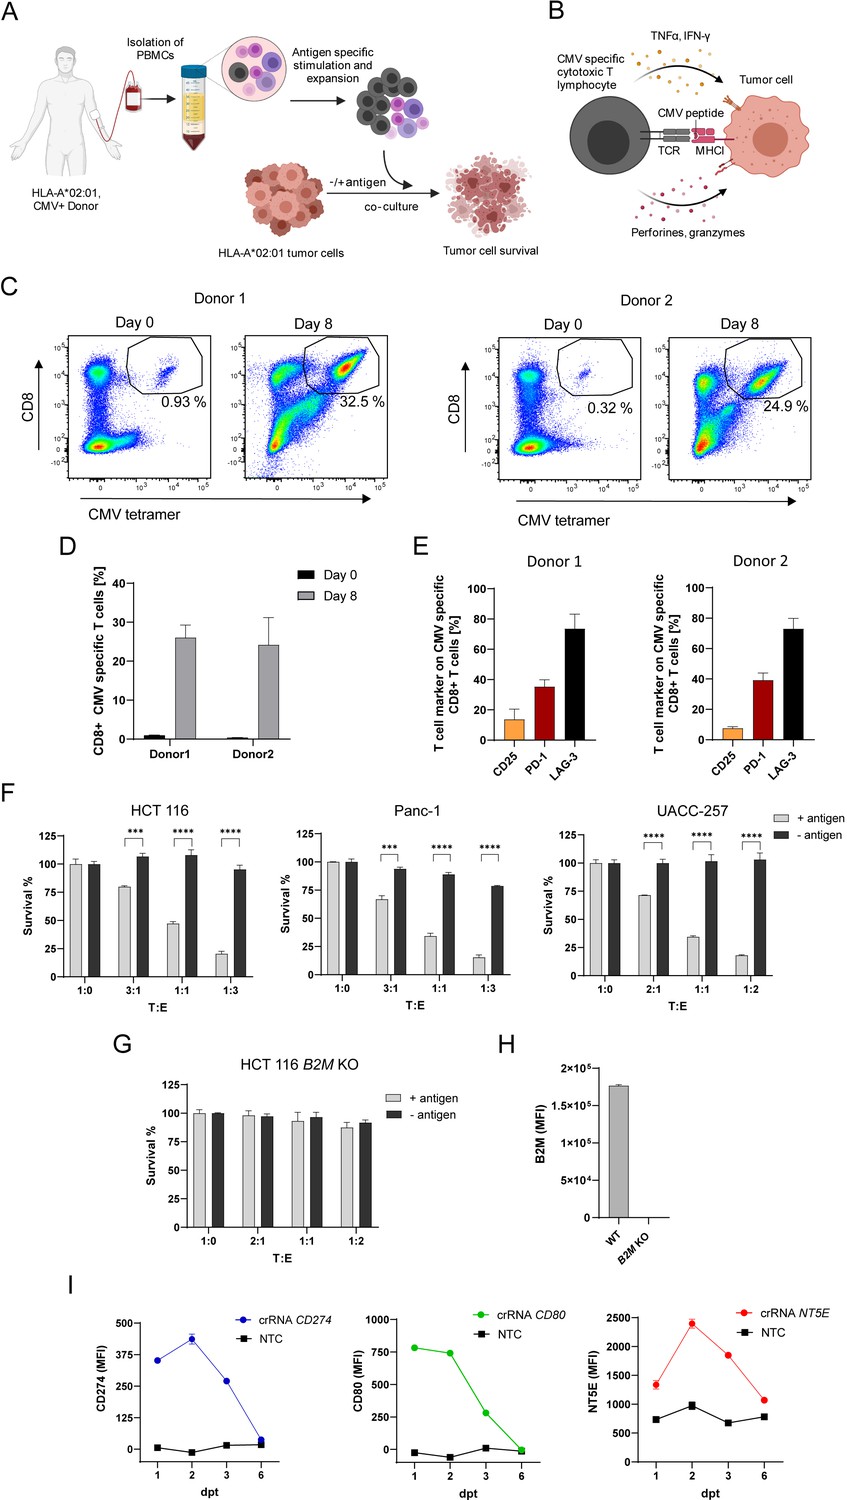
In vitro system to investigate genes function in antigen-specific tumor killing.
(A) Schematic of CMV specific CTL expansion within isolated PBMCs from HLA-A*0201 healthy CMV-seropositive Donors followed by tumor killing assay. Tumor cells either loaded with CMV pp65 antigenic peptide or untreated were co-cultured with PBMCs containing antigen specific CTLs and tumor cell survival was measured using a luminescent cell viability assay. (B) Schematic of CMV-specific tumor killing by CTLs. CMV-specific CTL recognize CMV antigen presented in an HLA-A*02:01 restricted manner on tumor cells and release cytokines and cytotoxic granules containing perforins and granzymes to specifically kill tumor cells. (C) Representative dot plots of CMV pp65495-503 tetramer-positive/CD8 + T cells measured at day 0 and day 8 after stimulation for both Donors used in this study (each n=3). (D) Bar graph of acquired frequency of CMV pp65495-503 tetramer-positive/CD8 +T cells (n=3). (E) Amount of CD25+, PD-1 +and LAG-3 +CMV specific CD8 + T cells (n=3). (F) Cell survival of HCT 116, Panc-1 and UACC-257 after 3 days of co-culturing with different ratios of PBMC containing antigen specific CTLs in antigen presence or absence. Bar graphs show normalized mean ± SD of triplicate representative for three independent experiments. Statistical significance was calculated using two-tailed t tests with adjustments for multiple comparisons (***p<0.001****, p<0.0001). (G) Cell survival of HCT 116 B2M KO cells assessed with tumor killing assay. Bar graphs show normalized mean ± SD of triplicate representative for two independent experiments. (H) Median fluorescence intensity of B2M expression of HCT 116 and B2M KO cells measured with flow cytometry (n=2). (I) Mean fluorescence intensities over time of PD-L1, CD80 and NT5E in HCT 116 dCas9 cells after induction of gene expression using CRISPRa compared to non-targeting control (NTC) (n=2).
Figure 2
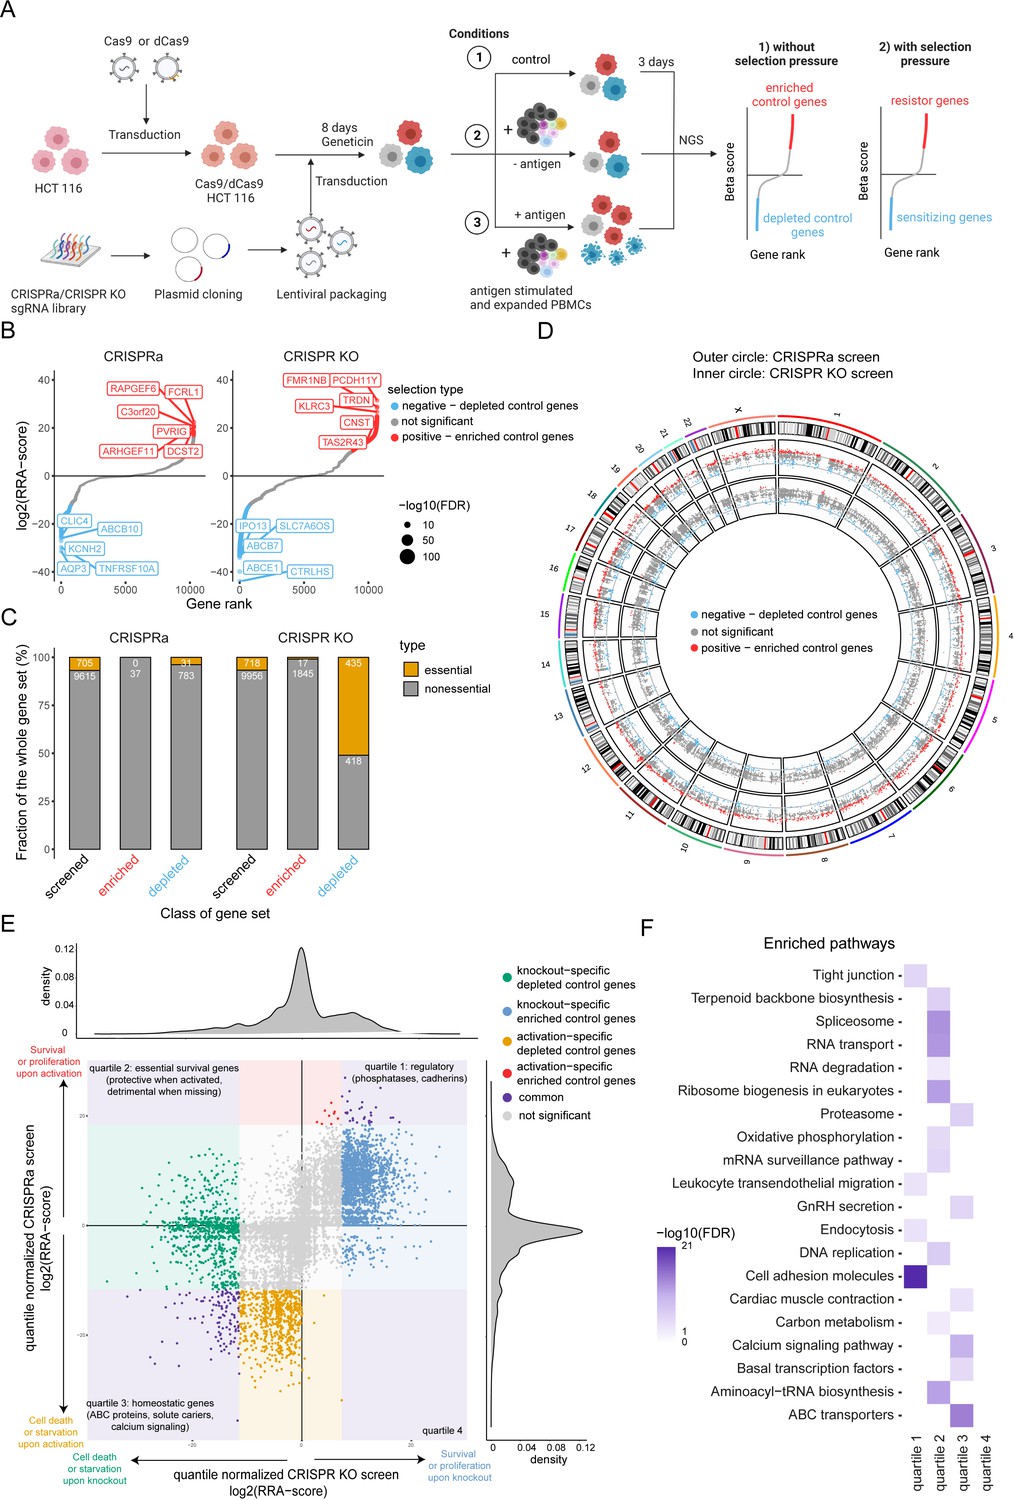
Design of a complementary CRISPR activation/CRISPR KO screen.
(A) Schematic of complementary CRISPR KO/CRISPRa screen setup. HLA-A*0201+ HCT 116 Cas9 or dCas9 colon carcinoma cells were transduced with the respective sgRNA library targeting approx. 10,000 annotated genes. Cells were exposed to PBMCs containing antigen specific CTLs in the presence or absence of CMV antigenic peptide. Control condition was not exposed to PBMCs and antigen. Next-generation sequencing (NGS) was used to determine sgRNA representation of each condition. Each condition was performed in triplicate. (B) Ranked-ordered, RRA scores (robust ranking aggregation; log2 fold change) for control selection CRISPRa (left) and CRISPR KO (right) screens in absence of PBMCs and antigen. Hits at FDR <2% are highlighted in red (positive selection – enriched control genes) and blue (negative selection – depleted control genes) with the top ten best scoring hits being indicated. (C) Enrichment of essential genes (orange; Atlas project - Depmap) as a fraction of gene subset: all screened (black), enriched control genes (red), and depleted control genes (blue) for CRISPRa (left) and CRISPR KO (right) screens. The raw gene counts are indicated in white. (D) Overview of gene coverage per chromosome for CRISPR KO (inner circle) and CRISPRa (outer circle); red - enriched control genes, blue - depleted control genes, gray - not significant gene hits. (E) Global relation of screened genes between CRISPRa and CRISPR KO assays: purple – common gene hits, red and blue – enriched control gene hits (CRISPRa and CRISPR KO respectively), orange and green - depleted control gene hits (CRISPRa and CRISPR KO respectively). (F) Most significant pathways according to KEGG enriched among the significant gene hits of (E).
-
Figure 2—source data 1
The excel file contains enrichment/depletion scores for each gene, their significance and categorization (control condition: tumor cells only).
- https://cdn.elifesciences.org/articles/84314/elife-84314-fig2-data1-v3.xlsx
Figure 3 with 1 supplement
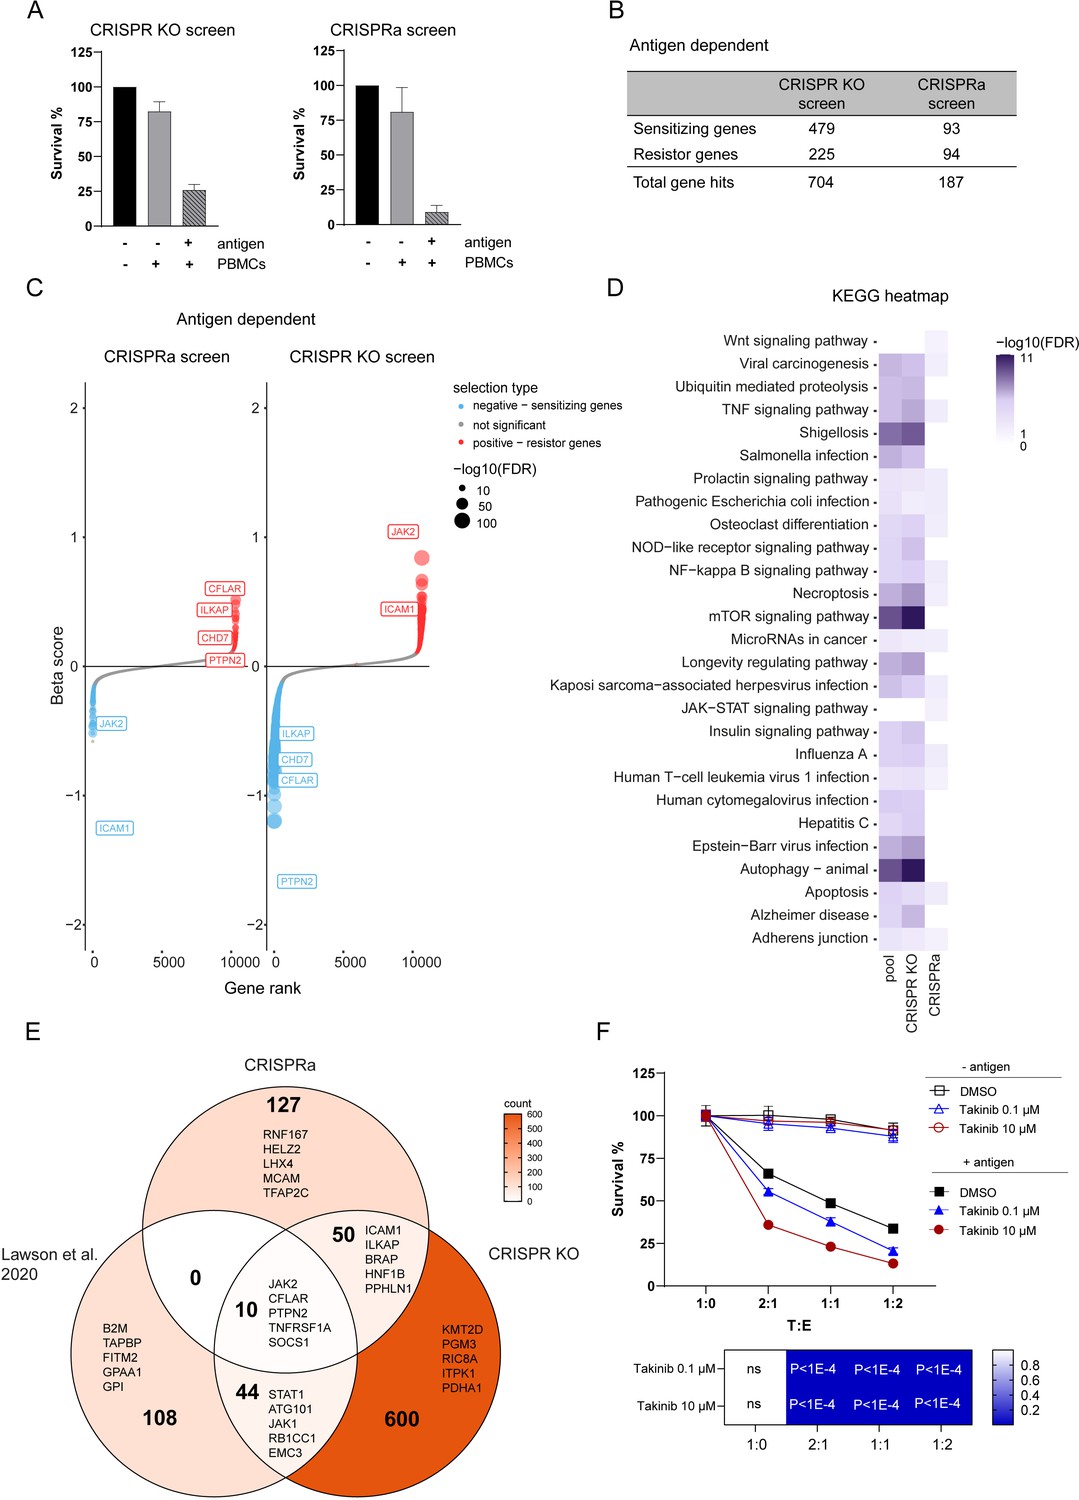
Discovery of genes regulating tumor resistance and sensitivity to CTL killing.
(A) Cell survival after co-culturing with PBMCs containing antigen specific CTLs for 3 days normalized to tumor cells not exposed to PBMCs and antigen for CRISPR KO (left) and CRISPRa (right) screen. (B) Table displaying the numbers of gene hits specific for antigen-dependent setup identified by CRISPR KO and CRISPRa screen. (C) Ranked-ordered, beta-scores for antigen-dependent screen setup (CRISPRa – left; CRISPR KO – right). The top best scoring overlapping gene hits between CRISPR KO and CRISPRa screen are indicated. Hits at FDR <5% are highlighted in red (positive selection - resistor genes) and blue (negative selection - sensitizing genes). (D) KEGG pathway enrichments for top 15 best scoring pathways in CRISPR KO, CRISPRa or pooled screen hits represented as heatmap: white – not statically significant (FDR corrected hypergeometric overrepresentation test). (E) Venn diagram displaying intersection of CRISPRa screen gene hits, CRISPR KO screen gene hits and previously published tumor resistance core gene data set of Lawson et al., 2020. Top 5 ranked genes were indicated in each sector. (F) Tumor killing assay in the presence of different concentrations of TAK1 inhibitor (Takinib) as indicated or DMSO control and cell survival was measured after 3 days (top). Bar graphs show normalized mean ± SD in triplicate representative for two independent experiments. Two-way ANOVA corrected for multiple comparison according to Dunnett was used to determine statistical significance (bottom) (ns: not significant).
-
Figure 3—source data 1
Complete list of screened genes containing beta-scores, FDR and specificity.
- https://cdn.elifesciences.org/articles/84314/elife-84314-fig3-data1-v3.xlsx
Figure 3—figure supplement 1
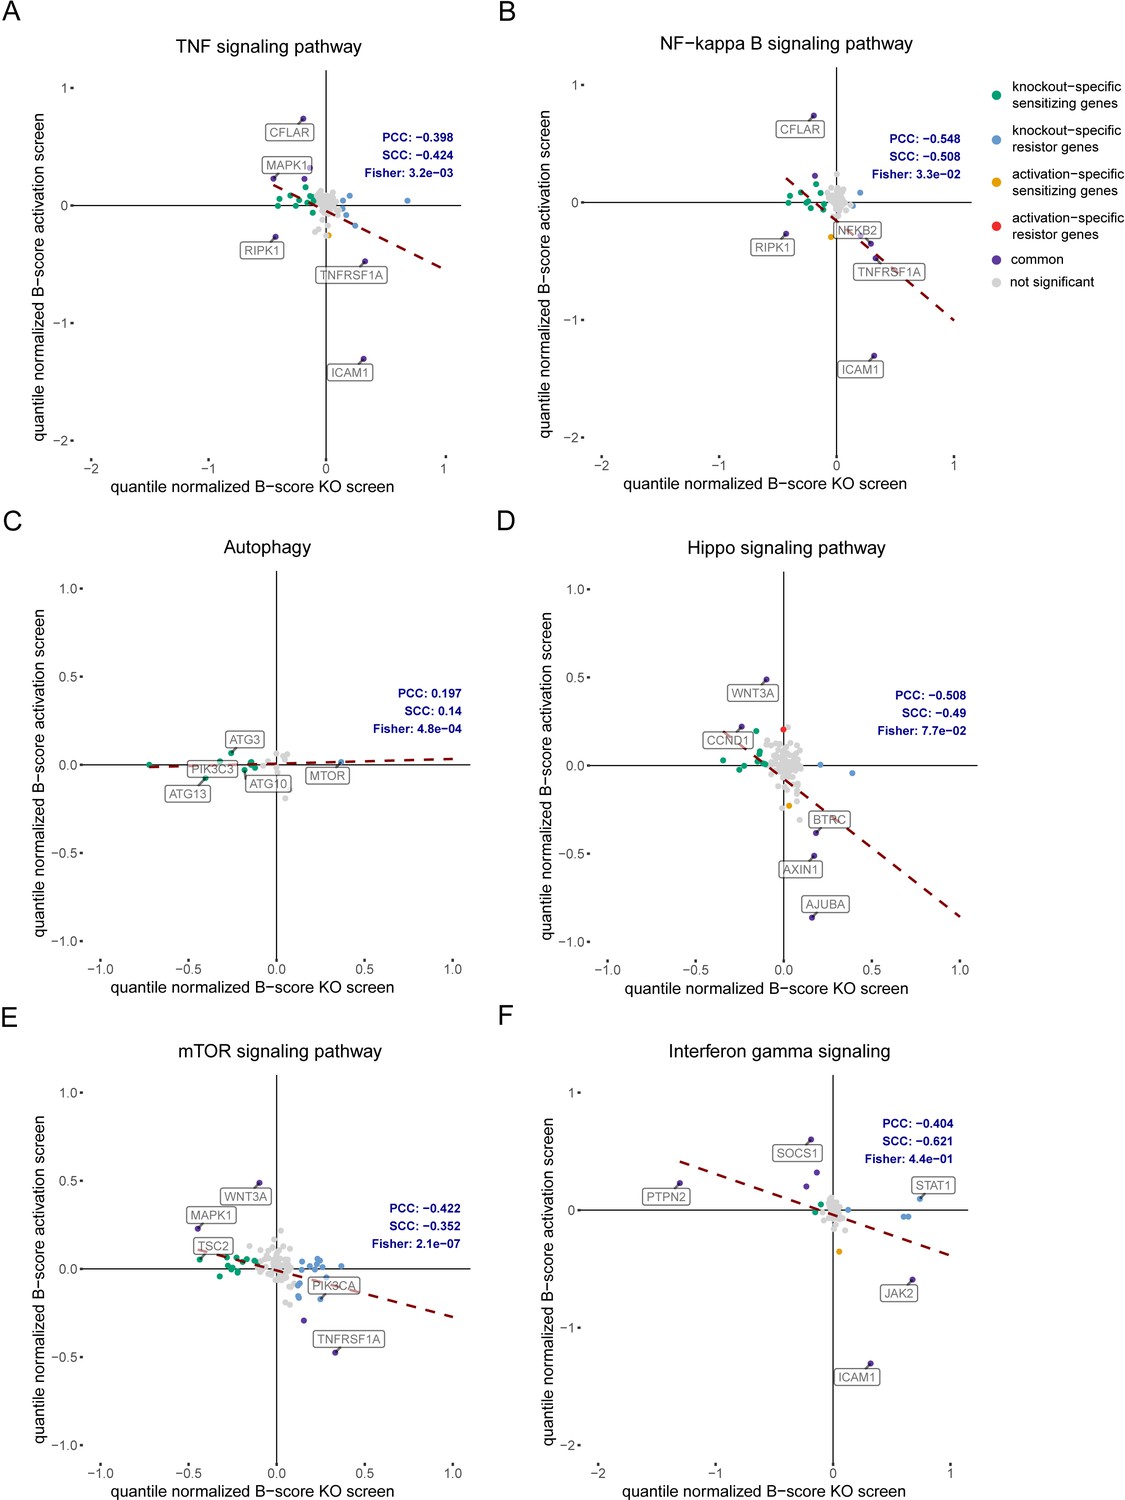
Correlation between CRISPR KO and CRISPRa screen gene hits within certain pathways.
Pearson’s or Spearman’s correlation between gene hits in antigen-dependent CRISPR KO and CRISPRa screens for (A) TNF signaling pathway, (B) NF-kB signaling pathway, (C) autophagy, (D) hippo signaling pathway, (E) mTOR signaling pathway and (F) IFN-γ signaling pathway. Beta scores were quantile-normalized and dashed lines indicate trendline for screen hits. Gray – not significant targets (FDR >5% or beta-score absolute value <1), green – KO specific sensitizing genes, blue – KO specific resistor genes; orange – activation specific sensitizing genes, red – activation specific resistor genes, purple – common gene hits.
Figure 4
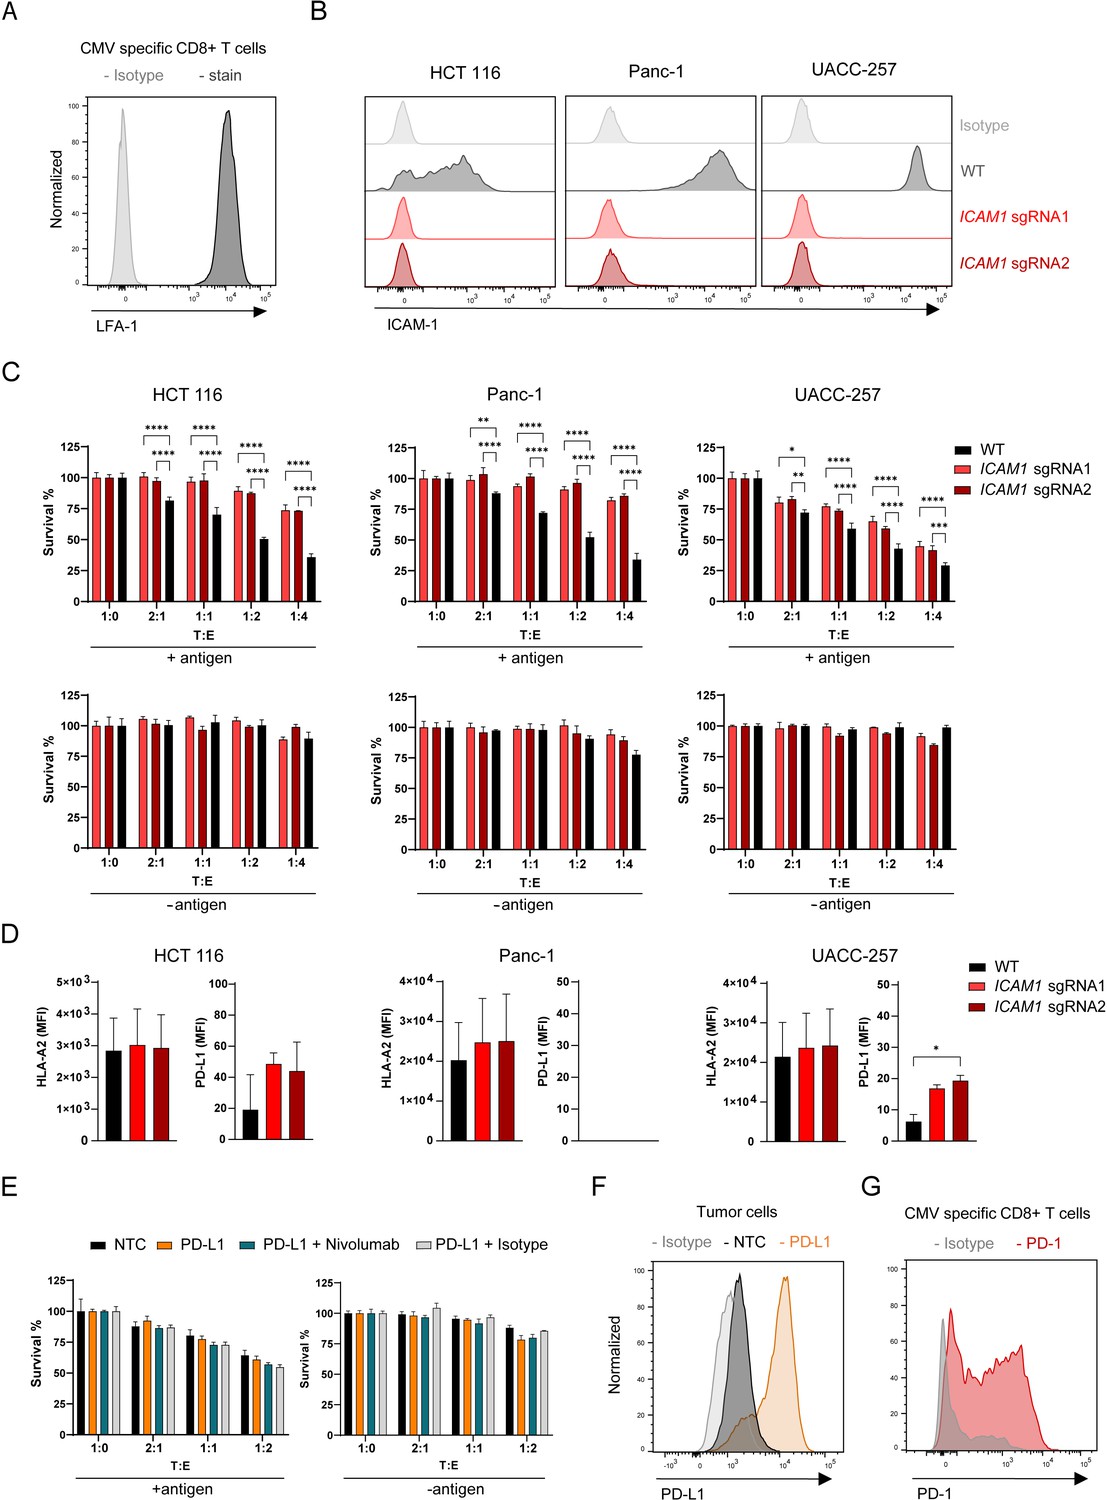
Depletion of ICAM1 induces tumor resistance to antigen-specific CTL killing.
(A) LFA-1 cell surface expression of CMV-specific CD8 + T cells measured by flow cytometry displayed as histogram (n=2). (B) Histograms showing ICAM-1 levels of HCT 116, Panc-1 and UACC-257 cell lines and respective KO pools after fluorescence activated cell sorting (n=3). (C) Cell survival of antigen loaded and untreated HCT 116, Panc-1, UACC-257 cells and ICAM1 KO pools using CRISPR KO and 2 sgRNAs cells against CTL killing after 3 days of co-culturing with different ratios of PBMCs containing antigen specific CTLs. Bar graphs show normalized mean ± SD of triplicate representative for two (Panc-1, UACC-257) or three (HCT-116) independent experiments. Two-way ANOVA corrected for multiple comparison according to Dunnett was used to determine statistical significance (*p<0.05, **p<0.01, ***p<0.001, ****p<0.0001). (D) Mean fluorescence intensities of HLA-A2 and PD-L-1 on the cell surface of HCT 116 WT or HCT 116 ICAM1 KO cells. Bar graphs show mean ± s.e.m (n=2). Unpaired two-tailed t test was used to determine statistical significance (*p<0.05). (E) Cell survival of untreated or antigen loaded HCT 116 and HCT 116 PD-L1 cells in the presence of Nivolumab or isotype with different ratios of PBMCs containing antigen-specific CTLs. Bar graphs show normalized mean ± s.e.m. in triplicate representative for two independent experiments. (F) Representative histogram of CRISPRa-induced PDL1 expression in HCT 116 cells (n=2). NTC = non-targeting control. (G) Representative histogram of PD-1 expression of stimulated CMV-specific CTLs (n=3).
Figure 5
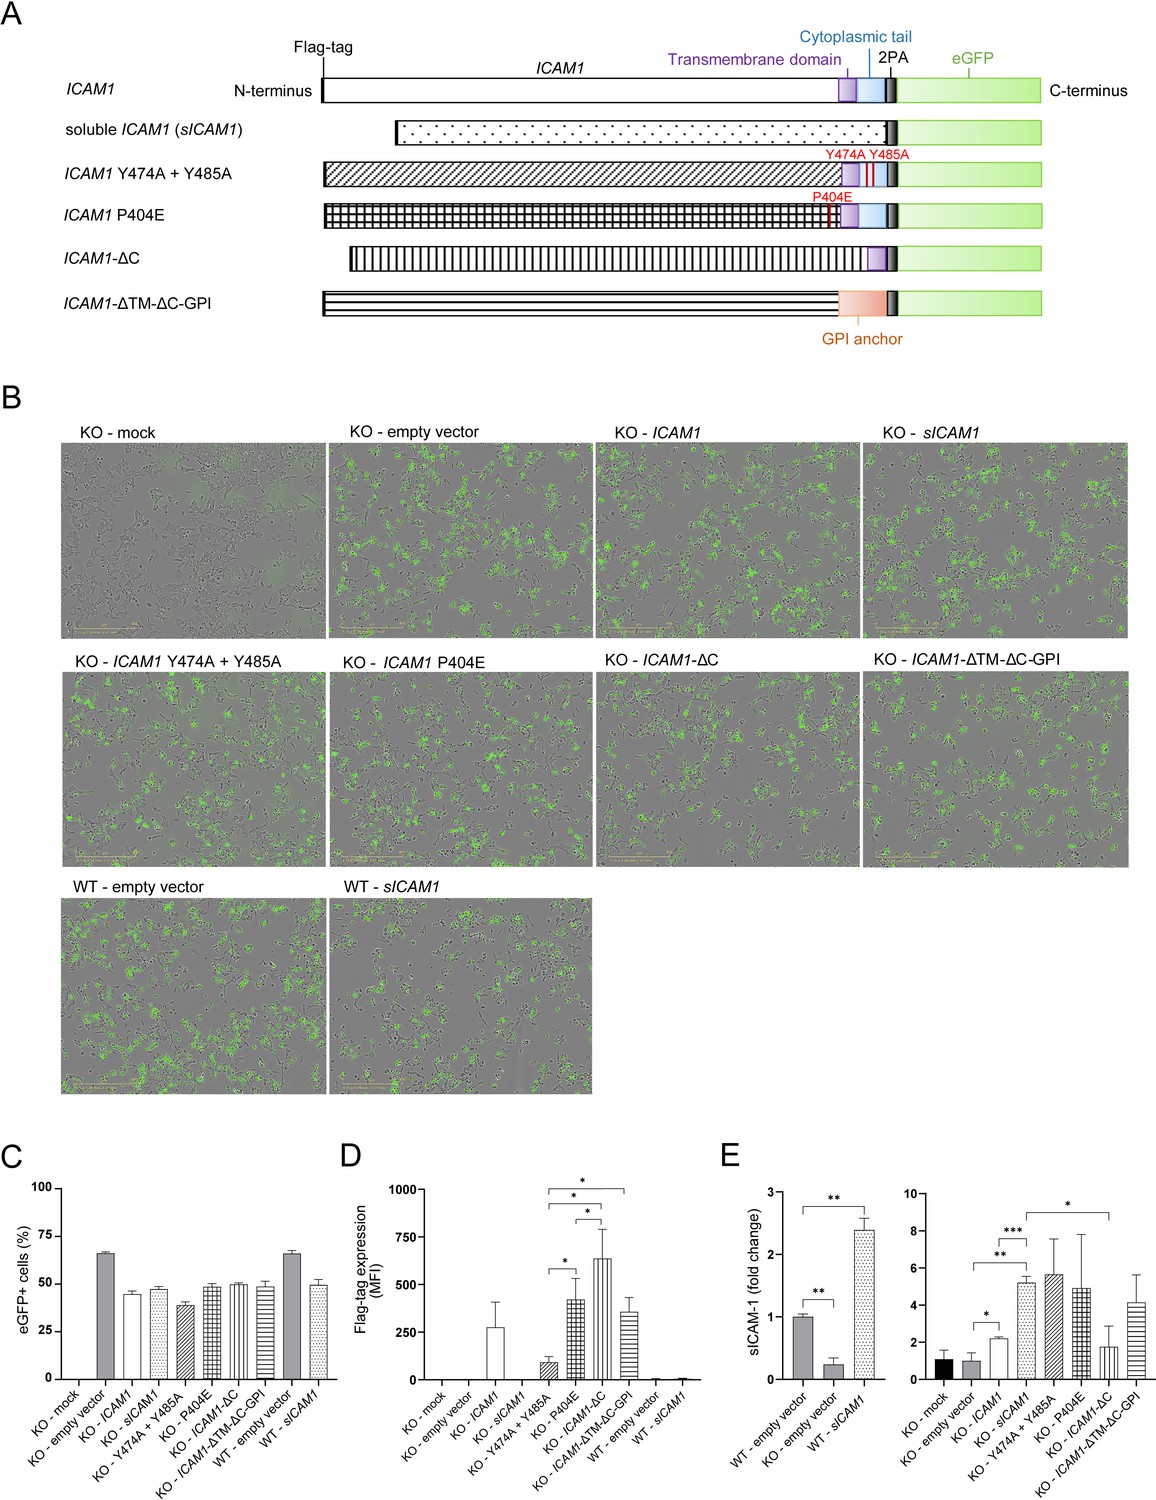
Design and expression of different ICAM-1 isoform eGFP-plasmids.
(A) Design of different ICAM1 isoforms carrying eGFP-plasmids. (B) Representative pictures of HCT 116 or ICAM1 KO cells transfected with ICAM-1-eGFP-plasmids. Pictures were obtained 20 hr after transfection with a 10 x objective using phase contrast channel as well as the green fluorescent channel (n=3). Scale bars, 400 μm. (C) eGFP + cells one day post transfection (dpt) measured by flow cytometry. Bar graphs show mean frequency ± s.e.m. (n=3). (D) Flag-tag level on the cell surface after 1 day of transfected cells measured by flow cytometry. Bar graphs show mean fluorescent intensity ± s.e.m. (n=3). (E) Fold change of sICAM-1 in the supernatant of transfected cells compared to WT (left) or KO (right) measured by IQELISA. Bar graphs show mean ± s.e.m. (n=3.). Two-tailed t tests with adjustments for multiple comparisons were performed (*p<0.05, **p<0.01, ***p<0.001).
Figure 6 with 3 supplements
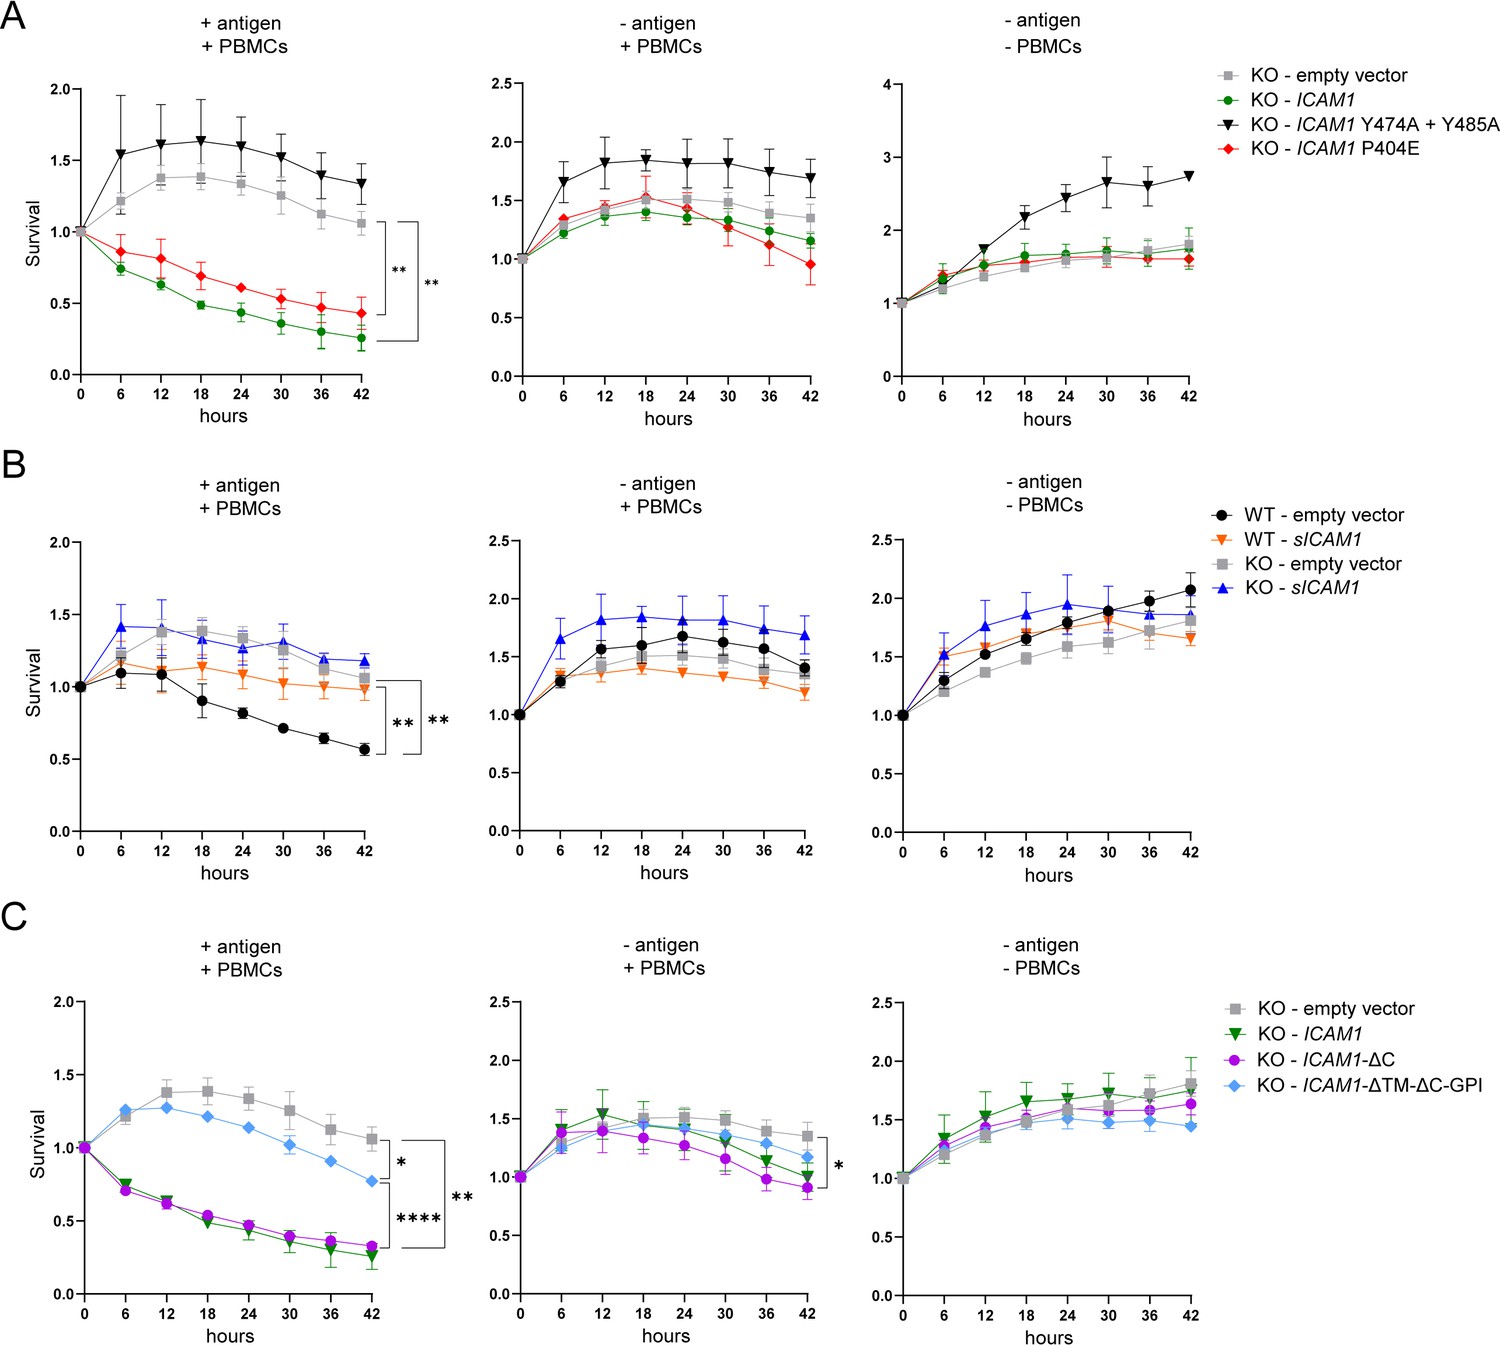
ICAM-1 isoforms differently regulate antigen-specific tumor cell killing by CTLs.
(A) Real time kinetic of tumor cell killing by PBMCs with T:E ratio of 1:4. HCT 116 ICAM1 KO cells were transfected with empty vector (gray), ICAM1 (green), ICAM1 Y474A+Y485 A (black) or ICAM1 P404E (red). (B) Real-time kinetic of tumor cell killing by PBMCs with T:E ratio of 1:4. WT or HCT 116 ICAM1 KO cells were transfected with empty vector (WT – black; KO – gray) or sICAM1 (WT – orange; KO – blue). (C) Real-time kinetic of tumor cell killing by PBMCs with T:E ratio of 1:4. HCT 116 ICAM1 KO cells were transfected with empty vector (gray), ICAM1- ΔC (purple), ICAM1-ΔTM-ΔC-GPI (light blue). Cell survival was determined counting green objects every 6 hours by using the IncuCyte system and normalized to timepoint zero. Conditions were performed in triplicate and four pictures of each triplicate were used for analysis (in total 12). Line graphs show mean ± SD for each timepoint representative for at least two independent experiments. Two-way ANOVA with Geisser-Greenhouse correction was used to determine statistical significance of each timepoint. Depicted stars represent statistical significance for t=42 hr (*p<0.05, **p<0.01, ***p<0.001, **** p<0.0001).
-
Figure 6—source data 1
Sequences of ICAM-1 isoform eGFP-plasmids.
- https://cdn.elifesciences.org/articles/84314/elife-84314-fig6-data1-v3.xlsx
Figure 6—figure supplement 1

mICAM-1 levels measured by flow cytometry of HCT 116 cells transfected with full length ICAM-1, sICAM-1 or empty vector as control.
Bar graphs show normalized mean ± s.e.m. of three independent experiments (n=3).
Figure 6—figure supplement 2
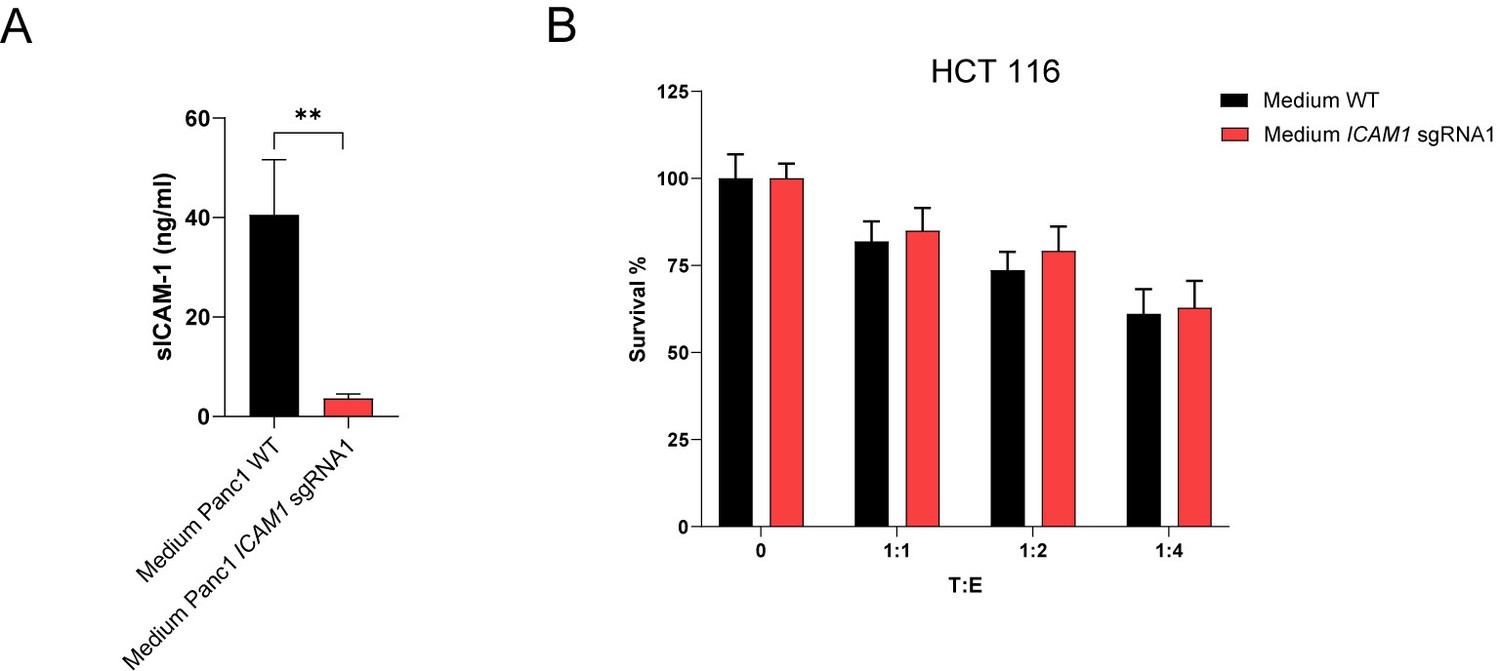
Media enriched with sICAM1 from stimulated Panc-1 cells does not protect HCT116 cells from CTL killing.
(A) sICAM-1 levels of conditioned medium harvested from stimulated Panc-1 WT or ICAM1 KO cells. Bar graphs show normalized mean ± SD of three independent experiments. (B) Cell survival of antigen loaded HCT 116 cells against CTL killing either cultured in conditioned medium harvest from Panc-1 WT or ICAM1 KO cells after 3 days with different ratios of PBMCs containing antigen specific CTLs. Bar graphs show normalized mean ± SD of triplicate representative for or three independent experiments (n=3).
Figure 6—figure supplement 3
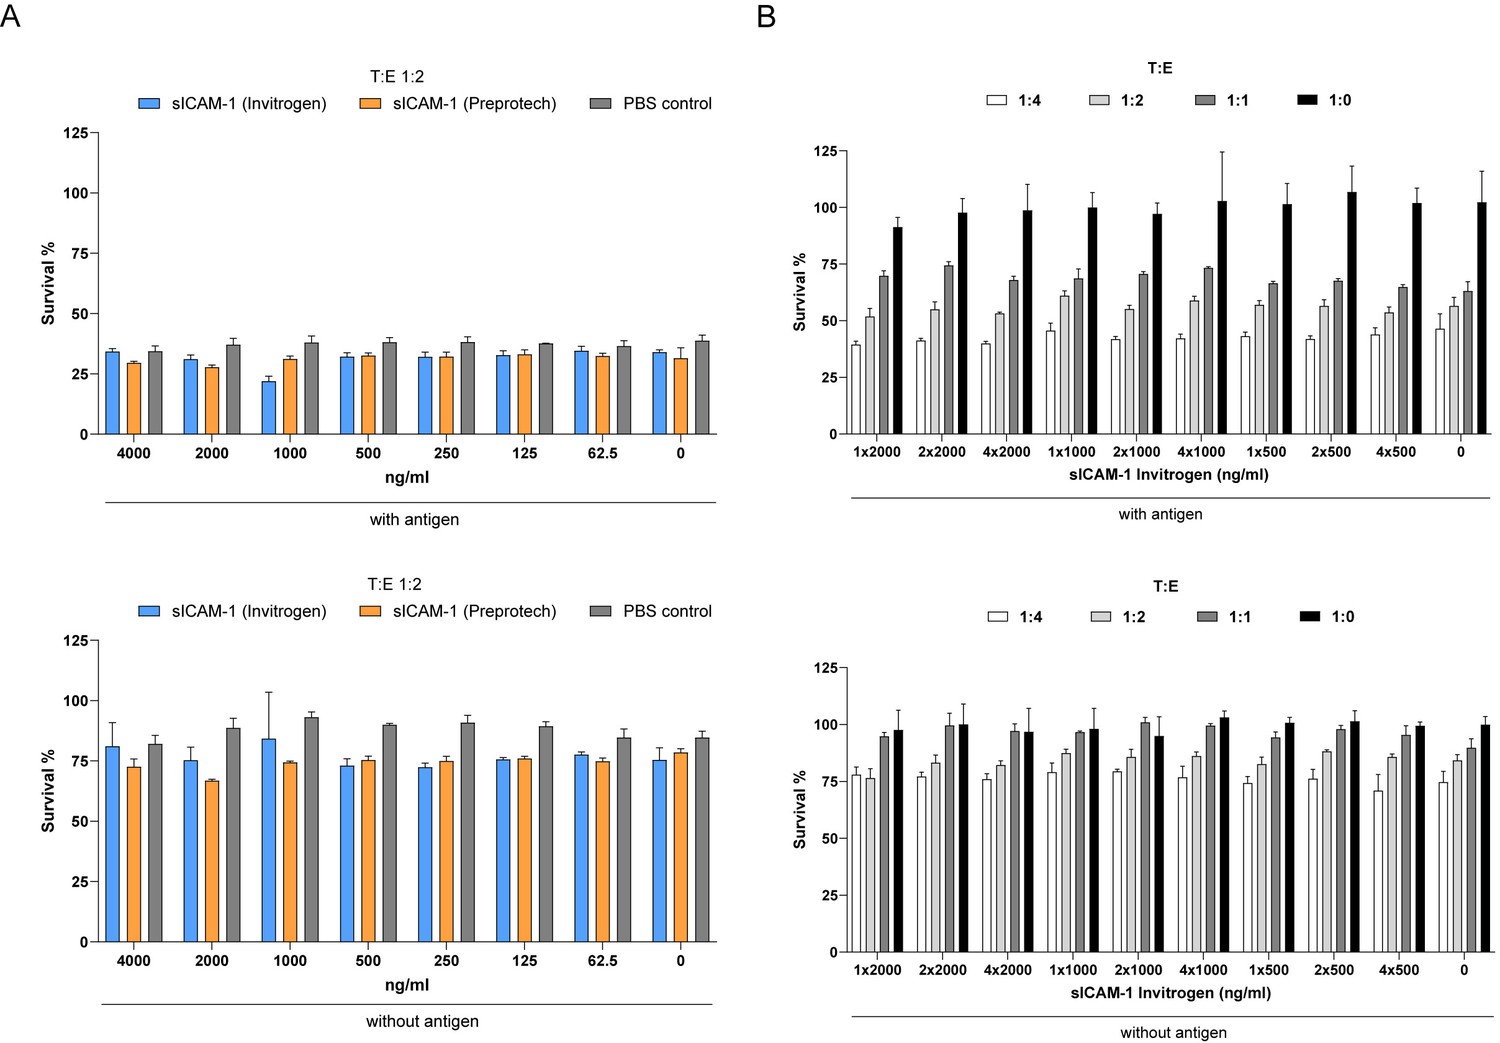
Addition of recombinant sICAM1 in media does not protect HCT 116 cells from CTL killing.
(A) Cell survival of antigen loaded or untreated HCT 116 cells against CTL killing cultured in sICAM-1 (Invitrogen or Preprotech) conditioned medium as indicated after 3 days with a target:effector (T:E) ratio of 1:2. (B) Cell survival of antigen loaded or untreated HCT 116 cells against CTL killing in presence of different dosages given once or continuously over time of sICAM-1 (Invitrogen) after 3 days with different ratios of PBMCs containing antigen-specific CTLs. Bar graphs show normalized mean ± SD of triplicates.
Figure 7 with 1 supplement
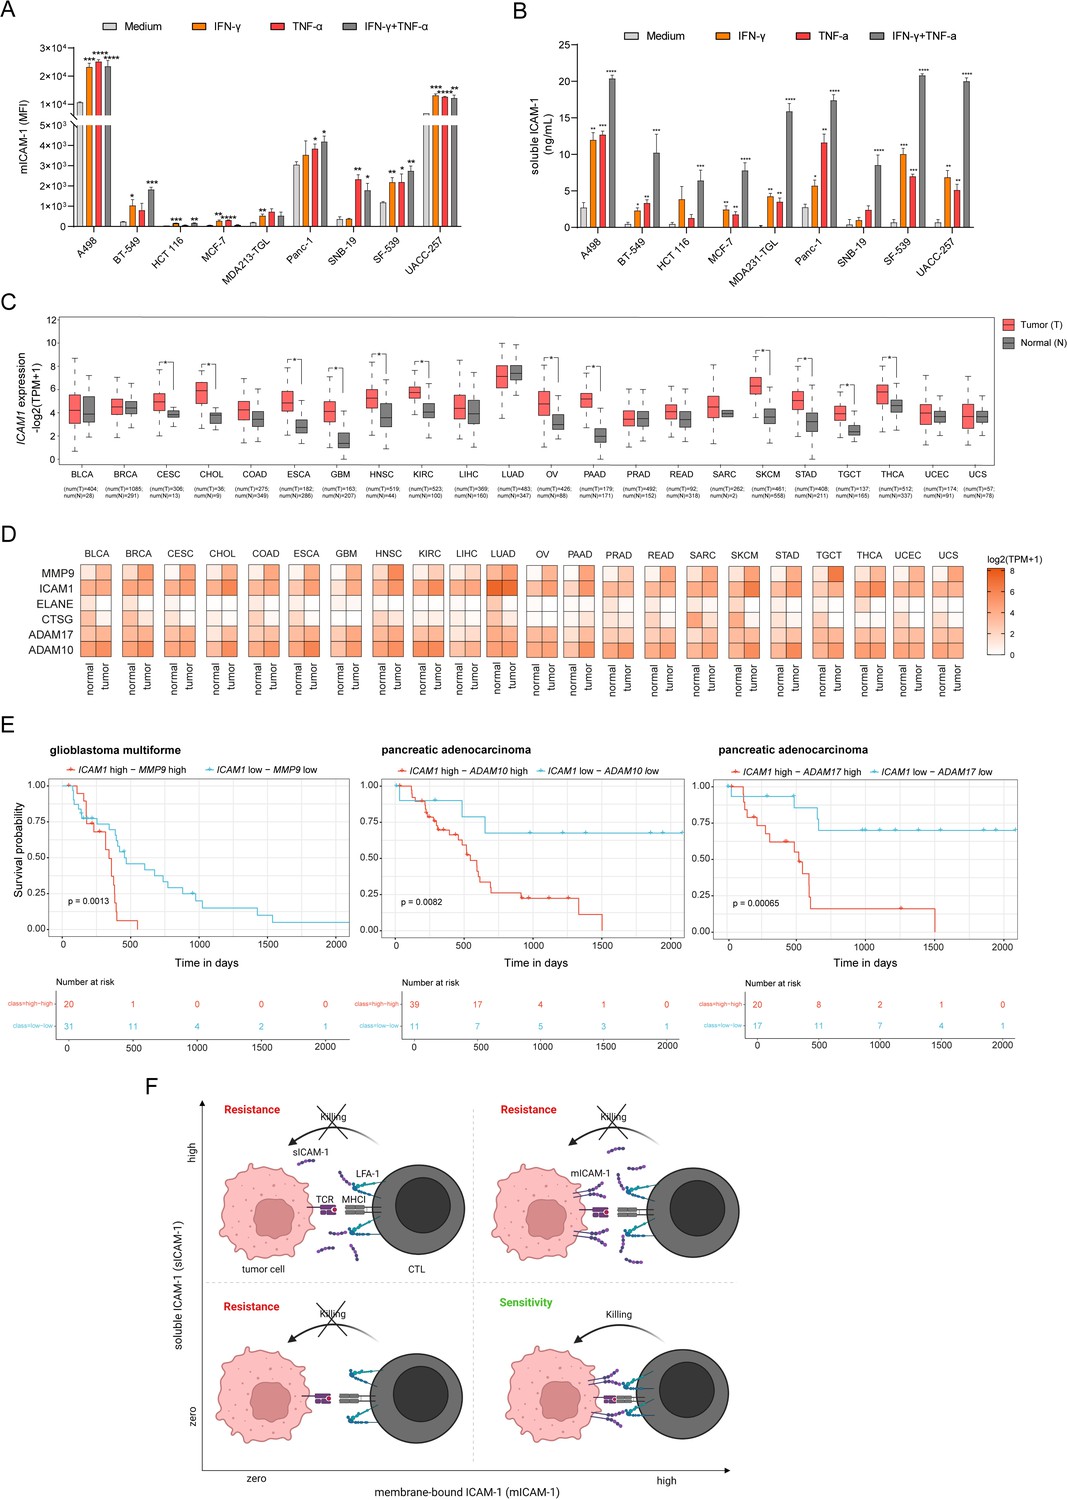
Expression of ICAM1 and ICAM-1 cleavage related metalloproteases is upregulated in human cancers and associated with poor clinical outcome.
(A) Membrane-bound ICAM-1 (mICAM-1) on the cell surface and (B) soluble ICAM-1 in the supernatant of untreated or stimulated cells with 100 ng/mL IFN-γ, 20 ng/mL TNF-α or both. Bar graphs show normalized mean ± SD of triplicate for each condition. Two-tailed t tests with adjustments for multiple comparisons were performed (*p<0.05, **p<0.01, ***p<0.001, **** p<0.0001). (C) ICAM1 expression in normal (N) or tumor tissue (T) of 22 different human cancers. Number of samples used for analysis as indicated. (D) Heatmaps showing expression of ICAM1 and ICAM-1 cleavage related proteases MMP9, ELANE, CTSG, ADAM10, and ADAM17 in normal or tumor tissue of 22 different cancer types. Expression data were obtained using GEPIA. (E) Kaplan–Meier survival plots of patient overall survival with the expression of ICAM1 and MMP9 (left), ICAM1 and ADAM10 (middle), ICAM1 and ADAM17 (right). Patients were categorized into ‘high’ and ‘low’ groups according to the highest and the lowest quartiles of each individual gene expression. Data were obtained from TCGA and GTEx. (E) Schematic describing the effect on tumor killing by mICAM-1 and sICAM-1. More details see text.
Figure 7—figure supplement 1
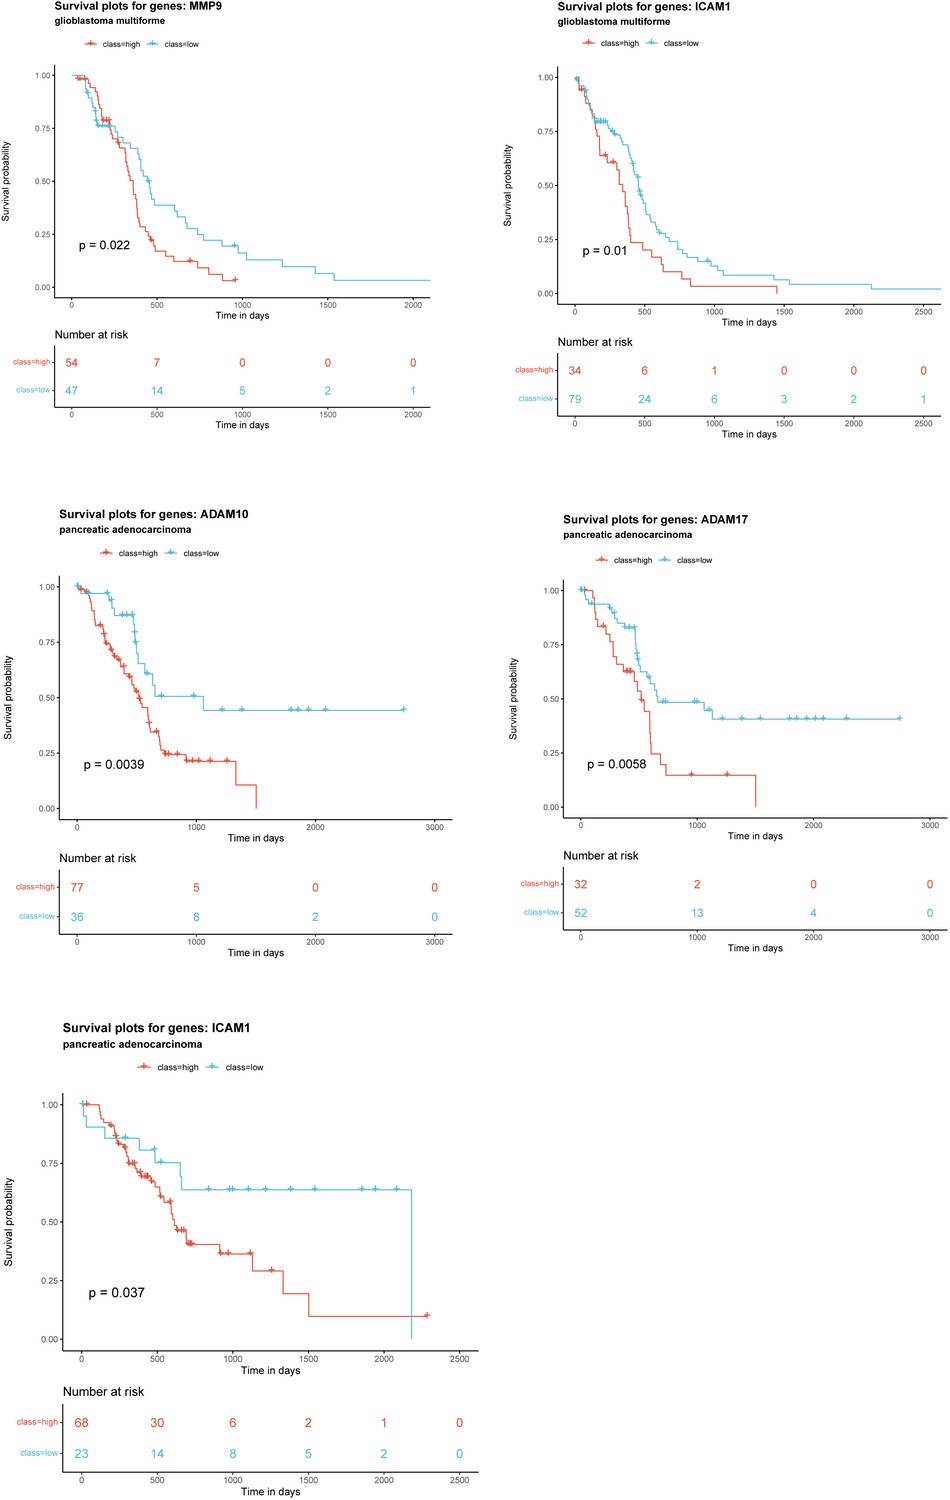
Kaplan–Meier survival plots of patient overall survival with the expression of each gene alone.
Patients were categorized into ‘high’ and ‘low’ groups according to the highest and the lowest quartiles of each individual gene expression. Data were obtained from TCGA and GTEx.
Figure 8
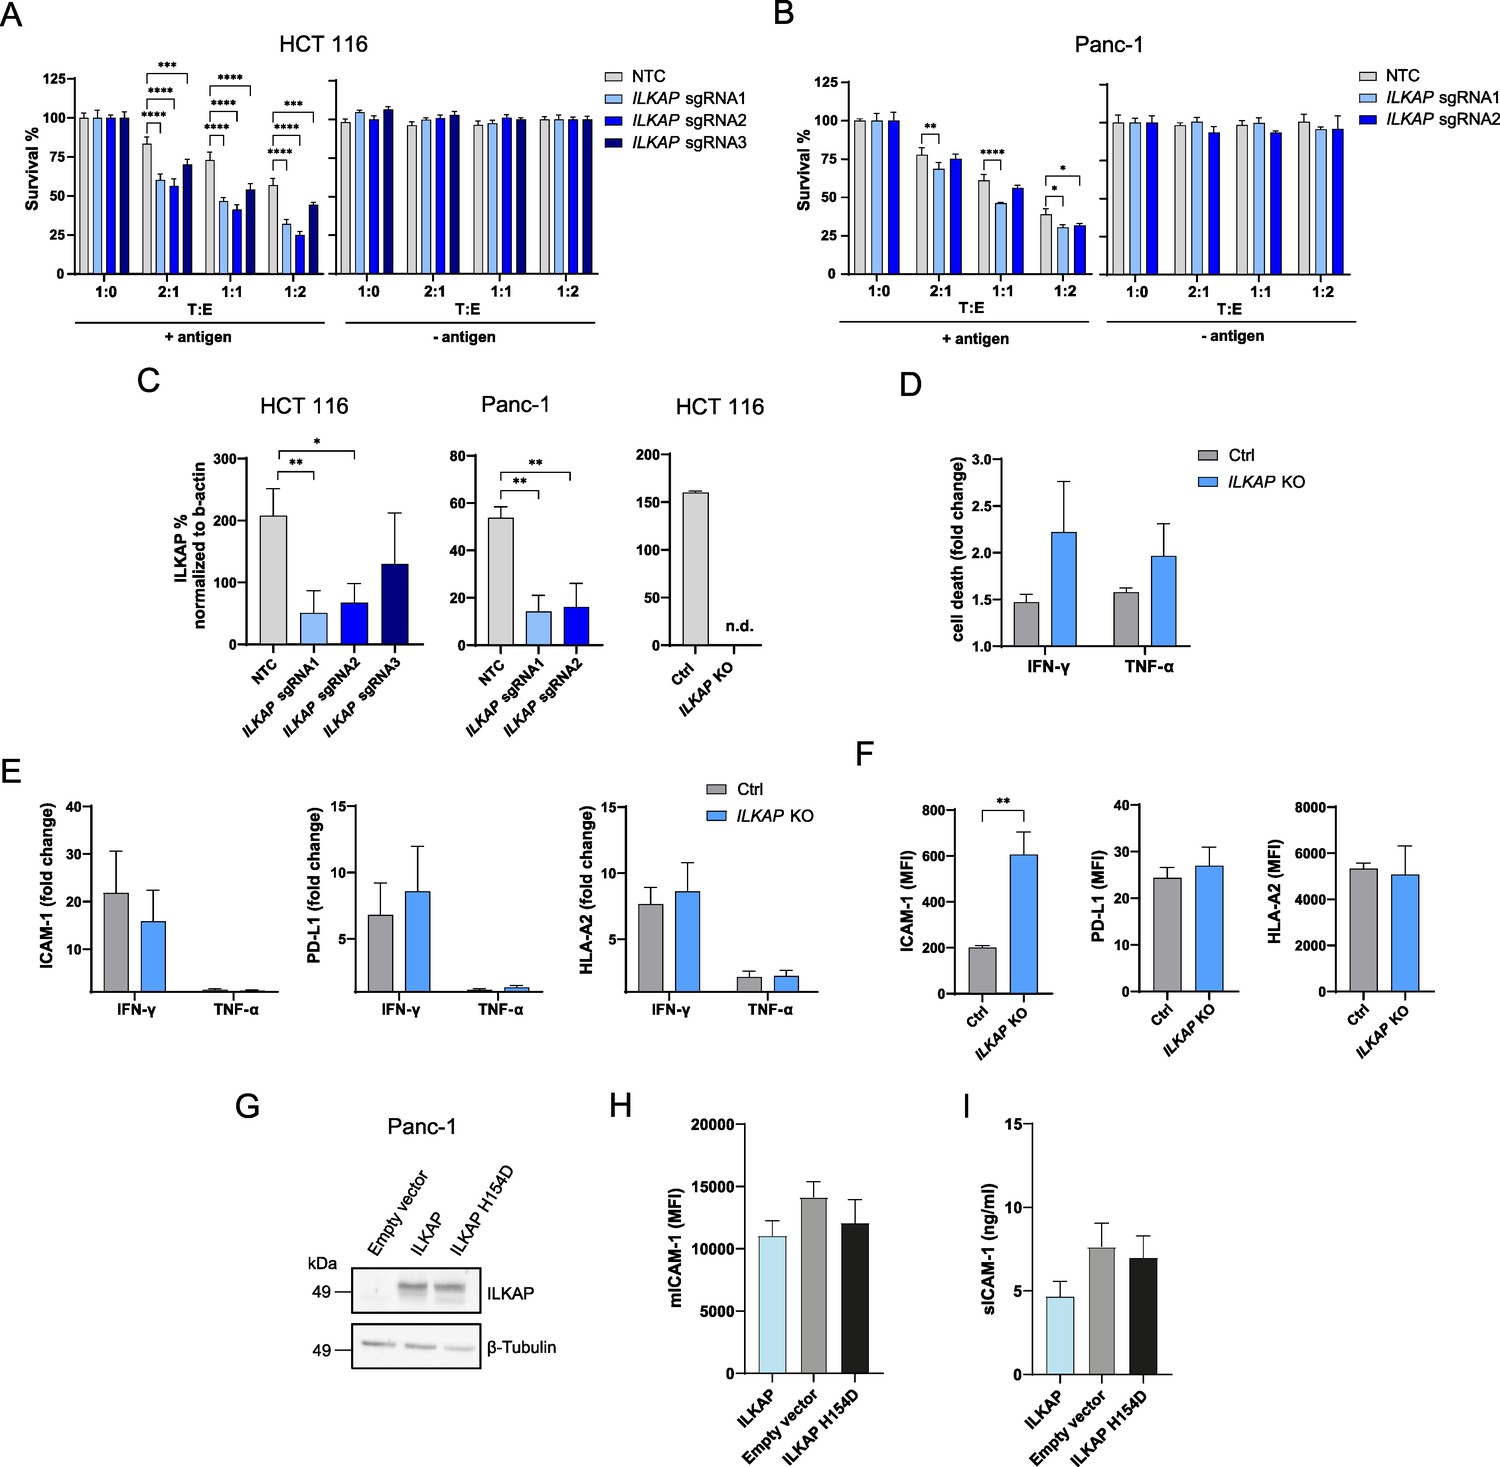
Depletion of ILKAP promotes antigen-specific CTL-mediated tumor cell killing.
(A) Cell survival of antigen loaded and untreated HCT 116 WT or ILKAP KO cells using 3 sgRNAs after 3 days of co-culturing with different ratios of PBMCs containing antigen specific CTLs. Bar graphs show normalized mean ± SD of triplicate representative of three independent experiments. (B) Cell survival of antigen loaded and untreated Panc-1 WT or ILKAP KO cells using 2 sgRNAs after 3 days of co-culturing with different ratios PBMCs containing antigen-specific CTLs. Bar graphs show normalized mean ± SD of triplicate representative of three independent experiments (C) ILKAP protein levels normalized to β-actin determined by Simple Western system. Bar graphs show normalized mean ± SD (n=3). (n.d. – not detectable). (D) Cell death of HCT 116 WT or ILKAP KO cells untreated or treated with 100 ng/mL IFN-γ or 40 ng/mL TNF-α determined with live/dead staining (FVS780) using flow cytometry. Bar graphs show mean ± s.e.m (n=3). (E) Fold change of HLA-A2, ICAM-1 and PD-L-1 cell surface levels after treatment with 100 ng/mL IFN-γ or 40 ng/mL TNF-α of WT or HCT 116 ILKAP KO cells. Bar graphs show mean ± s.e.m (n=3). (F) Mean fluorescence intensities (MFI) of HLA-A2, ICAM-1 and PD-L-1 of HCT 116 WT or HCT 116 ILKAP KO cells. Bar graphs show mean ± s.e.m (n=3). (G) ILKAP protein levels of Panc-1 cells transiently transfected with ILKAP or ILKAP H154D assessed by western blot. (H) Level of mICAM-1 measured with flow cytometry and (I) secreted sICAM-1 levels determined by ELISA of transiently transfected Panc-1 cells. For (A) and (B), two-way ANOVA corrected for multiple comparison according to Dunnett was used to determine statistical significance (*p<0.05, **p<0.01, ***p<0.001****, p<0.0001). Two-tailed t tests with adjustments for multiple comparisons were performed (D and E). For (C and F) unpaired two-tailed t test was used to determine statistical significance (*p<0.05, **p<0.01).
Tables
Table 1
crRNA sequences used for inducing gene expression through CRISPRa.
| Target gene | Pool crRNA sequences | Company | Catalogue nr. |
|---|---|---|---|
| CD274 | TCGGCGGAAGCTTTCAGTTT, GCTTCCGCCGATTTCACCGA, CGTTGCGCCAGGCCCGGAGG, CAGCGTTGCGCCAGGCCCGG | Horizon Discovery | P-015836-01-0005 |
| CD80 | CCACGAGCACCAGGCGGCCT, TAGTCCATGCACGGTGGTGA, GTCAGTGCCAGGAGTTGGAC, AATGGTGCCCGAGAAGAGTG | Horizon Discovery | P-007851-01-0005 |
| NT5E | TCCGGGTACCAGGTCGGAT, TCCGACCCTGGTACCCGGAG, CAGGGCCGCTCCGGGTACCA, GACGTCACCCGATCCGACCC | Horizon Discovery | P-008217-01-0005 |
Table 2
sgRNA sequences used to knockout ILKAP and ICAM1 for validation experiments.
| Target gene | sgRNA Name | sgRNA sequence | Thermo Fisher Scientific Identifier | Catalogue nr. |
|---|---|---|---|---|
| ILKAP | ILKAP sgRNA1 | TTCGGTGATCTTTGGTCTGA | CRISPR617045_SGM | A35533 |
| ILKAP | ILKAP sgRNA2 | GATGTCGTTCAGGATGACGT | CRISPR617051_SGM | A35533 |
| ILKAP | ILKAP sgRNA3 | GCCATTCTTCTCTTCCTCGG | CRISPR617058_SGM | A35533 |
| ICAM1 | ICAM1 sgRNA1 | GGTCTCTATGCCCAACAACT | CRISPR845341_SGM | A35533 |
| ICAM1 | ICAM1 sgRNA2 | GCTATTCAAACTGCCCTGAT | CRISPR845351_SGM | A35533 |
| - | Non-targeting control (NTC) | - | A35526 |
Table 3
Overview of libraries used for comparisons in each biological contrast.
PBMC - Peripheral Blood Monocyte Cells, RRA - Robust Rank Aggregation, MLE - Maximum Likelihood Estimation.
| Biological contrast | Control | Treatment | CRISPR-screen hits identification method | FDR cutoff [%] |
|---|---|---|---|---|
| Tumor screen | Plasmid gRNAs libraries | Only tumor cells without PBMC | RRA | 2 |
| Antigen-independent tumor killing | Only tumor cells without PBMC | Tumor cells not loaded with antigen with PBMC | MLE | 5 |
| Antigen-dependent tumor killing | Tumor cells not loaded with antigen with PBMC | Tumor cells loaded with antigen with PBMC | MLE | 5 |
Table 4
General design matrix for MLE comparison for specificity of antigen in- and dependent CRISPR-Cas9 screens.
TC - tumor cells; PBMC - co-culture with PBMC or lack of it (noPBMC), AG - PBMC antigen stimulation or lack of it (noAG); rep1,2,3 – technical replicates.
| Samples | Baseline | Antigen independent | Antigen dependent |
|---|---|---|---|
| TC_noPBMC_noAG_rep1 | 1 | 0 | 0 |
| TC_noPBMC_noAG_rep2 | 1 | 0 | 0 |
| TC_noPBMC_noAG_rep3 | 1 | 0 | 0 |
| TC_PBMC_noAG_rep1 | 1 | 1 | 0 |
| TC_PBMC_noAG_rep2 | 1 | 1 | 0 |
| TC_PBMC_noAG_rep3 | 1 | 1 | 0 |
| TC_PBMC_AG_rep1 | 1 | 0 | 1 |
| TC_PBMC_AG_rep2 | 1 | 0 | 1 |
| TC_PBMC_AG_rep3 | 1 | 0 | 1 |
Additional files
Download links
A two-part list of links to download the article, or parts of the article, in various formats.
Downloads (link to download the article as PDF)
Open citations (links to open the citations from this article in various online reference manager services)
Cite this article (links to download the citations from this article in formats compatible with various reference manager tools)
Complementary CRISPR screen highlights the contrasting role of membrane-bound and soluble ICAM-1 in regulating antigen-specific tumor cell killing by cytotoxic T cells
eLife 12:e84314.
https://doi.org/10.7554/eLife.84314


