An IS-mediated, RecA-dependent, bet-hedging strategy in Burkholderia thailandensis
- Department of Microbiology and Immunology, University of North Carolina at Chapel Hill, United States
Figures
Figure 1

Burkholderia thailandensis E264 from ATCC is a genotypically heterogeneous population.
(A) Graphical representation of the 208.6 kb duplicating region bounded by homologous IS2-like elements referred to as ISβ (LO74_RS09425) and ISα (LO74_RS28540). The Ctrl1 and Ctrl2 primers amplify a 1 kb DNA product. Junc1 and Junc2 primers amplify a 2.2 kb product if the region has duplicated. (B–E) Twelve colonies from stocks of E264 from four different laboratories (Cotter, Mougous, Chandler, and Manoil) were used as templates for PCR using either Junction (Junc1 and Junc2) or Control (Ctrl1 and Ctrl2) primers. (F, G) Twelve colonies from B. thailandensis strain 2002721643 and 2002721723 were used as templates for PCR using either Junction (Junc1 and Junc2) or Control (Ctrl1 and Ctrl2) primers.
-
Figure 1—source data 1
Uncropped DNA gel displaying junction PCR that was used to make Figure 1B.
The red box indicates the region of the gel used in the final figure. The lanes and identity of the band(s) are indicated.
- https://cdn.elifesciences.org/articles/84327/elife-84327-fig1-data1-v2.zip
-
Figure 1—source data 2
Uncropped DNA gel displaying control PCR that was used to make Figure 1B, C.
The red box indicates the region of the gel used in the final figure. The lanes and identity of the band(s) are indicated.
- https://cdn.elifesciences.org/articles/84327/elife-84327-fig1-data2-v2.zip
-
Figure 1—source data 3
Uncropped DNA gel displaying junction PCR that was used to make Figure 1C.
The red box indicates the region of the gel used in the final figure. The lanes and identity of the band(s) are indicated.
- https://cdn.elifesciences.org/articles/84327/elife-84327-fig1-data3-v2.zip
-
Figure 1—source data 4
Uncropped DNA gel displaying junction PCR that was used to make Figure 1D.
The red box indicates the region of the gel used in the final figure. The lanes and identity of the band(s) are indicated.
- https://cdn.elifesciences.org/articles/84327/elife-84327-fig1-data4-v2.zip
-
Figure 1—source data 5
Uncropped DNA gel displaying control PCR that was used to make Figure 1D, E.
The red box indicates the region of the gel used in the final figure. The lanes and identity of the band(s) are indicated.
- https://cdn.elifesciences.org/articles/84327/elife-84327-fig1-data5-v2.zip
-
Figure 1—source data 6
Uncropped DNA gel displaying junction PCR that was used to make Figure 1E.
The red box indicates the region of the gel used in the final figure. The lanes and identity of the band(s) are indicated.
- https://cdn.elifesciences.org/articles/84327/elife-84327-fig1-data6-v2.zip
-
Figure 1—source data 7
Uncropped DNA gel displaying junction PCR that was used to make Figure 1F, G.
The red box indicates the region of the gel used in the final figure. The lanes and identity of the band(s) are indicated.
- https://cdn.elifesciences.org/articles/84327/elife-84327-fig1-data7-v2.zip
-
Figure 1—source data 8
Uncropped DNA gel displaying control PCR that was used to make Figure 1F, G.
The red box indicates the region of the gel used in the final figure. The lanes and identity of the band(s) are indicated.
- https://cdn.elifesciences.org/articles/84327/elife-84327-fig1-data8-v2.zip
Figure 2
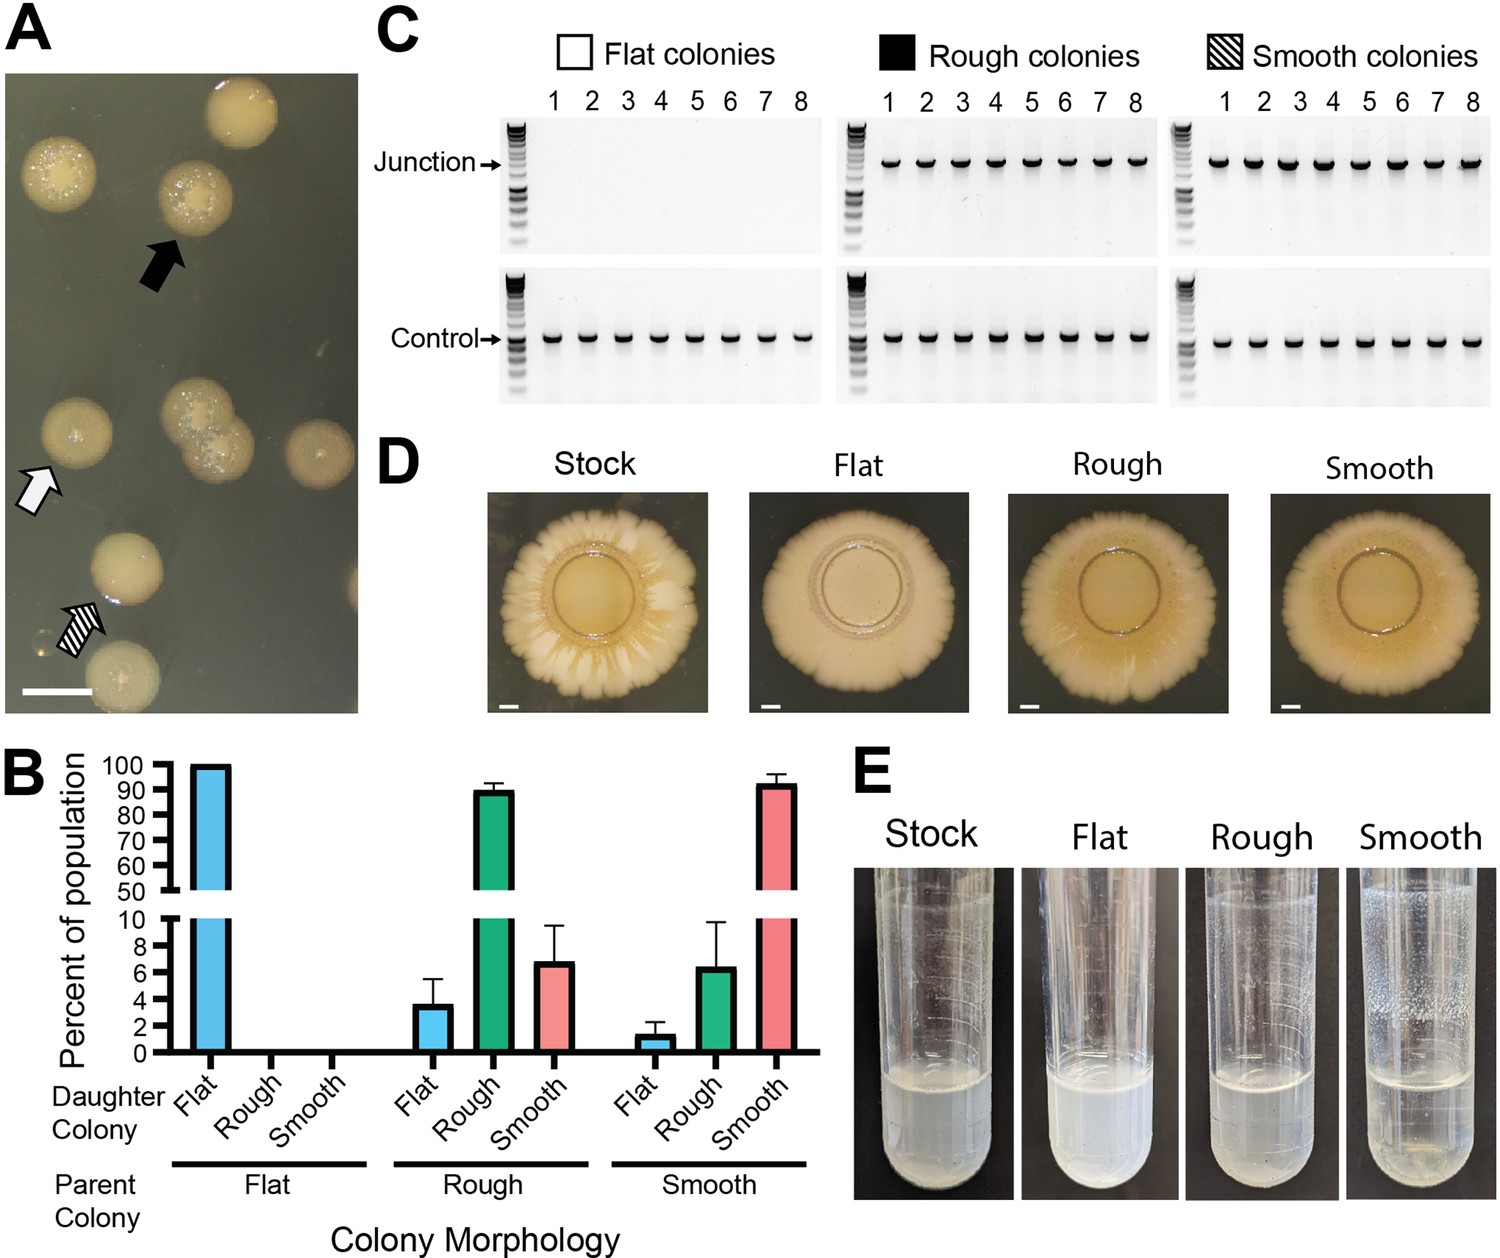
Genotypic heterogeneity correlates with phenotypic heterogeneity.
(A) Image of the three BtE264 colony phenotypes – flat (white arrow), raised rough (black arrow), and raised smooth (striped arrow) – observed on LSLB agar. Scale bar: 2 mm. (B) Colonies of each morphology were restreaked and the percentage of each morphology within the population of daughter colonies was calculated. (C) Eight colonies of each morphology were used as templates for PCR using Junction (Junc1 and Junc2) or Control (Ctrl1 and Ctrl2) primers. (D) Images of colony biofilms from the BtE264 stock, flat colonies, rough raised colonies, and raised smooth colonies. Scale bar: 2 mm. Data are representative of three independent biological replicates. (E) Images of test tube aggregation seeded from the BtE264 stock, flat colonies, raised rough colonies, and raised smooth colonies. Data are representative of three independent biological replicates.
-
Figure 2—source data 1
Uncropped DNA gel displaying junction and control PCRs of flat colonies that was used to make Figure 2C.
The red box indicates the region of the gel used in the final figure. The lanes and identity of the band(s) are indicated.
- https://cdn.elifesciences.org/articles/84327/elife-84327-fig2-data1-v2.zip
-
Figure 2—source data 2
Uncropped DNA gel displaying junction and control PCRs of rough colonies that was used to make Figure 2C.
The red box indicates the region of the gel used in the final figure. The lanes and identity of the band(s) are indicated.
- https://cdn.elifesciences.org/articles/84327/elife-84327-fig2-data2-v2.zip
-
Figure 2—source data 3
Uncropped DNA gel displaying junction and control PCRs of smooth colonies that was used to make Figure 2C.
The red box indicates the region of the gel used in the final figure. The lanes and identity of the band(s) are indicated.
- https://cdn.elifesciences.org/articles/84327/elife-84327-fig2-data3-v2.zip
Figure 3 with 1 supplement
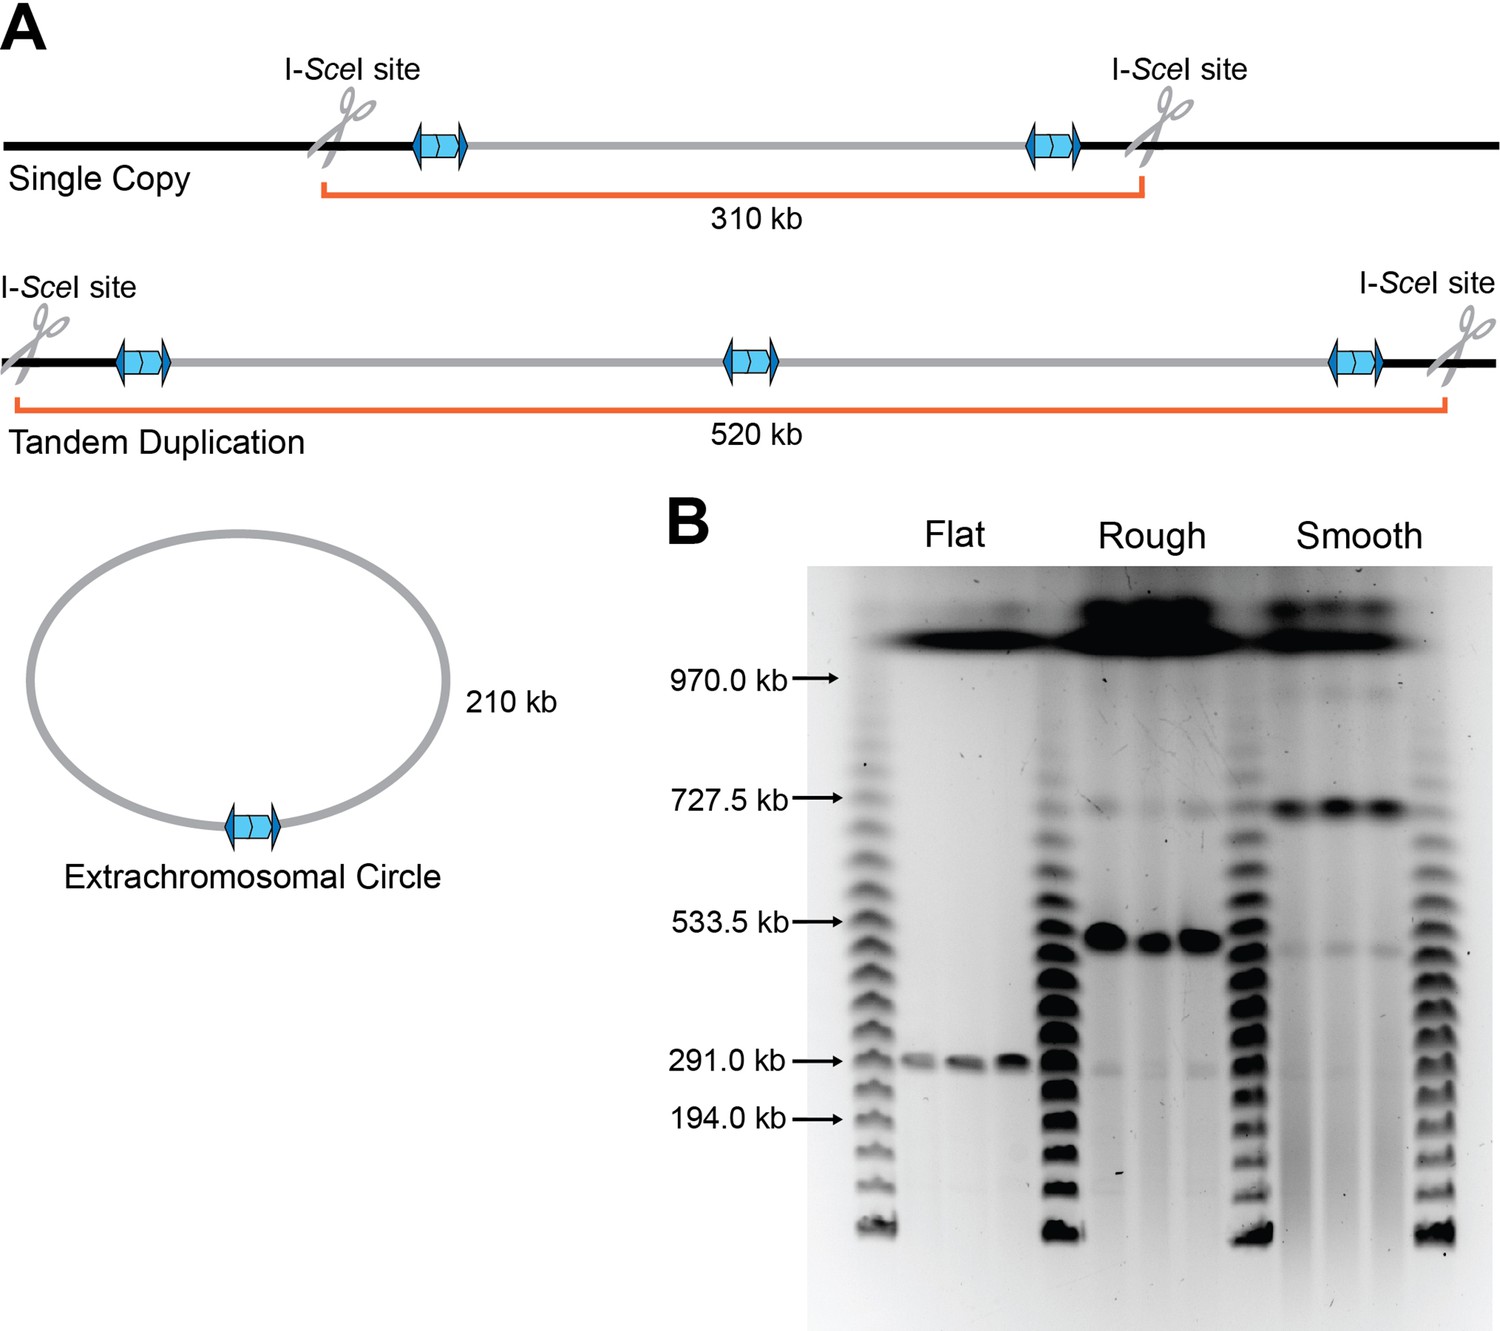
The duplication is present as a directly oriented tandem repeat of the 208.6 kb region in the chromosome.
(A) Graphical representation of BtE264 with engineered unique I-SceI cut sites ~50 kb outside of the 208.6 kb duplicating region creating differently sized fragments depending on the form of the duplication. (B) Pulsed-field gel electrophoresis separated duplicating region fragments, post I-SceI digestion, from three flat, raised rough, and raised smooth colonies each alongside lambda ladder. Data are representative of two independent biological replicates.
-
Figure 3—source data 1
Uncropped pulsed-field gel electrophoresis (PFGE) DNA gel that was used to make Figure 3B.
The red box indicates the region of the gel used in the final figure. The lanes and identity of the band(s) are indicated.
- https://cdn.elifesciences.org/articles/84327/elife-84327-fig3-data1-v2.zip
Figure 3—figure supplement 1
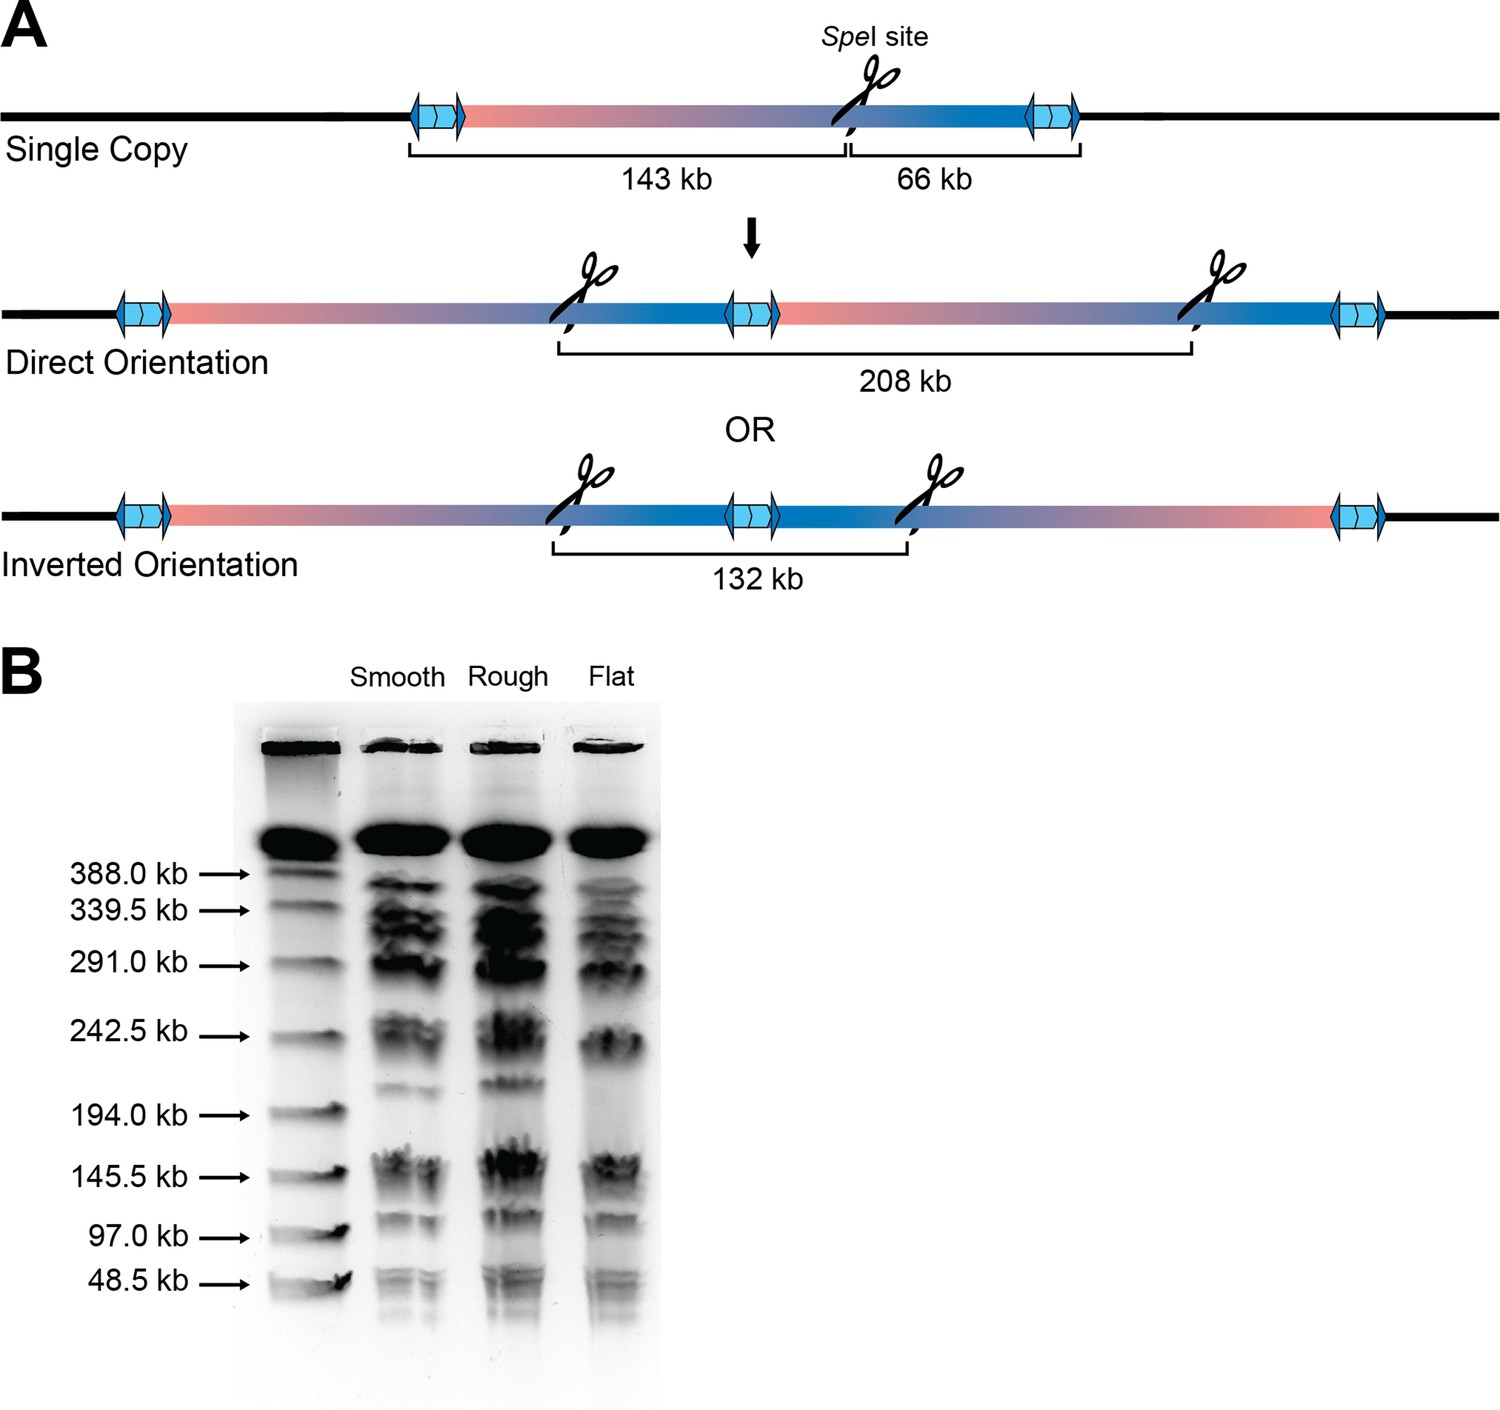
Tandem duplications form in a direct orientation.
(A) Schematic of a single copy or the region duplicating in the direct or inverse orientation. Native SpeI restriction enzyme cut sites and size fragments are labeled. (B) SpeI-digested DNA from flat, raised rough, and raised smooth colonies run on a pulsed-field gel electrophoresis (PFGE) gel accompanied by lambda ladder as a size standard.
-
Figure 3—figure supplement 1—source data 1
Uncropped pulsed-field gel electrophoresis (PFGE) DNA gel that was used to make Figure 3—figure supplement 1B.
The red box indicates the region of the gel used in the final figure. The lanes and identity of the band(s) are indicated.
- https://cdn.elifesciences.org/articles/84327/elife-84327-fig3-figsupp1-data1-v2.zip
Figure 4
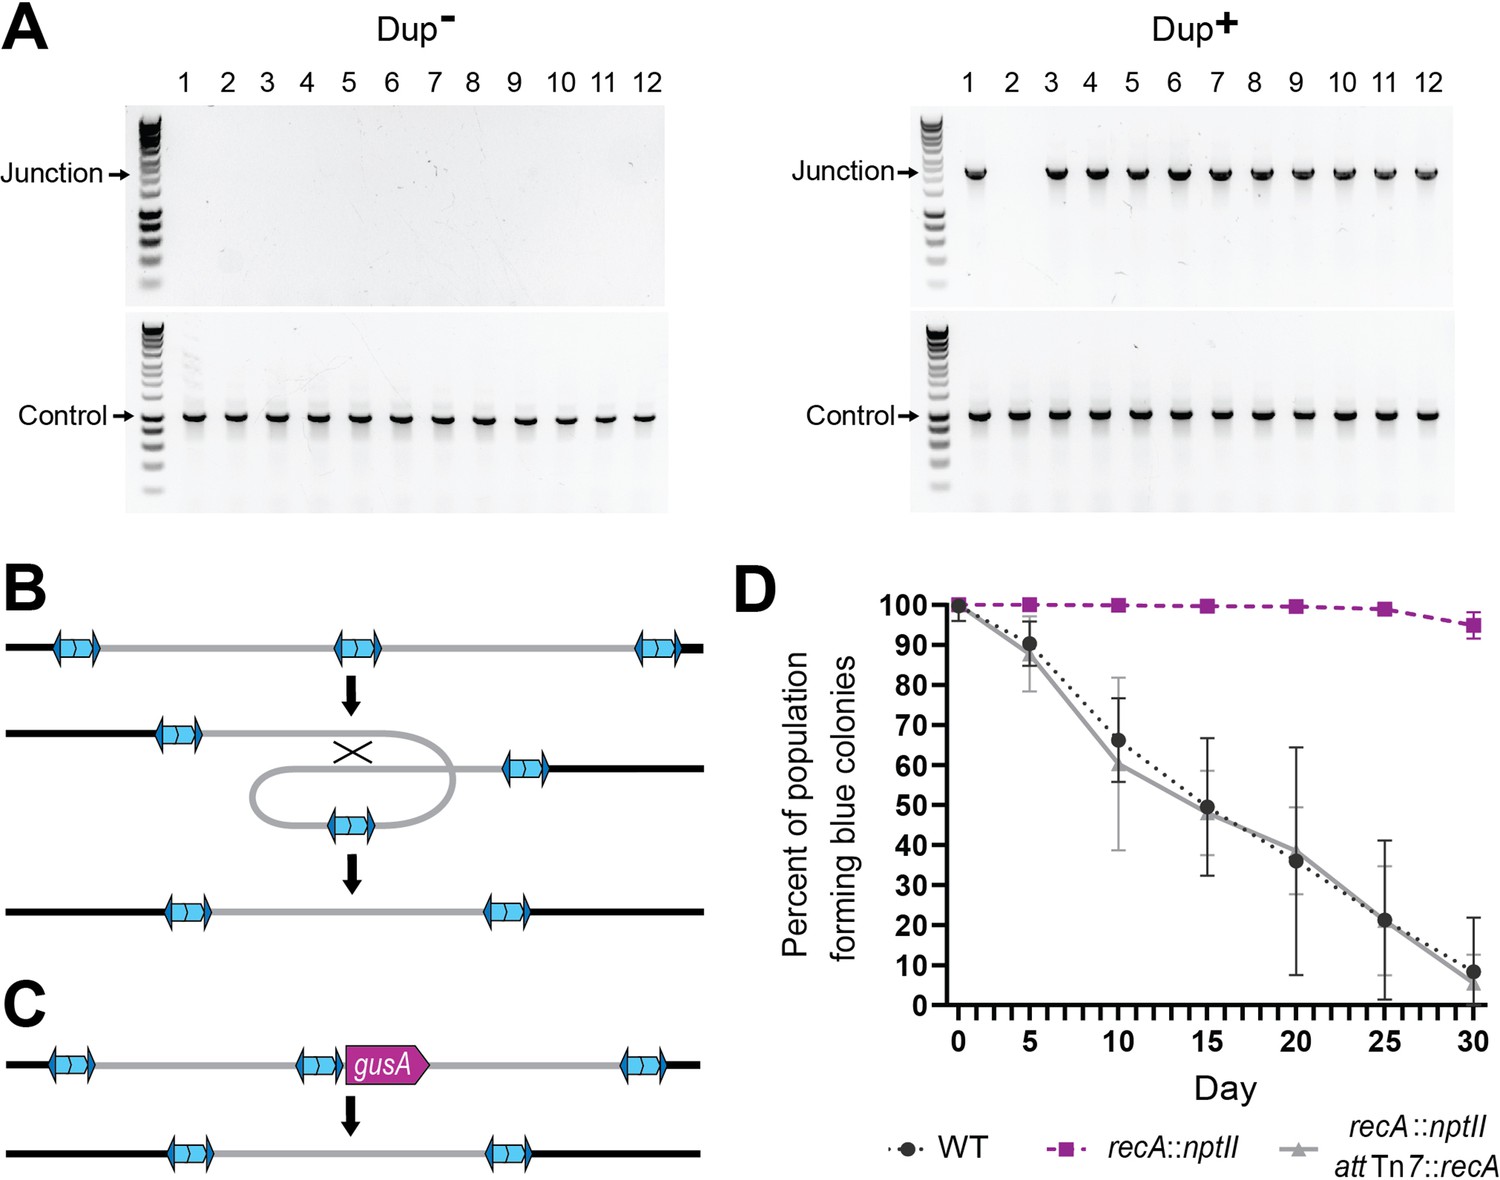
Resolution of tandem duplications occurs through RecA-dependent homologous recombination.
(A) Twelve daughter colonies from a Dup+ and Dup− colony were used as templates for PCR using either Junction (Junc1 and Junc2) or Control (Ctrl1 and Ctrl2) primers. (B) Model for tandem resolution by recombination between homologous sequences in the duplicated region. (C) Schematic of the gusA reporter strain used to visualize colonies that have resolved the tandem duplication. (D) Percentage of WT, recA::nptII, and recA::nptII attTn7::recA colonies containing gusA throughout daily liquid subculturing. Mean and standard deviation plotted. From day 5 onward, the percent of blue colonies are significantly different between strains with and without functional recA, p values <0.01 at days 5–30 as analyzed by Kruskal–Wallis test.
-
Figure 4—source data 1
Uncropped DNA gel displaying junction PCR of colonies from Dup+ parent colonies that was used to make Figure 4A.
The red box indicates the region of the gel used in the final figure. The lanes and identity of the band(s) are indicated.
- https://cdn.elifesciences.org/articles/84327/elife-84327-fig4-data1-v2.zip
-
Figure 4—source data 2
Uncropped DNA gel displaying junction PCR of colonies from Dup− parent colonies that was used to make Figure 4A.
The red box indicates the region of the gel used in the final figure. The lanes and identity of the band(s) are indicated.
- https://cdn.elifesciences.org/articles/84327/elife-84327-fig4-data2-v2.zip
-
Figure 4—source data 3
Uncropped DNA gel displaying control PCR of colonies from Dup+ and Dup− parent colonies that was used to make Figure 4A.
The red box indicates the region of the gel used in the final figure. The lanes and identity of the band(s) are indicated.
- https://cdn.elifesciences.org/articles/84327/elife-84327-fig4-data3-v2.zip
Figure 5
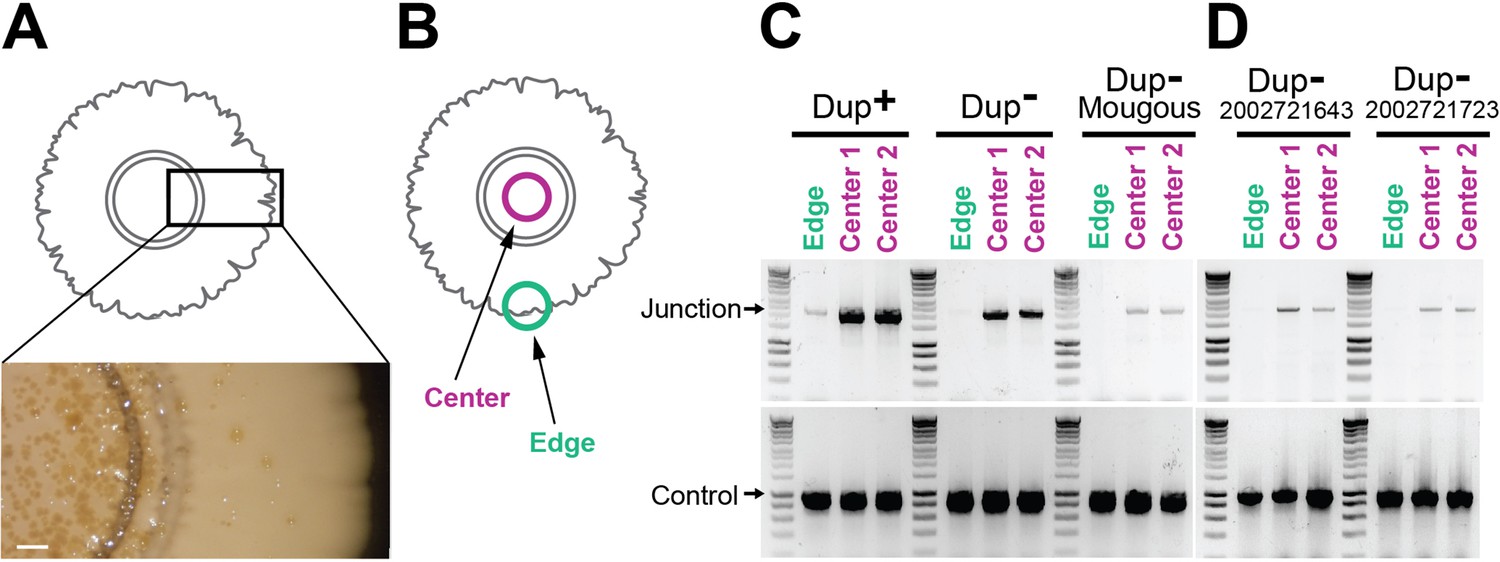
Duplications are enriched for in the center of colony biofilms.
(A) Colony biofilm schematic and image depicting brownish-gold spots form primarily in the center of Dup− colony biofilms. Scale bar: 2 mm. (B) Schematic demarcating the center and the edge portions of colony biofilms. The center and edge of colony biofilms from (C) wild-type Dup+, wild-type Dup−, and Mougous laboratory BtE264 and (D) B. thailandensis 2002721643 and 2002721723 were used as templates for PCR using Junction (Junc1 and Junc2) or Control (Ctrl1 and Ctrl2) primers.
-
Figure 5—source data 1
Uncropped DNA gel displaying junction PCR from wild-type Dup+, wild-type Dup−, and Mougous Laboratory’s wild-type strains that was used to make Figure 5C.
The red box indicates the region of the gel used in the final figure. The lanes and identity of the band(s) are indicated.
- https://cdn.elifesciences.org/articles/84327/elife-84327-fig5-data1-v2.zip
-
Figure 5—source data 2
Uncropped DNA gel displaying control PCR from wild-type Dup+, wild-type Dup−, and Mougous Laboratory’s wild-type strains that was used to make Figure 5C.
The red box indicates the region of the gel used in the final figure. The lanes and identity of the band(s) are indicated.
- https://cdn.elifesciences.org/articles/84327/elife-84327-fig5-data2-v2.zip
-
Figure 5—source data 3
Uncropped DNA gel displaying junction PCR from strains 2002721643 and 2002721723 that was used to make Figure 5C.
The red box indicates the region of the gel used in the final figure. The lanes and identity of the band(s) are indicated.
- https://cdn.elifesciences.org/articles/84327/elife-84327-fig5-data3-v2.zip
-
Figure 5—source data 4
Uncropped DNA gel displaying control PCR from strains 2002721643 and 2002721723 that was used to make Figure 5C.
The red box indicates the region of the gel used in the final figure. The lanes and identity of the band(s) are indicated.
- https://cdn.elifesciences.org/articles/84327/elife-84327-fig5-data4-v2.zip
Figure 6 with 1 supplement
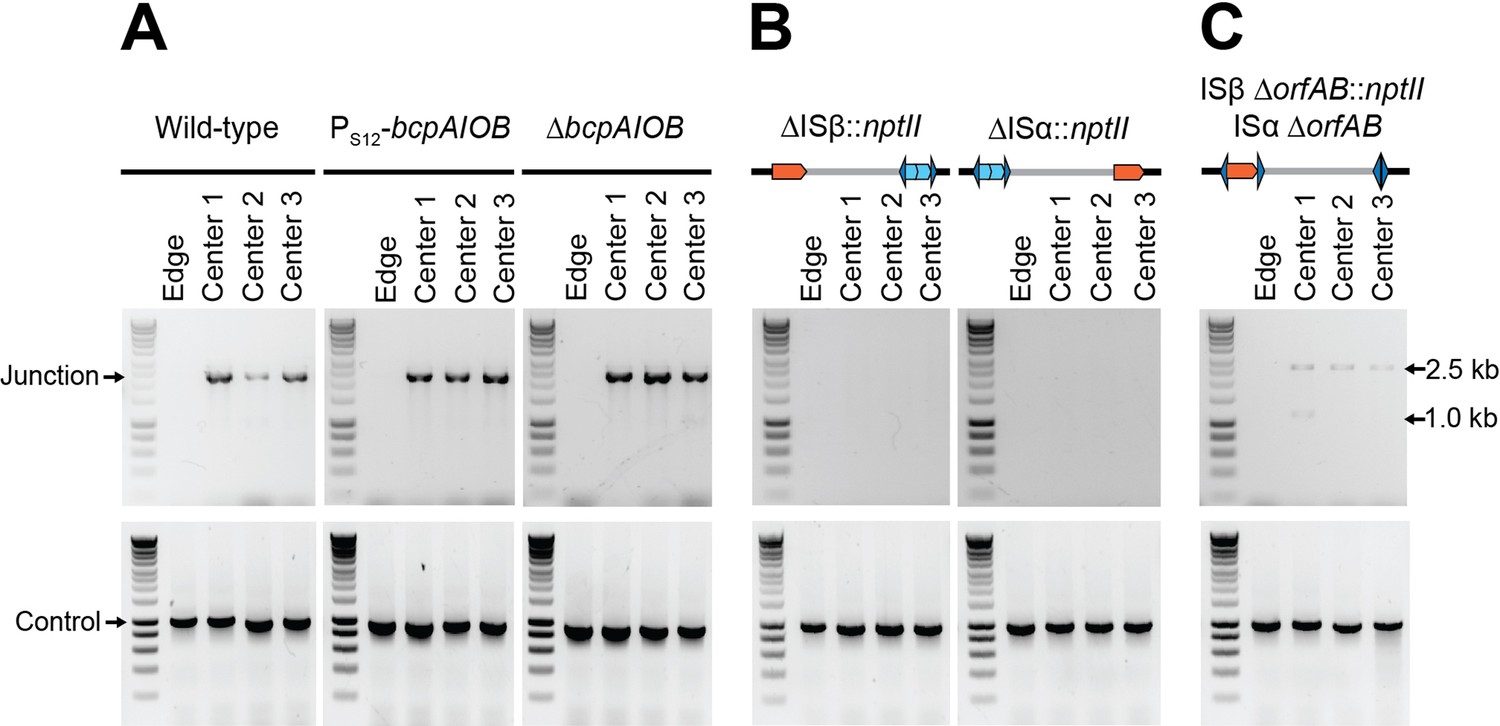
Contact-dependent growth inhibition (CDI) system-encoding bcpAIOB and transposase-encoding orfAB genes are not involved in duplication of the 208.6 kb region.
(A) The center and edge of colony biofilms from wild-type Dup+, wild-type Dup−, Dup+ PS12-bcpAIOB, and Dup− ΔbcpAIOB were used as templates for PCR using Junction (Junc1 and Junc2) or Control (Ctrl1 and Ctrl2) primers. (B) The center and edge of colony biofilms from ΔISβ::nptII and ΔISα::nptII were used as templates for PCR using Junction (Junc1 and Junc2) or Control (Ctrl1 and Ctrl2) primers. (C) The center and edge of colony biofilms from ISβ ΔorfAB::nptII ISα ΔorfAB were used as a template for PCR using Junction (Junc1 and Junc2) or Control (Ctrl1 and Ctrl2) primers.
-
Figure 6—source data 1
Uncropped DNA gel displaying junction PCR from wild-type, PS12-bcpAIOB, ΔbcpAIOB, and ISβ ΔorfAB::nptII ISα ΔorfAB strains that was used to make Figure 6A, C.
The red box indicates the region of the gel used in the final figure. The lanes and identity of the band(s) are indicated.
- https://cdn.elifesciences.org/articles/84327/elife-84327-fig6-data1-v2.zip
-
Figure 6—source data 2
Uncropped DNA gel displaying junction PCR from ΔISβ::nptII and ΔISα::nptII strains that was used to make Figure 6B.
The red box indicates the region of the gel used in the final figure. The lanes and identity of the band(s) are indicated.
- https://cdn.elifesciences.org/articles/84327/elife-84327-fig6-data2-v2.zip
-
Figure 6—source data 3
Uncropped DNA gel displaying control PCR from wild-type, PS12-bcpAIOB, and ΔbcpAIOB strains that was used to make Figure 6A.
The red box indicates the region of the gel used in the final figure. The lanes and identity of the band(s) are indicated.
- https://cdn.elifesciences.org/articles/84327/elife-84327-fig6-data3-v2.zip
-
Figure 6—source data 4
Uncropped DNA gel displaying control PCR from ΔISβ::nptII, ΔISα::nptII, and ISβ ΔorfAB::nptII ISα ΔorfAB strains that was used to make Figure 6B, C.
The red box indicates the region of the gel used in the final figure. The lanes and identity of the band(s) are indicated.
- https://cdn.elifesciences.org/articles/84327/elife-84327-fig6-data4-v2.zip
Figure 6—figure supplement 1
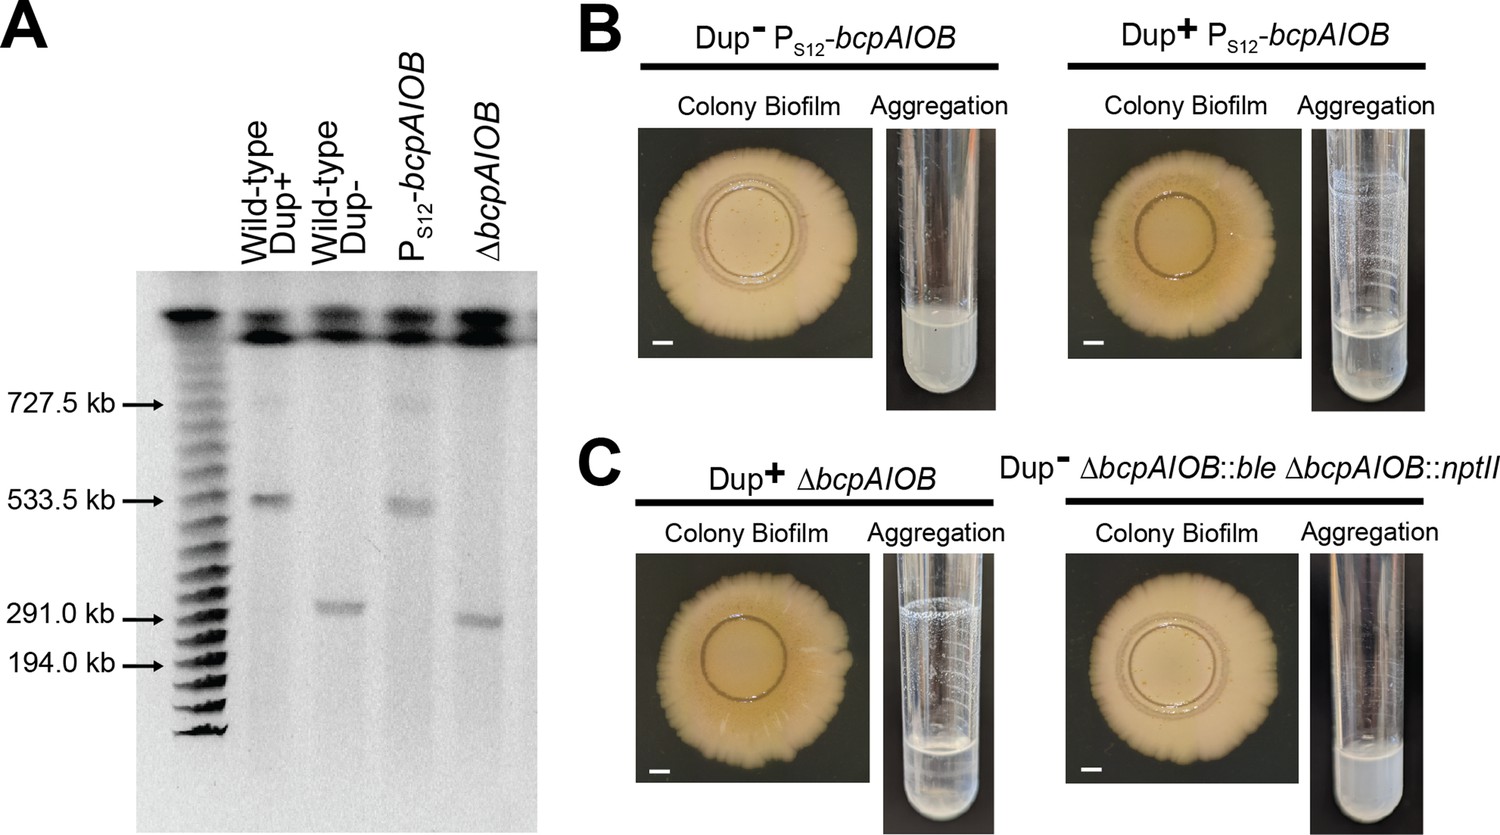
Phenotypes are duplication dependent and not bcpAIOB dependent.
(A) Pulsed-field gel electrophoresis separated duplicating region fragments from wild-type Dup+, wild-type Dup−, PS12-bcpAIOB, and ΔbcpAIOB. Colony biofilms (Scale bar: 2 mm) and test tube air–liquid interface aggregation by (B) a newly constructed Dup− PS12-bcpAIOB and the original Dup− PS12-bcpAIOB strains and (C) a newly constructed Dup+ ΔbcpAIOB::ble ΔbcpAIOB::nptII and the original Dup− ΔbcpAIOB strains. Data are representative of two independent biological replicates.
-
Figure 6—figure supplement 1—source data 1
Uncropped pulsed-field gel electrophoresis (PFGE) DNA gel that was used to make Figure 6—figure supplement 1A.
The red box indicates the region of the gel used in the final figure. The lanes and identity of the band(s) are indicated.
- https://cdn.elifesciences.org/articles/84327/elife-84327-fig6-figsupp1-data1-v2.zip
Figure 7
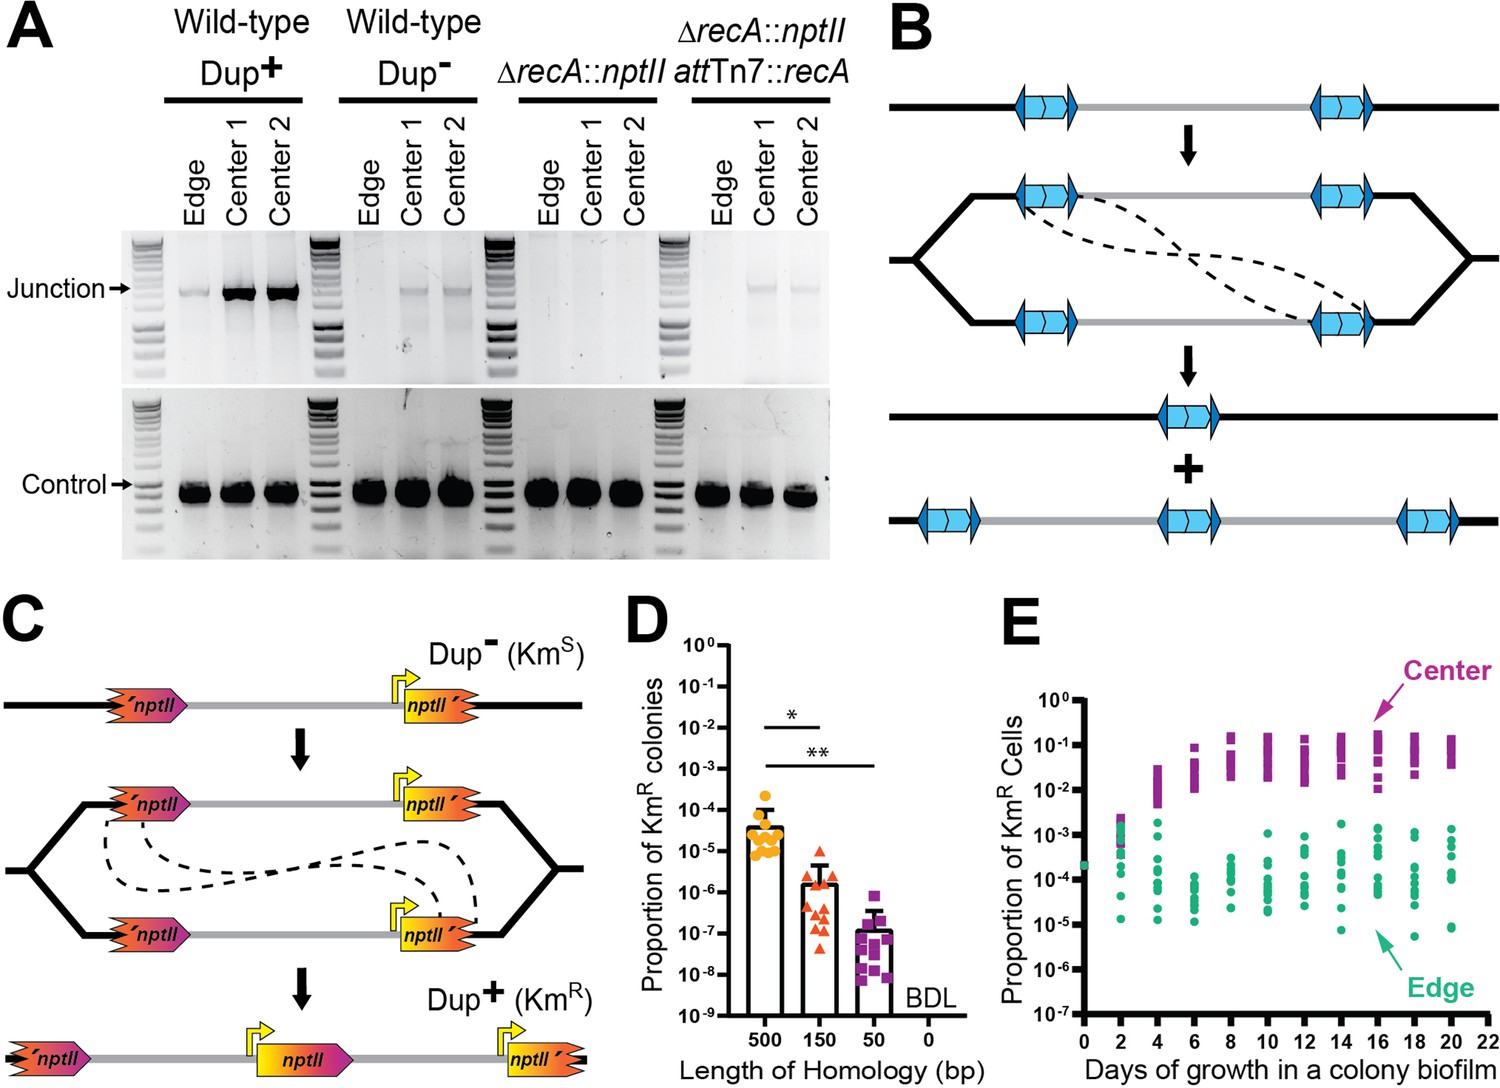
Duplications are formed through RecA-mediated recombination between homologous IS elements.
(A) The center and edge of colony biofilms from WT Dup+, WT Dup−, ΔrecA, and ΔrecA attTn7::recA were used as templates for PCR using Junction (Junc1 and Junc2) or Control (Ctrl1 and Ctrl2) primers. (B) Model for homologous recombination during replication resulting in two different genotypes within the daughter cells. One daughter cell contains a suspected fatal deletion of the 208.6 kb region while the other cell contains a tandem duplication of the 208.6 kb region. (C) Schematic of the fragmented nptII reporter system. Through recombination between homologous nptII sequences, a KmS cell can give rise to a KmR daughter cell with an intact nptII present at the junction. Orientation of the chromosome has been reversed for clarity and consistency. (D) KmR resistance frequency among fragmented nptII reporter strains with various amounts of homology (500, 150, 50, or 0 bp) following culture in LSLB broth. Mean and standard deviation indicated. ‘BDL’ indicates below detection limit. * and ** denote p values <0.05 and <0.01, respectively, as calculated by an analysis of variance (ANOVA). (E) Using the fragmented nptII reporter strain, calculated proportion of KmR cells from the center and edge of colony biofilms over time. From day 4 onwards, the proportion of KmR cells from the center and edge of the colony biofilm are significantly different; p values <0.0001 at days 4–20 as calculated by Mann–Whitney U.
-
Figure 7—source data 1
Uncropped DNA gel displaying junction PCR from wild-type Dup+, wild-type Dup−, ΔrecA::nptII, and ΔrecA::nptII attTn7::recA strains that was used to make Figure 7A.
The red box indicates the region of the gel used in the final figure. The lanes and identity of the band(s) are indicated.
- https://cdn.elifesciences.org/articles/84327/elife-84327-fig7-data1-v2.zip
-
Figure 7—source data 2
Uncropped DNA gel displaying control PCR from wild-type Dup+, wild-type Dup−, ΔrecA::nptII, and ΔrecA::nptII attTn7::recA strains that was used to make Figure 7A.
The red box indicates the region of the gel used in the final figure. The lanes and identity of the band(s) are indicated.
- https://cdn.elifesciences.org/articles/84327/elife-84327-fig7-data2-v2.zip
Figure 8

Duplication of the region greatly enhances biofilm development.
(A) Schematic of the fragmented gfp reporter system. Through recombination between homologous gfp sequences, a GFP− cell can give rise to a GFP+ daughter cell with an intact gfp present at the junction. (B) Z-stack confocal microscope images of biofilms from Dup+, Dup−, and locked fragmented gfp reporter strains at 24, 48, and 72 hr of growth. Scale bar: 30 µm. Average biofilm height (C) and surface area covered (D) from Dup+, Dup−, and locked fragmented gfp reporter strains at 72 hr. Columns indicate sample means and error bars correspond to standard deviation. *, **, and *** denote p values <0.05, <0.01, and <0.001, respectively, as produced by Kruskal–Wallis test. Data are representative of eight independent biological replicates.
Figure 9
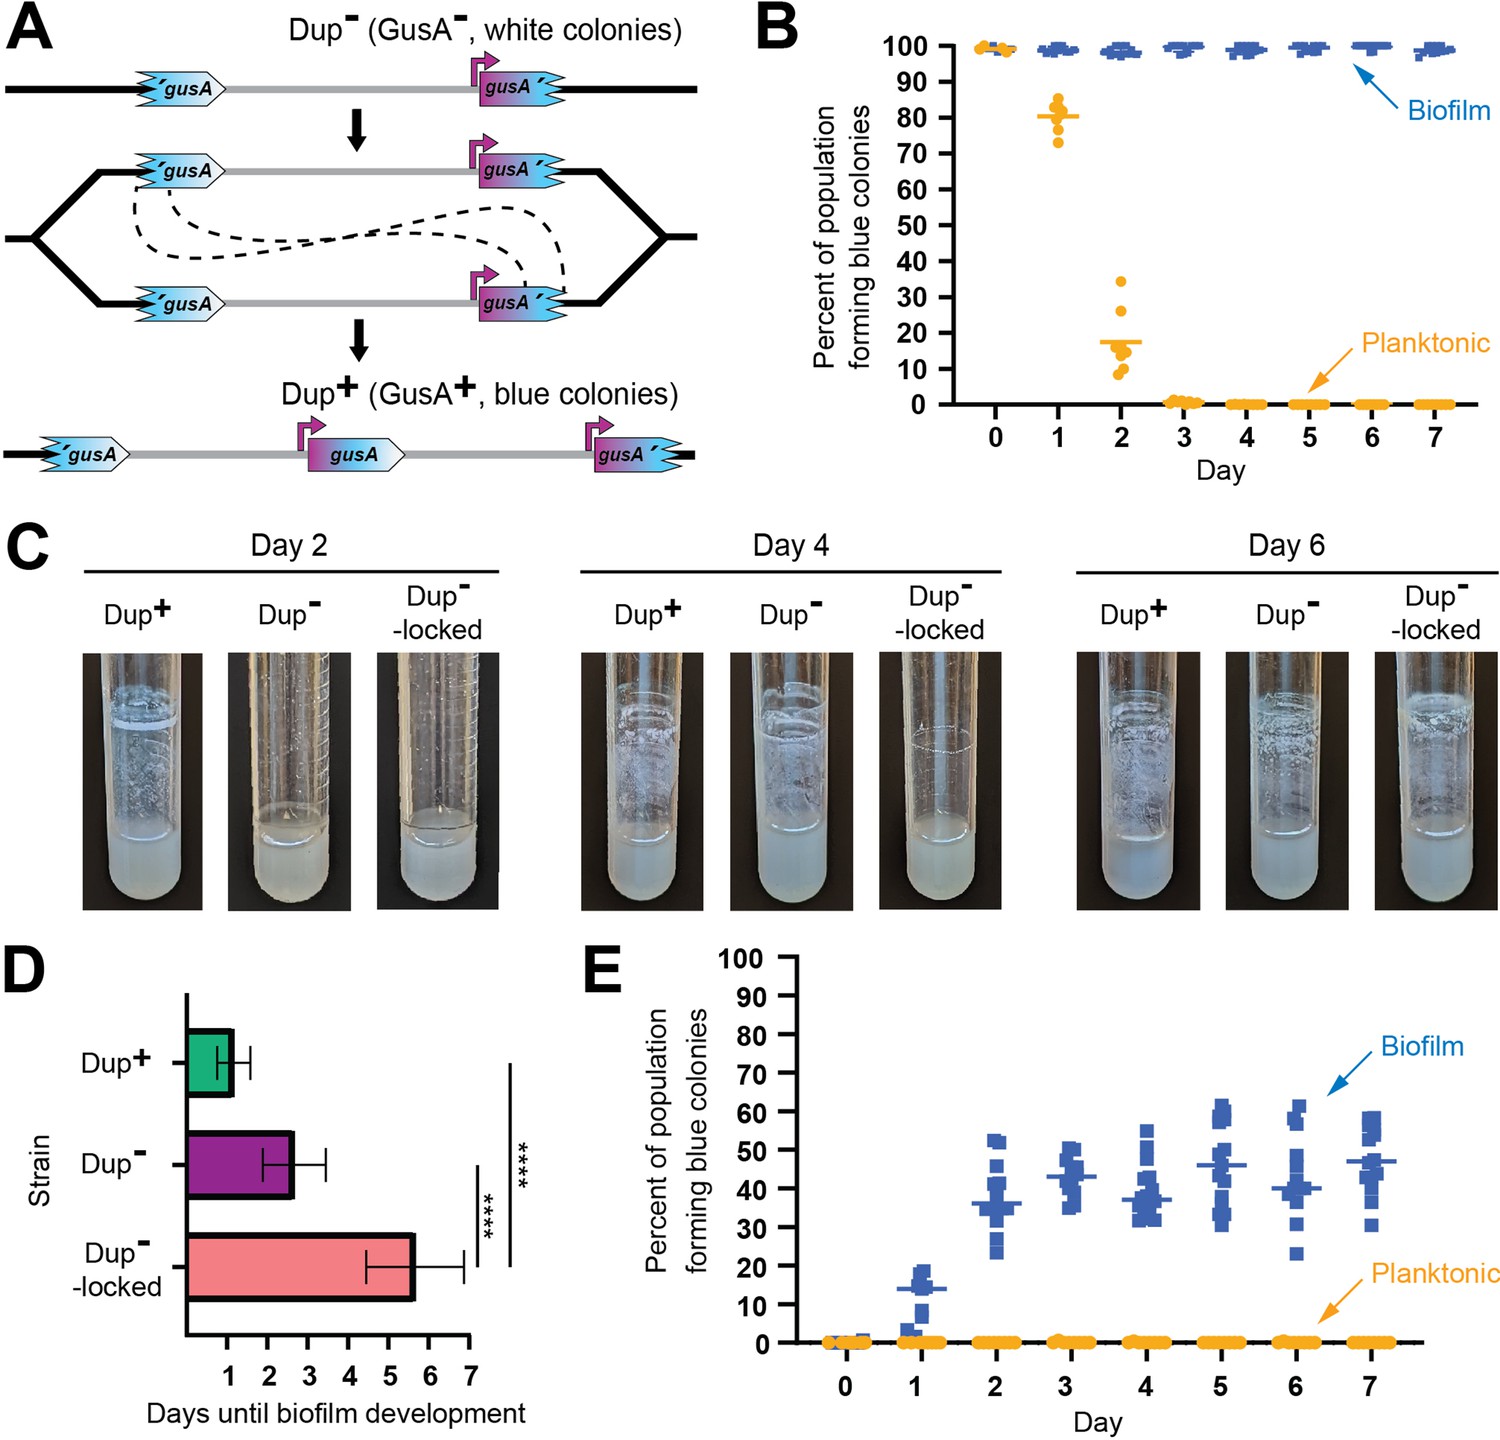
Planktonic growth enriches for a single copies of the 208.6 kb region while growth in a biofilm enriches for duplications.
(A) Schematic of the fragmented gusA reporter system. Through recombination between homologous gusA sequences, a GusA− cell can give rise to a GusA+ daughter cell with an intact gusA present at the junction. Orientation of the chromosome has been reversed for clarity and consistency. (B) Dup+ fragmented gusA reporter strain biofilms and planktonic cells were subcultured for 7 days and the proportion of blue colonies formed on X-Gluc media was calculated daily. Bars indicate sample mean. From day 1 onwards, the percent of the population forming blue colonies was significantly different, p values <0.01 at time points 1–7 as analyzed by Mann–Whitney U. (C) Images of representative air–liquid interface biofilms of Dup+, Dup−, and locked Dup− fragmented gusA strains at 2, 4, and 6 days of growth. (D) Days taken for Dup+, Dup−, and locked Dup− fragmented gusA strains to form visible, opaque biofilms at the air–liquid interface. Bars plot sample means, and error bars correspond to standard deviation. **** denotes p values <0.0001. Data are from six independent biological replicates. (E) Dup− fragmented gusA reporter strain biofilms and planktonic cells were subcultured for 7 days and the proportion of blue colonies formed on X-Gluc media was calculated daily. Bars indicate sample mean. Data are representative of three independent biological replicates. From day 1 onwards, the percent of the population forming blue colonies was significantly different, p values <0.01 at time points 1–7 as analyzed by Mann–Whitney U.
Figure 10
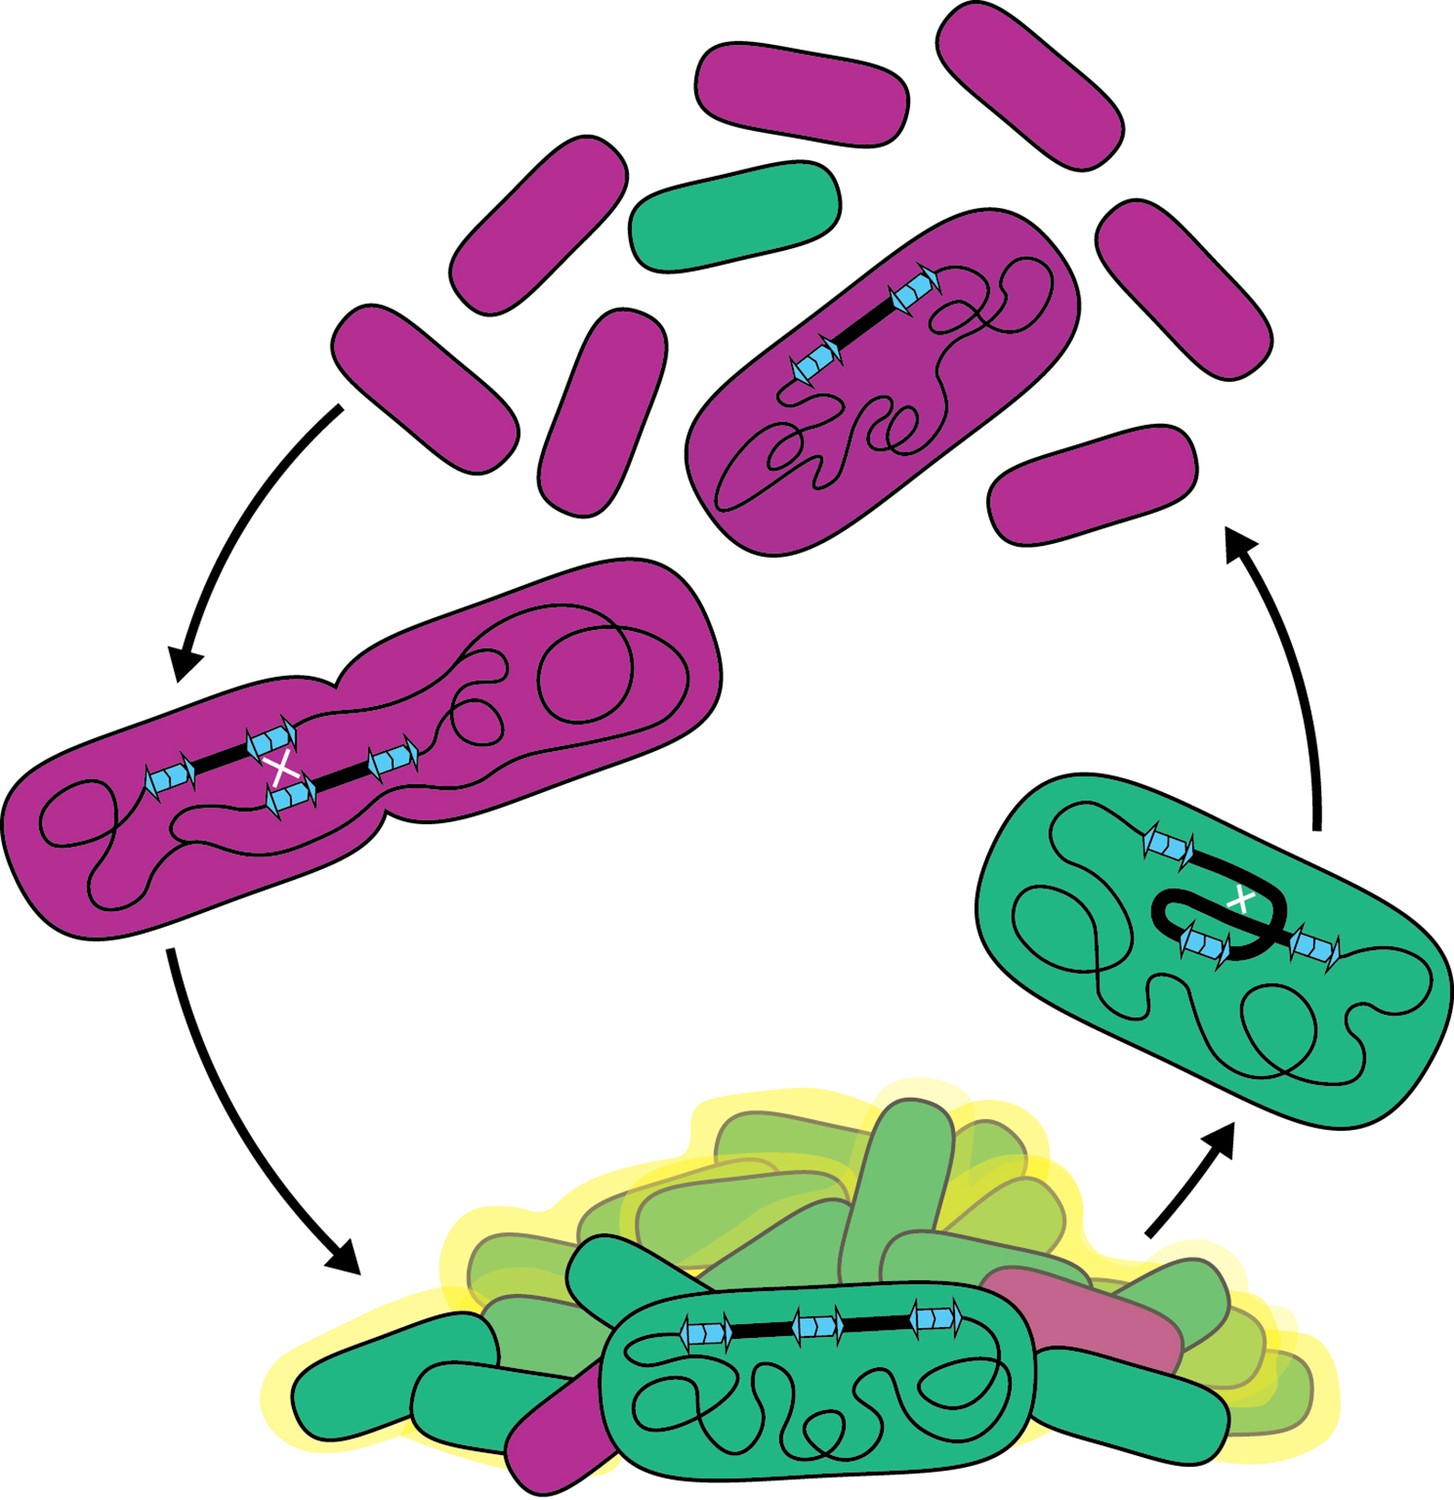
Model for the bet-hedging strategy in B. thailandensis strains containing ISα and ISβ.
Recombination between homologous IS sequences forms heterogeneous populations that allows B. thailandensis to adapt to disparate growth environments.Bacterial biofilms are ubiquitous in both natural and manufactured environments. Because biofilms can contribute to human disease and can cause environmental harm, it is important to understand mechanisms underlying their formation and maintenance. Our data indicate that the presence of two or more copies of the 208.6 kb region promotes biofilm formation, suggesting that the responsible gene(s) act as an insufficient haplotype when the region is present in single copy. The 157 genes within the region are functionally diverse: they include gene, or gene clusters, predicted to encode defense systems, antimicrobial resistance, amino acid, carbohydrate, and lipid biosynthesis, transport, and metabolism pathways, and transcription regulators. Determining which gene(s), when present in two or more copies, facilitates biofilm formation will be our next goal. Genes encoding regulatory factors, such as predicted transcription regulators lysR and luxR, are likely candidates as alteration in copy number can push signaling pathways over a threshold, leading to large changes in gene expression for all genes within the regulon. Other candidate genes include those predicted to encode fimbria or a polysaccharide transport system, which may be directly involved in biofilm formation, but whether two or three copies of these genes is sufficient for biofilm formation seems unlikely, although we cannot rule it out. While biofilm-associated growth is a single condition benefited by duplication of the 208.6 kb region, we anticipate that duplications may benefit cells in other conditions. For example, we do not know the nature or function of the molecule(s) causing the gold-brown coloration that correlates with the presence of multiple copies of the region, but we speculate that it may be advantageous for the bacteria under conditions other than, or in addition to, biofilm formation and maintenance. The diversity of predicted gene functions within the duplicating region suggests that amplification has potential to benefit BtE264 in multiple environments.
Tables
Key resources table
| Reagent type (species) or resource | Designation | Source or reference | Identifiers | Additional information |
|---|---|---|---|---|
| Gene (Burkholderia thailandensis) | Duplicating region | GCA_000012365.1 | LO74_RS28540–LO74_RS09425 | |
| Gene (Burkholderia thailandensis) | recA | GCA_000012365.1 | LO74_RS12520 | |
| Strain, strain background (Burkholderia thailandensis) | E264 | ATCC | 700388 | GCA_000012365.1 |
| Strain, strain background (Burkholderia thailandensis) | 2002721643 | USAMRIID | GCA_000959425.1 | |
| Strain, strain background (Burkholderia thailandensis) | 2002721723 | USAMRIID | GCA_000567925.1 | |
| Strain, strain background (Escherichia coli) | DH5α | GoldBio | CC-101-5x50 | Electrocompetent cells |
| Strain, strain background (Escherichia coli) | RHO3 | AddGene | 124700 | Electrocompetent cells |
| Genetic reagent (Burkholderia thailandensis) | WT with I-SceI cut sites 50 kb outside duplicating region | This study | Inserted I-SceI recognition sites between LO74_RS08325 and LO74_RS08330 and LO74_RS09660 and LO74_RS09665. | |
| Genetic reagent (Burkholderia thailandensis) | WT with gusA insertion | This study | gusA inserted between LO74_RS09420 and LO74_RS31810 near junction sequence. | |
| Genetic reagent (Burkholderia thailandensis) | ΔrecA with gusA insertion | This study | gusA inserted between LO74_RS09420 and LO74_RS31810 near junction sequence. Fused first 31 amino acids to last 38 amino acids of LO74_RS12520 (recA). | |
| Genetic reagent (Burkholderia thailandensis) | ΔrecA attTn7::recA with gusA insertion | This study | gusA inserted between LO74_RS09420 and LO74_RS31810 near junction sequence. Fused first 31 amino acids to last 38 amino acids of LO74_RS12520. recA inserted at both attTn7 sites. | |
| Genetic reagent (Burkholderia thailandensis) | PS12-bcpAIOB Dup+ with I-SceI sites 50 kb outside duplicating region | This study | PS12 and nptII inserted between bcpA and its native promoter. nptII excised with Flp recombinase. Inserted I-SceI recognition sites between LO74_RS08325 and LO74_RS08330 and LO74_RS09660 and LO74_RS09665. | |
| Genetic reagent (Burkholderia thailandensis) | ΔbcpAIOB with I-SceI sites 50 kb outside duplicating region | This study | LO74_RS09295–LO74_RS09305 (bcpAIOB) replaced with nptII surrounded by FRT sites. nptII excised with Flp recombinase. Inserted I-SceI recognition sites between LO74_RS08325 and LO74_RS08330 and LO74_RS09660 and LO74_RS09665. | |
| Genetic reagent (Burkholderia thailandensis) | PS12-bcpAIOB Dup+ | Anderson et al., 2012 | PS12 promoter inserted between LO74_RS09305 (bcpA) and its native promoter. | |
| Genetic reagent (Burkholderia thailandensis) | ΔbcpAIOB::nptII Dup− | Anderson et al., 2012 | LO74_RS09295–LO74_RS09305 (bcpAIOB) replaced with nptII surrounded by FRT sites. | |
| Genetic reagent (Burkholderia thailandensis) | PS12-bcpAIOB Dup− | This study | PS12 promoter inserted between LO74_RS09305 (bcpA) and its native promoter. | |
| Genetic reagent (Burkholderia thailandensis) | ΔbcpAIOB::ble ΔbcpAIOB::nptII Dup+ | This study | LO74_RS09295–LO74_RS09305 (bcpAIOB) replaced with nptII surrounded by FRT sites. Additional copy of LO74_RS09295– LO74_RS09305 (bcpAIOB) replaced with ble. | |
| Genetic reagent (Burkholderia thailandensis) | ΔISβ::nptII | This study | Inverted repeats and LO74_RS09425 (ISβ) replaced with nptII surrounded by FRT sites. | |
| Genetic reagent (Burkholderia thailandensis) | ΔISα::nptII | This study | Inverted repeats and LO74_RS28540 (ISα) replaced with nptII surrounded by FRT sites. | |
| Genetic reagent (Burkholderia thailandensis) | ISβ ΔorfAB::nptII ISα ΔorfAB | This study | LO74_RS28540 (ISα orfAB) replaced with nptII surrounded by FRT sites. nptII excised with Flp recombinase. LO74_RS09425 (ISβ orfAB) replaced with nptII surrounded by FRT sites. | |
| Genetic reagent (Burkholderia thailandensis) | ΔrecA | This study | Fused first 31 amino acids to last 38 amino acids of LO74_RS12520 (recA). | |
| Genetic reagent (Burkholderia thailandensis) | ΔrecA attTn7::recA | This study | Fused first 31 amino acids to last 38 amino acids of LO74_RS1252. recA inserted at both attTn7 sites. | |
| Genetic reagent (Burkholderia thailandensis) | Fragmented nptII reporter 500 bp homology | This study | Inverted repeats and LO74_RS28540 (ISα) replaced with tet and bases 46–795 of nptII (fwd). Inverted repeats and LO74_RS09425 (ISβ) replaced with ble and bases 1–545 of nptII (fwd). | |
| Genetic reagent (Burkholderia thailandensis) | Fragmented nptII reporter 150 bp homology | This study | Inverted repeats and LO74_RS28540 (ISα) replaced with tet and bases 46–795 of nptII (fwd). Inverted repeats and LO74_RS09425 (ISβ) replaced with ble and bases 1–195 of nptII (fwd). | |
| Genetic reagent (Burkholderia thailandensis) | Fragmented nptII reporter 50 bp homology | This study | Inverted repeats and LO74_RS28540 (ISα) replaced with tet and bases 46–795 of nptII (fwd). Inverted repeats and LO74_RS09425 (ISβ) replaced with ble and bases 1–95 of nptII (fwd). | |
| Genetic reagent (Burkholderia thailandensis) | Fragmented nptII reporter 0 bp homology | This study | Inverted repeats and LO74_RS28540 (ISα) replaced with tet and bases 46–795 of nptII (fwd). Inverted repeats and LO74_RS09425 (ISβ) replaced with ble and bases 1–45 of nptII (fwd). | |
| Genetic reagent (Burkholderia thailandensis) | Fragmented gfp reporter attTn7::rfp | This study | PS12-rfp inserted an attTn7 site. Inverted repeats and LO74_RS28540 (ISα) replaced with tet and bases 1–589 of gfp (rev). Inverted repeats and LO74_RS09425 (ISβ) replaced with ble and bases 89–744 of gfp (rev). 500 bp of homology in gfp fragments. | |
| Genetic reagent (Burkholderia thailandensis) | Fragmented gfp reporter attTn7::rfp locked | This study | PS12-rfp inserted an attTn7 site. Inverted repeats and LO74_RS28540 (ISα) replaced with tet and bases 1–589 of gfp (rev). | |
| Genetic reagent (Burkholderia thailandensis) | Fragmented gusA reporter | This study | Inverted repeats and LO74_RS28540 (ISα) replaced with tet and bases 118–1691 of gusA (fwd). Inverted repeats and LO74_RS09425 (ISβ) replaced with ble and bases 1–1454 of gusA (fwd) 1332 bp of homology in gusA fragments. | |
| Genetic reagent (Burkholderia thailandensis) | Fragmented gusA reporter locked | This study | Inverted repeats and LO74_RS28540 (ISα) replaced with tet and bases 118–1691 of gusA (fwd). | |
| Recombinant DNA reagent (plasmid) | pLL31 | This study | I-SceI recognition sequence and FRT-nptII-FRT flanked by 500 bp sequences homologous to portions of LO74_RS08325 and LO74_RS08330. | |
| Recombinant DNA reagent (plasmid) | pLL32 | This study | I-SceI recognition sequence and ble flanked by 500 bp sequences homologous to portions of LO74_RS09660 and LO74_RS09665. | |
| Recombinant DNA reagent (plasmid) | pLL44 | This study | gusA and ble flanked by 500 bp homologous to sequences within LO74_RS09420 and between LO74_RS09420 and LO74_RS31810. | |
| Recombinant DNA reagent (plasmid) | pABT84 | This study | FRT-nptII-FRT flanked by 500 bp sequences homologous to LO74_RS12515 and LO74_RS12525. | |
| Recombinant DNA reagent (plasmid) | pLL46 | This study | recA under control of its native promoter | |
| Recombinant DNA reagent (plasmid) | pTNS3 | Choi et al., 2008 | Helper plasmid for mini-Tn7, oriT, R6K ori | |
| Recombinant DNA reagent (plasmid) | pABT86 | This study | PS12 promoter and FRT-nptII-FRT flanked by 500 bp sequences homologous to LO74_RS09305 and LO74_RS28675. | |
| Recombinant DNA reagent (plasmid) | pFlpTet | Garcia et al., 2013 | Rham-inducible flp, TS ori | |
| Recombinant DNA reagent (plasmid) | pLL37 | This study | ble flanked by 500 bp sequences homologous to LO74_RS09295- LO74_RS09305. | |
| Recombinant DNA reagent (plasmid) | pLL38 | This study | FRT-nptII-FRT flanked by 500 bp sequences homologous to LO74_RS09295- LO74_RS09305. | |
| Recombinant DNA reagent (plasmid) | pLL29 | This study | FRT-nptII-FRT flanked by 500 bp sequences homologous to sequences between LO74_RS31810 and LO74_RS09435 and LO74_RS09435. | |
| Recombinant DNA reagent (plasmid) | pABT104 | This study | FRT-nptII-FRT flanked by 500 bp sequences homologous to LO74_RS08585 and LO74_RS08600. | |
| Recombinant DNA reagent (plasmid) | pABT66 | Ocasio and Cotter, 2019 | FRT-nptII-FRT flanked by 500 bp sequences homologous to LO74_RS31810 through 5′ ISβ inverted repeat and 3′ ISβ inverted repeat through LO74_RS09435. | |
| Recombinant DNA reagent (plasmid) | pABT78 | Ocasio and Cotter, 2019 | FRT-nptII-FRT flanked by 500 bp sequences homologous to LO74_RS08585 through 5′ ISα inverted repeat and 3′ ISα inverted repeat through LO74_RS08600. | |
| Recombinant DNA reagent (plasmid) | pLL61 | This study | tet and nptII46–795 (fwd) flanked by 500 bp sequences homologous to LO74_RS08585 and LO74_RS08600. | |
| Recombinant DNA reagent (plasmid) | pLL62 | This study | ble and nptII1–545 (fwd) flanked by 500 bp sequences homologous to LO74_RS09420 and LO74_RS31810 and LO74_RS09435. | |
| Recombinant DNA reagent (plasmid) | pLL63 | This study | ble and nptII1–195 (fwd) flanked by 500 bp sequences homologous to LO74_RS09420 and LO74_RS31810 and LO74_RS09435. | |
| Recombinant DNA reagent (plasmid) | pLL64 | This study | ble and nptII1–95 (fwd) flanked by 500 bp sequences homologous to LO74_RS09420 and LO74_RS31810 and LO74_RS09435. | |
| Recombinant DNA reagent (plasmid) | pLL74 | This study | ble and nptII1–45 (fwd) flanked by 500 bp sequences homologous to LO74_RS09420 and LO74_RS31810 and LO74_RS09435. | |
| Recombinant DNA reagent (plasmid) | pLL72 | This study | tet and gusA118–1691 (fwd) flanked by 500 bp sequences homologous to LO74_RS08585 and LO74_RS08600. | |
| Recombinant DNA reagent (plasmid) | pLL73 | This study | tet and gusA1–1454 (fwd) flanked by 500 bp sequences homologous to LO74_RS09420 and LO74_RS31810 and LO74_RS09435. | |
| Recombinant DNA reagent (plasmid) | mini-Tn7-km-rfp | Norris et al., 2010 | PS12-Turborfp | |
| Recombinant DNA reagent (plasmid) | pLL65 | This study | tet and gfp1–589 (rev) flanked by 500 bp sequences homologous to LO74_RS08585 and LO74_RS08600. | |
| Recombinant DNA reagent (plasmid) | pLL66 | This study | tet and gusA89–744 (rev) flanked by 500 bp sequences homologous to LO74_RS09420 and LO74_RS31810 and LO74_RS09435. | |
| Sequence-based reagent | Junc1 | IDT | 5′ GCCGTGCTAGAGAGGCGCTA 3′ | |
| Sequence-based reagent | Junc2 | IDT | 5′ AGCAGAATCAGATGCACGCCATTCG 3′ | |
| Sequence-based reagent | Ctrl1 | IDT | 5′ TGATGCAGTTTCCGGCGCAGTAAC 3′ | |
| Sequence-based reagent | Ctrl2 | IDT | 5′ AATCGTGTCGGCGTGTGACGAA 3′ | |
| Chemical compound | X-Gluc (5-bromo-4-chloro-3-indolyl-beta-D-glucuronic acid, cyclohexyl ammonium salt) | Goldbio | B-735-250 | |
| Chemical compound, drug | Kanamycin Monosulfate | Chem-Impex International, Inc | 00195 | |
| Software | GraphPad Prism | GraphPad Prism (https://graphpad.com) | Version 9.5.0 | |
| Software | Imaris x64 | Imaris (https://imaris.oxinst.com/) | Version 9.9.1 |
Additional files
Download links
A two-part list of links to download the article, or parts of the article, in various formats.
Downloads (link to download the article as PDF)
Open citations (links to open the citations from this article in various online reference manager services)
Cite this article (links to download the citations from this article in formats compatible with various reference manager tools)
An IS-mediated, RecA-dependent, bet-hedging strategy in Burkholderia thailandensis
eLife 12:e84327.
https://doi.org/10.7554/eLife.84327


