Mitochondrial protein import clogging as a mechanism of disease
- Department of Biochemistry and Molecular Biology, State University of New York Upstate Medical University, United States
- Institute of Biochemistry and Molecular Biology, Faculty of Medicine, University of Freiburg, Germany
- Institute of Biochemistry and Molecular Biology, Faculty of Medicine, University of Bonn, Germany
- Proteomics and Mass Spectrometry Core Facility, State University of New York Upstate Medical University, United States
- Department of Microbiology and Immunology, State University of New York Upstate Medical University, United States
- Department of Neurology, State University of New York Upstate Medical University, United States
- Department of Neuroscience and Physiology, State University of New York Upstate Medical University, United States
Figures
Figure 1 with 1 supplement
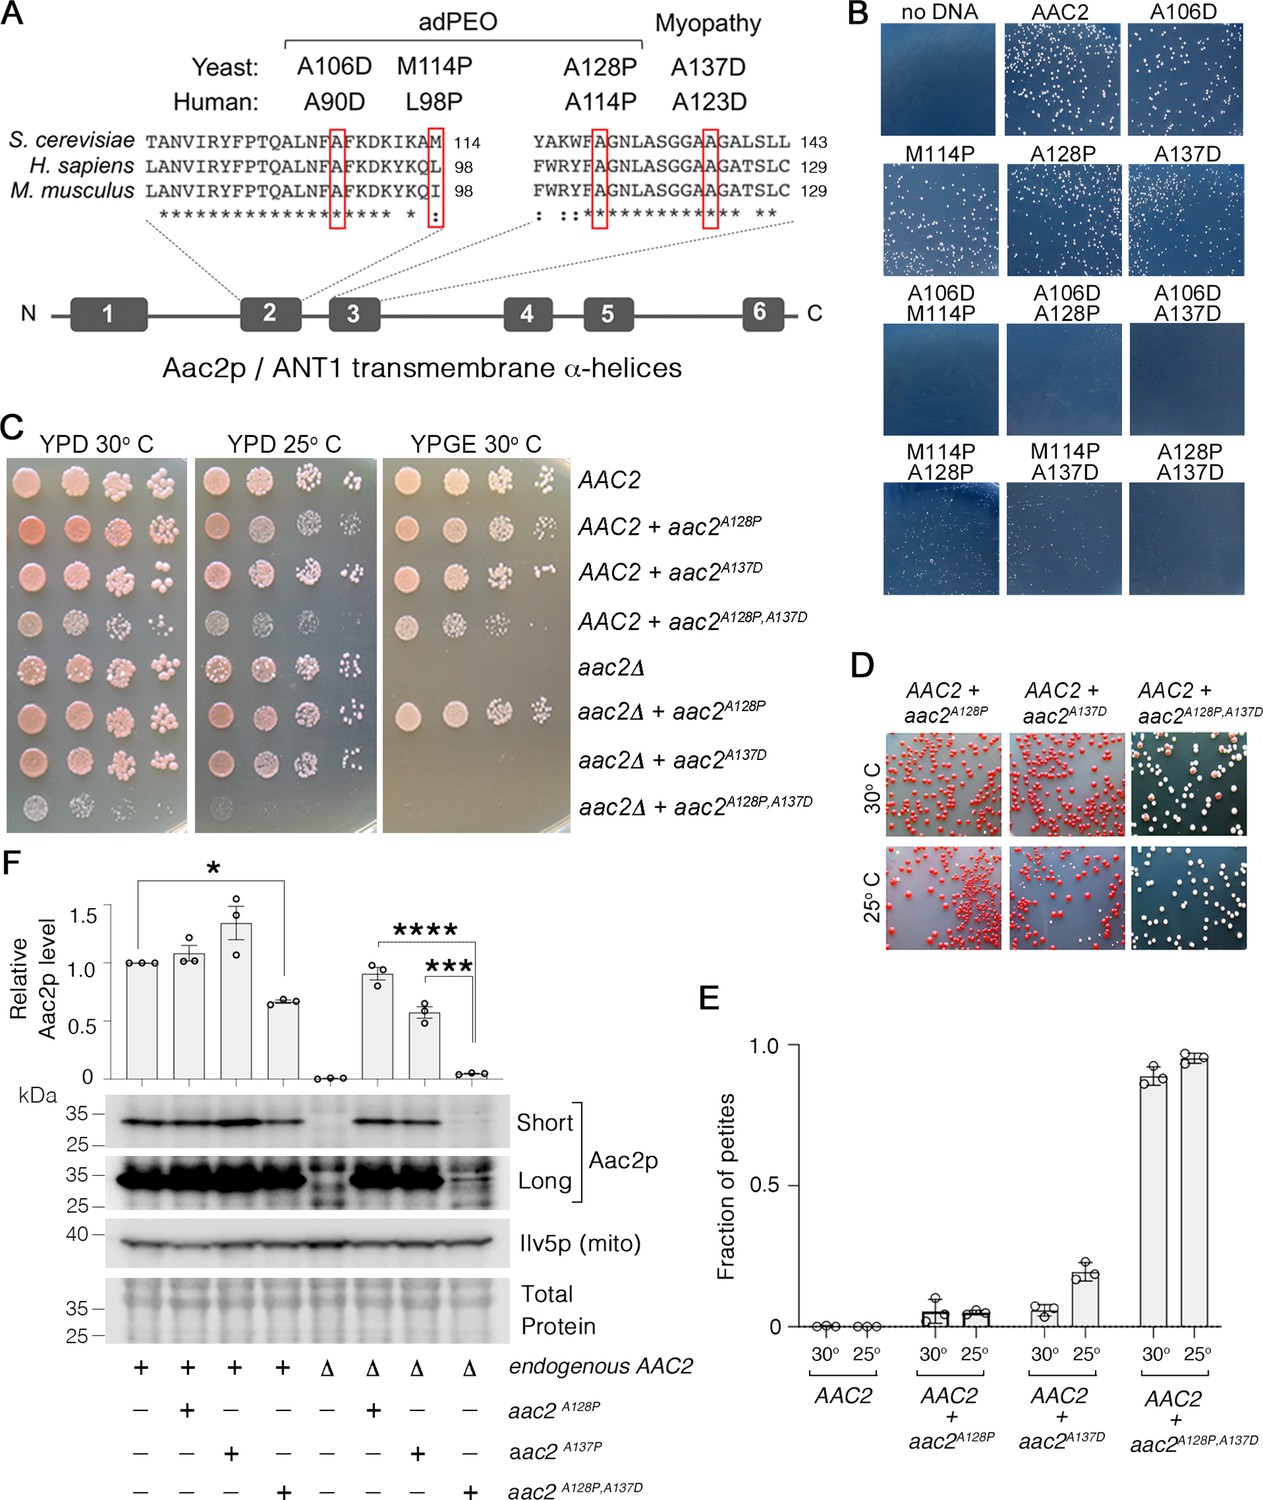
Super-toxic Aac2p mutants dominantly kill cells.
(A) Schematic showing the location of pathogenic mutations in transmembrane α-helices 2 and 3 of the ADP/ATP translocator in human (ANT1) compared with mouse (Ant1) and yeast (Aac2p). adPEO, autosomal dominant progressive external ophthalmoplegia. (B) Expression of double mutant aac2 alleles is highly toxic. The yeast M2915-6A strain was transformed with the centromeric vector pRS416 (URA3) expressing wild-type or mutant aac2 alleles and transformants were grown on selective glucose medium lacking uracil at 25°C for 3 days. (C) Growth of yeast cells after serial dilution, showing dominant toxicity of aac2A128P,A137D that is integrated into the genome in the W303-1B strain background. YPD, yeast peptone dextrose medium; YPGE, yeast peptone glycerol ethanol medium. (D) The aac2A128P,A137D allele dominantly increases the frequency of ‘petite’ colonies, which are white. This indicates mitochondrial DNA (mtDNA) destabilization. (E) ‘Petite’ frequencies of yeast strains expressing the mutant alleles of aac2. The strains were first grown in YPD medium for 24 hr before being plated on YPD medium for scoring ‘petite’ colonies. (F) Immunoblot analysis showing extremely low levels of Aac2pA128P,A137D (lower panels) Ilv5p was used as a loading control for mitochondrial protein. Total protein determined with total protein stain (LI-COR). Short, short exposure; Long, long exposure. Upper panel, quantitation from three independent experiments. Aac2p values were normalized by Ilv5p to control for mitochondrial content, and data were represented as relative to wild-type; * indicates p<0.05, ***p<0.001, ****p<0.0001 from one-way ANOVA with Tukey’s multiple comparisons test. Data represented as mean ± SEM.
-
Figure 1—source data 1
Uncropped Western blots from Figure 1F.
- https://cdn.elifesciences.org/articles/84330/elife-84330-fig1-data1-v2.zip
Figure 1—figure supplement 1
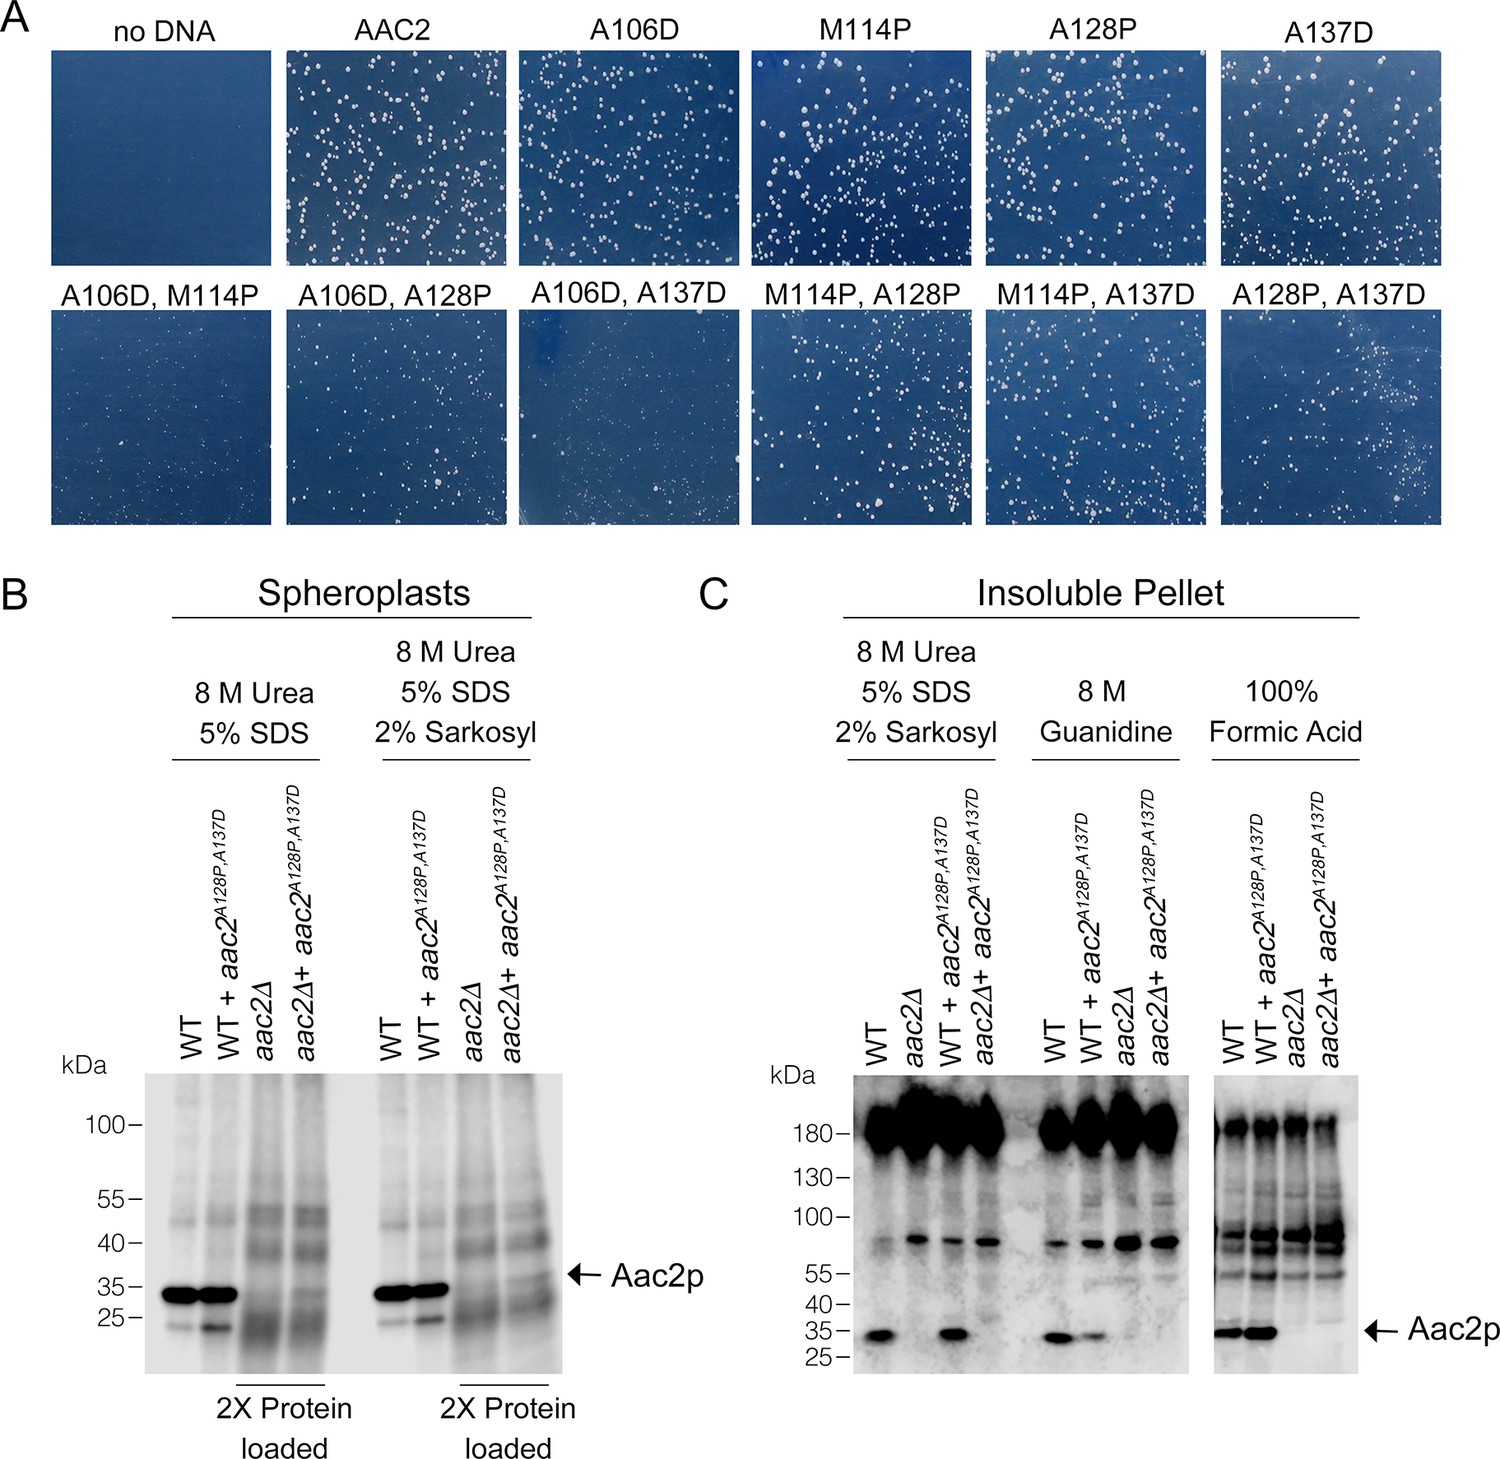
Toxicity and low-level accumulation of double mutant Aac2 proteins.
(A) Yeast transformants expressing double mutant alleles of aac2 form small colonies on selective medium, which indicates the toxicity of input plasmid DNA. The yeast M2915-6A strain was transformed with the centromeric vector pRS416 (URA3) expressing wild-type or mutant aac2 alleles and transformants were grown on minimal glucose medium lacking uracil at 30°C for 3 days. This serves as a control for Figure 1B. (B) Immunoblot analysis of Aac2p after protein extraction from spheroplasts using the detergents indicated. (C) Immunoblot analysis of Aac2p in protein extracted from the detergent-insoluble pellet with additional solubilization conditions after a first round of extraction using 8 M urea plus 5% SDS.
-
Figure 1—figure supplement 1—source data 1
Uncropped Western blots from Figure 1—figure supplement 1B-C.
- https://cdn.elifesciences.org/articles/84330/elife-84330-fig1-figsupp1-data1-v2.zip
Figure 2 with 1 supplement
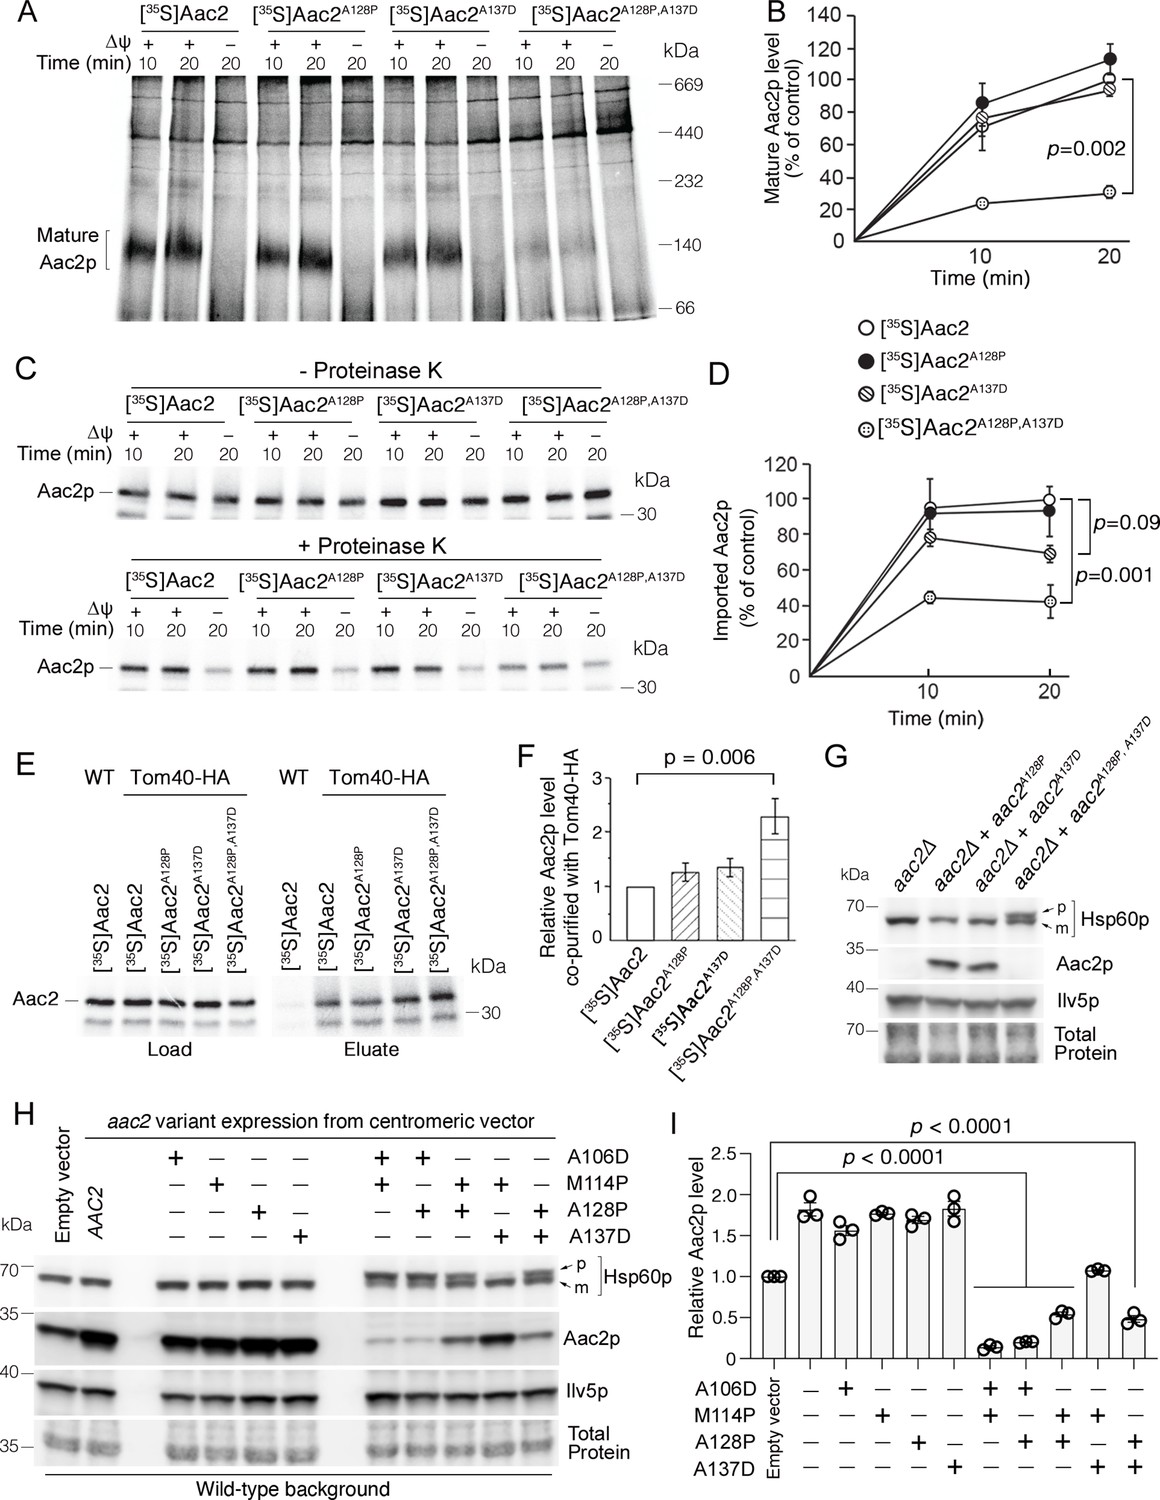
Super-toxic ADP/ATP carrier 2 (Aac2) proteins clog the translocase of the outer membrane (TOM) complex.
(A) In vitro protein import assay. 35S-labeled Aac2p and mutant variants were imported into wild-type mitochondria for 10 or 20 min and analyzed by blue native electrophoresis and autoradiography. (B) Quantitation from three independent experiments depicted in (A). p-Value from two-way repeated measures ANOVA with Sidak’s multiple comparisons test. (C) 35S-labeled Aac2p and mutant variants were imported into wild-type mitochondria without (upper) or with (lower panel) subsequent proteinase K treatment to degrade non-imported preproteins. Reaction analyzed by SDS-PAGE and autoradiography. (D) Quantitation from three independent experiments depicted in (C). p-Values were calculated as in (B). (E) Preferential association of mutant Aac2p with Tom40-HA. 35S-labeled Aac2p and mutant variants were imported into Tom40-HA mitochondria, followed by anti-HA immunoprecipitation and analysis by SDS-PAGE and autoradiography. (F) Quantitation from three independent experiments depicted in (E). p-Value was calculated with a one-way ANOVA and Dunnett’s multiple comparisons test. (G) Immunoblot analysis showing accumulation of the un-cleaved precursor of Hsp60p (p) in cells expressing chromosomally integrated aac2A128P,A137D. Cells were grown in YPD at 30°C. m, mature (i.e. cleaved). (H) Immunoblot analysis showing accumulation of un-cleaved Hsp60p precursor (p) in cells expressing aac2 alleles from a centromeric vector. Cells were grown in yeast nitrogen-based dextrose media with supplemented casamino acids, lacking uracil at 25°C. (I) Quantitation from three replicates of (H). Aac2p values normalized by the mitochondrial protein Ilv5p, and then normalized to vector-transformed samples. p-Values were calculated as in (F). Data represented as mean ± SEM.
-
Figure 2—source data 1
Uncropped autoradiographs (Figure 2A,C,E) and Western blots (Figure 2G,H).
- https://cdn.elifesciences.org/articles/84330/elife-84330-fig2-data1-v2.zip
Figure 2—figure supplement 1
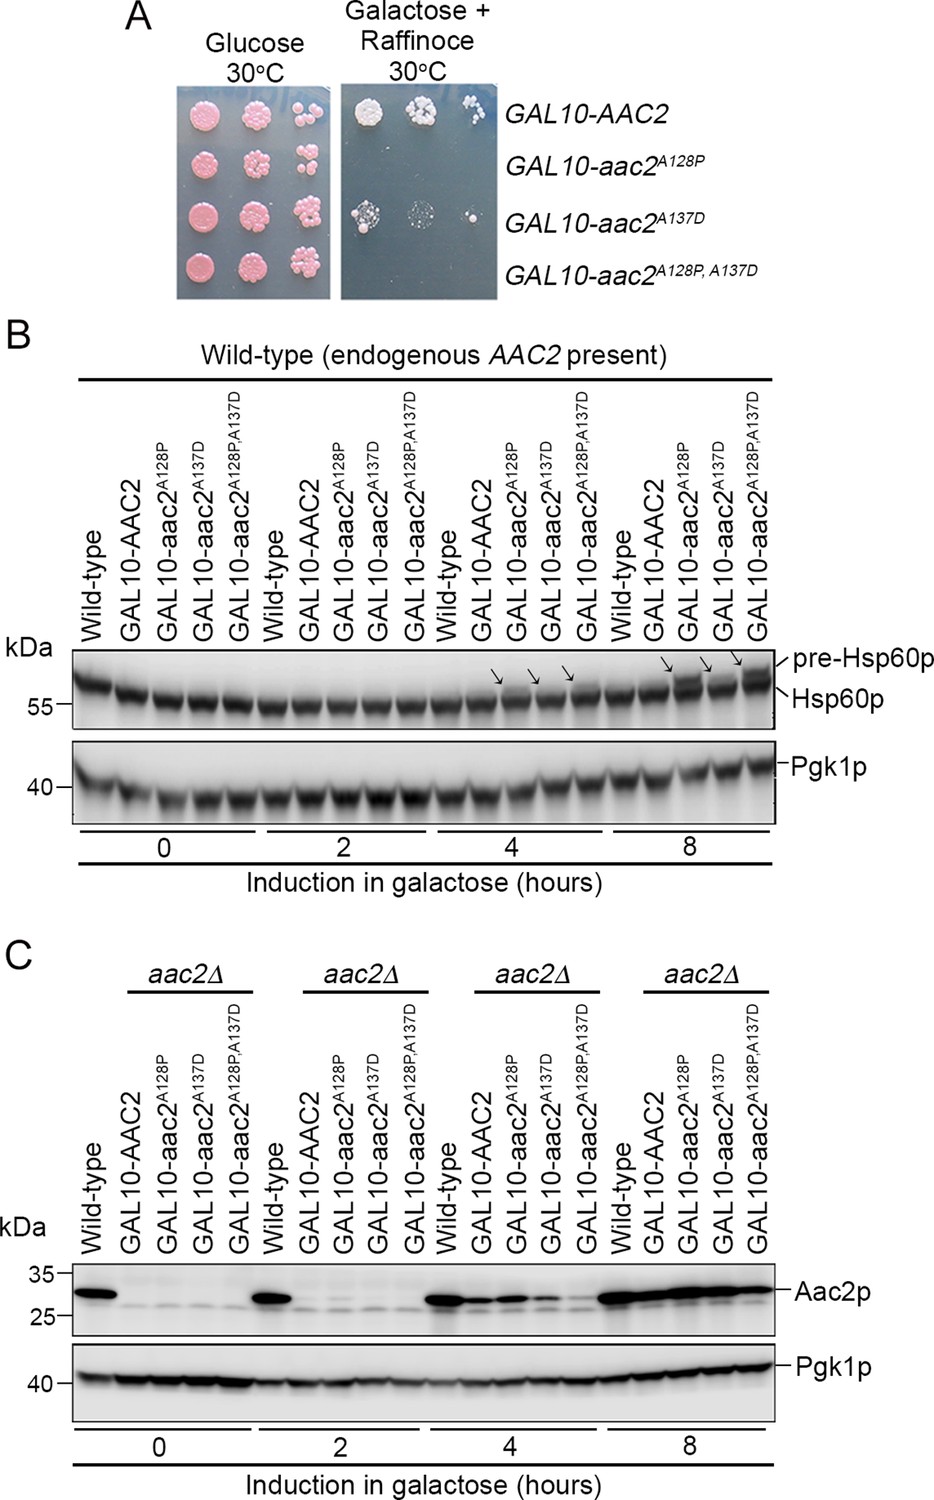
Acute expression of mutant Aac2p is toxic and impairs protein import.
(A) Expression of chromosomally integrated aac2A128P, aac2A137D, and aac2A128P, A137D from the GAL10 promoter on complete galactose plus raffinose medium inhibits cell growth in the W303 background. (B) Time course study showing that acute expression of the chromosomally integrated aac2A128P, aac2A137D, and aac2A128P, A137D from the GAL10 promoter leads to the accumulation of Hsp60p precursor in the presence of a wild-type copy of AAC2. (C) Western blot showing expression of chromosomally integrated aac2A128P, aac2A137D, and aac2A128P, A137D from the GAL10 promoter in an aac2Δ strain background.
-
Figure 2—figure supplement 1—source data 1
Uncropped Western blots from Figure 2—source data 1B-C.
- https://cdn.elifesciences.org/articles/84330/elife-84330-fig2-figsupp1-data1-v2.zip
Figure 3
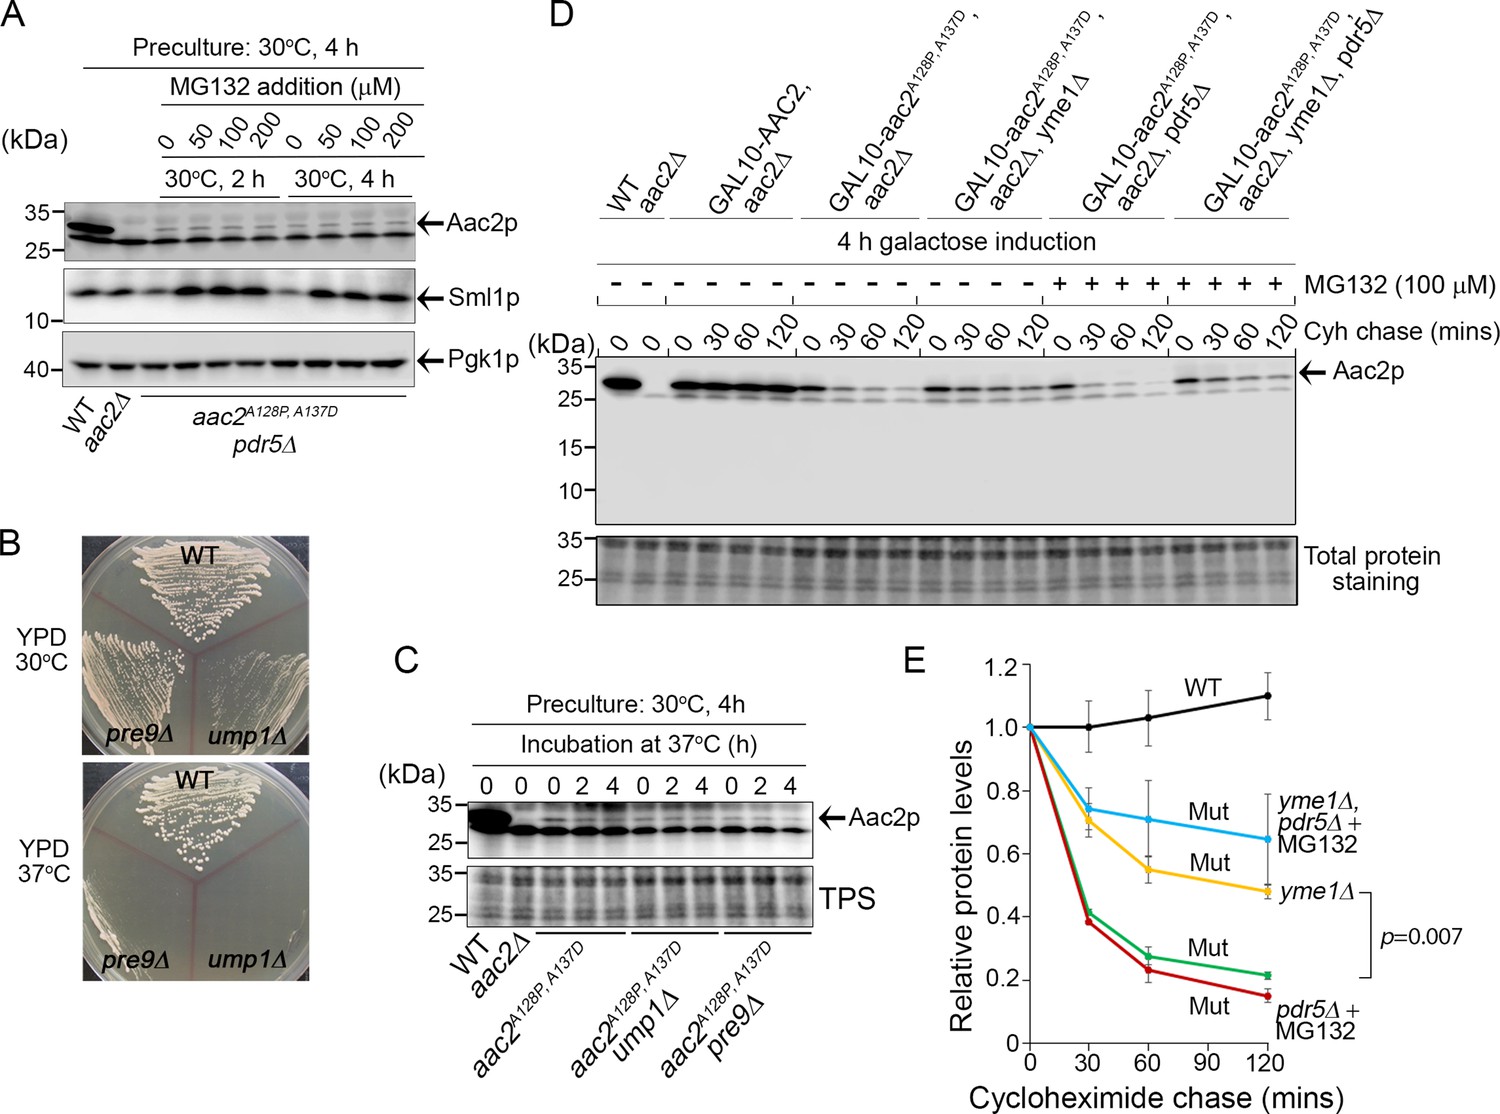
Degradation of Aac2pA128P, A137D by Yme1p.
(A) Effect of MG132 on the steady-state level of Aac2A128P, A137D in a strain disrupted of PDR5 and AAC2. Cells were first grown in YPD medium at 30°C for 4 hr before MG132 was added at the indicated concentrations. Cells were cultured for another 2 or 4 hr before being harvested for western blot analysis. Sml1 was used as a control for proteasome inhibition. (B) Temperature-sensitive phenotype of ump1Δ and pre9Δ cells. Cells were grown at the indicated temperatures for 2 days before being photographed. (C) Western blot analysis showing that ump1Δ and pre9Δ do not affect the steady-state level of Aac2pA128P, A137D. Cells were grown in YPD medium for 2 and 4 hr at the restrictive temperature (37°C) before being analyzed for Aac2pA128P, A137D levels. TPS, total protein staining. (D) Western blot showing the stability of Aac2pA128P, A137D after cycloheximide (Cyh) chase in cells disrupted of YME1 or treated with MG132, following GAL10-induced synthesis of Aac2pA128P, A137D in galactose medium at 30°C for 4 hr. (E) Quantification of data for the turnover rate of Aac2pA128P, A137D (Mut) and its wild-type control (WT) depicted in (D). Aac2 levels were first normalized by total protein stain and then plotted as values relative to time zero. Depicted are mean values ± SEM from three independent experiments. p-Value was calculated with a two-way repeated measures ANOVA with Tukey’s multiple comparisons test to compare genotypes at time = 120 min.
-
Figure 3—source data 1
Uncropped Western blots from Figure 3A,C,D.
- https://cdn.elifesciences.org/articles/84330/elife-84330-fig3-data1-v2.zip
Figure 4 with 3 supplements
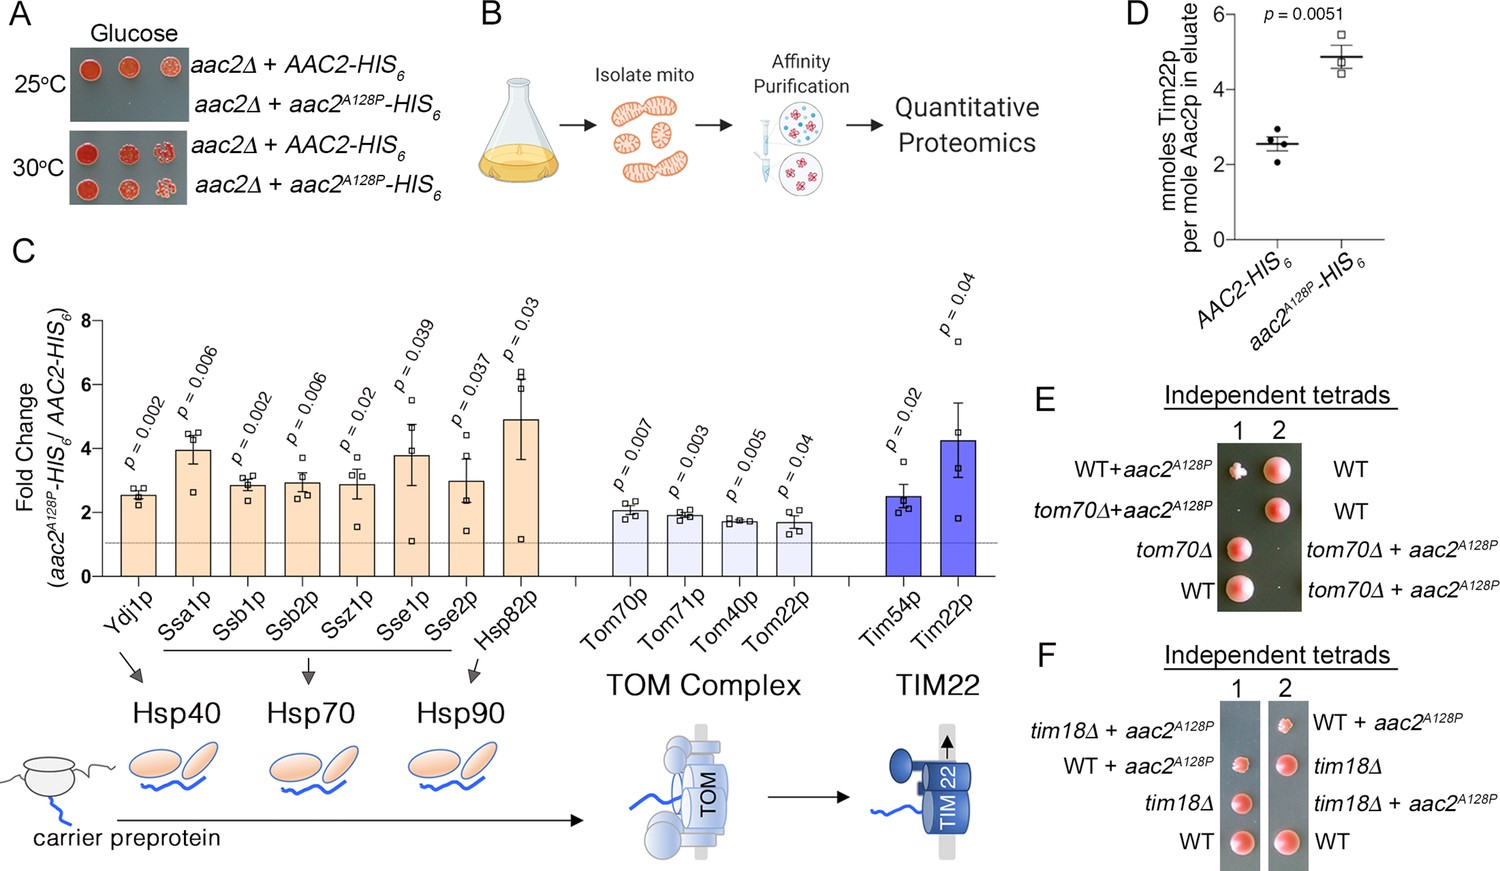
Aac2pA128P accumulates along the carrier import pathway and induces protein import stress.
(A) Growth of cells after serial dilution showing that aac2A128P-HIS6 is toxic at 25°C on glucose medium in an M2915-6A-derived strain. (B) Schematic of our approach to identify aberrant protein-protein interactions of Aac2pA128P-HIS6. (C) Co-purified proteins significantly enriched in Aac2pA128P-HIS6 eluate compared with Aac2p-HIS6. See Materials and methods for details on abundance value calculation. FDR-corrected p-values depicted are from multiple t test analysis. Lower panel is a schematic of the mitochondrial carrier protein import pathway. (D) Absolute quantities of Aac2p and Tim22p in Aac2p-HIS6 and Aac2pA128P-HIS6 eluates, as determined by parallel reaction monitoring (PRM) mass spectrometry. p-Value was calculated with Student’s t test. (E–F) Tetrad analysis demonstrating lethality of aac2A128P expression with genetic defects in carrier protein import in the M2915-6A strain background. Cell were grown on YPD at 30°C. Data depicted as mean ± SEM.
-
Figure 4—source data 1
Proteins that preferentially interact with Aac2pA128P-HIS6, compare with Aac2-HIS6 in low-salt conditions.
- https://cdn.elifesciences.org/articles/84330/elife-84330-fig4-data1-v2.xlsx
Figure 4—figure supplement 1
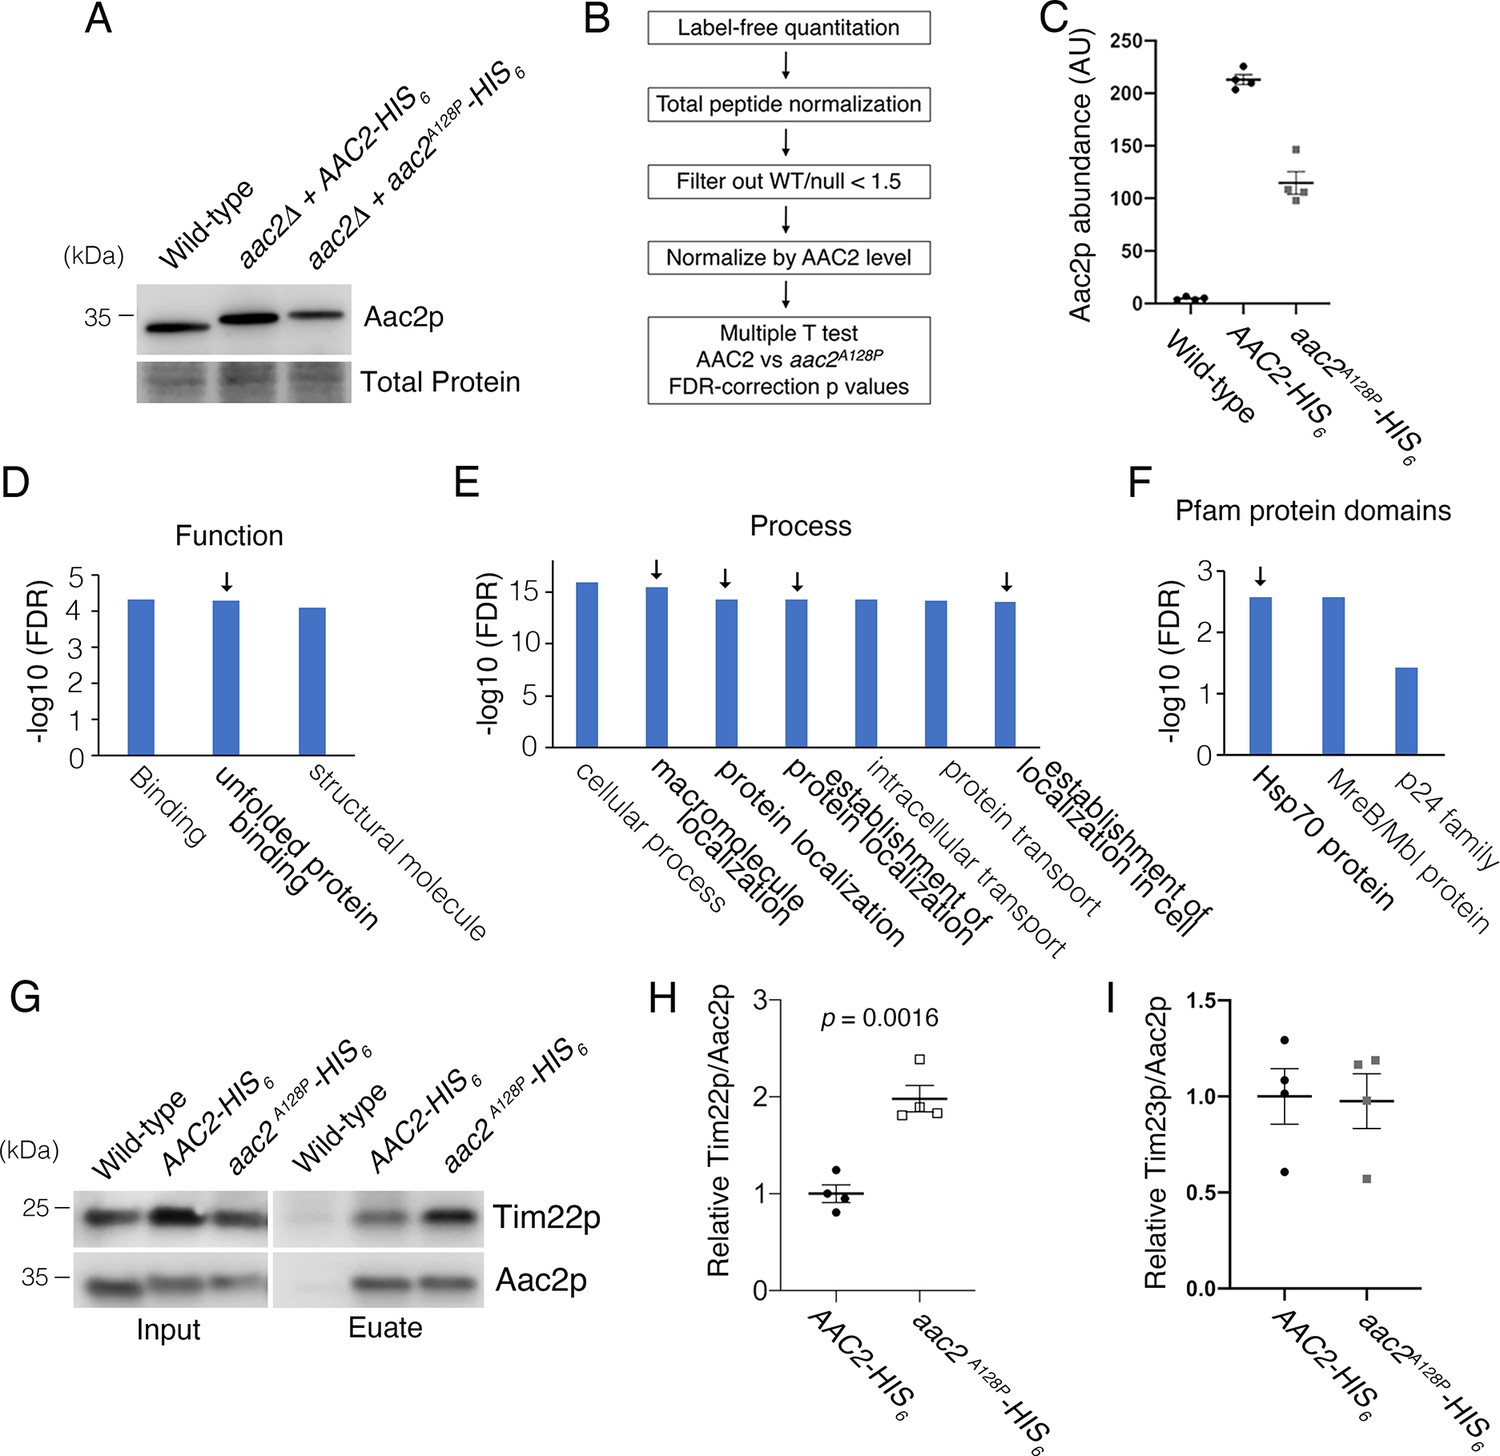
Affinity purification in low-salt conditions suggested that Aac2pA128P accumulates along the carrier protein import pathway.
(A) Immunoblot analysis validating the HIS6-tagged Aac2p proteins. (B) Flow chart of label-free quantitative mass spectrometry data processing strategy. See Materials and methods for further details. (C) Label-free quantitative mass spectrometry demonstrated that Aac2pA128P-HIS6 was about half as abundant as Aac2p-HIS6 after total peptide normalization. This is consistent with immunoblot in (A) and underscores the need to normalize prey protein levels by bait (i.e. Aac2) protein levels. These data are from the low-salt experiment. (D) Three most significant Gene Ontology (GO) Molecular Function terms overrepresented among proteins that are significantly enriched in Aac2pA128P-HIS6 eluate in the low-salt experiment. (E) Seven most significant GO Biological Process terms overrepresented among proteins that are significantly enriched in Aac2pA128P-HIS6 eluate in the low-salt experiment. (F) Three most significant protein families overrepresented among proteins that are significantly enriched in Aac2pA128P-HIS6 eluate in the low-salt experiment, as determined from the Pfam database. (G) Immunoblot analysis validating preferential co-purification of Tim22p with Aac2pA128P-HIS6 compared with Aac2p-HIS6. (H) Quantitation from four independent affinity purifications followed by immunoblotting, as shown in (D). p-Value was calculated with Student’s t test. (I) The association of Aac2pA128P with Tim23p was not increased compared with wild-type in the low-salt experiment. These data are from label-free quantitative mass spectrometry of pull-down products. Data depicted as mean ± SEM.
-
Figure 4—figure supplement 1—source data 1
Uncropped Western blots from Figure 4—figure supplement 1A,G.
- https://cdn.elifesciences.org/articles/84330/elife-84330-fig4-figsupp1-data1-v2.zip
Figure 4—figure supplement 2
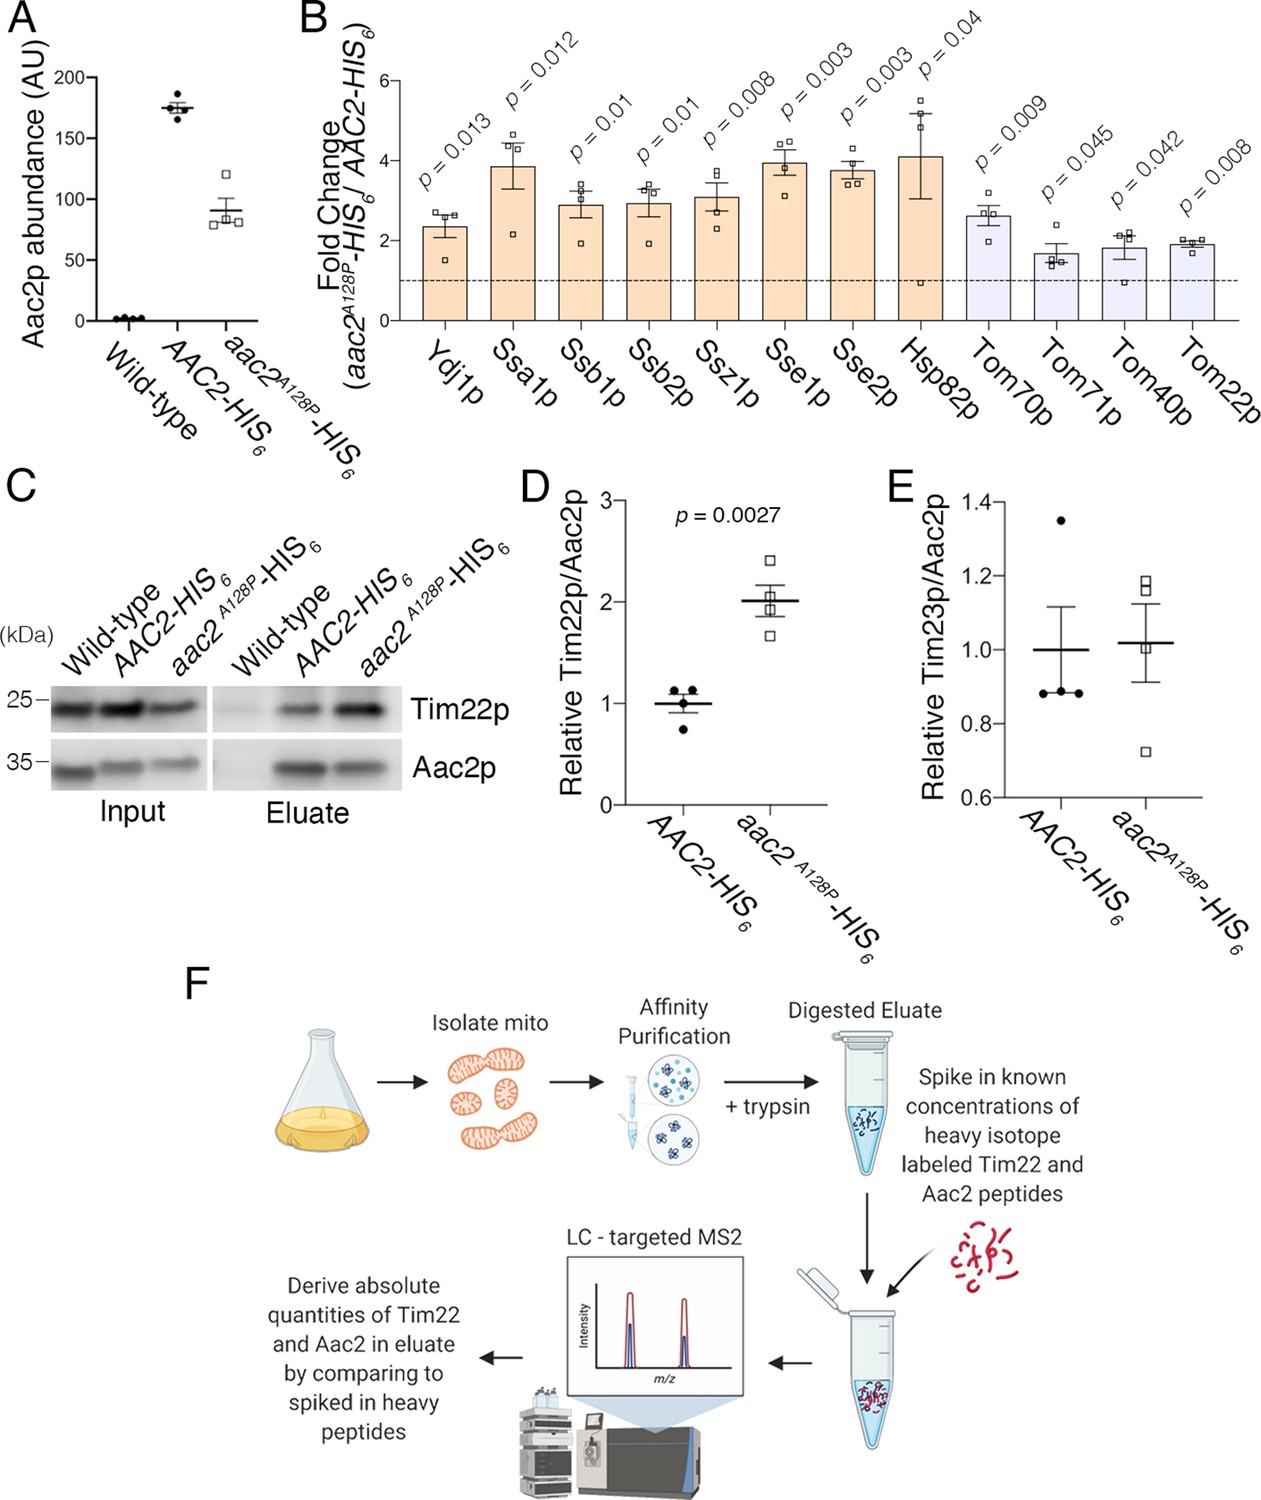
Affinity purification in high-salt conditions confirmed that Aac2pA128P accumulates along the carrier protein import pathway.
(A) Label-free quantitative mass spectrometry demonstrated that Aac2pA128P-HIS6 was about half as abundant as Aac2p-HIS6 after total peptide normalization. This is consistent with the low-salt experiment and underscores the need to normalize prey protein levels by bait (i.e. Aac2) protein levels. (B) Co-purified proteins significantly enriched in Aac2pA128P-HIS6 eluate compared with Aac2p-HIS6 under high-salt purification conditions. FDR-corrected p-values calculated by multiple t test analysis. See Materials and methods for details on abundance values. (C) Immunoblot analysis indicating preferential co-purification of Tim22p with Aac2pA128P-HIS6 compared with Aac2p-HIS6 in high-salt conditions. (D) Quantitation from four independent affinity purifications followed by immunoblotting, as in (C). p-Value was calculated with Student’s t test. (E) The association of Aac2pA128P with Tim23p was not increased compared with wild-type in the high-salt experiment. (F) Schematic of the parallel reaction monitoring approach for targeted proteomic quantification of Aac2p and Tim22p in pull-down products. Data depicted as mean ± SEM.
-
Figure 4—figure supplement 2—source data 1
Proteins that preferentially interact with Aac2pA128P-HIS6, compare with Aac2p-HIS6 in high-salt conditions.
- https://cdn.elifesciences.org/articles/84330/elife-84330-fig4-figsupp2-data1-v2.xlsx
-
Figure 4—figure supplement 2—source data 2
Uncropped Western blots from Figure 4—figure supplement 2C.
- https://cdn.elifesciences.org/articles/84330/elife-84330-fig4-figsupp2-data2-v2.zip
Figure 4—figure supplement 3
Cellular responses to aac2A128P expression support mitochondrial protein import clogging.
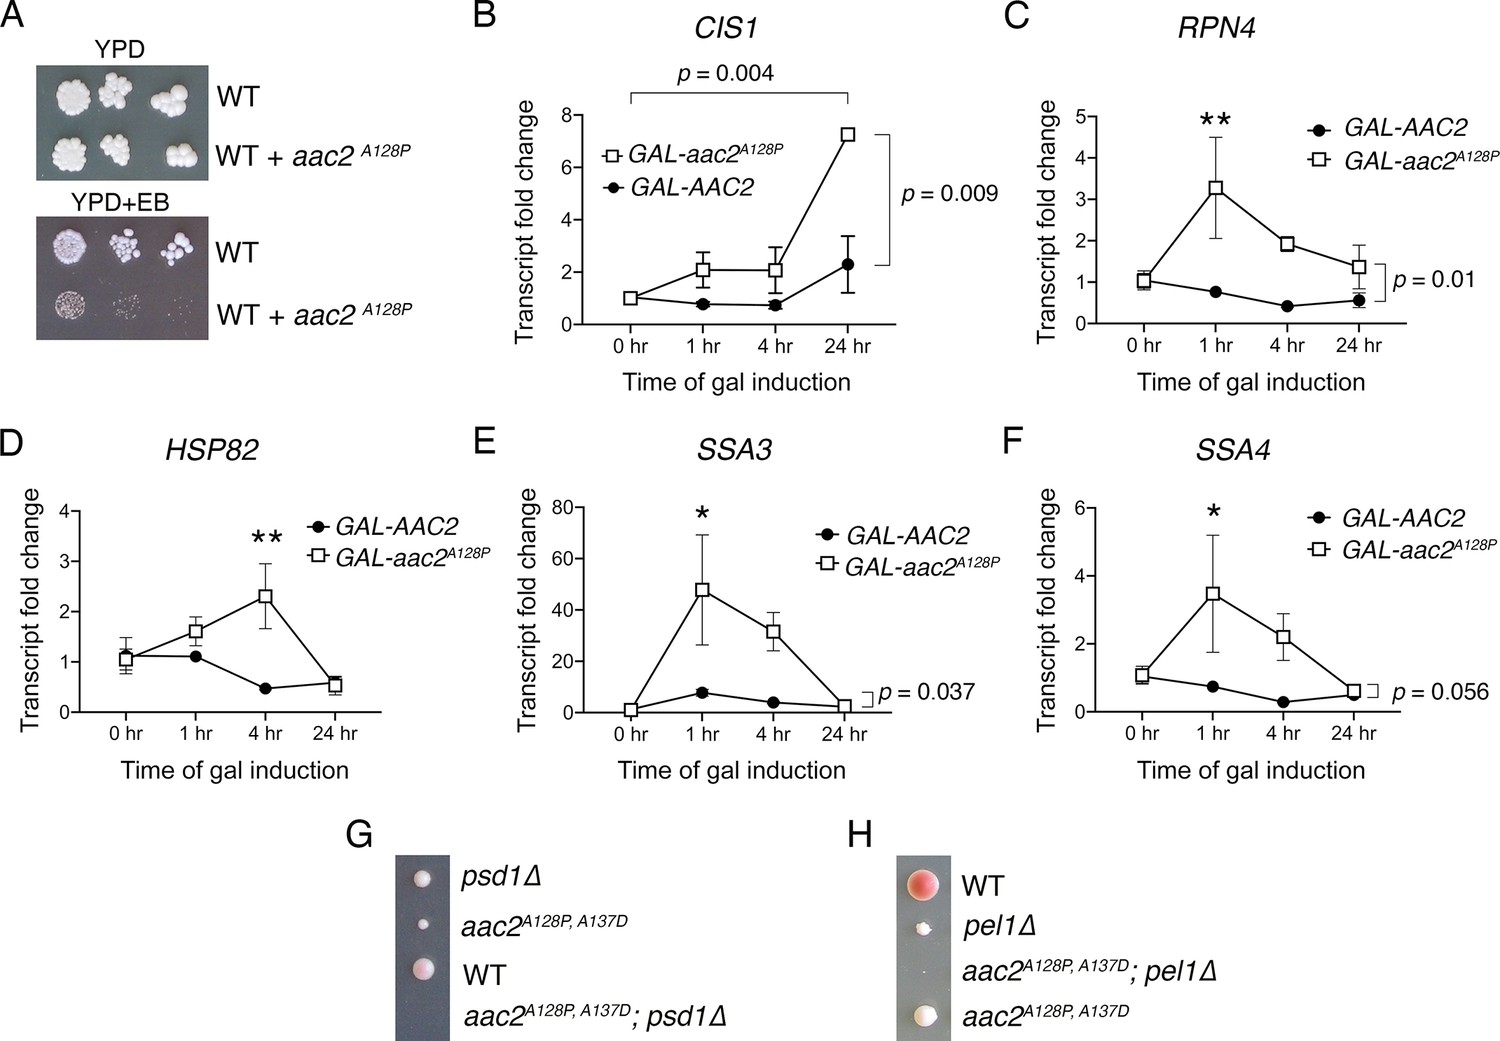
(A) aac2A128P expression is not compatible with elimination of mitochondrial DNA via growth on ethidium bromide (EB) medium in strains with the BY4741/4742 background. Cells were grown at 30°C for 3–4 days. (B–F) qRT-PCR analysis monitoring the expression of CIS1, RPN4, HSP82, SSA3, and SSA4 after galactose-induced expression of AAC2 or aac2A128P from a chromosomal locus. Three biological and two technical replicates were performed for each sample. TFC1 levels used as reference. p-Values calculated with a two-way repeated measures ANOVA followed by Sidak’s multiple comparisons test. Data depicted as mean ± SEM. (G–H) Tetrad analysis demonstrating synthetic lethality between aac2A128P, A137D expression and genetic defects in phospholipid homeostasis in the W303 strain background. Cell were grown on YPD at 30°C for 3–5 days. The aac2A128P, A137D psd1Δ and aac2A128P, A137D pel1Δ cells can germinate but form barely visible microcolonies that can be only detectable under microscope.
Figure 5 with 1 supplement
ANT1A114P and ANT1A114P,A123D clog mitochondrial protein import in human cells.
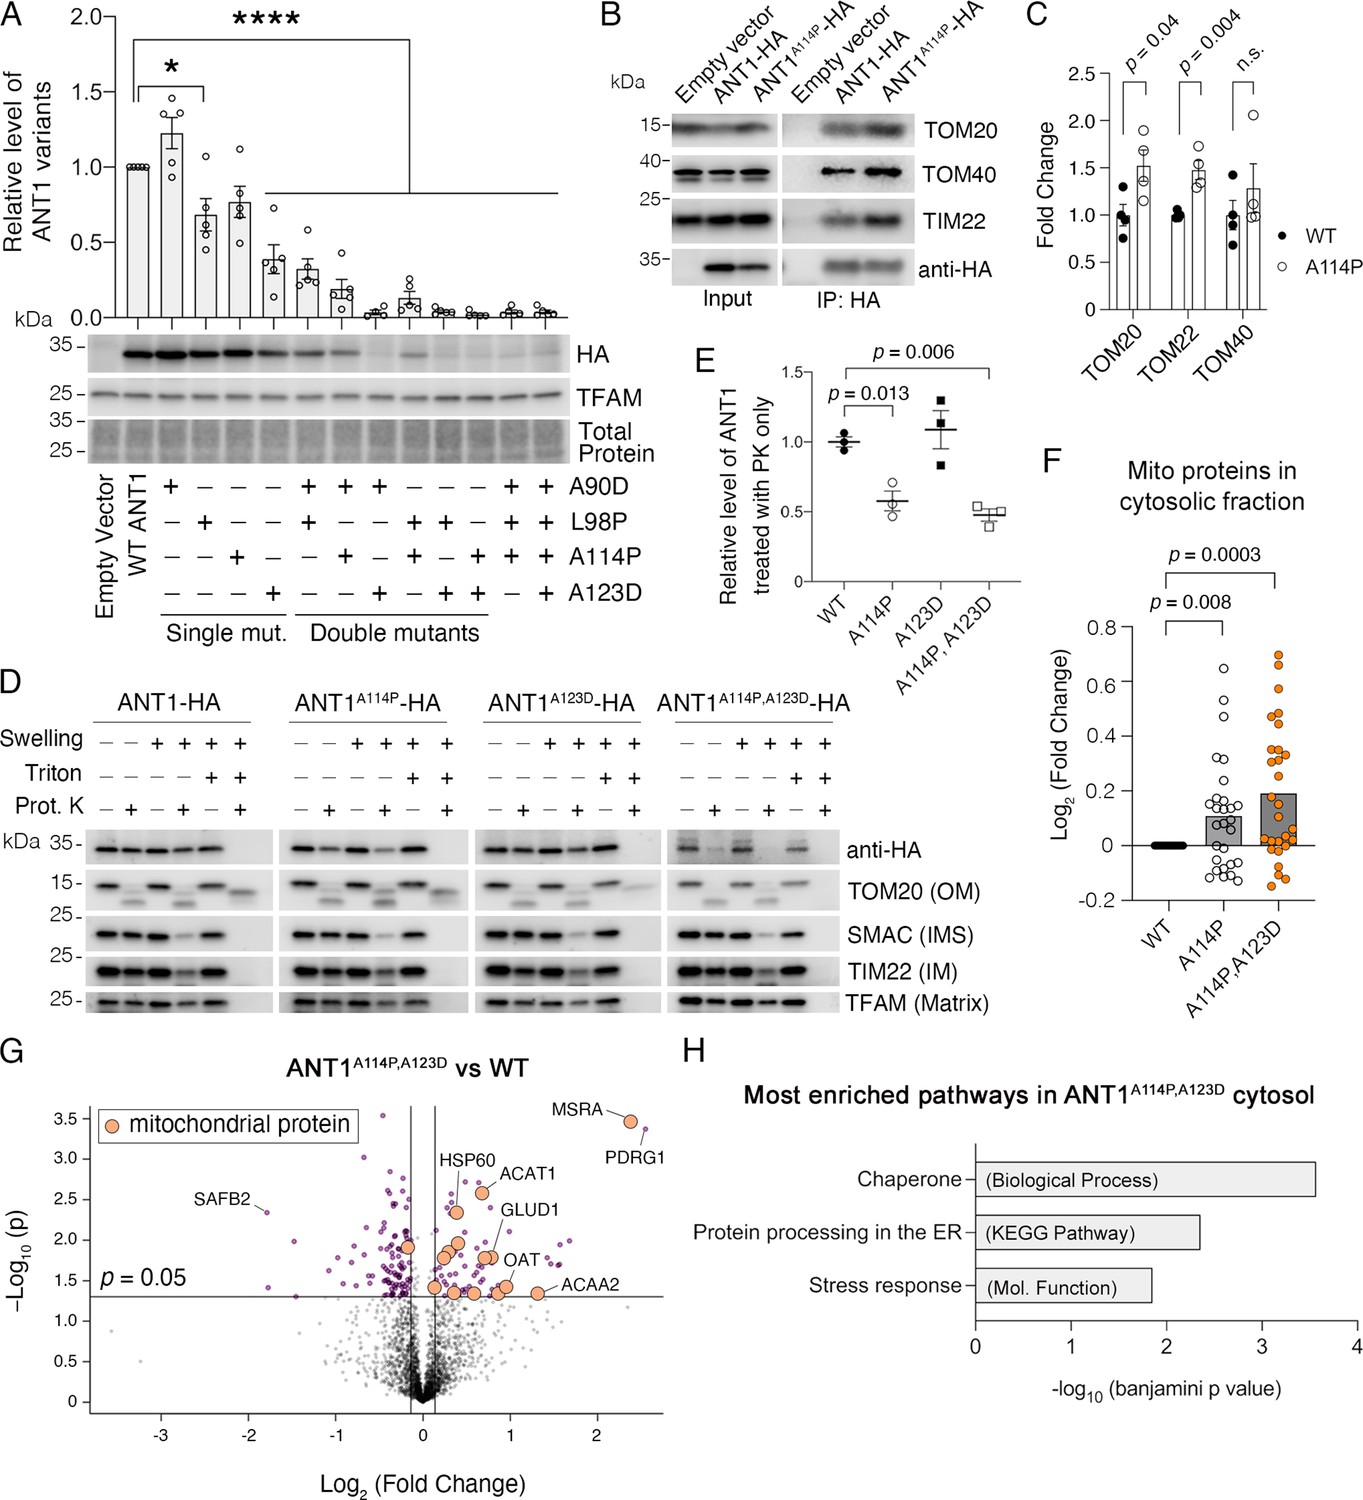
(A) Combining pathogenic mutations in ADP/ATP translocase 1 (ANT1) strongly reduces protein levels, as indicated by immunoblot analysis of ANT1-hemagglutinin (HA) levels 24 hr after transfecting HeLa cells. ANT1 variant levels were normalized by TFAM, then plotted as relative to wild-type level. * indicates p<0.05, ****p<0.0001 from one-way ANOVA with Dunnett’s multiple comparisons test. (B) Immunoprecipitation (IP) of ANT1-HA and ANT1A114P-HA from transiently transfected HeLa cells followed by immunoblot analysis, showing that ANT1A114P has increased interaction with the protein import machinery like its yeast ortholog Aac2pA128P. (C) Quantitation from four independent IP, one of which is depicted in (B). p-Values were calculated with a Student’s t test. (D) Immunoblot analysis following protease protection assay showing that ANT1A114P and ANT1A114P,A123D are sensitive to proteinase K (PK) in isolated mitochondria. Swelling in hypotonic buffer was used to burst the outer membrane, and Triton X-100 was used to disrupt all membranes. OM, outer membrane; IMS, intermembrane space; IM, inner membrane. (E) Quantitation of the wild-type and mutant ANT1 pools that are protected from PK degradation in intact mitochondria. All HA levels were normalized by TFAM, then plotted as relative to its untreated sample. Replicates from three independent transfections. p-Values were calculated with a one-way ANOVA and Holm-Sidak’s multiple comparisons test. (F) ANT1A114P and ANT1A114P,A123D obstruct general mitochondrial protein import. Proteomics of the cytosolic fraction of transfected HeLa cells reveals increase in mitochondrial proteins caused by ANT1A114P-HA and ANT1A114P,A123D-HA expression relative to ANT1-HA. p-Values were calculated with a Student’s t test of the average abundance levels of each mitochondrial protein. (G) Volcano plot comparing the cytosolic proteome of SLC25A4 p.A114P,A123D vs SLC25A4-transfected HeLa cells. Data represented as mean ± SEM. (H) Enrichment analysis of proteins significantly increased in the cytosol of SLC25A4 p.A114P,A123D-transfected HeLa cells. Depicted are the most significant enriched protein groups generated from three different databases: GO: Biological Process (top), KEGG pathway (middle), and GO: Molecular Function (bottom).
-
Figure 5—source data 1
Proteomic comparison of the cytosolic fraction of SLC25A4 p.A114P,A123D- versus SLC25A4-transfected HeLa cells.
- https://cdn.elifesciences.org/articles/84330/elife-84330-fig5-data1-v2.xlsx
-
Figure 5—source data 2
Uncropped Western blots from Figure 5A,B,D.
- https://cdn.elifesciences.org/articles/84330/elife-84330-fig5-data2-v2.zip
Figure 5—figure supplement 1
Mutant ADP/ATP translocase 1 (ANT1) does not reduce Δψ or increase apoptosis in HeLa cells.
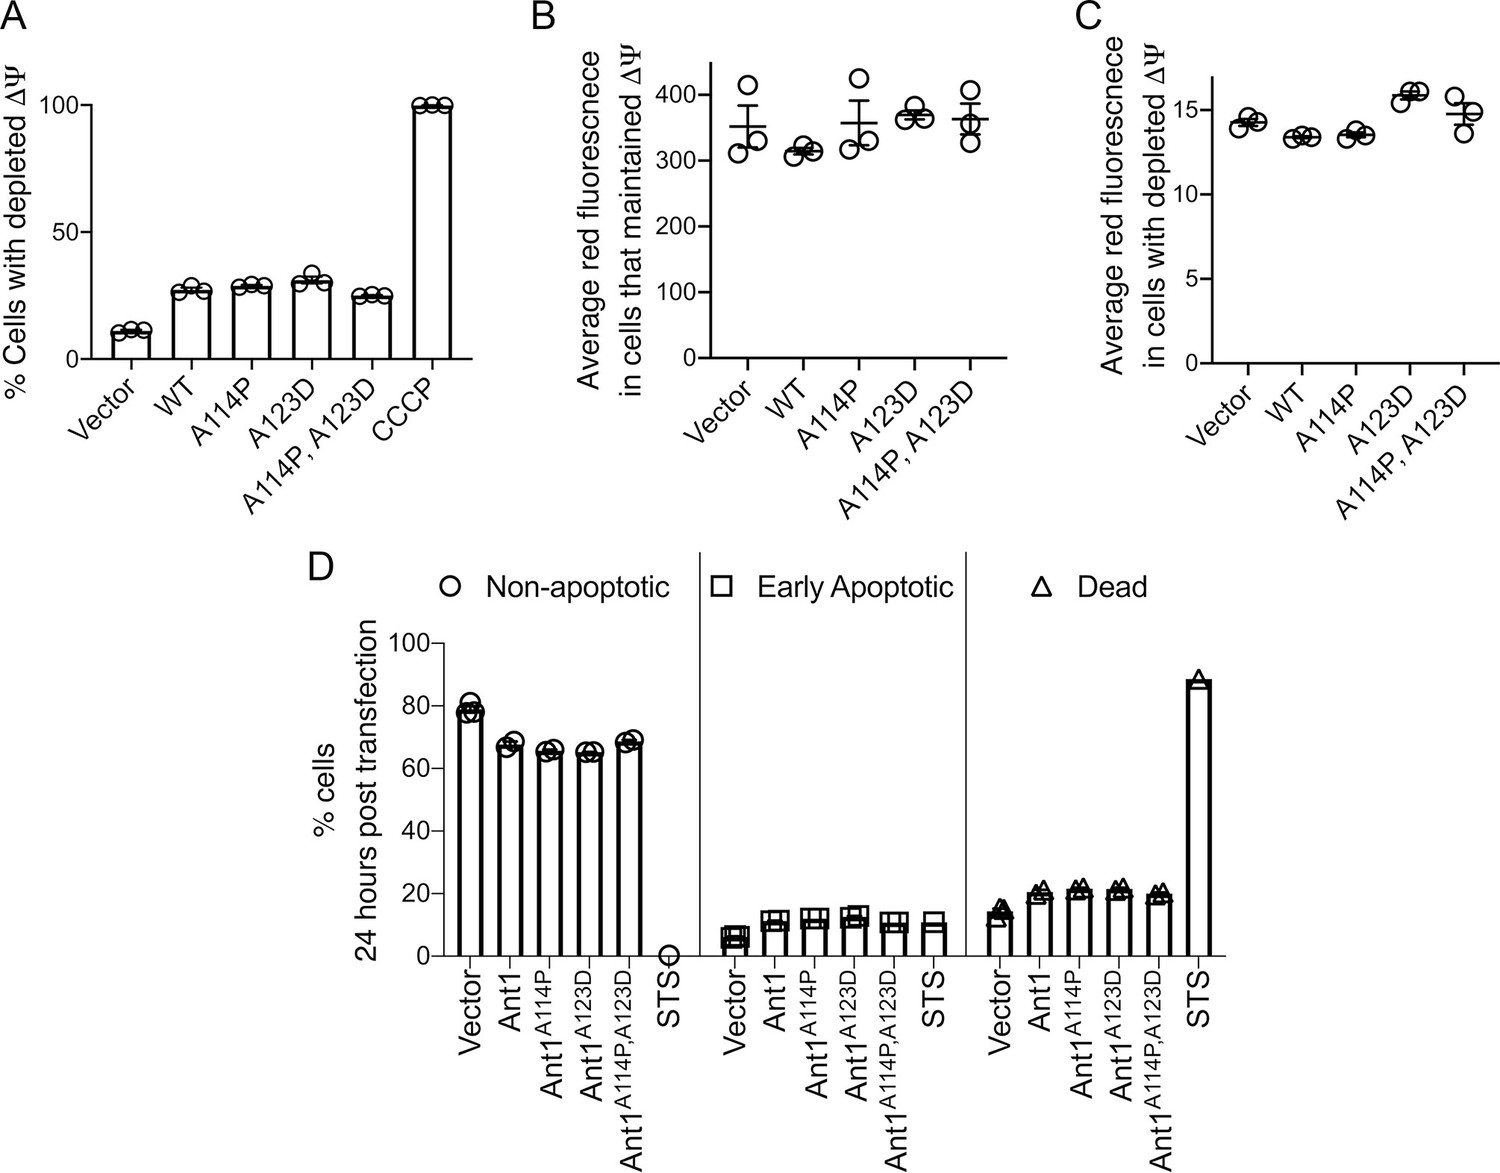
(A) Mutant ANT1 expression does not increase the fraction of cells with depleted Δψ compared with wild-type ANT1, as indicated by flow cytometry analysis after JC-1 dye staining. Cells treated with the ionophore carbonyl cyanide m-chlorophenyl hydrazone (CCCP) served as control for Δψ depletion. (B) Among cells that maintained Δψ, neither wild-type nor mutant SLC25A4 transfection reduced the average red fluorescence after JC-1 staining and flow cytometry analysis. The JC-1 dye fluoresces red when it aggregates at high concentration, that is after its Δψ-dependent uptake by mitochondria. In the monomer form in the cytosol, it fluoresces green. (C) Among cells with depleted Δψ, neither wild-type nor mutant Ant1 reduced the average red fluorescence after JC-1 staining and flow cytometry analysis. (D) Transient expression of wild-type and mutant ANT1 cause similar levels of cell death, as determined by flow cytometry after Annexin V-FITC and propoidium-iodide (PI) staining. Double negative cells are ‘non-apoptotic’, Annexin V-positive PI-negative cells are ‘early apoptotic’ and double positive cells are ‘dead’. Twenty-four hr treatment with 1 μM staurosporine (STS) was used as a positive control. Data represented as mean ± SEM.
Figure 6
Slc25a4 p.A114P,A123D/+ mouse generation and neurodegeneration.
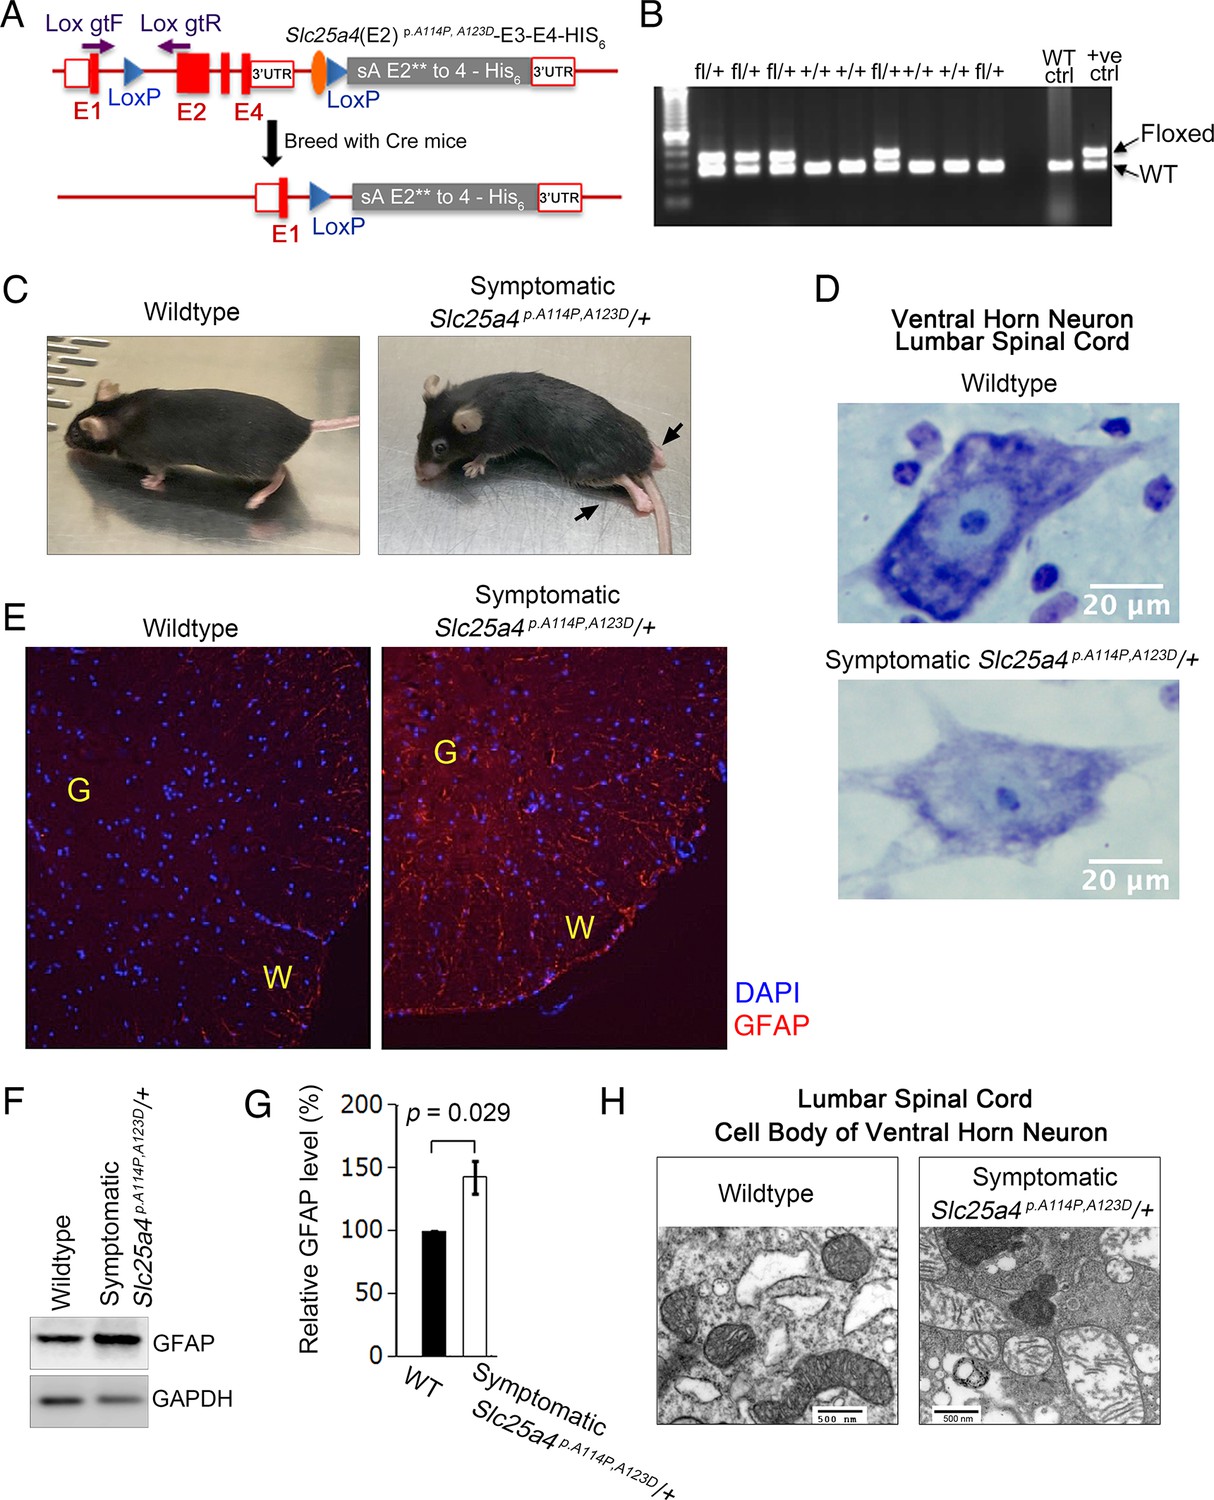
(A) Schematic of the strategy by which the knock-in Slc25a4 p.A114P,A123D/+ knock-in mice were generated. E1–E4, exons 1–4 of Slc25a4. In gray is the inserted cDNA containing two missense mutations in exon 2, followed by the endogenous 3’ UTR. Lox gtF and gtR indicate genotyping primers. (B) Agarose gel electrophoresis of PCR genotyping using genotyping primers indicated in (A). Fl, floxed. (C) Ascending paralytic phenotype of an Slc25a4 p.A114P,A123D/+ mouse at 11 months of age, and its wild-type littermate. Arrows point to paralyzed hindlimbs. (D) Nissl-stained lumbar spinal cord neuron of a symptomatic Slc25a4 p.A114P,A123D/+ mouse and wild-type littermate. This neuron shows loss of Nissl substance and blurring of nuclear boundaries, process known as ‘chromatolysis’, which indicates neuron degeneration. (E) Indirect immunofluorescence for the astrocyte marker glial fibrillary acidic protein (GFAP) indicating spinal cord gliosis in a symptomatic Slc25a4 p.A114P,A123D/+ mouse. G, gray matter; W, white matter. (F) Immunoblot analysis of lumbar spinal cord lysate confirmed increase in GFAP in symptomatic Slc25a4 p.A114P,A123D/+ mice. (G) Quantitation from (F) showing significant increase in GFAP in the spinal cord of a symptomatic Slc25a4 p.A114P,A123D/+ mouse indicating neuroinflammation. p-Value was calculated from Student’s t test. (H) Transmission electron microscopy of a ventral horn neuron of a symptomatic Slc25a4 p.A114P,A123D/+ mouse and wild-type littermate control.
-
Figure 6—source data 1
Uncropped Western blots from Figure 6F.
- https://cdn.elifesciences.org/articles/84330/elife-84330-fig6-data1-v2.zip
Figure 7
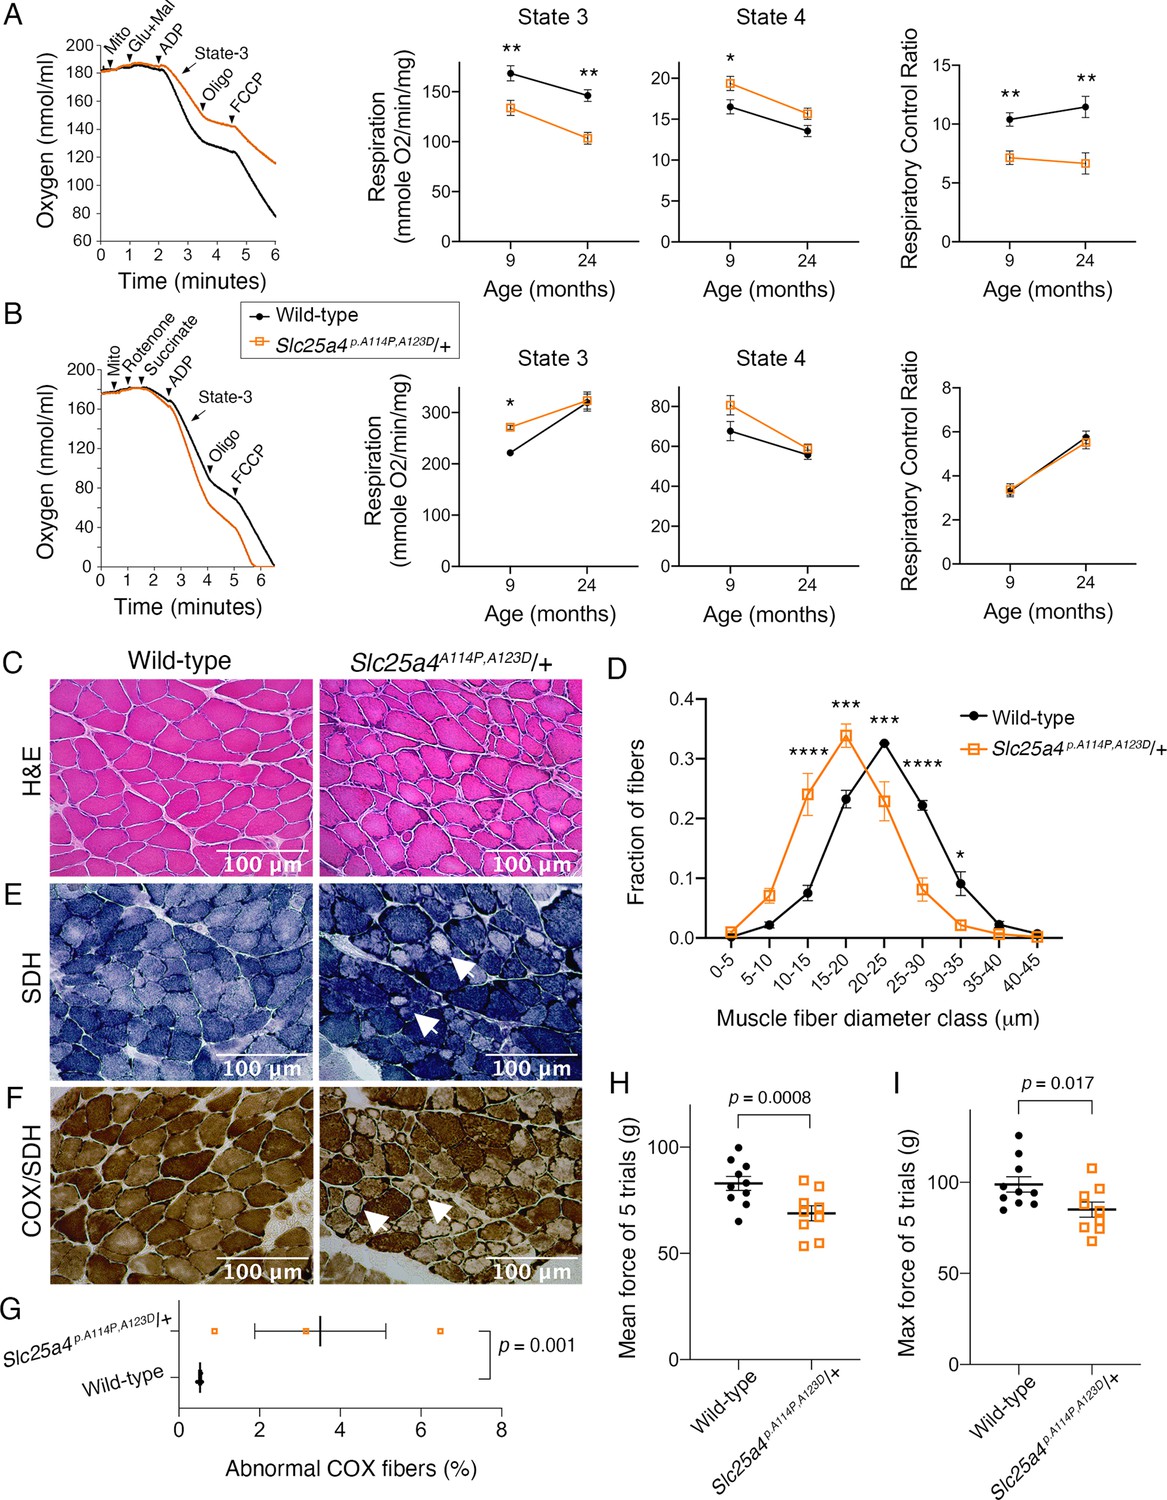
Ant1A114P,A123D (encoded by Slc25a4 p.A114P,A123D) causes a dominant mitochondrial myopathy in mice.
(A) Respirometry of isolated skeletal muscle mitochondria with complex I stimulated by glutamate (glu) and malate (mal). State 3, maximal respiratory rate after addition of ADP; state 4, oligomycin (oligo)-inhibited respiratory rate; respiratory control ratio = state 3/state 4. N=6 mice/genotype at 9 months of age; n=4 mice per genotype at 24 months of age. Three measurements were taken per mouse. p-Values were derived from repeated measures ANOVA with measurement order as the within-subjects variable. Data from two age groups were analyzed independently. FCCP, trifluoromethoxy carbonylcyanide phenylhydrazone. (B) Respirometry of isolated skeletal muscle mitochondria with complex II stimulated by succinate and complex I inhibited by rotenone. N=2 mice/genotype at 9 months of age, 4 measurements/mouse; n=4 mice/genotype at 24 months of age, 3 measurements/mouse. Data analyzed as in (A). (C) Soleus muscles stained with hematoxylin and eosin (H&E) showing smaller myofibers in 30-month-old Slc25a4 p.A114P,A123D/+ mice. (D) Feret’s diameter analysis of H&E stained soleus in (C) reveals atrophy in Slc25a4 p.A114P,A123D/+ mice. At least 340 myofibers were measured per soleus. Myofiber diameters were binned into 5 μm ranges and plotted as % of total. N=3 mice/genotype. Data analyzed by two-way ANOVA with Sidak’s multiple comparisons test. (E) Succinate dehydrogenase (SDH) histochemical activity staining of the soleus showing abnormal fibers that stain for SDH peripherally but are pale internally (arrows). (F) Histochemical cytochrome c oxidase (COX) and SDH sequential staining of the soleus shows abnormal fibers that stain for COX peripherally, but do not stain for COX or SDH internally. (G) Quantitation of abnormal COX fibers shown in (F). p-Value was calculated from Student’s t test. (H) Forelimb grip strength is reduced in 30-month-old Slc25a4 p.A114P,A123D/+ mice. p-Value from Student’s t test. (I) Maximal forelimb grip strength is reduced in 30-month-old Slc25a4 p.A114P,A123D/+ mice. p-Value from Student’s t test. Data represented as mean ± SEM.
Figure 8 with 2 supplements
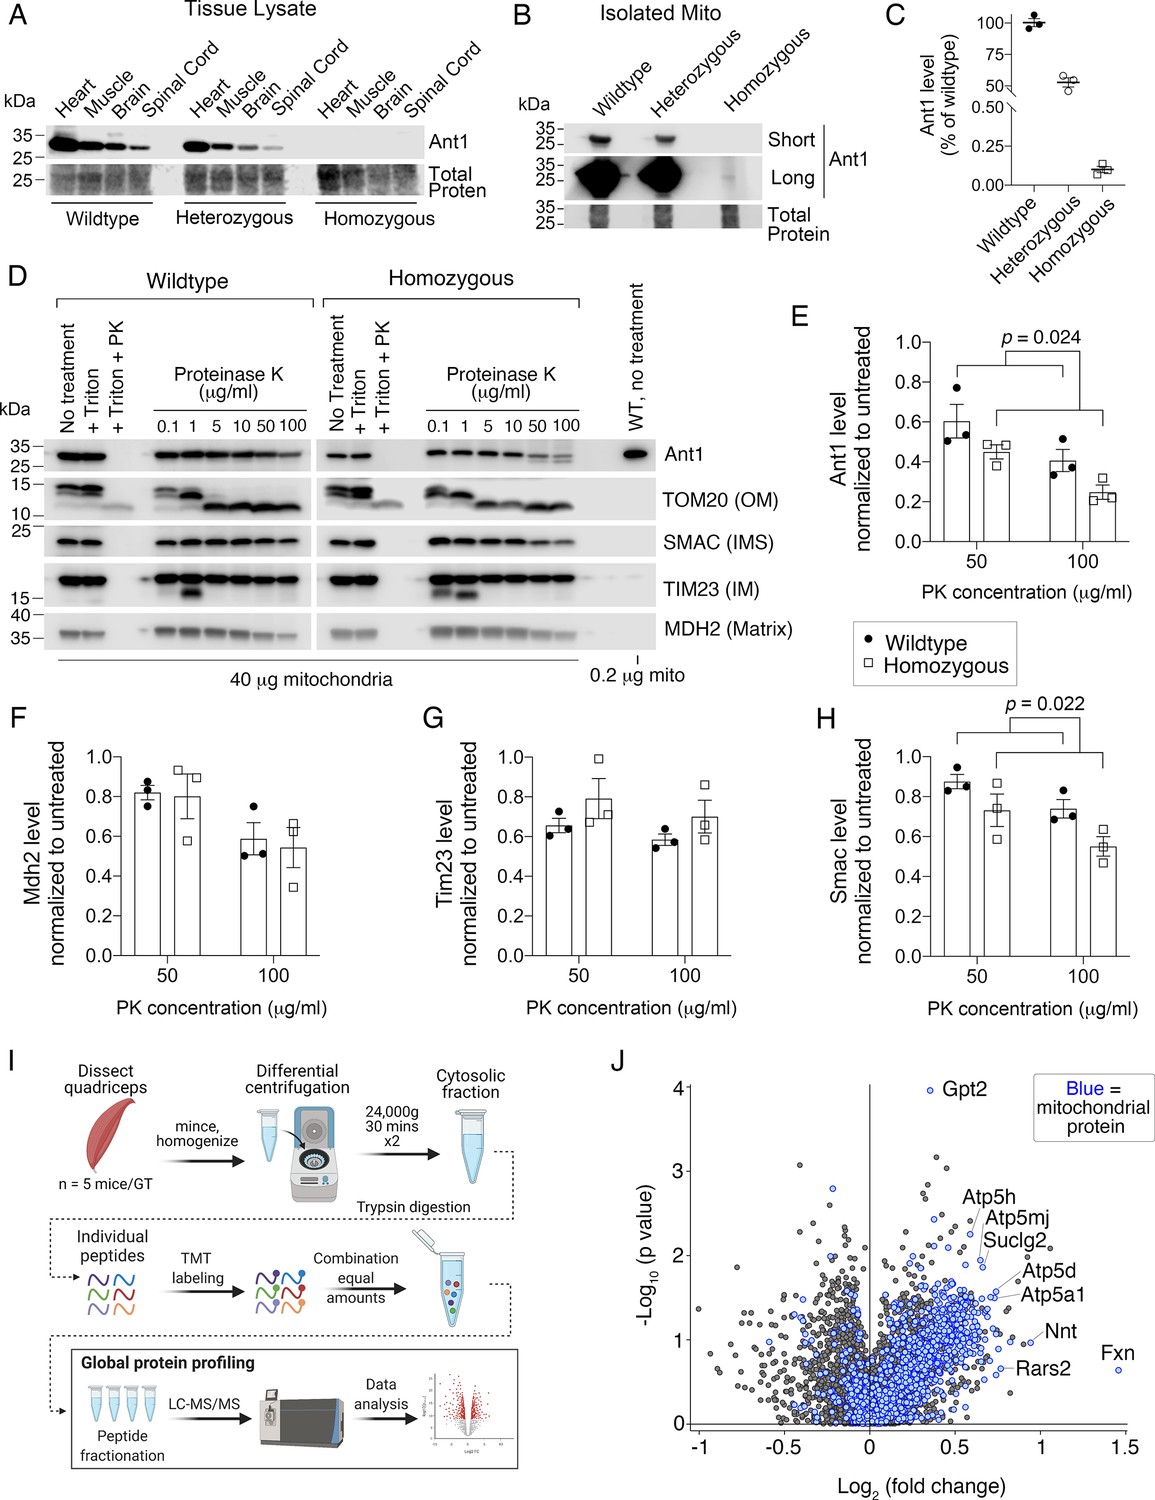
Ant1A114P,A123D clogs protein import in vivo.
(A) Immunoblot analysis of tissue lysate showing low Ant1A114P,A123D protein levels in heterozygous and homozygous mice. (B) Immunoblot analysis of isolated muscle mitochondria demonstrating low Ant1A114P,A123D protein levels. (C) Quantitation of Ant1 levels in isolated muscle mitochondria from three mice per genotype, as determined by immunoblotting. Values were normalized to total protein stain and shown as relative to wild-type. (D) Ant1A114P,A123D is more sensitive to proteinase K (PK) than wild-type Ant1 in intact mitochondria. Immunoblot analysis after PK protection assay of isolated muscle mitochondria in isotonic buffer. Ant1A114P,A123D was detected using SuperSignal West Femto Maximum Sensitivity Substrate (top right panel). (E–H) Quantitation from protease protection assay, as shown in (D). n=3 mice per genotype. p-Values were calculated with a two-way ANOVA, showing significant main effect of genotype. Data represented as mean ± SEM. (I) Schematic of tandem mass tagged (TMT) quantitative proteomic analysis. (J) Volcano plot comparing the cytosolic proteome of Slc25a4 p.A114P,A123D/+ vs wild-type skeletal muscle, with mitochondrial proteins highlighted in blue.
-
Figure 8—source data 1
Proteomic comparison of the cytosolic fraction of 30-month-old skeletal muscle from Slc25a4 p.A114P,A123D/+ versus wild-type mice.
- https://cdn.elifesciences.org/articles/84330/elife-84330-fig8-data1-v2.xlsx
-
Figure 8—source data 2
- https://cdn.elifesciences.org/articles/84330/elife-84330-fig8-data2-v2.zip
Figure 8—figure supplement 1
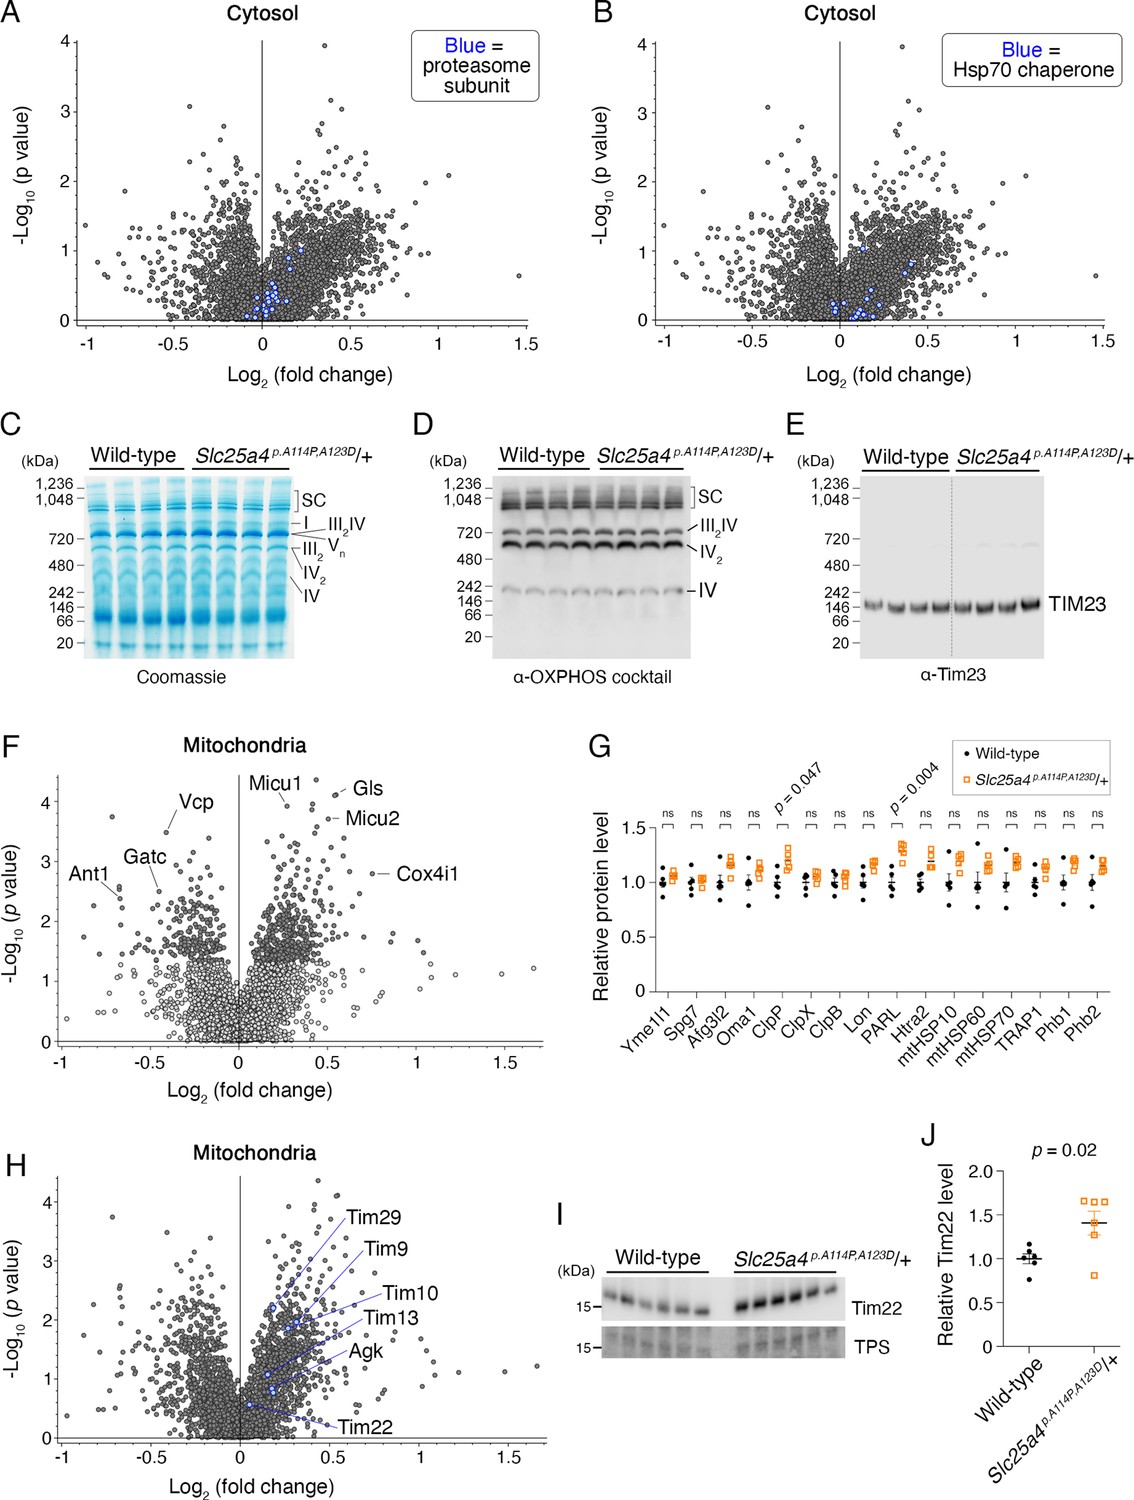
Impact of Ant1A114P,A123D expression on mitochondrial and cytosolic proteostasis.
(A) Volcano plot depicting quantitative proteomics of the cytosolic fraction of skeletal muscle from aged Slc25a4 p.A114P,A123D/+ vs wild-type mice, as in Figure 8J. Blue dots indicate the protein in pfam00227: ‘Proteasome subunit’. (B) Volcano plot as in (A), but blue dots indicate the protein is in pfam00012: ‘HSP70 protein’. (C) Blue native polyacrylamide gel electrophoresis (BN-PAGE) analysis of isolated skeletal muscle mitochondria (n=4 biological replicates per genotype). SC, supercomplex; I-V, respiratory complexes I-V. (D–E) Western blot coupled to BN-PAGE (as in C) using a cocktail of α-OXPHOS antibodies and α-Tim23. (F) Volcano plot depicting tandem mass tagged (TMT)-labeling quantitative proteomics of the mitochondrial fraction of skeletal muscle from aged Slc25a4 p. A114P,A123D/+ vs wild-type mice, showing minimal changes in the steady-state levels of most mitochondrial proteins. (G) Manually curated targeted analysis of mitochondrial proteases and chaperones from proteomic data shown in (F). (H) Volcano plot as in (F), but blue dots indicate the protein is in GO0045039: ‘Protein import into mitochondrial inner membrane’. (I) Immunoblot analysis of skeletal muscle mitochondria (n=6 biological replicates per genotype) probing for Tim22. Notably, these are independent biological replicates from the proteomics dataset. (J) Quantitation from (I). Tim22 levels were normalized to total protein stain and then to the average wild-type level. Data represented as mean ± SEM.
-
Figure 8—figure supplement 1—source data 1
Proteomic comparison of the crude mitochondrial fraction of 30-month-old skeletal muscle from Slc25a4 p.A114P,A123D/+ versus wild-type mice.
- https://cdn.elifesciences.org/articles/84330/elife-84330-fig8-figsupp1-data1-v2.xlsx
-
Figure 8—figure supplement 1—source data 2
Uncropped photos of Coommassie-stained BN-PAGE gel (Figure 8C) and uncropped Western blots (Figure 8D,E,I).
- https://cdn.elifesciences.org/articles/84330/elife-84330-fig8-figsupp1-data2-v2.zip
Figure 8—figure supplement 2
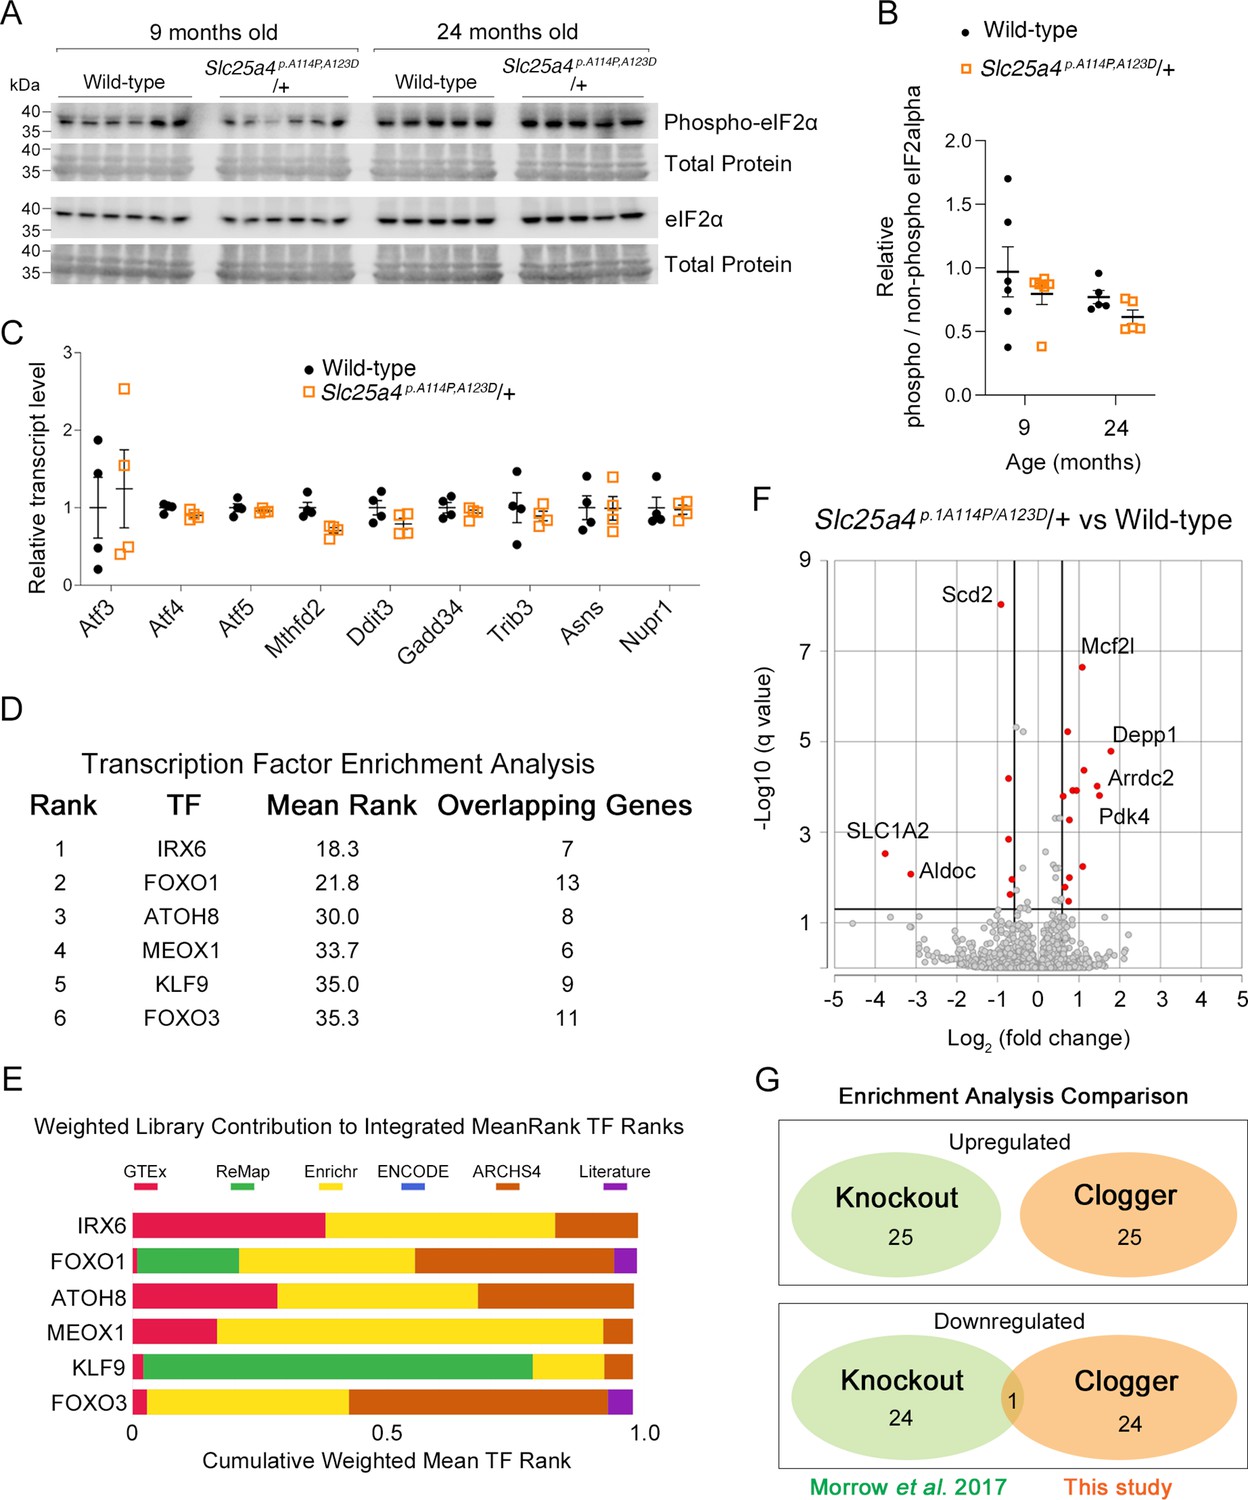
A unique transcriptional response induced by Ant1A114P,A123D in mouse muscle.
(A) Western blot analysis of skeletal muscle lysate probing for eIF2α and phosphorylated form of eIF2αat serine 51. Each lane is an independent biological replicate. (B) Quantitation from (A). Phospho and non-phospho eIF2α levels were first normalized to total protein for loading control, then phospho/non-phospho ratio taken, then all samples normalized to average ratio for 9-month-old wild-type. (C) Targeted analysis mouse skeletal muscle RNAseq (9 months of age) showing minimal changes in genes typically upregulated by the integrated stress response (ISR). Data represented as mean ± SEM. (D) Transcription factor enrichment analysis (TFEA) of significantly upregulated genes (q<0.05) in Slc25a4 p.A114P,A123D/+mice. TF, transcription factor; mean rank, the average rank of the TF among the various libraries seen in (E); overlapping genes are those that are assigned to that TF in each of the libraries. (E) Weighted contribution to Integrated MeanRank TF Ranks shown in (D). (F) Volcano plot showing significantly changed genes (q<0.05) from skeletal muscle RNAseq at 9 months of age. (G) Enrichment analysis comparison between Slc25a4 p.A114P,A123D/+ (‘clogger’) and Slc25a4 -/- (knockout) mice. See Materials and methods for details.
-
Figure 8—figure supplement 2—source data 1
Transcriptomic comparison of skeletal muscle from 9-month-old Slc25a4 p.A114P,A123D/+ versus wild-type mice.
- https://cdn.elifesciences.org/articles/84330/elife-84330-fig8-figsupp2-data1-v2.xlsx
-
Figure 8—figure supplement 2—source data 2
Uncropped Western blots from Figure 8—figure supplement 2A.
- https://cdn.elifesciences.org/articles/84330/elife-84330-fig8-figsupp2-data2-v2.zip
Author response image 1
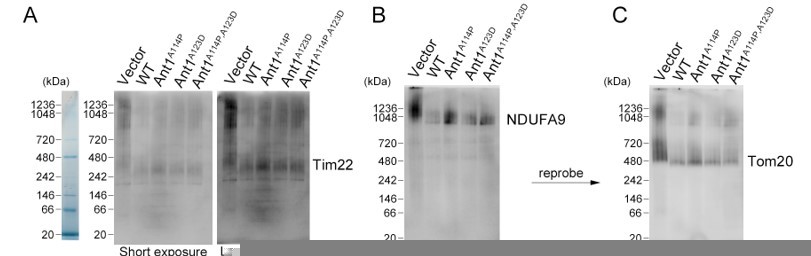
Mutant ANT1 does not drastically affect the assembly state of TIM22 complex, the TOM complex, or respiratory Complex I in HeLa cells.
(A-C) BN-PAGE followed by immunoblot analysis of isolated mitochondria from transfected HeLa cells. Protein ladders deduced from Coommassie-stained gel shown on the left. B and C are depicting the same membrane with sequential blotting. Regarding methods, mitochondrial isolation, BN-PAGE, and subsequent western blotting were performed 24 hours after transfection as previously described (Timon-Gomez et al., 2020) solubilizing the complexes with a 1:2 protein:digitonin ratio.
Videos
Video 1
Paralytic phenotype of an Slc25a4 p.A114P,A123D/+ mouse at the age of 12 months.
Video 2
Paralytic phenotype of an Slc25a4 p.A114P,A123D/+ mouse at the age of 16 months.
Tables
Appendix 1—key resources table
| Reagent type (species) or resource | Designation | Source or reference | Identifiers | Additional information |
|---|---|---|---|---|
| Cell line (Homo sapiens) | HeLa | ATCC | CCL-2 | |
| Antibody | Polyclonal rabbit ant-Aac2 | Chen Lab | 1:3000 | |
| Antibody | Polyclonal rabbit anti-Ilv5 | Chen Lab | 1:5000 | |
| Antibody | Polyclonal rabbit anti-Hsp60 | Chen Lab | 1:10,000 | |
| Antibody | Polyclonal rabbit anti-TFAM | Sigma | Cat. #SAB1401383-100UG | 1:1000 |
| Antibody | Monoclonal mouse anti-hemagglutinin (HA) | Covance | Cat. #MMS-101R | 1:2000 |
| Antibody | Polyclonal rabbit anti-Tim22 (yeast) | Nikoalus Pfanner Lab | 5113 | 1:10,000 |
| Antibody | Polyclonal rabbit anti-Tim23 (yeast) | Ron Butow Lab | 1:5000 | |
| Antibody | Monoclonal rabbit anti-Tom20 (human) | Cell Signaling | Cat. #42406 | 1:2000 |
| Antibody | Monoclonal rabbit anti-Tom40 (human) | Abcam | Cat. #ab185543 | 1:1000 |
| Antibody | Polyclonal rabbit anti-Tim22 (human) | Protein Tech | Cat. #14927–1-AP | 1:2000 |
| Antibody | Monoclonal mouse anti-Tim23 (human) | BD Biosciences | Cat. #611222 | 1:5000 |
| Antibody | Polyclonal rabbit anti-Smac (human) | Abcam | Cat. #ab8114 | 1:2000 |
| Antibody | Polyclonal rabbit anti-Ant1 | Sigma | Cat. #SAB2108761-100UL | 1:2000 |
| Antibody | Monoclonal rabbit anti-Mdh2 (D8Q5S) | Cell Signaling | Cat. #11908 | 1:2000 |
| Antibody | Monoclonal rat anti-GFAP (immunostaining) | Invitrogen | Cat. #13-0300 | 10 μg/mL |
| Antibody | Monoclonal mouse anti-GFAP (western blot) | Chemicon International | Cat. #MAB360 | 1:1000 |
| Antibody | Monoclonal mouse anti-GAPDH | Abcam | Cat. #ab9482 | 1:2000 |
| Antibody | Monoclonal mouse anti-Pgk1 | Invitrogen | Cat. #459250 | 1:4000 |
| Antibody | Polyclonal rabbit anti-Sml1 | Rothstein lab | 1:5000 | |
| Antibody | Polyclonal rabbit ant-eIF2α | Cell Signaling | Cat. #9722 | 1:2000 |
| Antibody | Monoclonal rabbit ant-Phospho-eIF2α | Cell Signaling | Cat. #3597 | 1:1000 |
| Antibody | Monoclonal mouse anti-NDUFA9 | Abcam | Cat. #ab14713 | 1:1000 |
| Antibody | Monoclonal mouse MitoProfile Total OXPHOS Human WB Antibody Cocktail | Abcam | Cat. #ab110411 | 1:500 |
| Chemical compound, drug | L-[35S]-methionine | Perkin Elmer | Cat. #NEG009005MC | |
| Commercial assay or kit | Anti-HA affinity matrix (used for yeast) | Roche | Cat. #11815016001 | |
| Commercial assay or kit | Anti-HA beads (used for HeLa cells) | Thermo Scientific | Cat. #26181 | |
| Commercial assay or kit | Ni-NTA agarose beads | QIAGEN | Cat. #1018244 | |
| Commercial assay or kit | HALT Protease and Phosphatase Inhibitor Cocktail | Thermo Scientific | Cat. #1861284 | |
| Commercial assay or kit | JC-1 | Life Technologies | Cat. #T3168 | |
| Peptide, recombinant protein | Aac2 Peptide 1 | New England Peptide | TATQEGVISFWR | |
| Peptide, recombinant protein | Aac2 Peptide 2 | New England Peptide | SDGVAGLYR | |
| Peptide, recombinant protein | Tim22 Peptide 1 | New England Peptide | VYTGFGLEQISPAQK | |
| Peptide, recombinant protein | Tim22 Peptide 2 | New England Peptide | TVQQISDLPFR | |
| Commercial assay or kit | TNT Quick Coupled Reaction Mix | Promega | Cat. #L2080 | |
| Commercial assay or kit | FITC Annexin V Apoptosis Detection Kit with PI | BioLegend | Cat. #640914 | |
| Commercial assay or kit | Quick-RNA Fungal/Bacterial Microprep Kit | Zymo | Cat. #R2010 | |
| Commercial assay or kit | Power SYBR Green RNA-to-Ct 1-step Kit | Thermo Fisher Scientific | Cat. #4389986 | |
| Commercial assay or kit | Lipofectamine 3000 | Invitrogen | Cat. #L3000-015 | |
| Commercial assay or kit | QuikChange Site-Directed Mutagenesis | Stratagene | Cat. #200518 | |
| Commercial assay or kit | Revert 700 Total Protein Stain | LI-COR | Cat. #926–11021 | |
| Biological sample (Saccharomyces cerevisiae) | W303-1B | R. Rothstein | MATa, ade2, trp1, his3, leu2, ura3 | |
| Biological sample (Saccharomyces cerevisiae) | CS1382-4A | This study | as W303-1B, but trp1Δ::aac2A128P-URA3 | |
| Biological sample (Saccharomyces cerevisiae) | CS1458/1 | This study | as W303-1B, but trp1Δ::aac2A137D-URA3 | |
| Biological sample (Saccharomyces cerevisiae) | CS1763-5A | This study | as W303-1B, but lys2Δ::aac2A128P, A137D-kan | |
| Biological sample (Saccharomyces cerevisiae) | CS341/1 | Chen lab | as W303-1B, but aac2Δ::kan | |
| Biological sample (Saccharomyces cerevisiae) | CY4193 | This study | asW303-1B, but aac2Δ::LEU2, trp1Δ::aac2A128P-URA3 | |
| Biological sample (Saccharomyces cerevisiae) | CS1762/2-8A | This study | as W303-1B, but aac2Δ:kan, lys2Δ::aac2A137D-kan | |
| Biological sample (Saccharomyces cerevisiae) | CS1763-7D | This study | as W303-1B, but aac2Δ:kan, lys2Δ::aac2A128P,A137D-kan | |
| Biological sample (Saccharomyces cerevisiae) | CY6518 | This study | as W303-1B, but ura3::pUC-URA-GAL10-AAC2 | |
| Biological sample (Saccharomyces cerevisiae) | CY6519 | This study | as W303-1B, but ura3::pUC-URA-GAL10-aac2A128P | |
| Biological sample (Saccharomyces cerevisiae) | CY6520 | This study | as W303-1B, but ura3::pUC-URA-GAL10- aac2A137D | |
| Biological sample (Saccharomyces cerevisiae) | CY6521 | This study | as W303-1B, but ura3::pUC-URA-GAL10- aac2A128P, A137D | |
| Biological sample (Saccharomyces cerevisiae) | CY6513 | This study | as W303-1B, but aac2Δ::Kan, lysΔ::aac2A128P, A137D-kan, pdr5Δ::Kan | |
| Biological sample (Saccharomyces cerevisiae) | CY6503 | This study | as W303-1B, but aac2Δ::kan, lys2Δ::aac2A128P, A137D-kan. | |
| Biological sample (Saccharomyces cerevisiae) | CY6510 | This study | as W303-1B, but lys2Δ::aac2A128P, A137D-kan, ump1Δ::kan | |
| Biological sample (Saccharomyces cerevisiae) | CY6511 | This study | as W303-1B, but aac2Δ::kan, lys2Δ::aac2A128P, A137D-kan, pre9Δ::kan | |
| Biological sample (Saccharomyces cerevisiae) | CY6540 | This study | as W303-1B, but aac2Δ::kan, ura3::pUC-URA-GAL10-AAC2 | |
| Biological sample (Saccharomyces cerevisiae) | CY6542 | This study | as W303-1B, but aac2Δ::kan, ura3::pUC-URA-GAL10-aac2A128P | |
| Biological sample (Saccharomyces cerevisiae) | CY6544 | This study | as W303-1B, but aac2Δ::kan, ura3::pUC-URA-GAL10-aac2A137D | |
| Biological sample (Saccharomyces cerevisiae) | CY6546 | This study | as W303-1B, but aac2Δ::kan, ura3::pUC-URA-GAL10-aac2A128P, A137D | |
| Biological sample (Saccharomyces cerevisiae) | CY6558 | This study | as W303-1B, but aac2Δ::kan, yme1Δ::Kan, ura3::pUC-URA-GAL10-aac2A128P, A137D | |
| Biological sample (Saccharomyces cerevisiae) | CY6562 | This study | as W303-1B, but aac2Δ::kan, pdr5Δ::Kan, ura3::pUC-URA-GAL10-aac2A128P, A137D | |
| Biological sample (Saccharomyces cerevisiae) | CY6569 | This study | as W303-1B, but aac2Δ::kan, pdr5Δ::Kan, yme1Δ::LEU2, ura3::pUC-URA-GAL10-aac2A128P, A137D | |
| Biological sample (Saccharomyces cerevisiae) | CY6440 | This study | as W303-1B, but pre9Δ::kan | |
| Biological sample (Saccharomyces cerevisiae) | CY6504 | This study | as W303-1B, but ump1Δ::kan | |
| Biological sample (Saccharomyces cerevisiae) | CY6581 | This study | as W303-1B, but ura3::pUC-URA-GAL10-aac2R96H | |
| Biological sample (Saccharomyces cerevisiae) | CY6583 | This study | as W303-1B, but ura3::pUC-URA-GAL10-aac2R252G | |
| Biological sample (Saccharomyces cerevisiae) | CY6775 | This study | MATa/a, ade2/ade2, trp1/trp1, his3/his3, leu2/leu2, ura3/ura3, psd1∆::kan/+, lys2Δ::aac2A128P, A137D-kan/+ | |
| Biological sample (Saccharomyces cerevisiae) | CY6777 | This study | MATa/a, ade2/ade2, trp1/trp1, his3/his3, leu2/leu2, ura3/ura3, pel1∆::LEU2/+, lys2Δ::aac2A128P, A137D-kan/+ | |
| Biological sample (Saccharomyces cerevisiae) | CY3326 | Chen lab | MATa, his3Δ1, leu2Δ0, lys2Δ0, ura3Δ0, ura3Δ::aac2A128P-URA3 | |
| Biological sample (Saccharomyces cerevisiae) | BY4742/AG3 | Chen lab | MATa, his3Δ1, leu2Δ0, lys2Δ0, ura3Δ0, trp1 Δ::GAL10-AAC2-HIS3 | |
| Biological sample (Saccharomyces cerevisiae) | CY3322 | Chen lab | MATa, his3Δ1, leu2Δ0, lys2Δ0, ura3Δ0, trp1 Δ::GAL10-AAC2A128P-HIS3 | |
| Biological sample (Saccharomyces cerevisiae) | BY4741 | EUROSCARF | MATa, his3∆1, leu2∆0, met15∆0, ura3∆0 | |
| Biological sample (Saccharomyces cerevisiae) | BY4741/ssa4D | Open Biosystems | as BY4741, but ssa4Δ::kan | |
| Biological sample (Saccharomyces cerevisiae) | BY4741/rpn4D | Open Biosystems | as BY4741, but rpn4Δ::kan | |
| Biological sample (Saccharomyces cerevisiae) | BY4741/hsp82D | Open Biosystems | as BY4741, but hsp82Δ::kan | |
| Biological sample (Saccharomyces cerevisiae) | BY4741/ssa3D | Open Biosystems | as BY4741, but ssa3Δ::kan | |
| Biological sample (Saccharomyces cerevisiae) | BY4741/cis1D | Open Biosystems | as BY4741, but cis1Δ::kan | |
| Biological sample (Saccharomyces cerevisiae) | BY4741/TOM40-HA | Ellenrieder et al., 2019 | as BY4741, but tom40::TOM40HA-HIS3MX6 | |
| Biological sample (Saccharomyces cerevisiae) | M2915-6A | Chen lab | MATa, ade2, leu2, ura3 | |
| Biological sample (Saccharomyces cerevisiae) | CY3323 | Chen lab | MATa, ade2, ura3, leu2, ura3Δ::aac2A128P-URA3 | |
| biological sample (Saccharomyces cerevisiae) | YKSL210 | This study | as M2916-6A, but aac2Δ::LEU2, lys2Δ::AAC2-HIS6-kan | |
| Biological sample (Saccharomyces cerevisiae) | YKSL211 | This study | as M2916-6A, but aac2Δ::LEU2, lys2Δ::aac2A128P-HIS6-kan | |
| Biological sample (Saccharomyces cerevisiae) | CY3904 | This study | as M2915-6A, but tom70Δ::kan | |
| biological sample (Saccharomyces cerevisiae) | CY6316 | This study | as M2915-6A, but tim18Δ::Kan | |
| Biological sample (Saccharomyces cerevisiae) | YPH499 | Sikorski and Hieter, 1989 | MATa ura3-52, lys2-801_amber, ade2-101_ochre, trp1-Δ63, his3-Δ200, leu2-Δ1 | |
| Biological sample (Mus musculus) | C57BL6/NTac | Taconic | Cat. #: B6-F | |
| Biological sample (Mus musculus) | Hprt-Cre female | Jackson Labs | Stock no: 004032 | |
| Biological sample (Mus musculus) | Ant1A114P,A123D knock-in mice | This study | See Materials and methods | |
| Sequence-based reagent | TFC1 fwd (B) | Teste et al., 2009 | PCR primers | GCTGGCACTCATATCTTATCGTTTCACAATGG |
| Sequence-based reagent | TFC1 rev (B) | Teste et al., 2009 | PCR primers | GAACCTGCTGTCAATACCGCCTGGAG |
| Sequence-based reagent | HSP82 fwd | Boos et al., 2019 | PCR primers | GCTGCTTTGGCTAAGTTGTTACGTTAC |
| Sequence-based reagent | HSP82 rev | Boos et al., 2019 | PCR primers | GAGATTCACCAGTGATGTAGTAGATGTTC |
| Sequence-based reagent | RPN4 fwd | Boos et al., 2019 | PCR primers | GCAACAAGAGCAACACCAAGAGGAG |
| Sequence-based reagent | RPN4 rev | Boos et al., 2019 | PCR primers | CTGTCCATGTTAGAGTCAACGTAACTG |
| Sequence-based reagent | CIS1 fwd | Boos et al., 2019 | PCR primers | ATCAGTAATTGTCCCATCGGGTTAGTTTC |
| Sequence-based reagent | CIS1 rev | Boos et al., 2019 | PCR primers | CCTGGGCAGCCTTGAGTAAATCATATC |
| Sequence-based reagent | SSA3 fwd (A) | This study | PCR primers | GGATAAGAAAGGCAGGGCTGA |
| Sequence-based reagent | SSA3 rev (A) | This study | PCR primers | CTGCGGTAGCCTTAACCTCAA |
| Sequence-based reagent | SSA4 fwd (B) | This study | PCR primers | AGGCAAGCAACAAAAGATGCC |
| Sequence-based reagent | SSA4 rev (B) | This study | PCR primers | TTGTCCAGCCCATACGCAATA |
| Sequence-based reagent | TOM70P1 | This study | PCR primers | GAAAGAGTTTCATTGCCATTAG |
| Sequence-based reagent | TOM70P2 | This study | PCR primers | TTGTGGTTTATACGCACTGC |
| Sequence-based reagent | TOM70P3 | This study | PCR primers | AACACTGTGCAGGCAACTTC |
| Sequence-based reagent | TOM70P4 | This study | PCR primers | CTCCGCAAATTGGCGAGG |
| Sequence-based reagent | TIM18KOFP | This study | PCR primers | CCATTCTCGCAAAAGATCGG |
| Sequence-based reagent | TIM18KORP | This study | PCR primers | TCTGGATTTCGAGAAGAAGG |
| Sequence-based reagent | TIM18GTFP | This study | PCR primers | GTCAGTGCCCTCGAGAGC |
| Sequence-based reagent | TIM18GTRP | This study | PCR primers | cccaagcttCGCAGATAGTGCGATAGTTG |
| Sequence-based reagent | Lox gtF | This study | PCR primers | ATCCATCTCAAAGGCAAACG |
| Sequence-based reagent | Lox gtR | This study | PCR primers | AAATTCCCTGCAGGCTTATG |
| Recombinant DNA reagent | pRS416 | Chen Lab | ||
| Recombinant DNA reagent | pRS416-AAC2 | This study | See Materials and methods | |
| Recombinant DNA reagent | pRS416-aac2(A106P) | This study | See Materials and methods | |
| Recombinant DNA reagent | pRS416-aac2(M114P) | This study | See Materials and methods | |
| Recombinant DNA reagent | pRS416-aac2(A128P) | This study | See Materials and methods | |
| Recombinant DNA reagent | pRS416-aac2(A137D) | This study | See Materials and methods | |
| Recombinant DNA reagent | pRS416-aac2(A106D,M114P) | This study | See Materials and methods | |
| Recombinant DNA reagent | pRS416-aac2(A106D,A128P) | This study | See Materials and methods | |
| Recombinant DNA reagent | pRS416-aac2(A106D,A137D) | This study | See Materials and methods | |
| Recombinant DNA reagent | pRS416-aac2(M114P,A128P) | This study | See Materials and methods | |
| Recombinant DNA reagent | pRS416-aac2(M114P,A137D) | This study | See Materials and methods | |
| Recombinant DNA reagent | pRS416-aac2(A128P,A137D) | This study | See Materials and methods | |
| Recombinant DNA reagent | pCDNA3.1 | This study | See Materials and methods | |
| Recombinant DNA reagent | pCDNA3.1-Ant1 | This study | See Materials and methods | |
| Recombinant DNA reagent | pCDNA3.1-Ant1(A90D) | This study | See Materials and methods | |
| Recombinant DNA reagent | pCDNA3.1-Ant1(L98P) | This study | See Materials and methods | |
| Recombinant DNA reagent | pCDNA3.1-Ant1(A114P) | This study | See Materials and methods | |
| Recombinant DNA reagent | pCDNA3.1-Ant1(A123D) | This study | See Materials and methods | |
| Recombinant DNA reagent | pCDNA3.1-Ant1(A90D,L98P) | This study | See Materials and methods | |
| Recombinant DNA reagent | pCDNA3.1-Ant1(A90D,A114P) | This study | See Materials and methods | |
| Recombinant DNA reagent | pCDNA3.1-Ant1(A90D,A123D) | This study | See Materials and methods | |
| Recombinant DNA reagent | pCDNA3.1-Ant1(L98P,A114P) | This study | See Materials and methods | |
| Recombinant DNA reagent | pCDNA3.1-Ant1(L98P,A123D) | This study | See Materials and methods | |
| Recombinant DNA reagent | pCDNA3.1-Ant1(A114P,A123D) | This study | See Materials and methods | |
| Recombinant DNA reagent | pCDNA3.1-Ant1(A90D,A114P,A123D) | This study | See Materials and methods | |
| Recombinant DNA reagent | pCDNA3.1-Ant1(A90D,L98P,A114P,A123D) | This study | See Materials and methods | |
| Recombinant DNA reagent | pGEM-4Z-AAC2 (Saccharomyces cerevisiae) | This study | See Materials and methods | |
| Recombinant DNA reagent | pGEM-4Z-aac2(A128P) | This study | See Materials and methods | |
| Recombinant DNA reagent | pGEM-4Z-aac2(A137D) | This study | See Materials and methods | |
| Recombinant DNA reagent | pGEM-4Z-aac2(A128P,A137D) | This study | See Materials and methods | |
| Software, algorithm | ImageJ | NIH | ||
| Software, algorithm | Multi Gauge v.3.2 | FujiFilm | ||
| Software, algorithm | Image Studio | LI-COR | ||
| Software, algorithm | Prism version 9 | GraphPad, LLC | ||
| Software, algorithm | Proteome Discoverer version 2.4 | Fisher | ||
| Software, algorithm | Metaboanalyst | Pang et al., 2020 | ||
| Software, algorithm | STRING version 11.0 | Szklarczyk et al., 2019 | ||
| Software, algorithm | Skyline version 20.2 | MacCoss Lab Software | ||
| Software, algorithm | CFX Maestro software | Bio-Rad | ||
| Software, algorithm | BioCIS | BIOSEB | ||
| Other | Grip Strength Test Model GT3 | BIOSEB | Force meter that measures mouse grip strength. | |
| Other | Oxygraph Plus System Version 2.1 | Hansatech Instruments | Apparatus with Clark-type electrode to measure oxygen tension for oxygen consumption measurements from isolated mitochondria. | |
| Commercial assay or kit | Clontech Labs 3P TaKaRa LA Taq DNA Polymerase | Fisher Scientific | Cat. #50-443-973 |
Additional files
Download links
A two-part list of links to download the article, or parts of the article, in various formats.
Downloads (link to download the article as PDF)
Open citations (links to open the citations from this article in various online reference manager services)
Cite this article (links to download the citations from this article in formats compatible with various reference manager tools)
Mitochondrial protein import clogging as a mechanism of disease
eLife 12:e84330.
https://doi.org/10.7554/eLife.84330


