The photosystem I supercomplex from a primordial green alga Ostreococcus tauri harbors three light-harvesting complex trimers
- Division of Environmental Photobiology, National Institute for Basic Biology, Japan
- National Laboratory of Biomacromolecules, CAS Center for Excellence in Biomacromolecules, Institute of Biophysics, Chinese Academy of Sciences, China
- College of Life Sciences, University of Chinese Academy of Sciences, China
- Department of Basic Biology, School of Life Science, the Graduate University for Advanced Studies, Japan
- National Institute for Physiological Sciences, National Institutes of Natural Sciences, Japan
- Exploratory Research Center on Life and Living Systems (ExCELLS), National Institutes of Natural Sciences, Japan
Figures
Figure 1 with 4 supplements

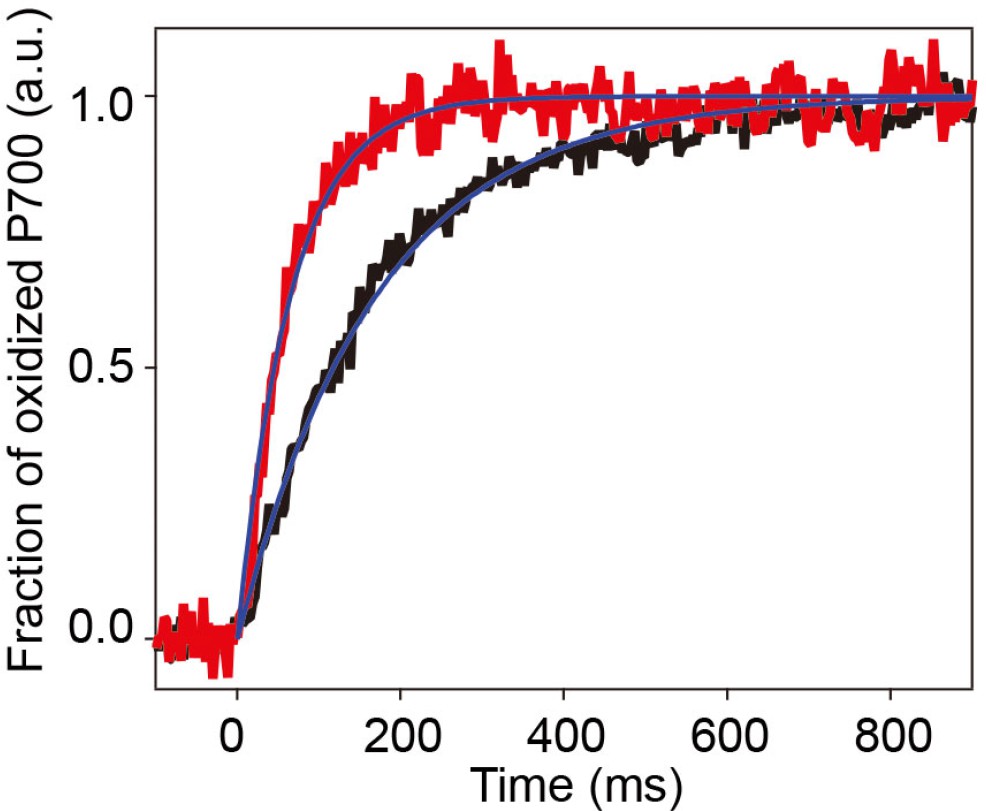
Characterization of A3 and A3L fractions.
(a) Sucrose density gradient showing four major bands corresponding to free LHCs (A1), PSI-LHCI supercomplex (A3), PSI-LHCI-Lhcp supercomplex and PSII-Lhcp supercomplex (A3L), and other complexes (A4). (b) 77 K steady-state fluorescence spectrum of PSI-LHCI (solid line) and PSI-LHCI-Lhcp (dotted line). (c) PSI light-harvesting capabilities in the A3 and A3L fractions. Light-induced P700 oxidation kinetics of PSI were measured in A3 and A3L fractions under 28 µmol photon m–2 s–1. The fraction of P700 oxidation was derived from Δ(A820-A870). Solid lines and shaded area represent averages of five (for A3) or ten (for A3L) technical replicates and SD, respectively. Blue lines represent fitting curves by mono-exponential functions. Data are representative of two biologically independent experiments. See another set of data in Figure 1—figure supplement 3.
-
Figure 1—source data 1
Quantitative data for Figure 1c.
- https://cdn.elifesciences.org/articles/84488/elife-84488-fig1-data1-v2.zip
Figure 1—figure supplement 1
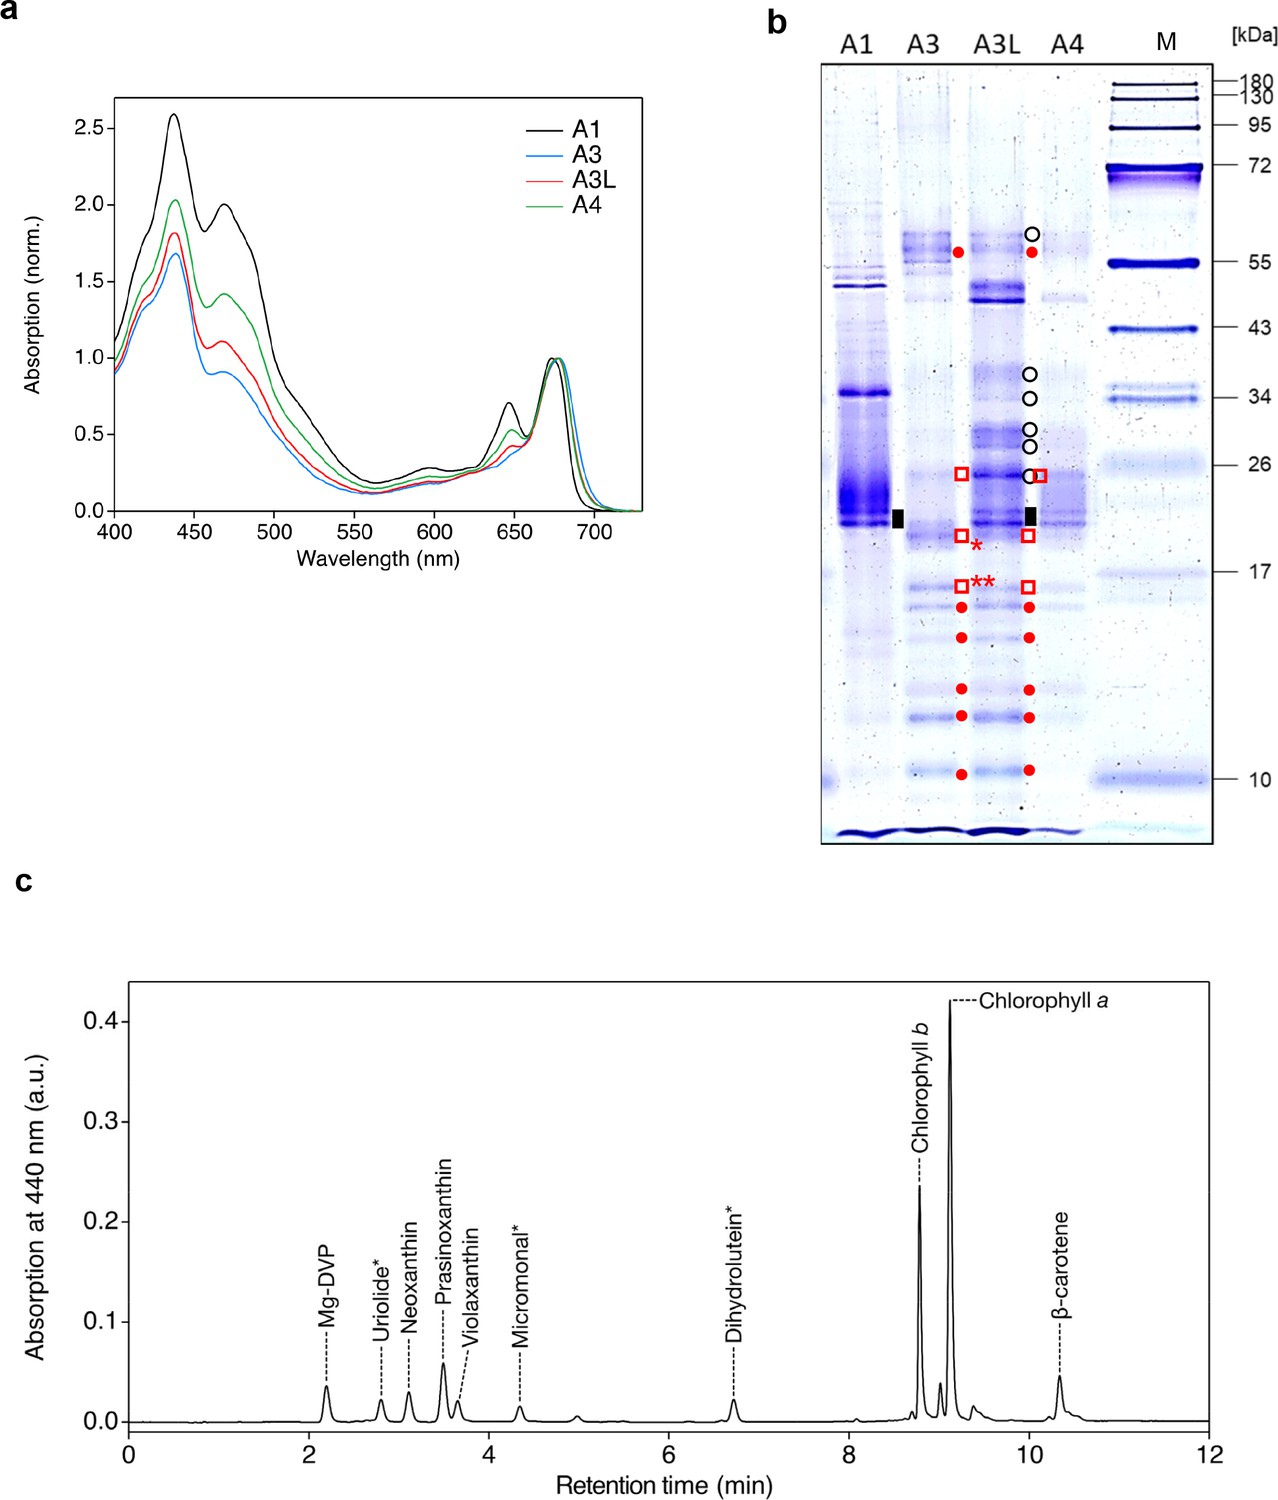
Fractionation and characterization of the supercomplex samples from the O. tauri cells grown in the low light (50 µmol photon m–2 s–1).
(a) UV-VIS absorption spectra. Each fraction (3 μg Chl mL–1) was measured at room temperature at least three times and the representative spectra are shown. (b) SDS-PAGE analysis of each fraction (1 μg Chl mL–1) stained with Coomassie Brilliant Blue R-250. M, molecular weight marker. Red dots, PSI subunits; black open circles, PSII subunits; black rectangles, Lhcps; red squares, Lhcas; red square with *, band 1; red square with **, band 2. Polypeptides detected in bands 1 and 2 are listed in Supplementary file 1b. The experiment was repeated three times independently with similar results. (c) Pigment analysis of the A3L fraction by UPLC. The chromatogram was recorded at 440 nm. Each peak was identified by using a corresponding standard or based on absorption spectrum measured by a photo-diode array equipped in the UPLC system. Asterisks indicate the pigments identified by absorption spectra.
-
Figure 1—figure supplement 1—source data 1
Raw data for Figure 1—figure supplement 1.
- https://cdn.elifesciences.org/articles/84488/elife-84488-fig1-figsupp1-data1-v2.zip
Figure 1—figure supplement 2
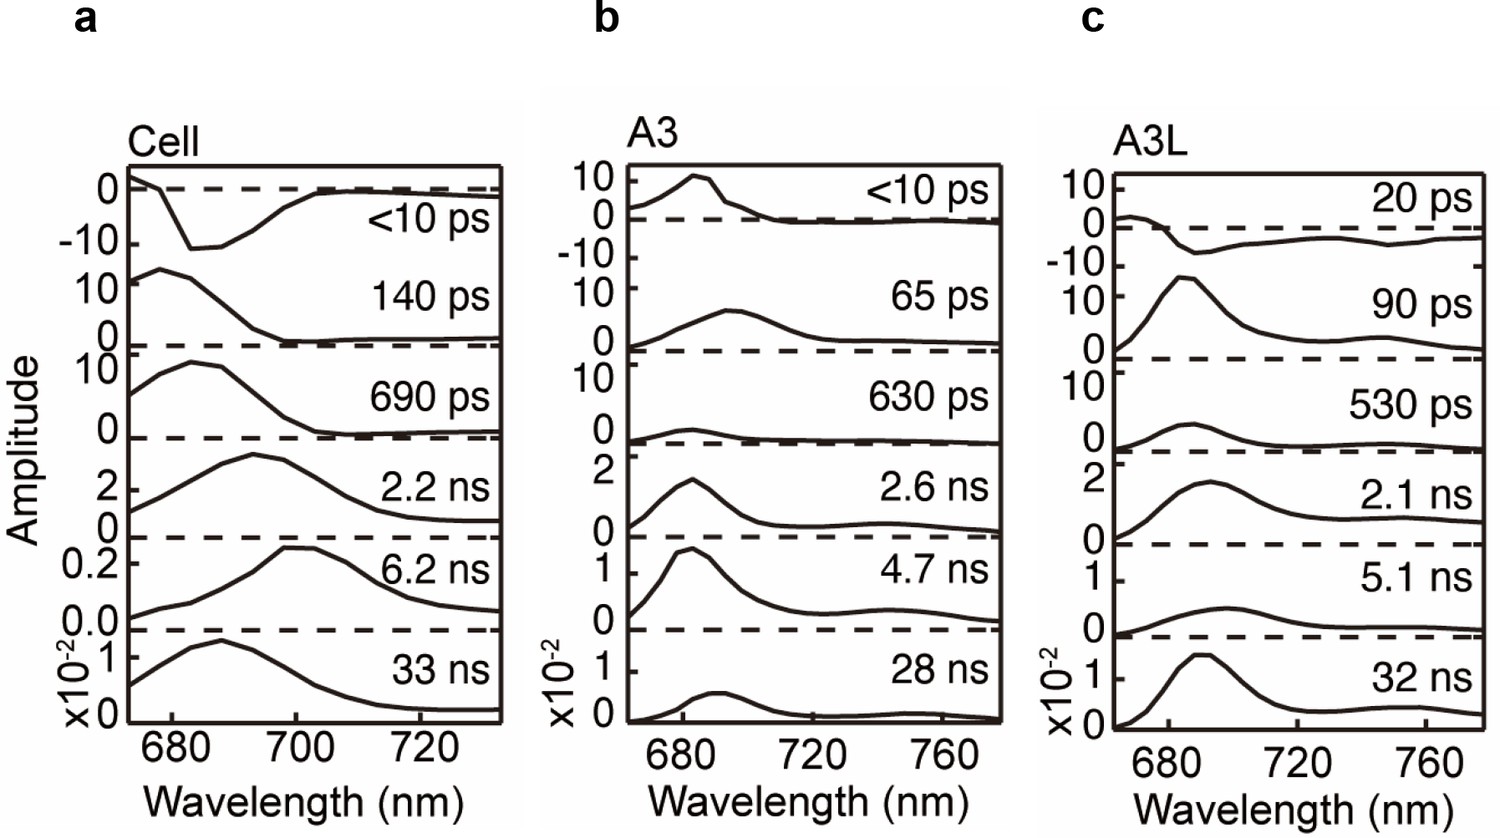
Fluorescence decay-associated spectra (FDAS) at 77 K (e.g., 405 nm, 4 µg Chl mL–1).
(a) Cell. (b) A3 fraction. (c) A3L fraction. Fluorescence decay kinetics were fitted to a sum of exponentials with the time constants linked in a global analysis. The normalized amplitudes of FDAS are plotted against wavelength for each time constants (lifetime component).
Figure 1—figure supplement 3
Photosystem I (PSI) light-harvesting capabilities in the A3 and A3L fractions.
All conditions were the same as in Figure 1c.
-
Figure 1—figure supplement 3—source data 1
Quantitative data for Figure 1—figure supplement 3.
- https://cdn.elifesciences.org/articles/84488/elife-84488-fig1-figsupp3-data1-v2.zip
Figure 1—figure supplement 4
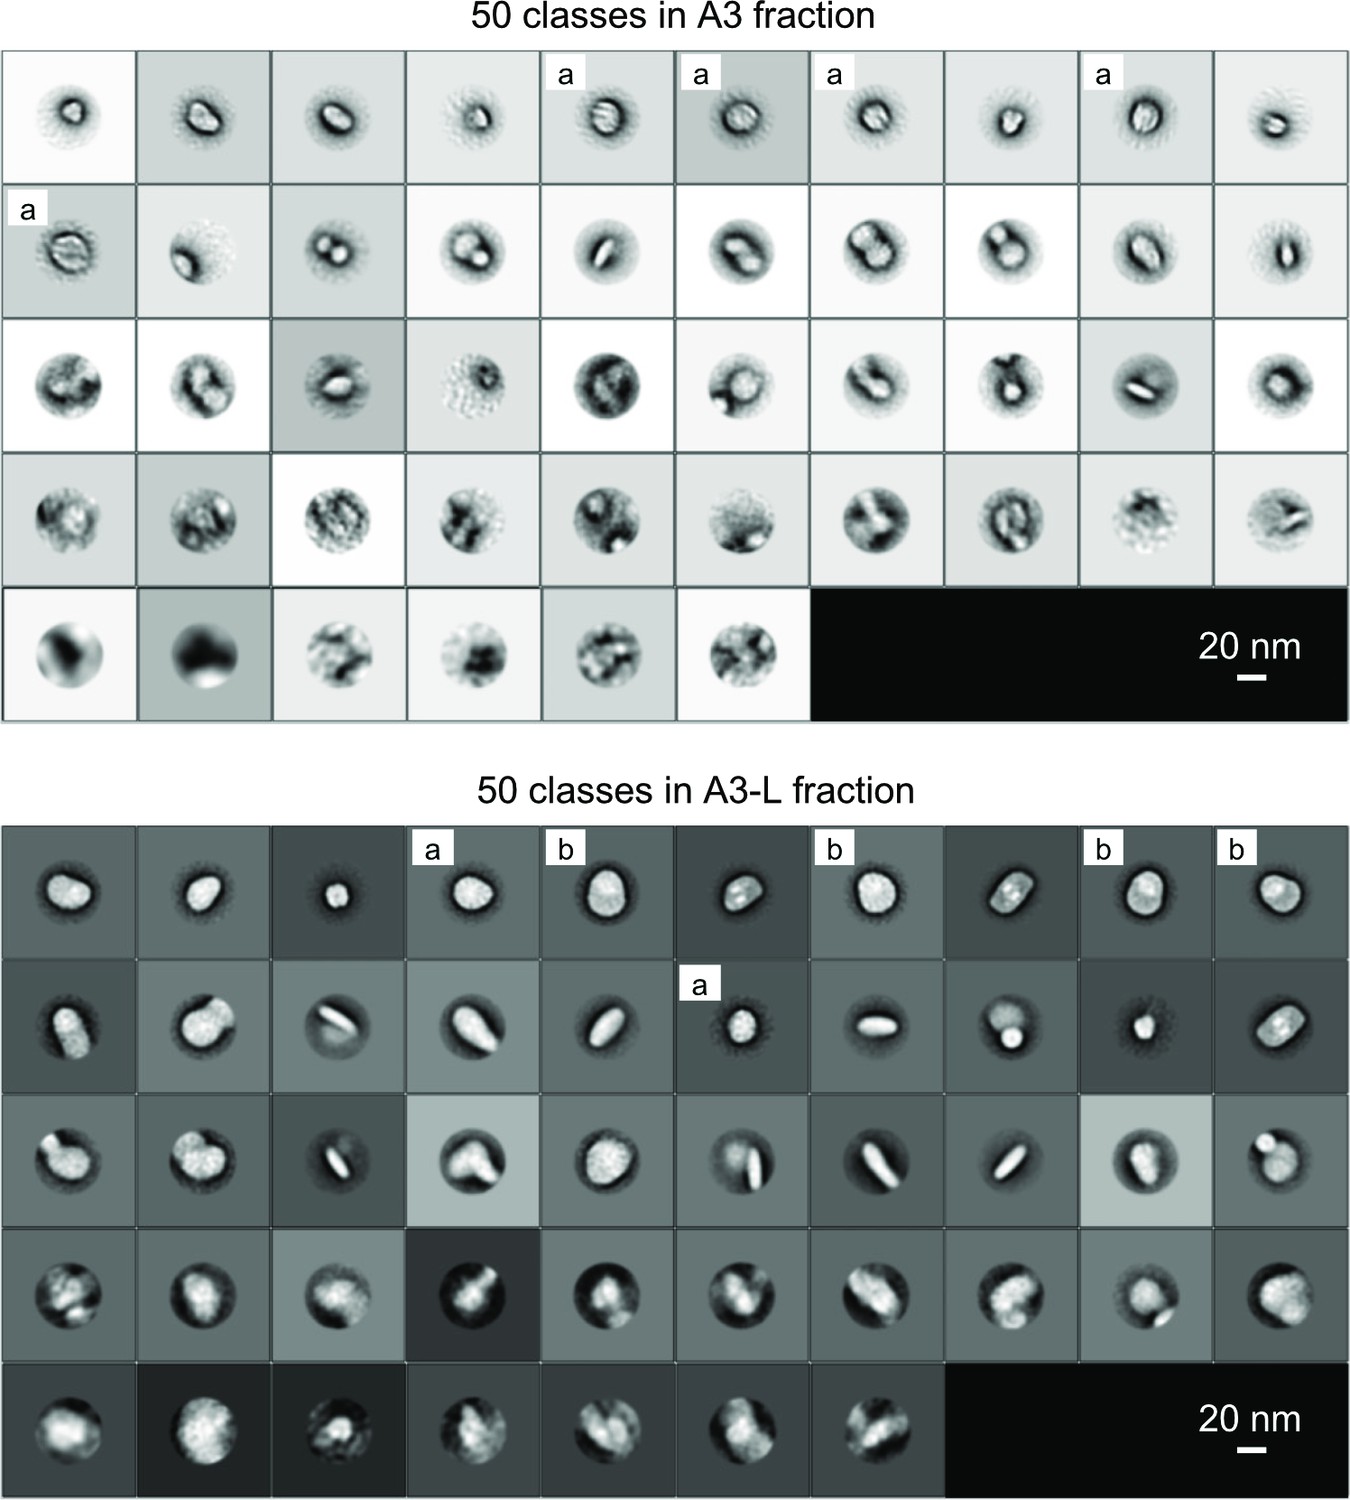
Structural analysis of A3 and A3L fractions by negative staining EM.
The particles in the A3 and A3L were negatively stained with uranyl acetate and the projection images of EM single particles were 2D classified (Table 2). While most of the photosystem I (PSI) in A3 was smaller supercomplex, 70% of the PSI in A3L were larger supercomplex. Two-dimensional classification results of the particles from the A3 and A3L fractions are shown. 9068 particles from the A3 fraction and 10331 particles from A3L were classified into 50 classes. (a) and (b) labels represent classes categorized into small PSI, large PSI, respectively.
Figure 2 with 3 supplements
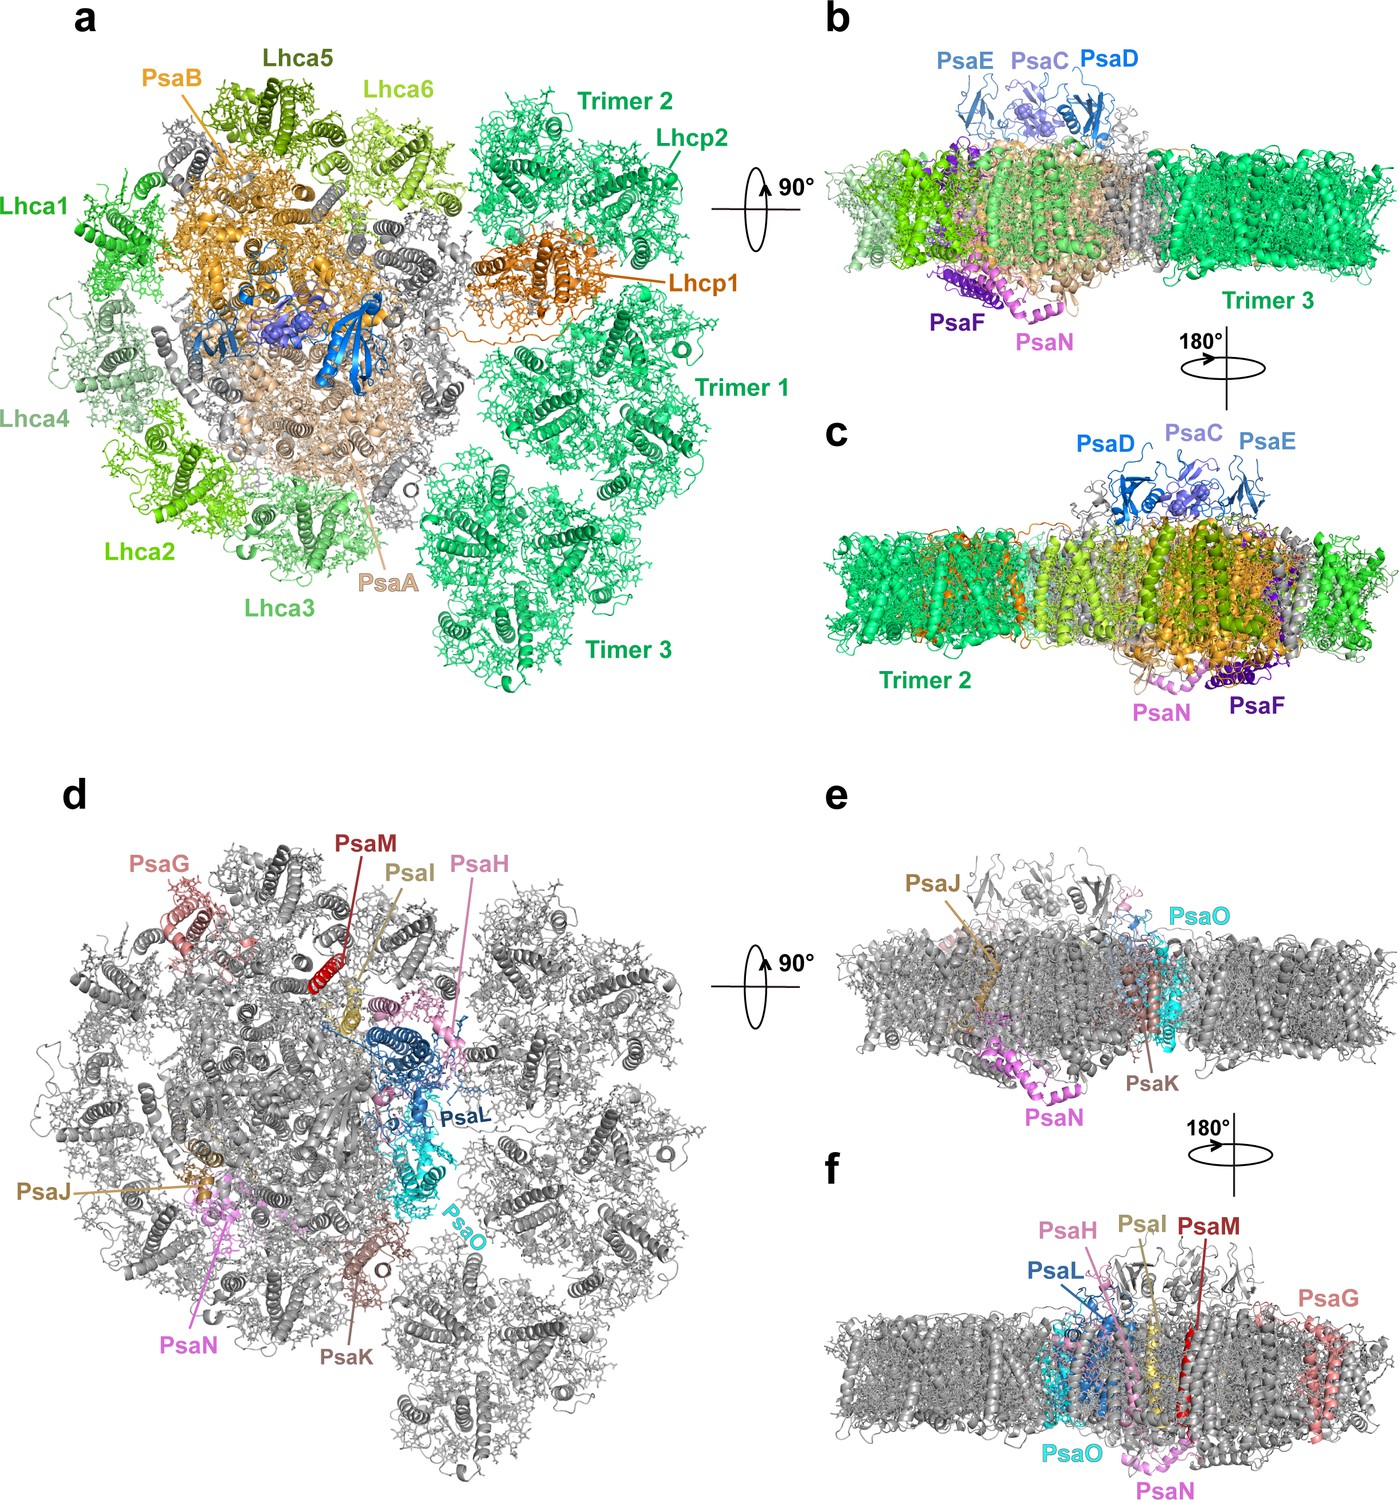
Overall architecture of OtPSI-LHCI-Lhcp supercomplex.
(a) Top view of the supercomplex from stromal side along membrane normal. (b) and (c) Two different side views of the supercomplex along the membrane plane. While the protein backbones are shown as cartoon models, the pigment and lipid molecules are presented as stick models. The iron-sulfur clusters are presented as sphere models. The bulk region of photosystem I (PSI) core is colored in wheat, while Lhca1-6, Lhcp1, and Lhcp2, PsaC, PsaD, PsaE, PsaF, and PsaN are highlighted in different colors. The remaining small subunits are in silver. (d–f) The small subunits at the interfaces between PSI core and LHCI/Lhcp complexes. The viewing angles are the same as (a–c), whereas the color codes are different. The interfacial small subunits are highlighted in various colors, while the PSI core and LHCI/Lhcp complexes are in silver.
Figure 2—figure supplement 1
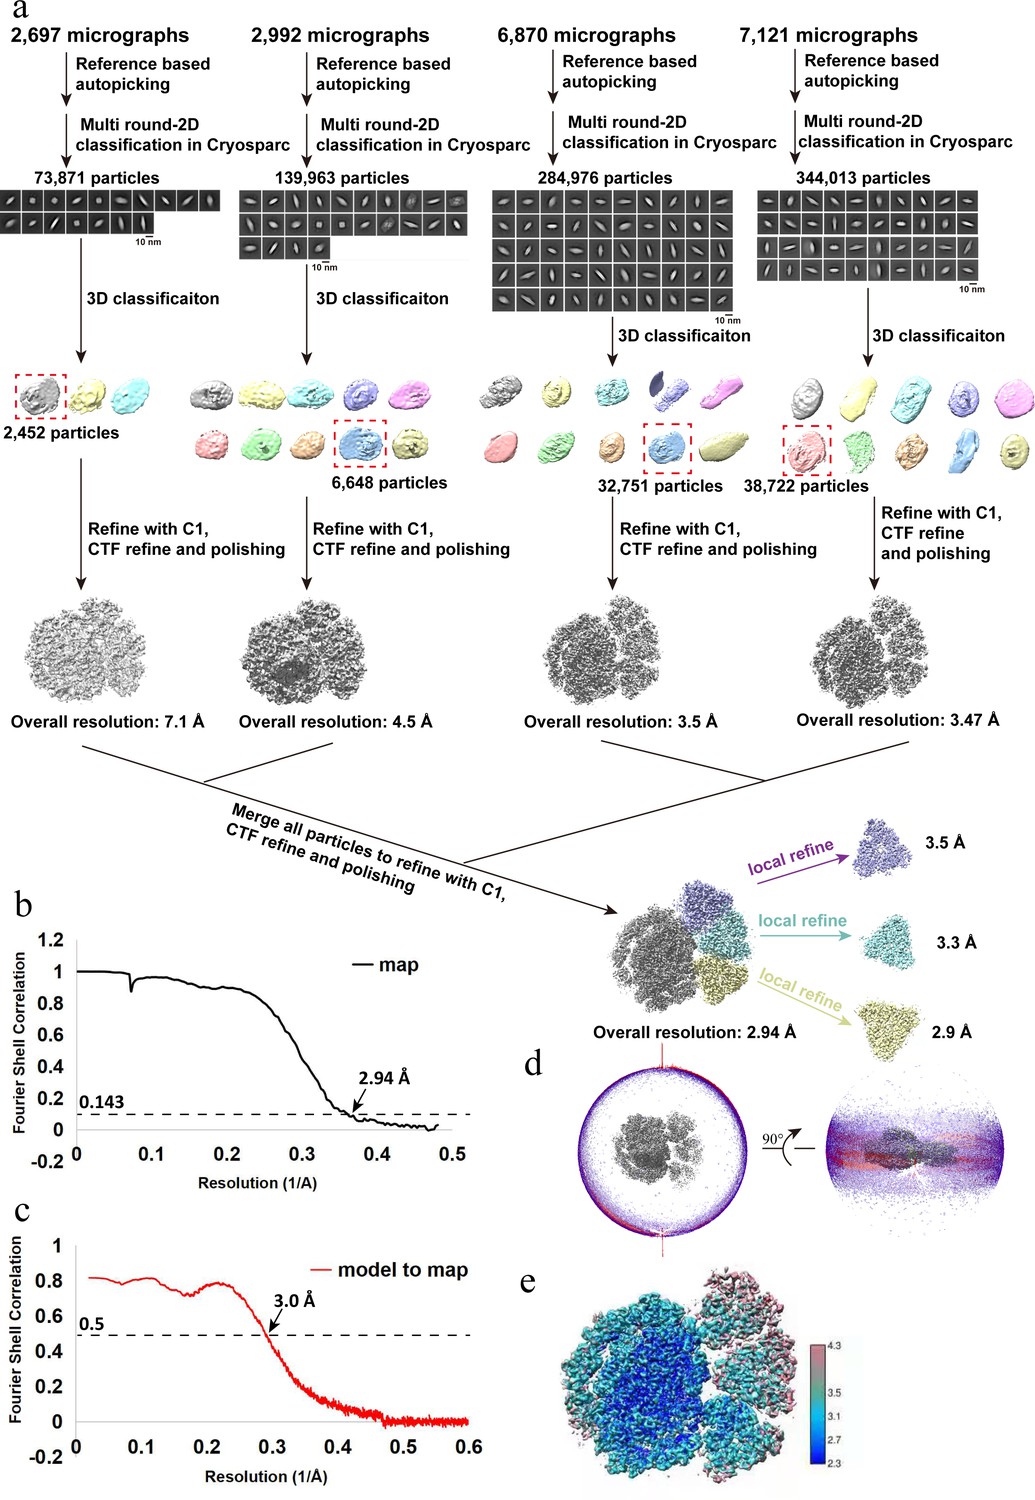
Cryo-EM data collection, processing, refinement, and validation statistics of OtPSI-LHCI-Lhcp structures.
(a) Data collection, processing, and refinement scheme. (b) The gold standard Fourier shell correlation (FSC) curves of the final map with criterion of 0.143. (c) The FSC curves of the refined models versus the cryo-EM map with criterion of 0.5. (d) Angular distribution of the particles used for the final three-dimensional (3D) reconstruction. (e) Estimation of local resolution of the final cryo-EM map.
Figure 2—figure supplement 2
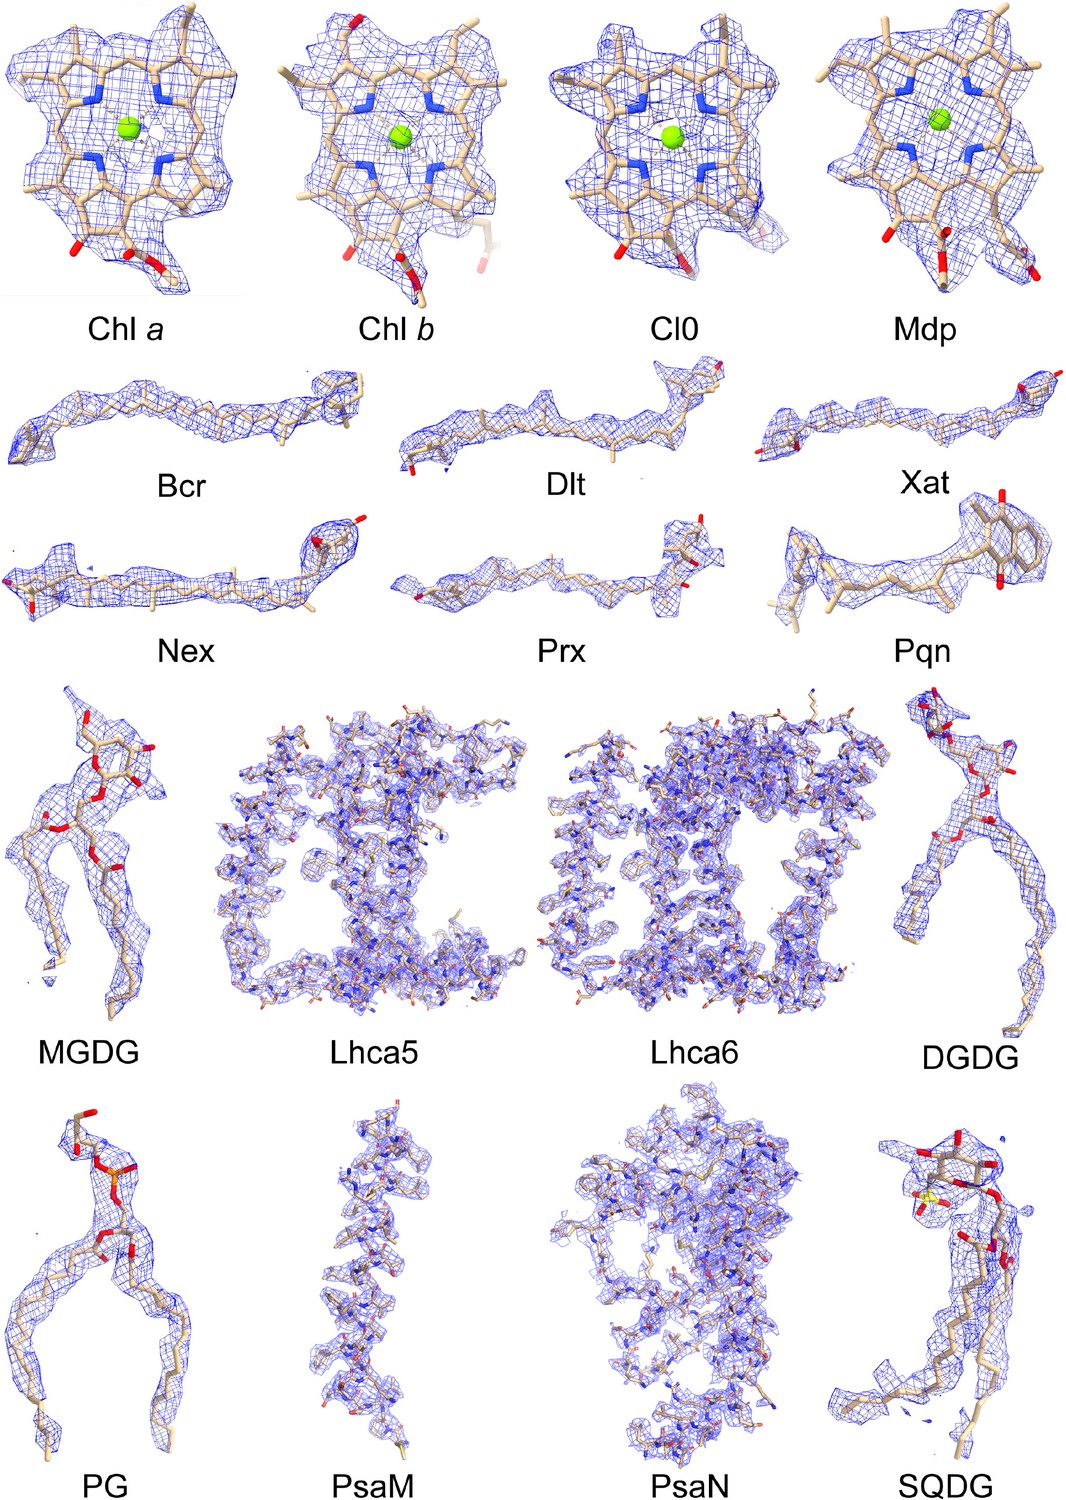
Cryo-EM densities of various cofactors and protein subunits found in the PSI-LHCI-Lhcp supercomplex of O. tauri.
Chl a, chlorophyll a; Chl b, chlorophyll b; Cl0, a chlorophyll a isomer of the special pairs of Chl a in the reaction center; Mdp, Mg-2,4,-divinyl-phaeoporphyrin a5 monomethyl ester; Bcr, beta-carotene; Dlt, dihydrolutein; Xat, violaxanthin; Nex, neoxanthin; Prx, prasinoxanthin; Pqn, phylloquinone; MGDG, monogalactosyl-diacylglycerol; DGDG, digalactosyl-diacylglycerol; PG, 1,2-dipalmitoyl-phosphatidylglycerol; SQDG, sulfoquinovosyl diacylglycerol.
Figure 2—figure supplement 3
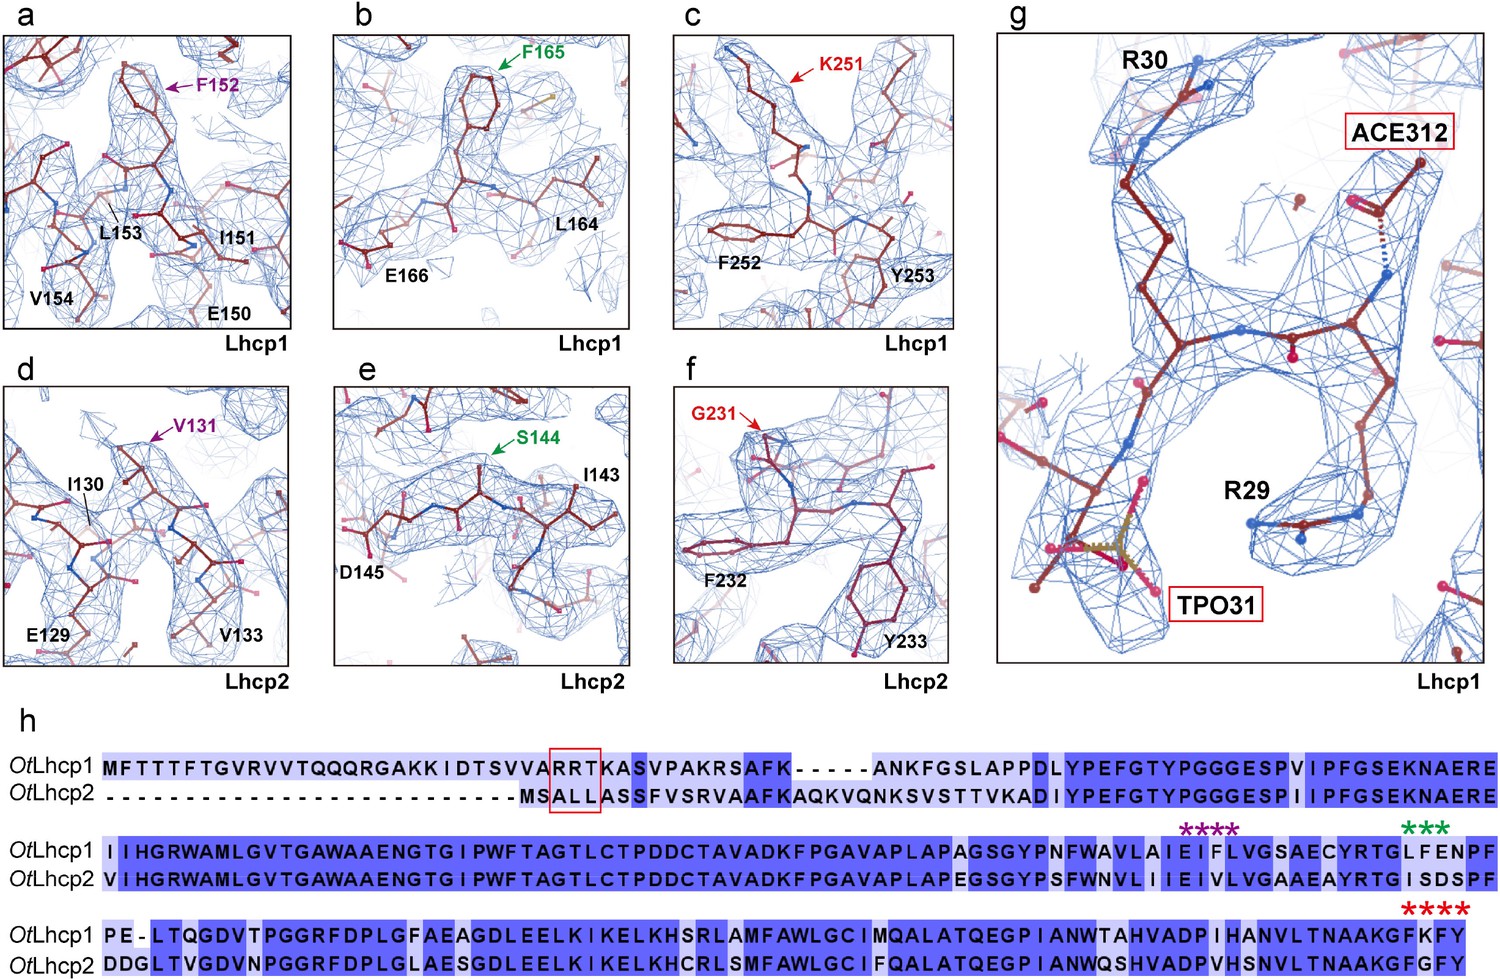
The detailed local cryo-EM map features for identification of OtLhcp1 and OtLhcp2.
The densities shown in (a–c) (Lhcp1) and (d–f) (Lhcp2) correspond to the three major characteristic motifs (labeled by * symbols in h) distinguishing Lhcp1 from Lhcp2. (g) The cryo-EM density for the amino-terminal region of OtLhcp1. (h) Alignment of the amino acid sequences of OtLhcp1 and OtLhcp2. The red box highlights the amino-terminal "RRT" motif of Lhcp1 and the corresponding region in Lhcp2.
Figure 3
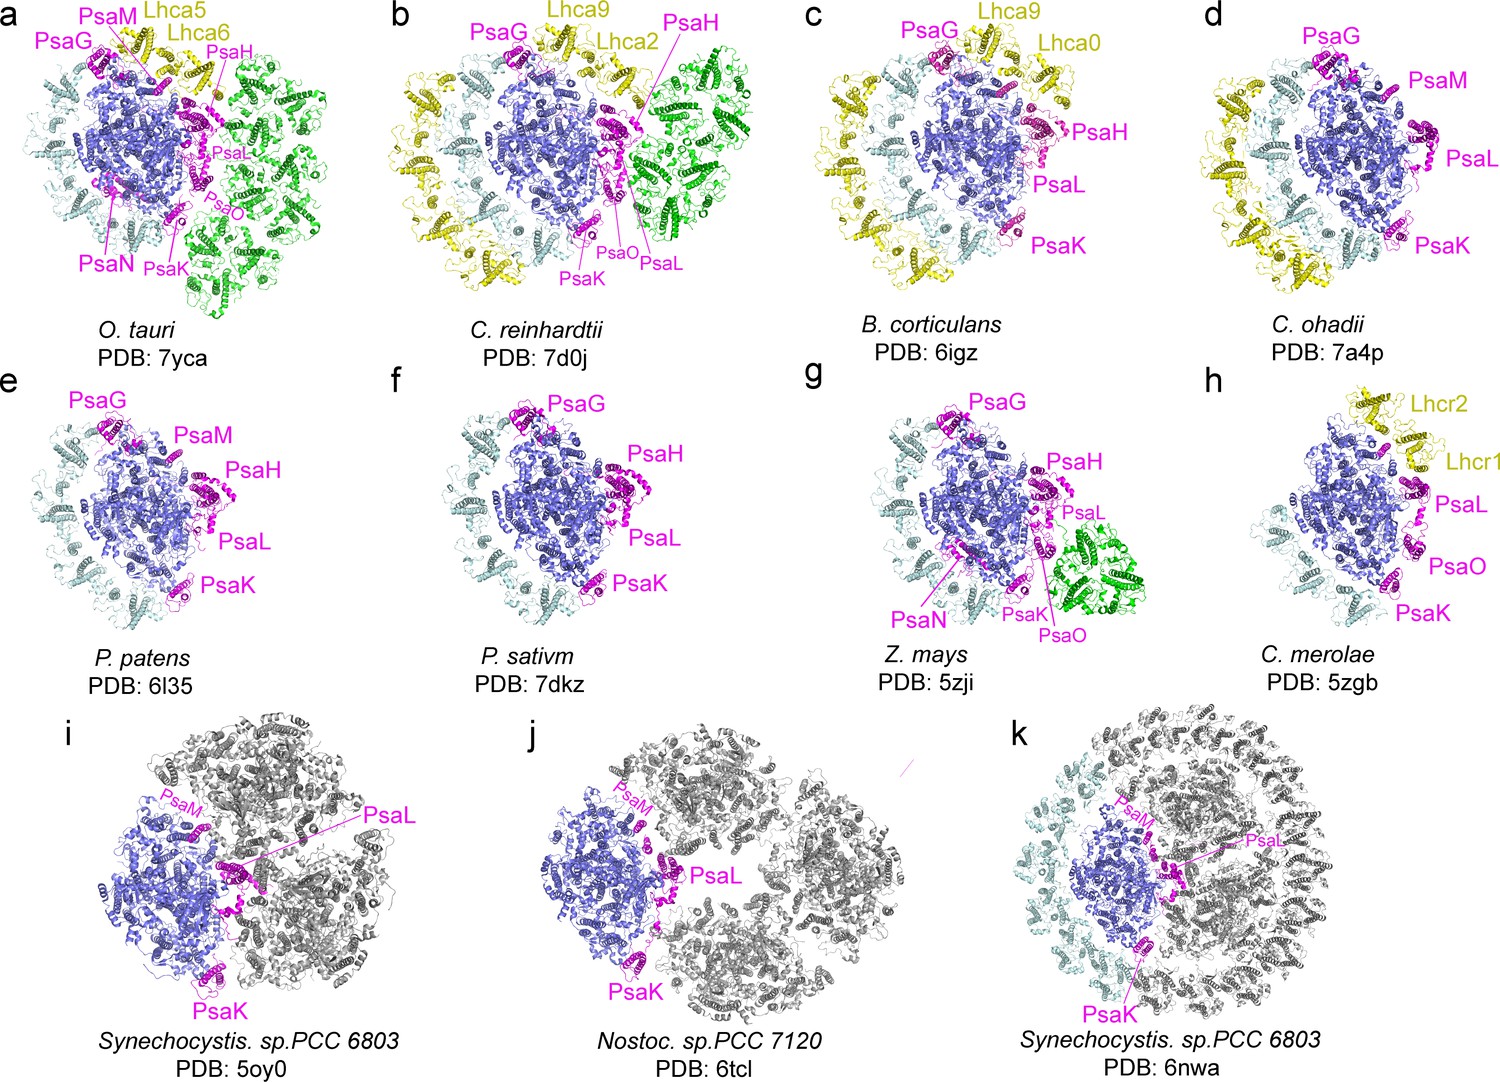
Comparison of O.tauri PSI-LHCI-Lhcp supercomplex with the photosystem I (PSI) supercomplexes from other organisms.
(a) OtPSI-LHCI-Lhcp supercomplex. (b–k) Structures of PSI from different species or at different states. Blue, large PSI core subunits; magenta, small PSI core subunits; yellow, Lhca5-Lhca6/Lhca2-Lhca9/Lhca0-Lhca9/Lhc1-Lhc2 and the outer belt of LHCI; cyan, Lhca1-Lhca2-Lhca3-Lhca4 and the inner belt of antenna complexes around PSI from other species; green, Lhcp or LHCII trimers; gray, symmetry-related units in trimeric or tetrameric PSI.
Figure 4
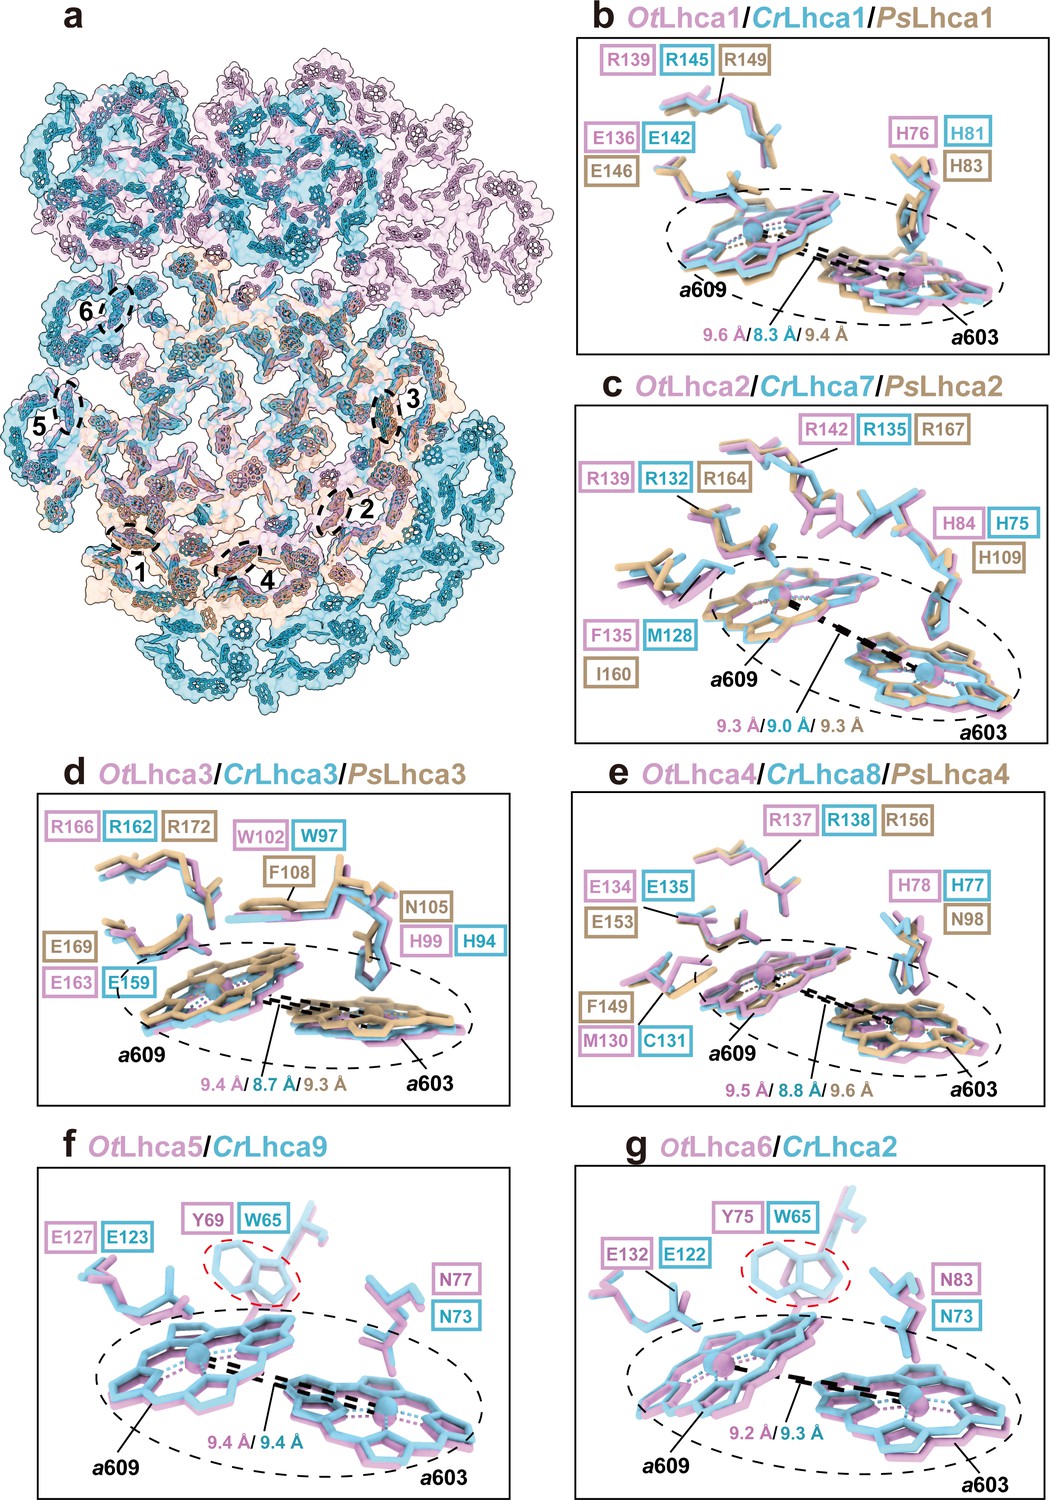
Comparison of Chl a603-a609 dimers in Lhca complexes among O. tauri, C. reinhardtii, and P. sativum.
(a) Overall arrangement of the Chl a603-a609 dimers in six Lhca complexes of O. tauri, C. reinhardtii, and P. sativum. The chlorophylls in the photosystem I (PSI) supercomplexes are presented in surface models and those of Lhca complexes are superposed with stick models. Color code: pink, O. tauri; golden, P. sativum; light blue, C. reinhardtii. The dark labels (1–6) indicate the Lhca1-Lhca6 subunits and the dashed ovals label the locations of the a603-a609 dimer in each LHCI. (b–g) Comparison of the Chl a603-a609 dimers and their local environments in six different Lhca subunits from the three different species. Note that the axial ligands of Chl a603 in Lhca1-4 from O. tauri are all His, while the Asn in the 603 site of plant Lhca3 and Lhca4 are crucial for the formation of the red-most form chlorophyll. The Lhca5/Lhca9 and Lhca6/Lhca2 are only present in O. tauri and C. reinhardtii but absent in P. sativum. The Chl a603-a609 dimers are indicated in the black dashed ovals and the key amino acid residues around the two chlorophylls are shown as stick models. The number labeled nearby the black dashed lines indicate the Mg-Mg distances between Chl a603-a609 dimer in Lhca complexes from O. tauri, C. reinhardtii, and P. sativum. In (f) and (g), the red dashed ovals indicate the Tyr/Trp residues around the Chl a609 molecules from OtLhca5/CrLhca9 and OtLhca6/CrLhca2.
Figure 5
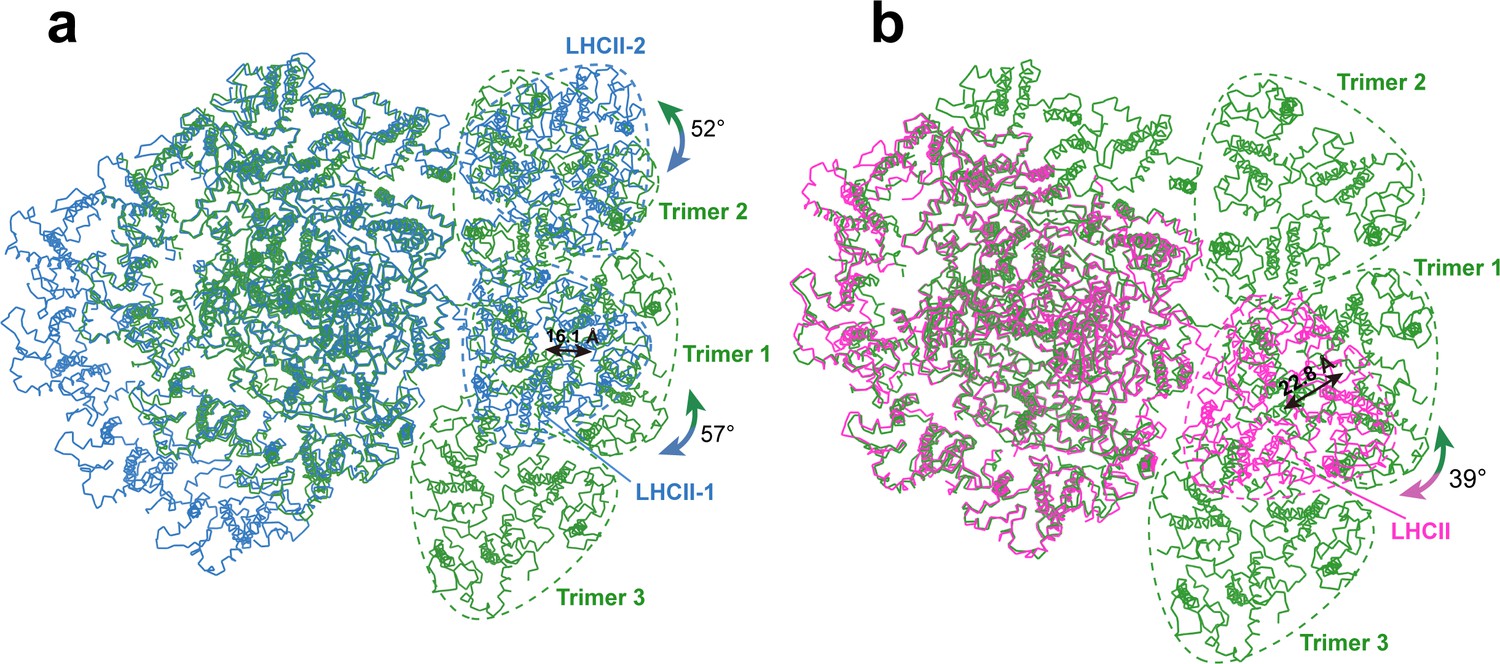
Comparing the binding sites of Trimers with those of LHCII trimers bound to C. reinhardtii and plant photosystem I (PSI).
(a and b) The structure of OtPSI-LHCI-Lhcp supercomplex is superposed with the PSI-LHCI-LHCII supercomplex from C. reinhardtii (PDB code: 7DZ7, a) or Z. mays (PDB code: 5ZJI, b). The three structures are superposed on the common PsaA subunits. The dash triangular rings outline the approximate boundaries of Trimers or LHCII trimers. Color code: green, OtPSI-LHCI-Lhcp; blue, CrPSI-LHCI-LHCII; magenta, ZmPSI-LHCI-LHCII. The double-headed arrows indicate the translational or rotational relationships between Lhcp trimers in O. tauri and the corresponding LHCII trimers in C. reinhardtii and in Z. mays. The number labeled nearby the arrows indicate the translation distances or rotation angles.
Figure 6

Interfaces between Trimers and photosystem I (PSI) subunits.
(a) The interface between Trimer 1 and PsaO. (b) The interface between Trimer 2 and PsaL-PsaH. (c) The interface between Trimer 3 and PsaK. (d–f) The detailed interactions between Lhcp1 of Trimer 2 and PsaL/PsaH at sites 1–3 shown in b. (g) The detailed interactions between Lhcp2 of Trimer 3 and PsaK at site 4 shown in c. The numbers labeled nearby the dash lines are distances (Å) between two adjacent groups.
Figure 7 with 2 supplements
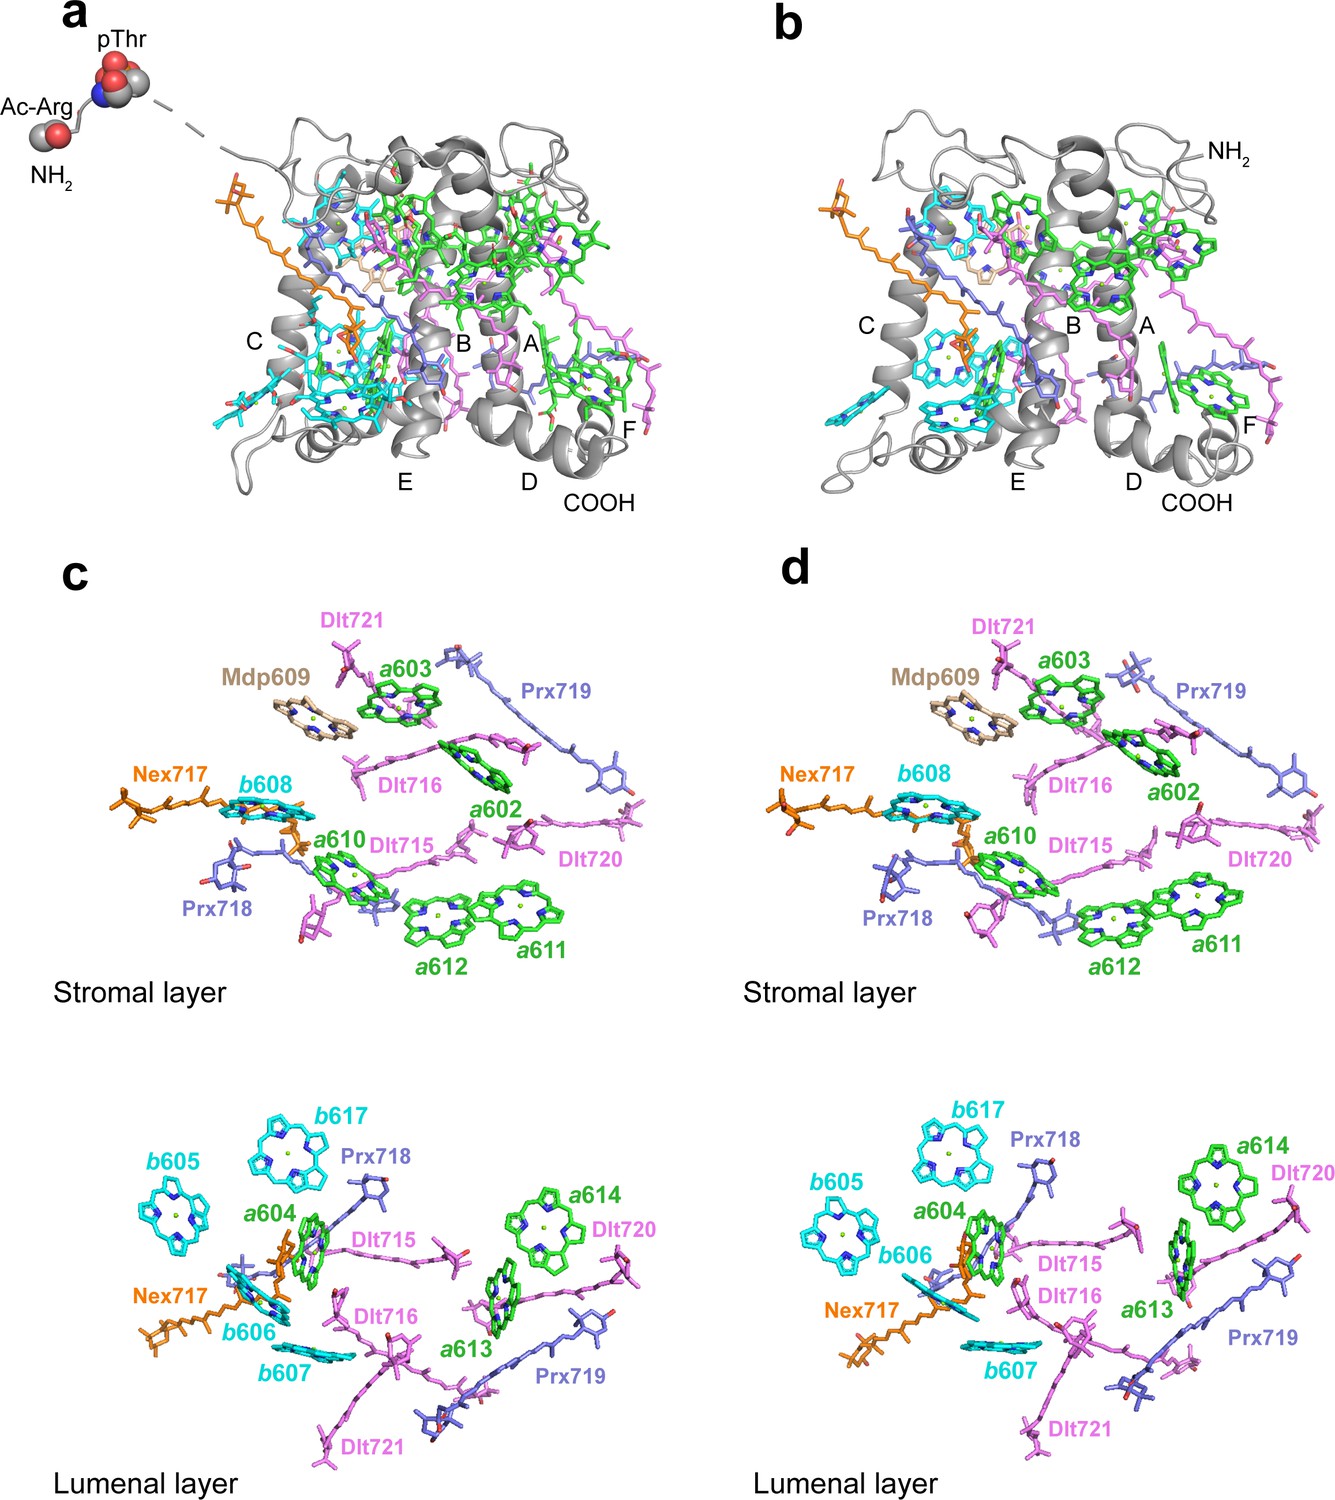
The structures and pigment compositions of OtLhcp1 and OtLhcp2.
(a and b) Side views of OtLhcp1 (a) and OtLhcp2 (b) structures. The backbones of OtLhcp1/OtLhcp2 apoproteins are showed as cartoon models, while the pigments are presented as stick models. The phytyl chains of Chl molecules are omitted for clarity. The phosphorylated Thr residue and the acetylated Arg residue at the N-terminal region of Lhcp1 is highlighted as sphere models. A, B, and C indicate the three transmembrane helices in OtLhcp1/OtLhcp2 apoproteins, whereas D and E are the two amphipathic helices at the lumenal surface. Color codes: gray, Lhcp1 and Lhcp2 apoproteins; green, Chl a; cyan, Chl b; magenta, dihydrolutein/DLT; purple, prasinoxanthin/PRX; orange, neoxanthin/NEX. (c and d) The arrangement of pigment molecules in OtLhcp1 (c) and OtLhcp2 (d). For clarity, the apoproteins are not shown. In the upper row, only pigment molecules within the layer close to stromal surface are shown, while the lower row shows the pigment molecules within the layer close to the lumenal surface.
Figure 7—figure supplement 1
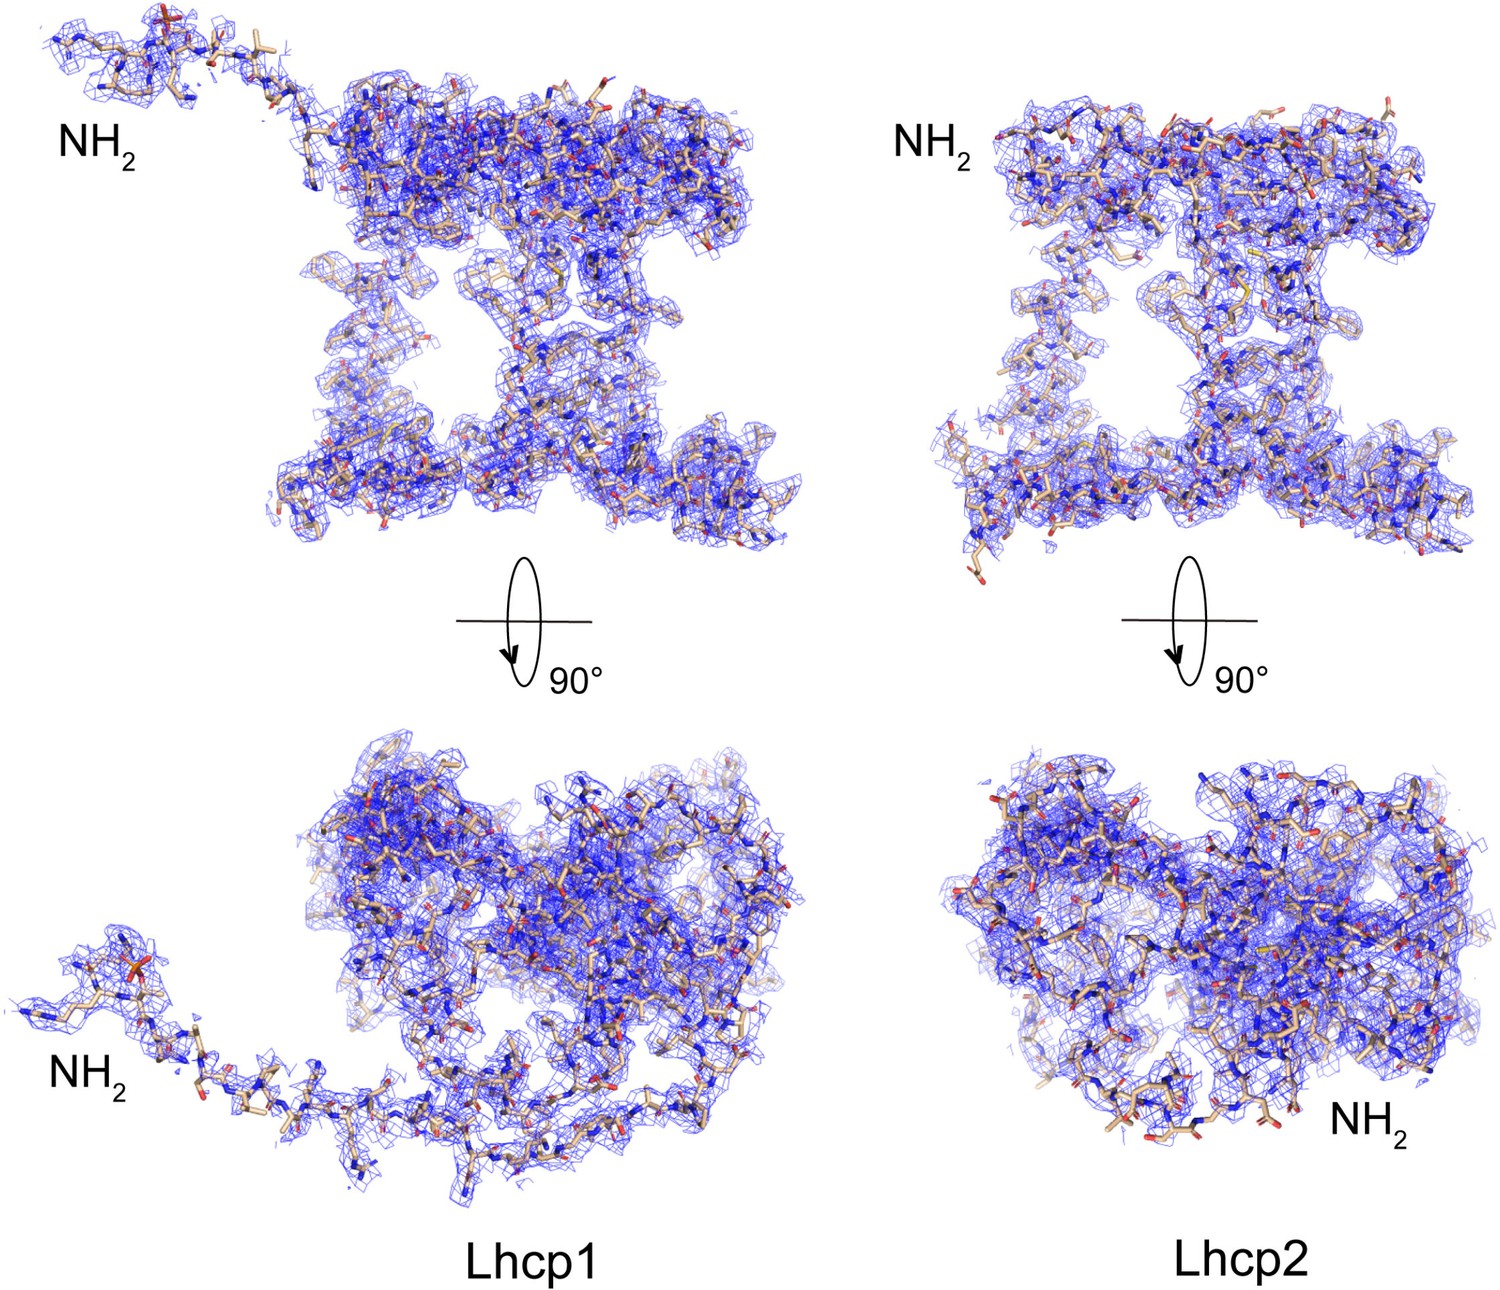
Cryo-EM densities of OtLhcp1 and OtLhcp2 proteins.
The overall structure of OtLhcp1 highly resembles that of OtLhcp2, except that the former one has an elongated N-terminal region with a phosphorylated Thr residues. The cofactors are omitted for clarity.
Figure 7—figure supplement 2
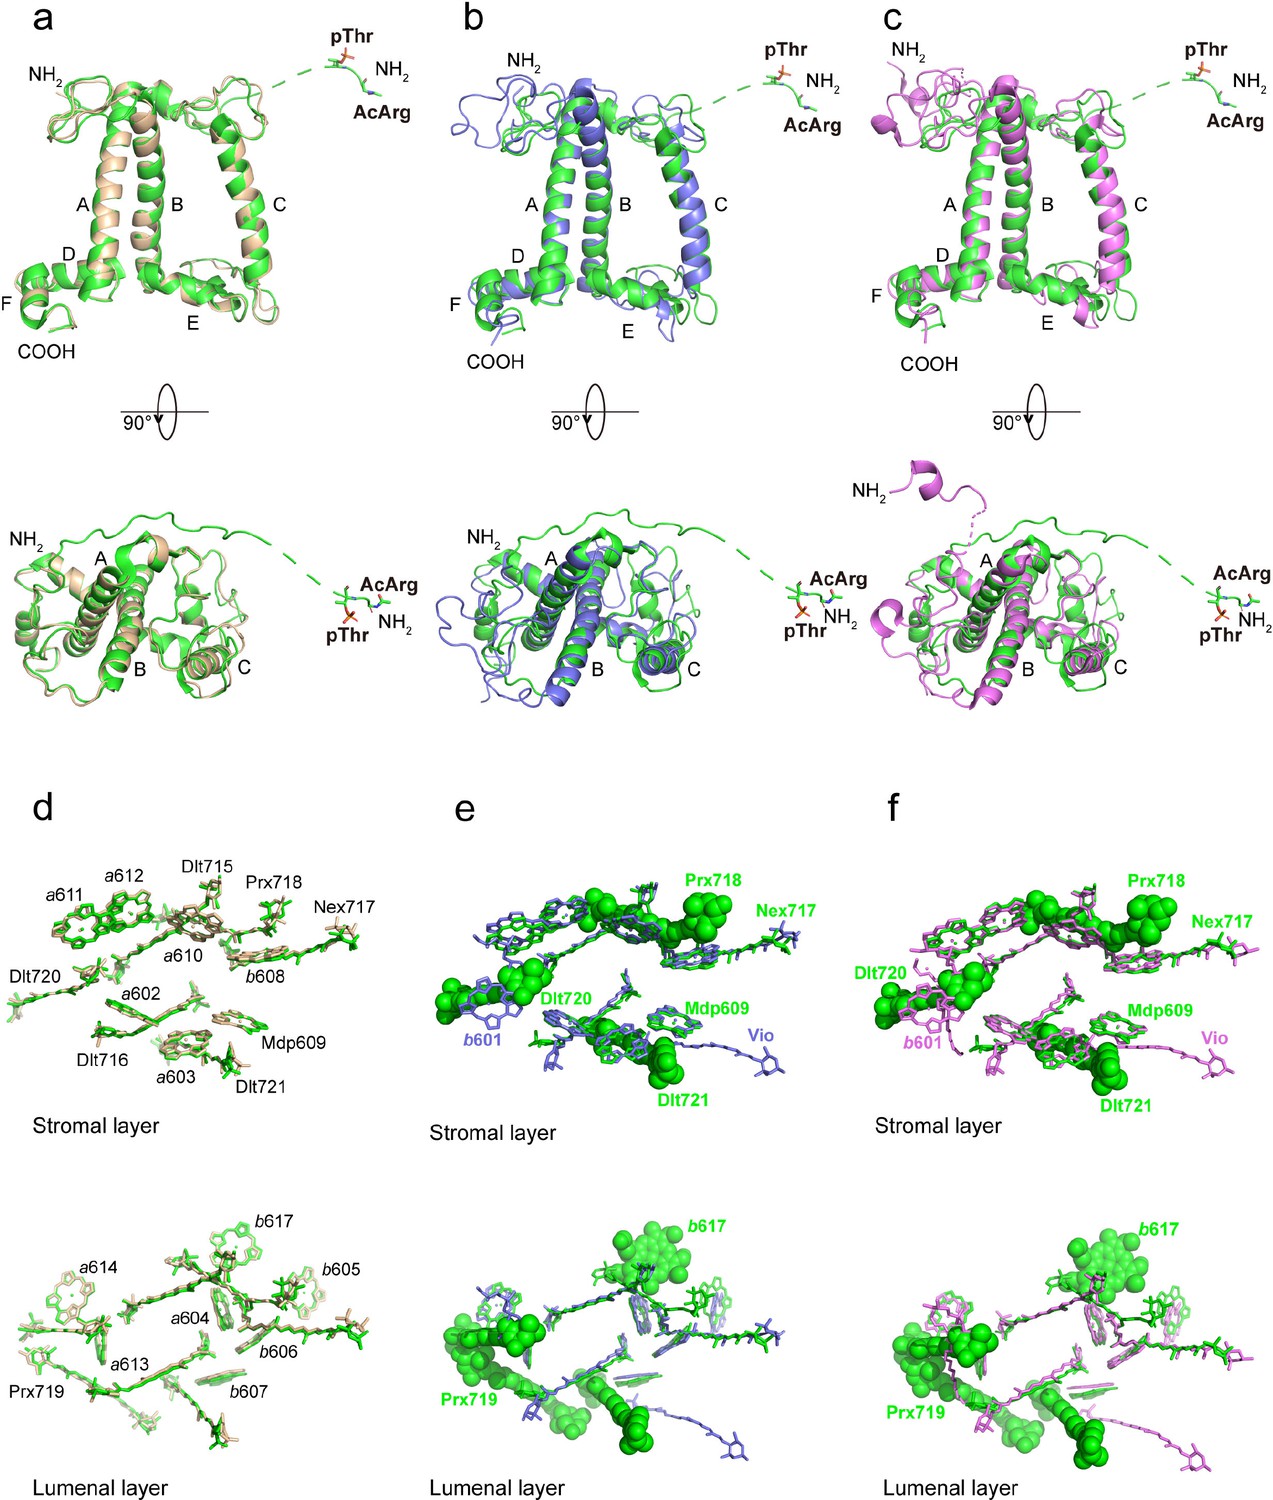
Superposition of the OtLhcp1 structure with those of OtLhcp2 (a, d), ZmLhcb1 (b, e), and CrLhcbM1 (c, f).
(a-c) The apoprotein of OtLhcp1 superposed with those of OtLhcp2 (a), ZmLhcb1 (b), and CrLhcbM1 (c). Color codes: green, OtLhcp1; golden, OtLhcp2; light blue, ZmLhcb1; violet, CrLhcbM1. The N-terminal phosphorylated Thr residues are highlighted as stick models. A, B, and C indicate the three transmembrane helices in Lhcp/Lhcb apoproteins. Upper row, side view along membrane plane; lower row, top view from stromal side along membrane normal. The dash lines indicate the flexible linker regions not observed in cryo-EM maps. (d–f) The distribution of pigment molecules in OtLhcp1 in comparison with those in OtLhcp2 (d), ZmLhcb1 (e), and CrLhcbM1 (f). In the upper row, only chlorophyll molecules within the layer close to stromal surface are shown, while the lower row shows the chlorophyll molecules within the layer close to the luminal surface. In (e and f), the Chl and carotenoid molecules only present in OtLhcp1 but not in ZmLhcb1 or CrLhcbM1 are highlighted as sphere models. Those present in ZmLhcb1 and CrLhcbM1 but absent in OtLhcp1 are indicated by the light blue or violet labels (LHG, b601, and Vio).
Figure 8 with 2 supplements
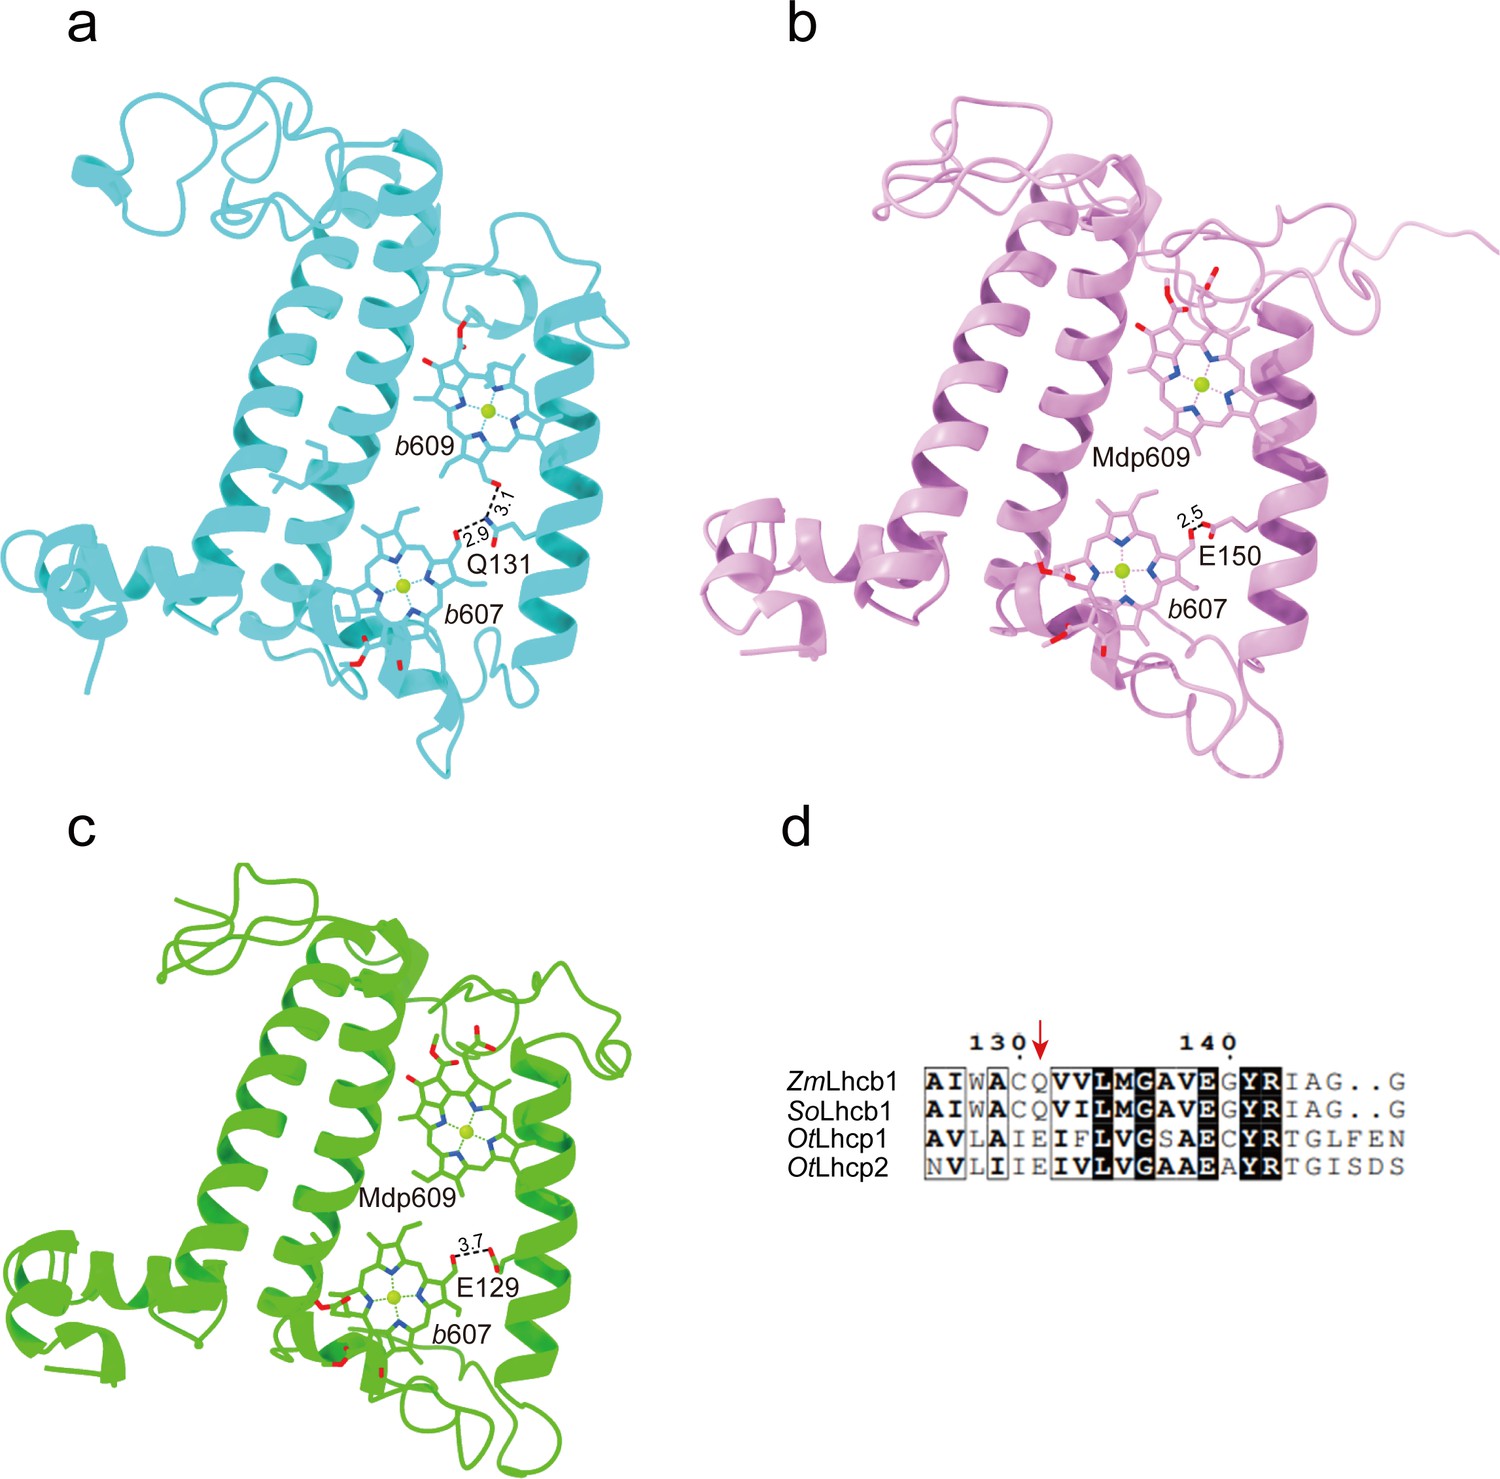
The key amino acid residues related to the selectivity of chlorophyll binding site 609 in OtLhcp1/2 and plant Lhcb1.
(a) The side chain amine group of Gln131 in Lhcb1 from Spinacea oleracea (SoLhcb1) offers two hydrogen bond donors for selective binding of two Chl b molecules. (b and c) The carboxyl group of Glu150/Glu129 in OtLhcp1/2 provides only one hydrogen bond donor for selective binding of only one Chl b molecule instead of two. (d) Sequence alignment analysis of the plant Lhcb1 (Z. mays Lhcb1/ZmLhcb1 and SoLhcb1) and OtLhcp1/2. Color codes: cyan, Lhcb1; violet, Lhcp1; green, Lhcp2. The dash lines indicate the putative hydrogen bonds between the C7-formyl groups of Chl b molecules and Glu/Gln residues. The numbers labeled nearby the dash lines are the distances (Å) between hydrogen bond donor and acceptors. The pigment molecules are shown as stick models, while the protein backbones are presented as cartoon models.
Figure 8—figure supplement 1
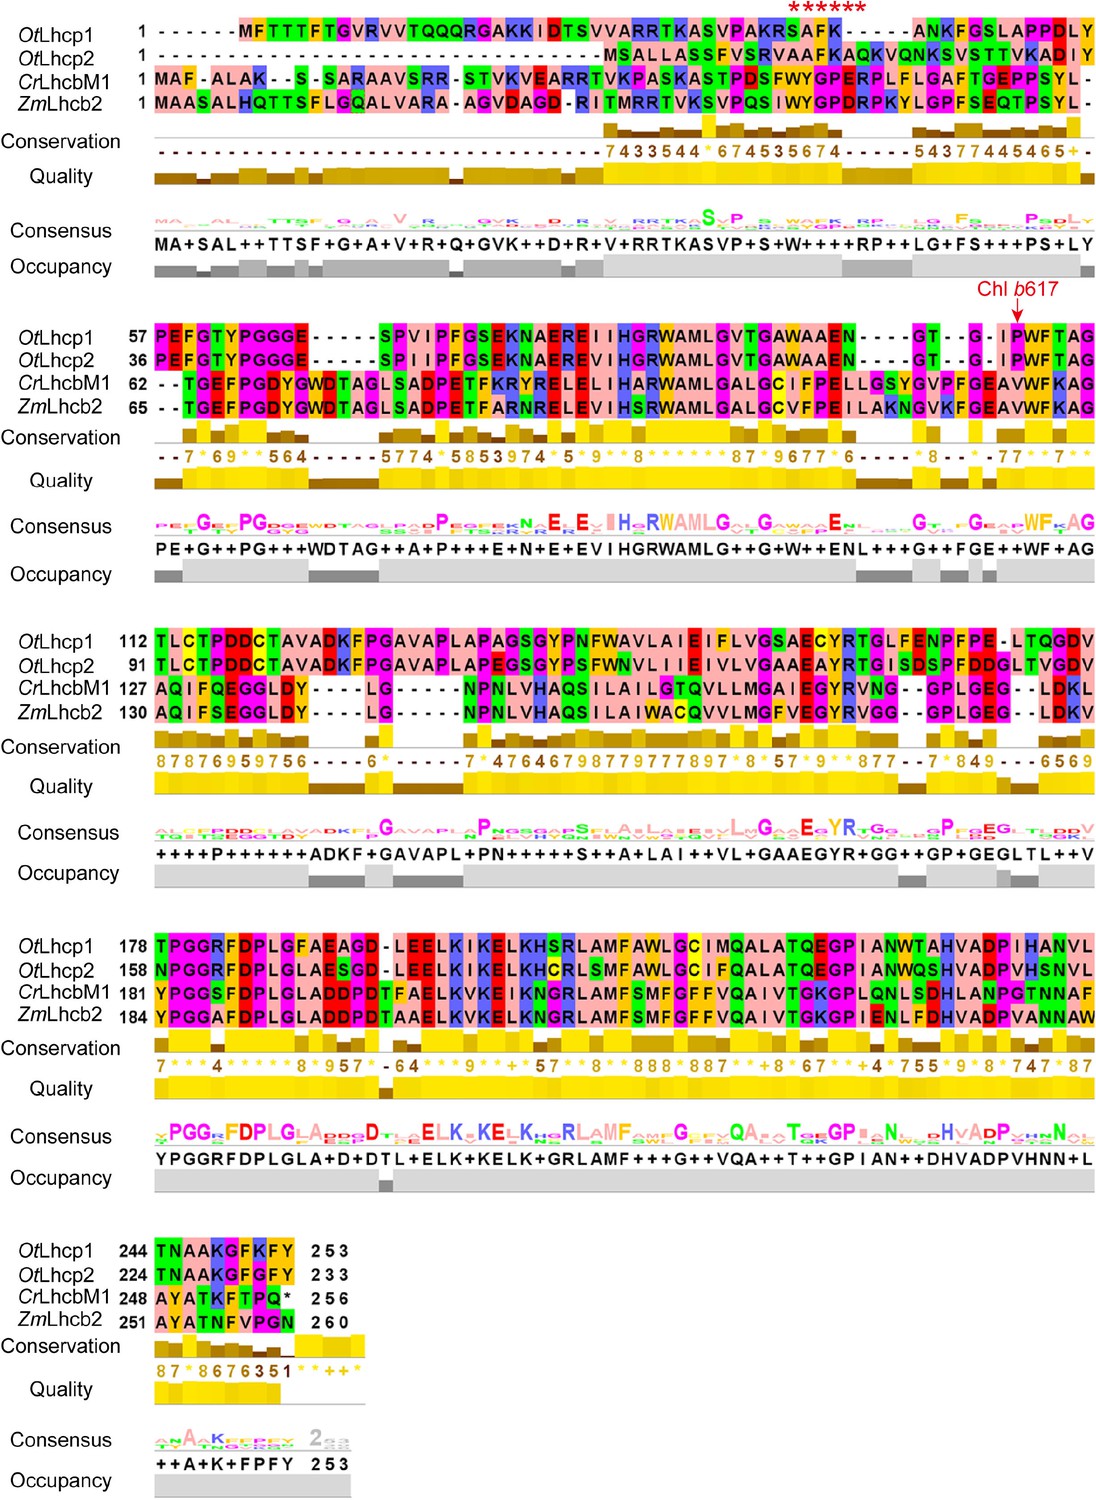
Sequence alignment of OtLhcp1 and OtLhcp2 with LhcbM1 from C. reinhardtii and Lhcb2 from Z. mays.
The red arrow indicates the binding site of Chl b617 found in OtLhcp1 and Lhcp2. The red asterisk symbols show the position of WYXXXR motif found at the N-terminal regions of CrLhcbM1 and ZmLhcb2, but absent in OtLhcp1 and OtLhcp2.
Figure 8—figure supplement 2
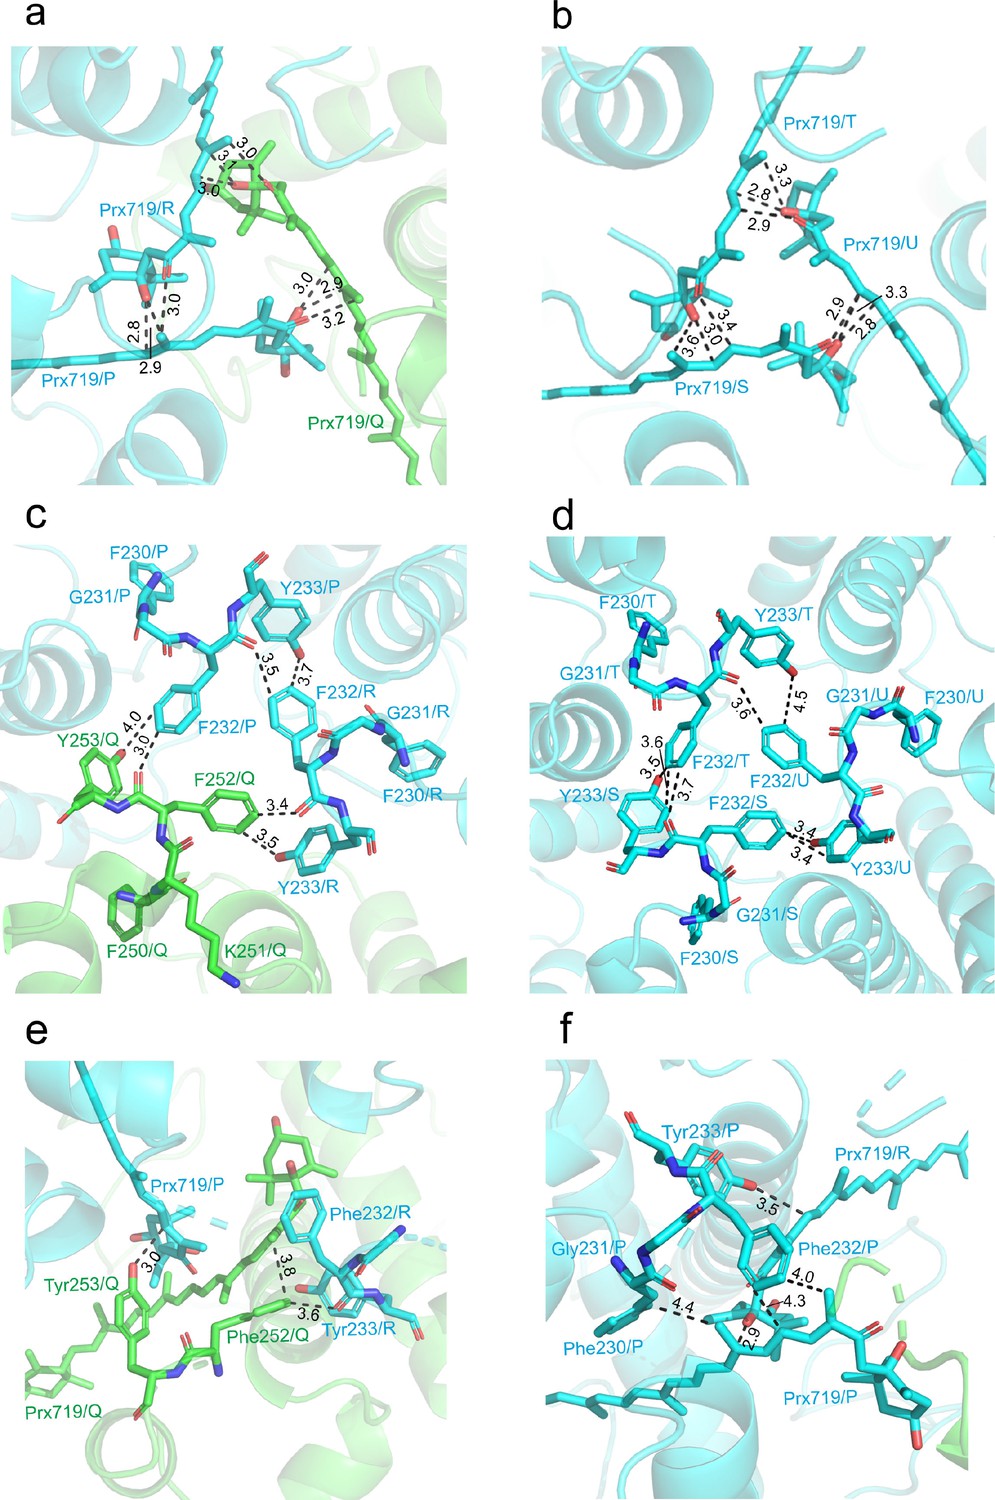
The detailed features at the trimerization interfaces of Trimers.
(a and b) Van der Waals and hydrophobic interactions among the three symmetry-related Prx719 molecules in the Lhcp1-(Lhcp2)2 trimer (a) and (Lhcp2)3 trimer (b). (c and d) Interactions among the adjacent C-terminal motifs (FKFY/FGFY) of the Lhcp1-(Lhcp2)2 trimer (c) and (Lhcp2)3 (d) trimer. (e, f) Extensive interactions between the C-terminal regions of OtLhcp1(e) or OtLhcp2(f) and Prx719 from the adjacent monomers. The cartoon representations of OtLhcp1 (green) and OtLhcp2 (cyan) are shown, while the molecules and amino acid residues involved in trimerization are presented as stick models. The numbers labeled nearby the dashed lines indicate the distances (Å) between two adjacent groups.
Figure 9
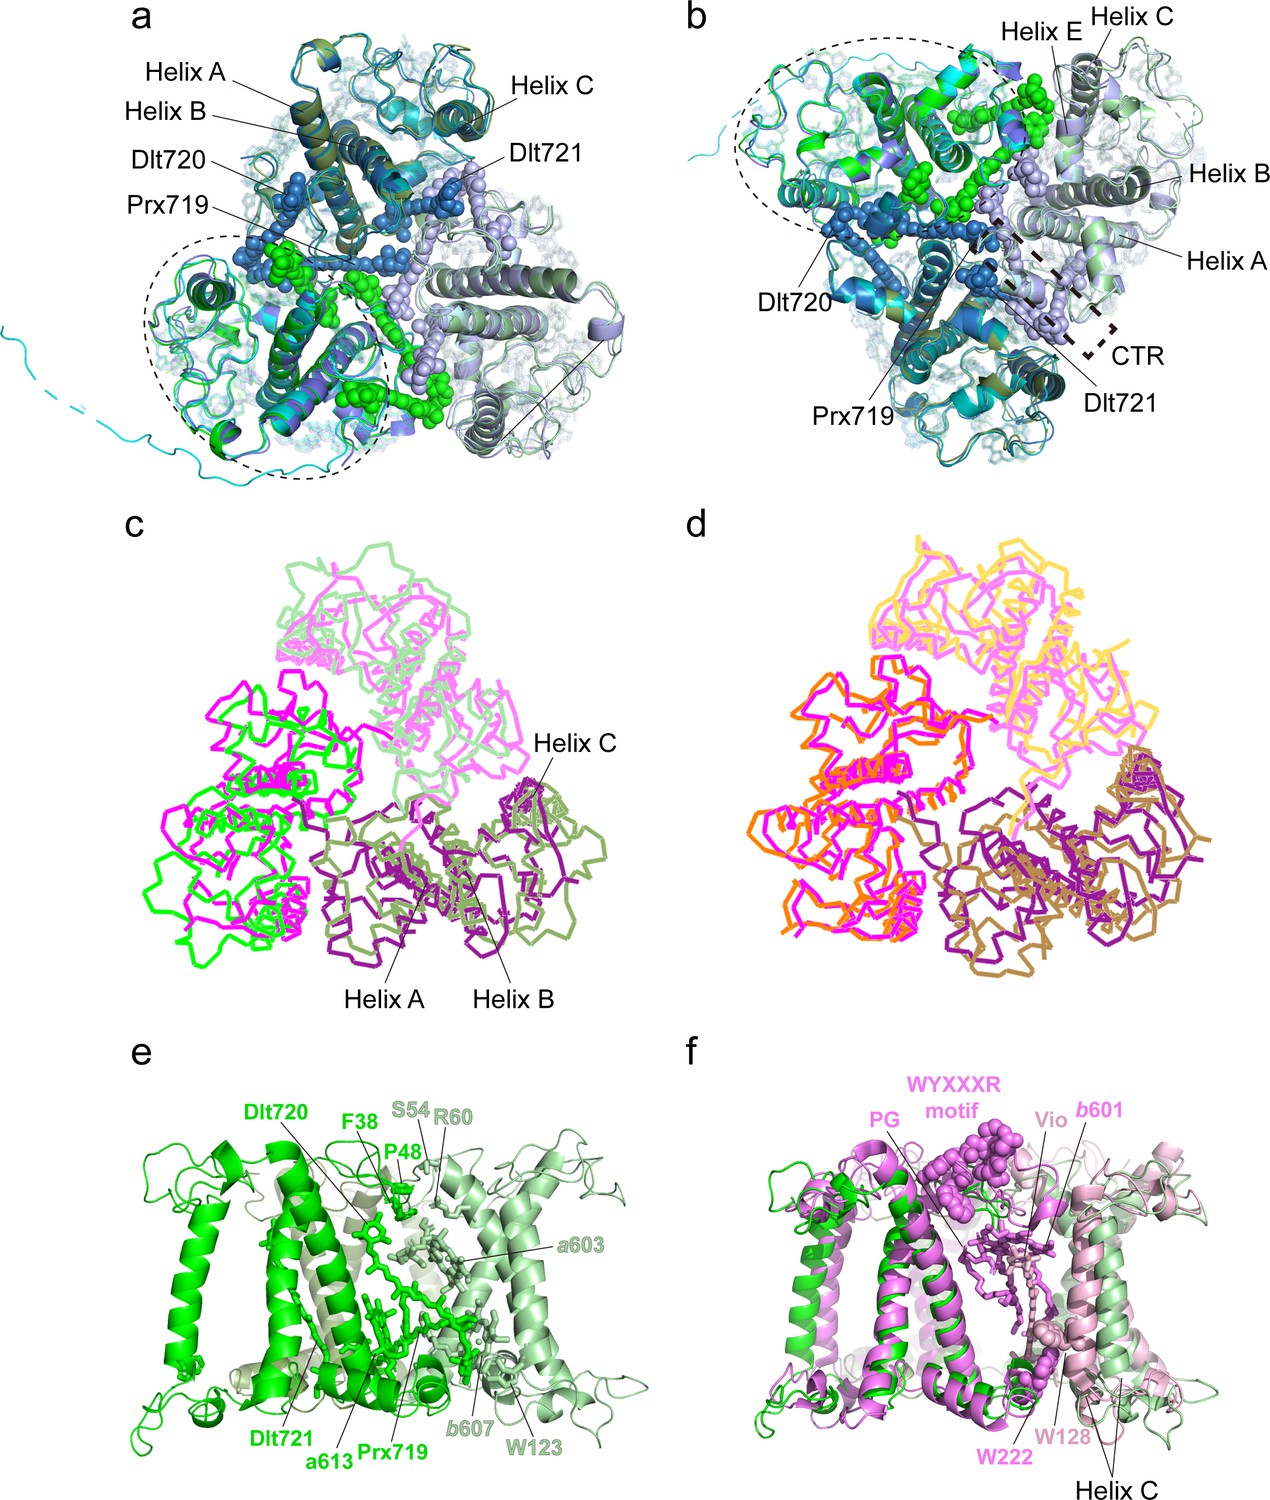
Monomer-monomer interface of the Trimers.
(a and b) Superposition of the three Trimers associated with photosystem I (PSI) viewed from stromal (a) and lumenal (b) sides. Color codes: green/pale green/dark green, three different monomers of Trimer 1 [(Lhcp2)3]; cyan/pale cyan/dark cyan, three different monomers of Trimer 2 [Lhcp1-(Lhcp2)2]; blue/light blue/dark blue, three different monomers of Trimer 3 [(Lhcp2)3]. The dashed elliptical ring indicates the approximate boundary of one Lhcp1/2 monomer. The dashed box outlines the interfacial location of the C-terminal regions (CTR) of Lhcp1/2. The three carotenoid molecules located at the monomer-monomer interfaces are highlighted as sphere models, while the remaining cofactors are shown as stick models. (c) The (Lhcp2)3 trimer superposed on spinach LHCII trimer are shown as thin ribbon models. The three monomers of spinach LHCII trimer (PDB code: 1RWT) are colored in violet, light pink, and deep purple, respectively, whereas Lhcp2 monomers are in green. (d) Superposition of spinach LHCII trimer with C. reinhardtii LHCII trimer. The three monomers of C. reinhardtii LHCII (PDB code: 7D0J) are shown as thin ribbon models and colored in orange, light orange, and sand. (e) Side view of the monomer-monomer interface of the (Lhcp2)3 trimer. The amino acid residues and cofactors in contact with the adjacent monomer are highlighted as sticks models. (f) The monomer-monomer interface of (Lhcp2)3 trimer from O. tauri compared to the one in spinach LHCII trimer. The cofactors and amino acid residues involved in trimerization of spinach LHCII trimer, but absent in Ot(Lhcp2)3 trimer, are shown as sphere models.
Figure 10 with 2 supplements
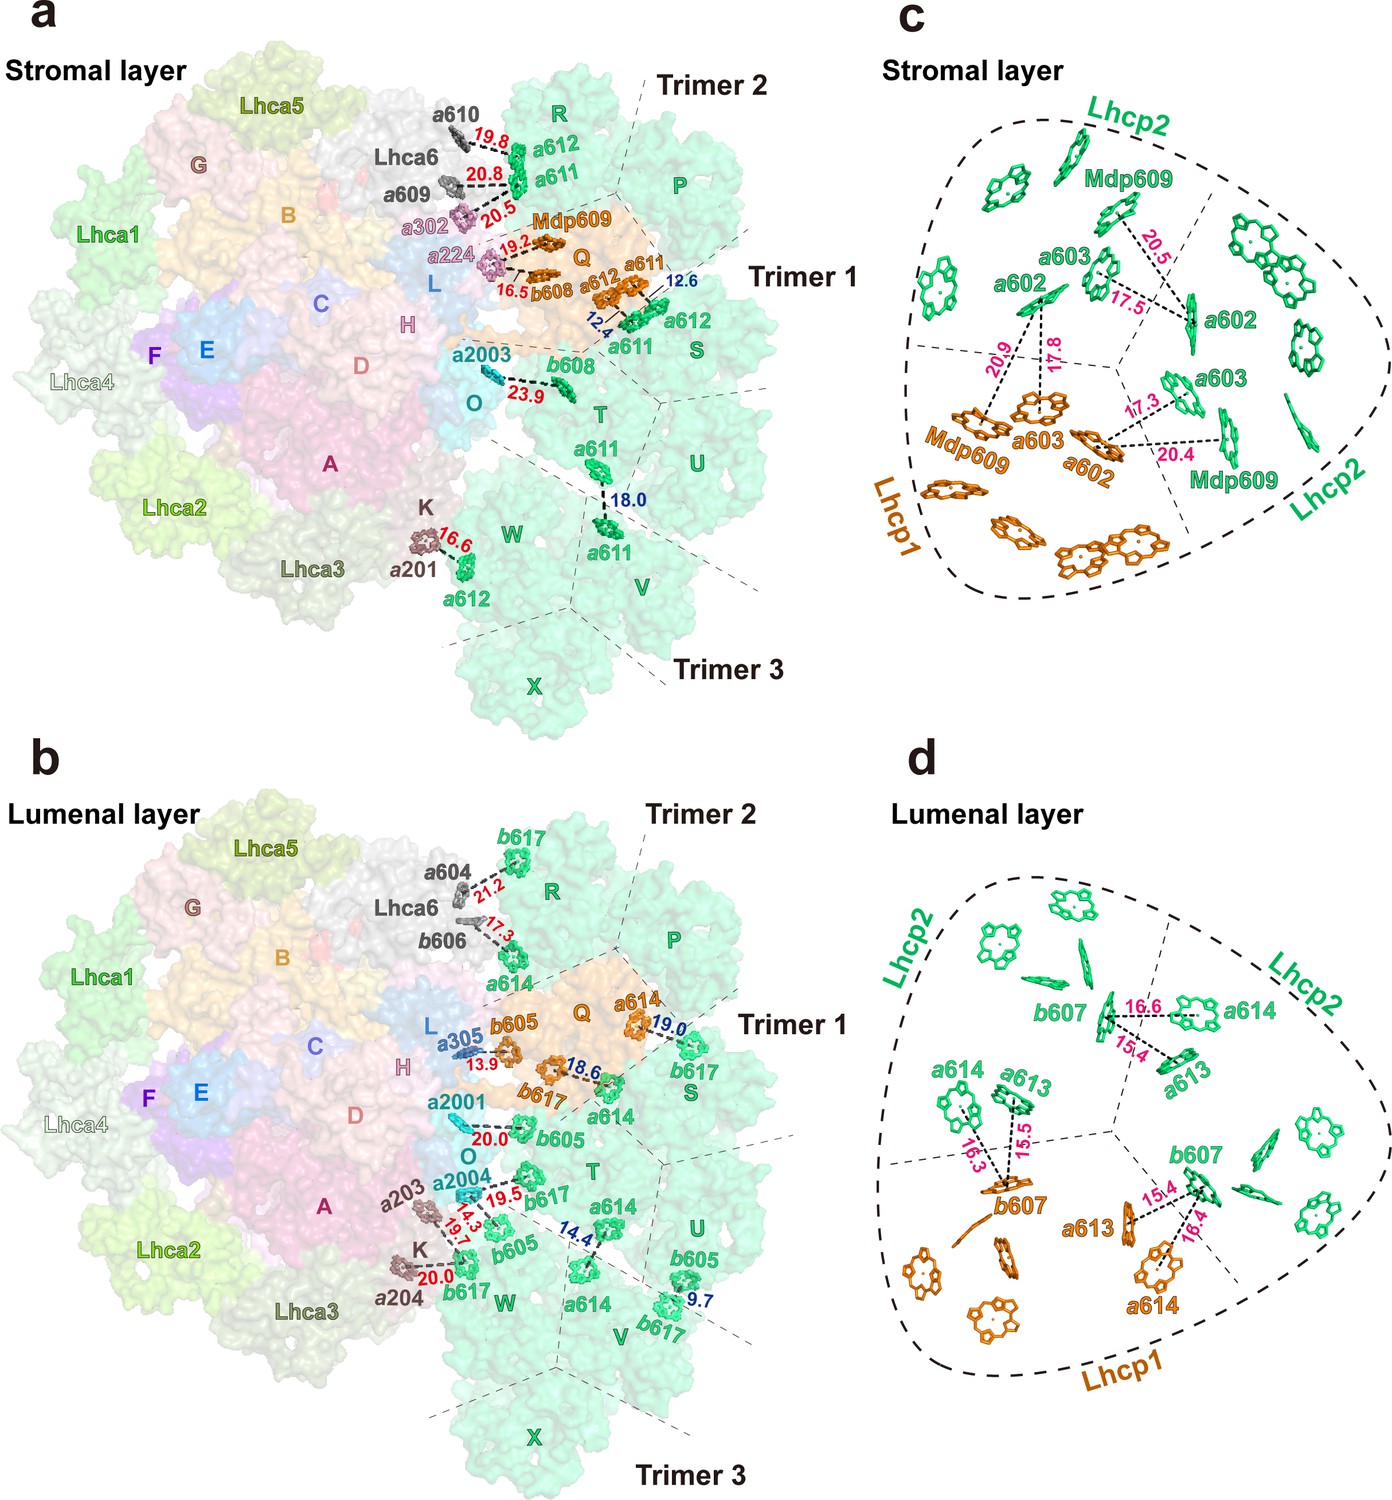
Potential energy transfer pathways between Trimers and photosystem I (PSI).
(a and b) The arrangement of interfacial chlorophyll molecules within the stromal (a) and lumenal (b) layers. The view is from stromal side and approximately along membrane normal. The Chl molecules at the interfaces between adjacent Trimers and between PSI and Trimers are highlighted as stick models, while the surface presentation of the supercomplex is shown in the background. The labels of P, Q, R, S, T, U, V, W, and X indicate the chain names of Lhcp1 (Q)/Lhcp2 (P, R-X) monomers, whereas those of A-O represent the chain names of PsaA-PsaO in PSI. (c and d) The arrangement of Chl molecules in the Trimer 2 within the stromal (c) and lumenal (d) layers. The Chl molecules at the interfaces between adjacent monomers of Trimer 2 are highlighted as stick models. Color codes: orange, Lhcp1; mint green, Lhcp2. The red, blue, and magenta labels indicate the close relationships between two adjacent Chl molecules at the interface between Trimers 1-3 and PSI/Lhca6 subunits, between two adjacent Trimers and between two adjacent Lhcp monomers within the trimer, respectively. The Mg-Mg distances (Å) are labeled nearby the dotted lines. The dark dashed lines define the estimated interfaces between the adjacent Lhcp monomers, while the dashed round triangles outline the approximate boundary of the trimer. Chains P, Q, and R, Trimer 2; Chains S, T, and U, Trimer 1; Chains V, W, and X, Trimer 3. The phytol tails of Chl molecules are omitted for clarity.
Figure 10—figure supplement 1
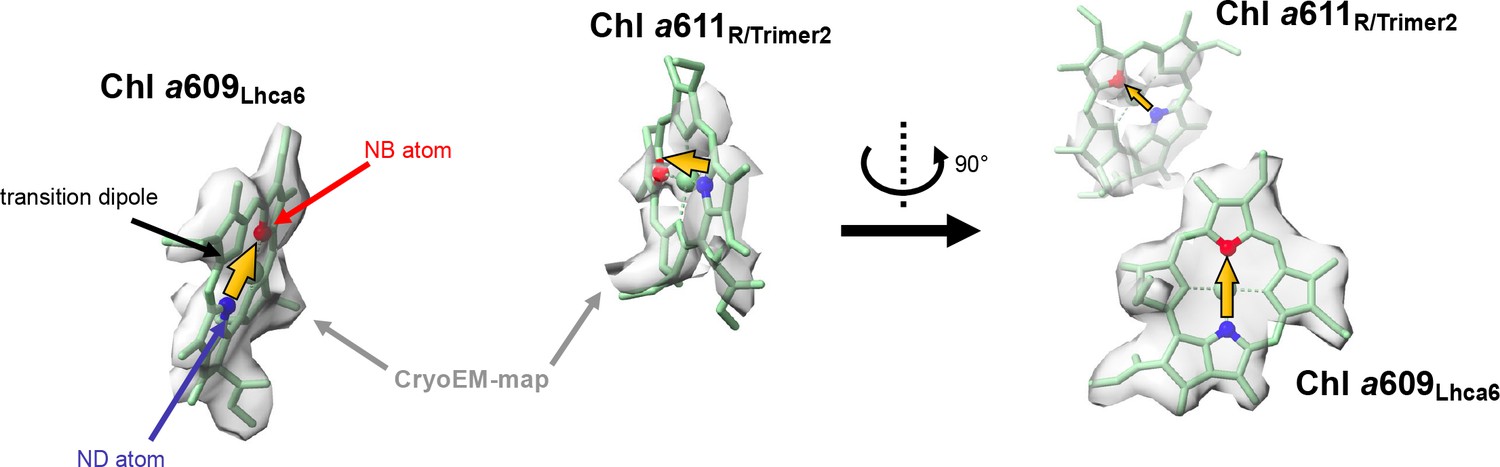
An example of a close Chl pair that has a low orientation factor and a low FRET rate.
Relative orientation of Chl a609Lhca6 and Chl a611R/Trimer2 is shown. NB (red) and ND (blue) atoms, cryo-EM maps (gray), transition dipoles (yellow arrows).
Figure 10—figure supplement 2
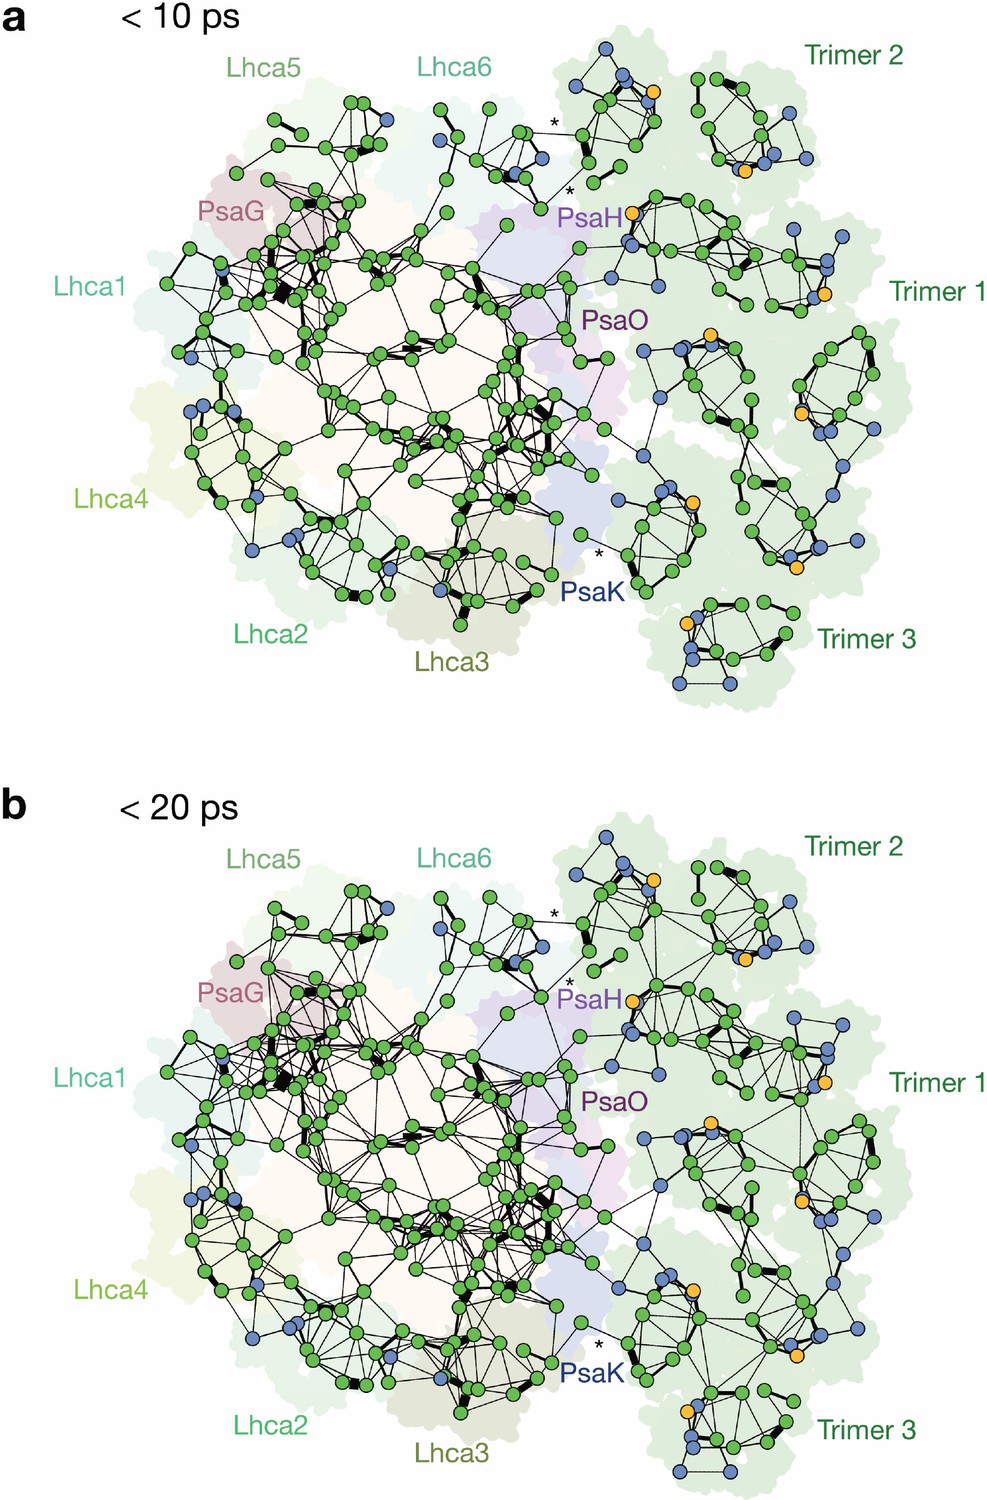
Structure-based analysis of FRET networks within the PSI-LHC-Lhcp supercomplex.
(a,b) Organization of Chl molecules within the PSI-LHCI-Lhcp supercomplex and the FRET networks presenting efficient FRET processes with lifetimes of less than 10 ps (a) and 20 ps (b). The views are from the stromal side. The spheres and dotted circles represent each individual Chl molecules and the boundaries for the individual complexes, respectively. The lines between spheres represent the presence of FRET process between adjacent Chls. The width of lines represents the relative FRET rate in each network. The internal part of the PSI core is colored in wheat, while the peripheral subunits are highlighted in different colors; PsaG (brown), PsaH (purple), PsaK (blue), PsaO (pink), Lhca1-6 and Lhcp1-2 (various greenish colors).
Figure 11 with 2 supplements
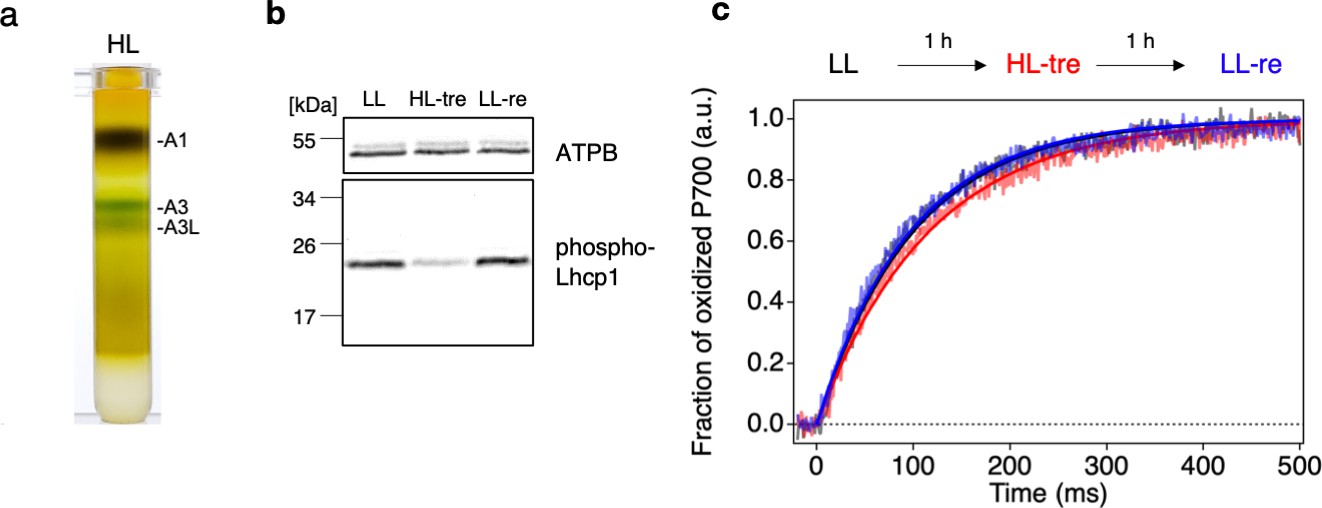
Long- and short-term acclimation of photosystem I (PSI) supercomplex in O. tauri.
(a) Sucrose density gradient ultracentrifugation of the solubilized thylakoids (0.25 mg Chl) from O. tauri cells grown under low light (LL) and high-light (HL) conditions. (b) Immunoblot analysis of phospho-Lhcp1. Thylakoids (2 µg Chl) were isolated from LL-, HL-treated, and LL-recovered cultures (LL [black], HL-tre [red], and LL-re [blue], respectively). ATPB protein levels are shown as the loading control. Data are representative of two independent experiments. See another set of data in Figure 11—figure supplement 1, (c) Light-induced P700 oxidation kinetics measured under 22 µmol photon m–2 s–1 in the thylakoids sampled from the same cultures in (b). The fraction of P700 oxidation was derived from Δ(A820-A870). Solid lines and shaded lines represent fitting curves by mono-exponential functions and averaged lines of measurements of eight technical replicates, respectively. Data are representative of two independent experiments. See another set of data in Figure 11—figure supplement 2.
-
Figure 11—source data 1
Quantitative data for Figure 11b.
- https://cdn.elifesciences.org/articles/84488/elife-84488-fig11-data1-v2.zip
-
Figure 11—source data 2
Raw data for Figure 11c.
- https://cdn.elifesciences.org/articles/84488/elife-84488-fig11-data2-v2.zip
Figure 11—figure supplement 1
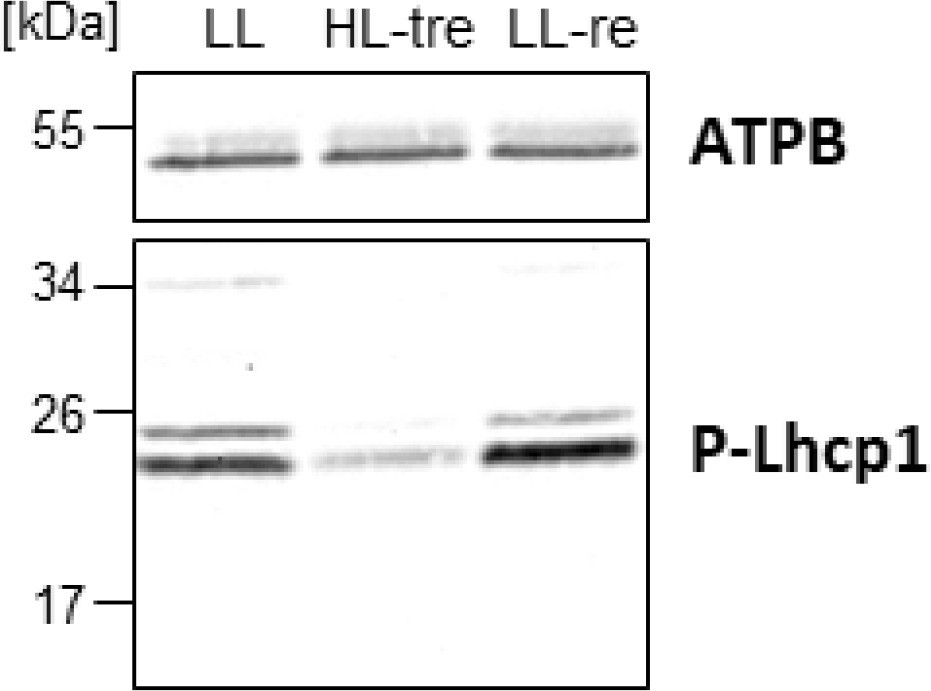
Immunoblot analysis of phospho-Lhcp1.
All conditions were the same as in Figure 11b.
-
Figure 11—figure supplement 1—source data 1
Raw data for Figure 11—figure supplement 1.
- https://cdn.elifesciences.org/articles/84488/elife-84488-fig11-figsupp1-data1-v2.zip
Figure 11—figure supplement 2
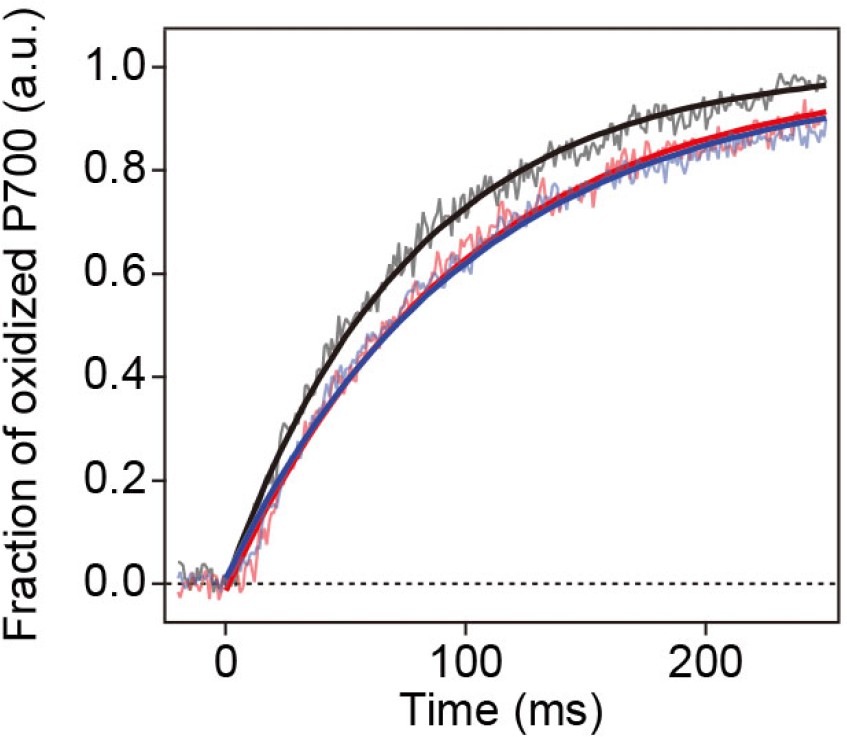
Light-induced P700 oxidation kinetics measured under 22 µmol photon m–2 s–1.
All conditions were the same as in Figure 11c.
-
Figure 11—figure supplement 2—source data 1
Quantitative data for Figure 11—figure supplement 2.
- https://cdn.elifesciences.org/articles/84488/elife-84488-fig11-figsupp2-data1-v2.zip
Author response image 1
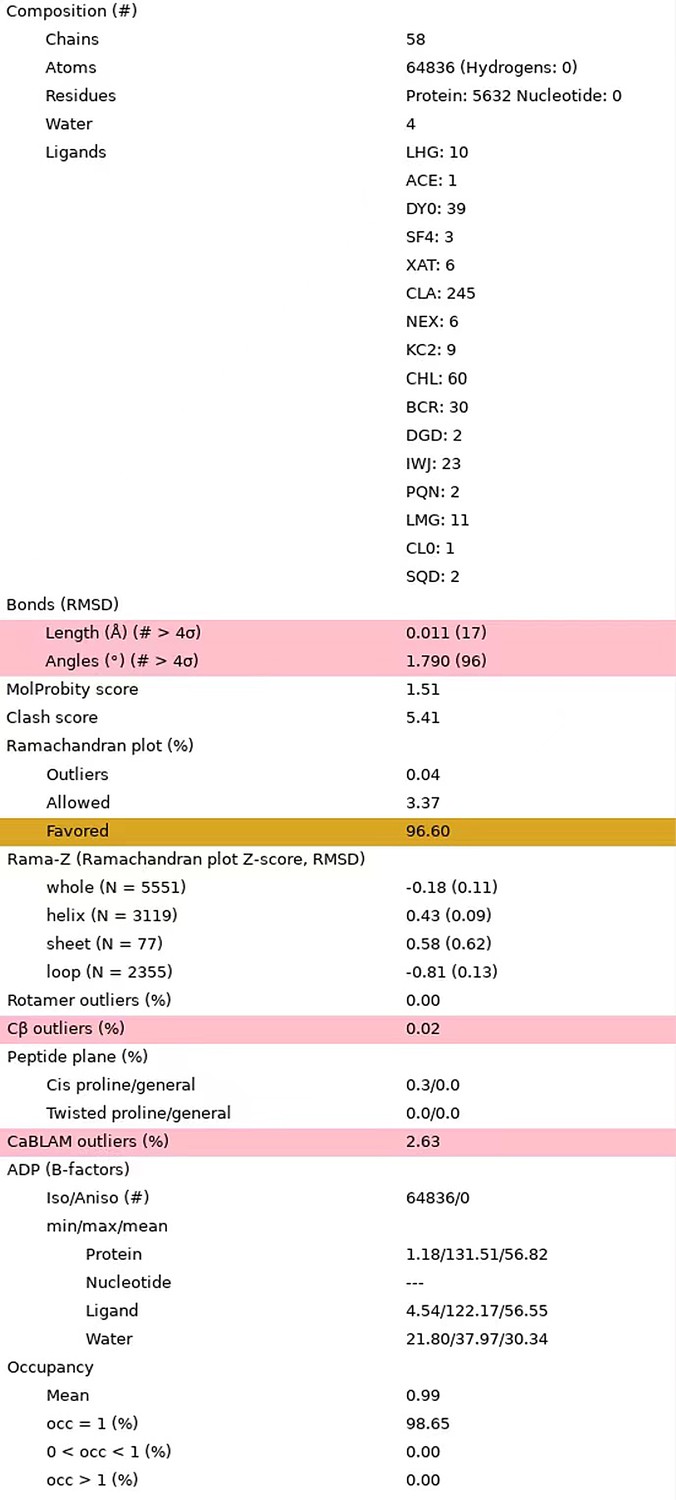
Statistics of the updated structural model.
The statistical data were reported by the MolProbity in Phenix program.
Author response image 2
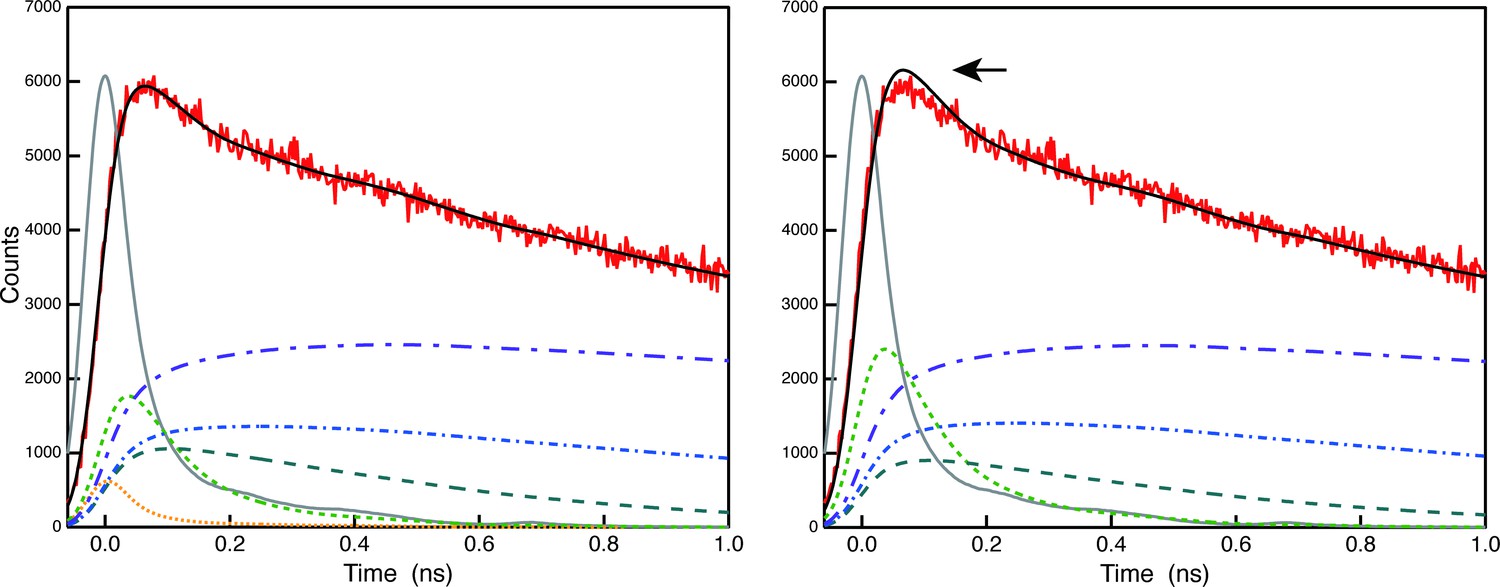
Comparison of deconvolution analysis of the raw 683 nm decay curve of A3 (red) with (left) and without (right) the 5 ps component.
Author response image 3
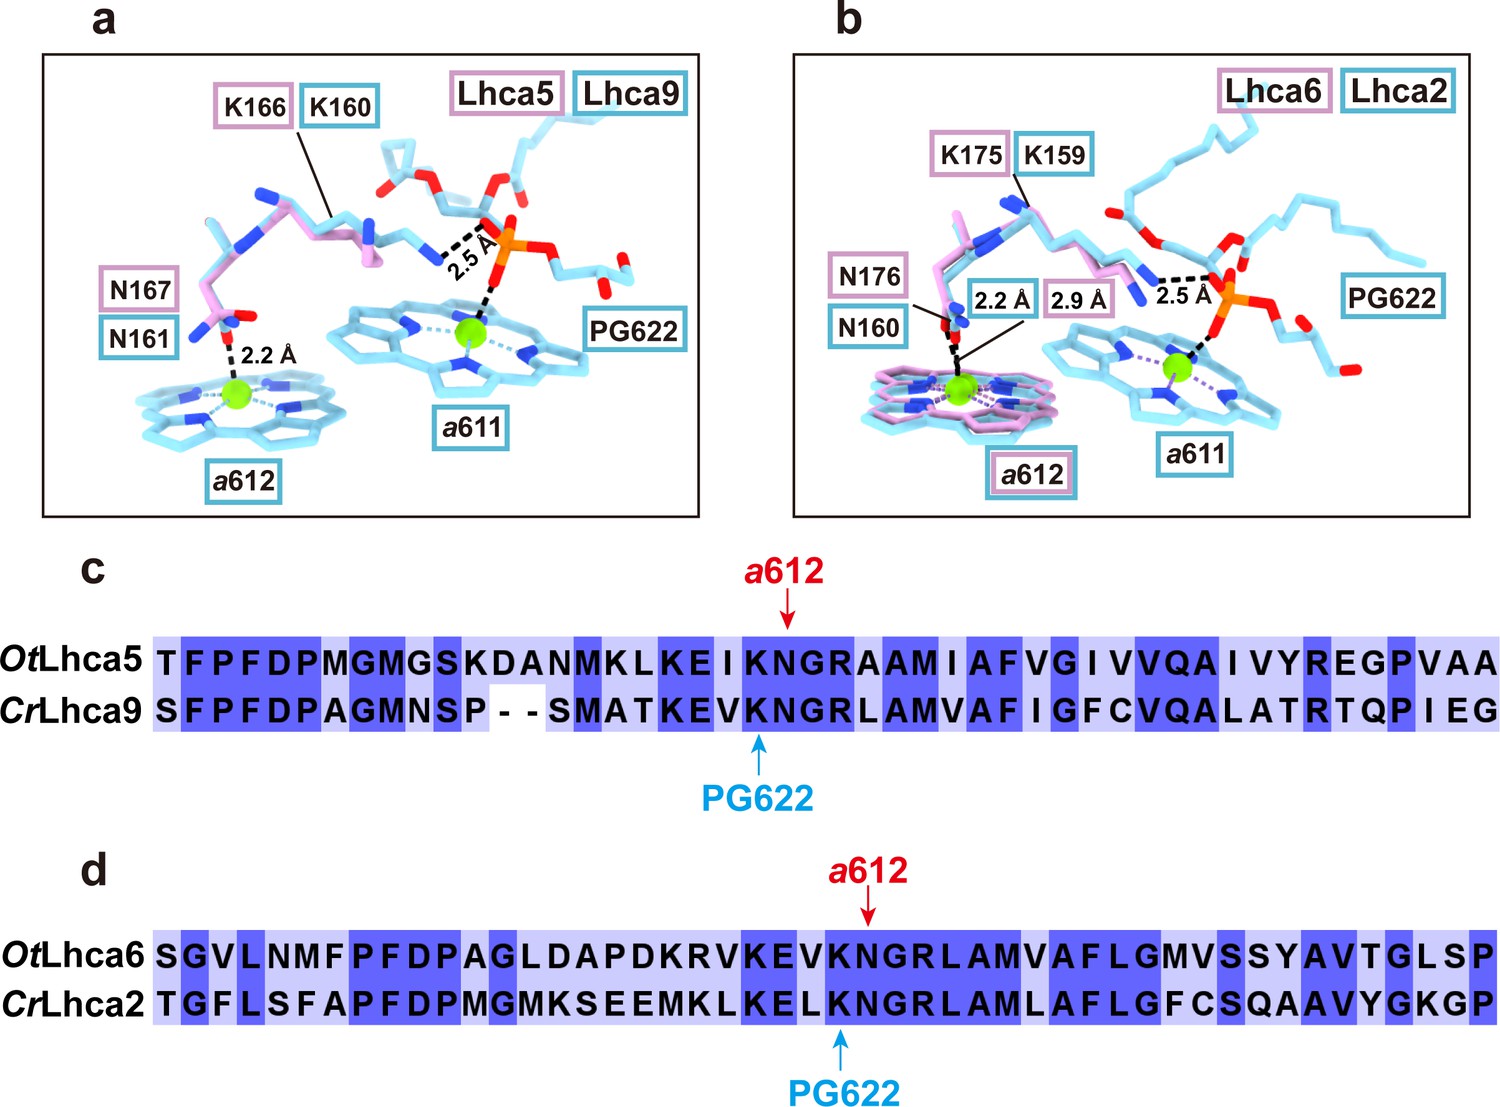
Comparison of Chl a611-a612 dimer in Lhca5/6 and Lhca9/2 complexes from O. tauri and C. reinhardtii respectively.
a and b. Comparison of the Chl a611-a612 dimers and their local environments in OtLhca5/CrLhca9 subunit (a) and OtLhca6/CrLhca2 subunit. The protein and cofactors are shown as sticks model. Color code: pink, O. tauri; light blue, C. reinhardtii. Note that Chl a611 and a612 are not observed in OtLhca5, while Chl a611 is not observed in OtLhca6 but Chl a612 of OtLhca6 can be located. PG, phosphatidylglycerol. c and d. Sequence alignment analysis of Lhca5/9 (c) and Lhca6/2 (d) from the O. tauri and C. reinhardtii. The red arrow indicates the conserved residues serving as the axial ligands for Chl a612. The light blue arrow indicates the lysine residues involved in binding the phosphate group of the PG molecule (PG622) which serves as the axial ligand of Chl a611.
Author response image 4
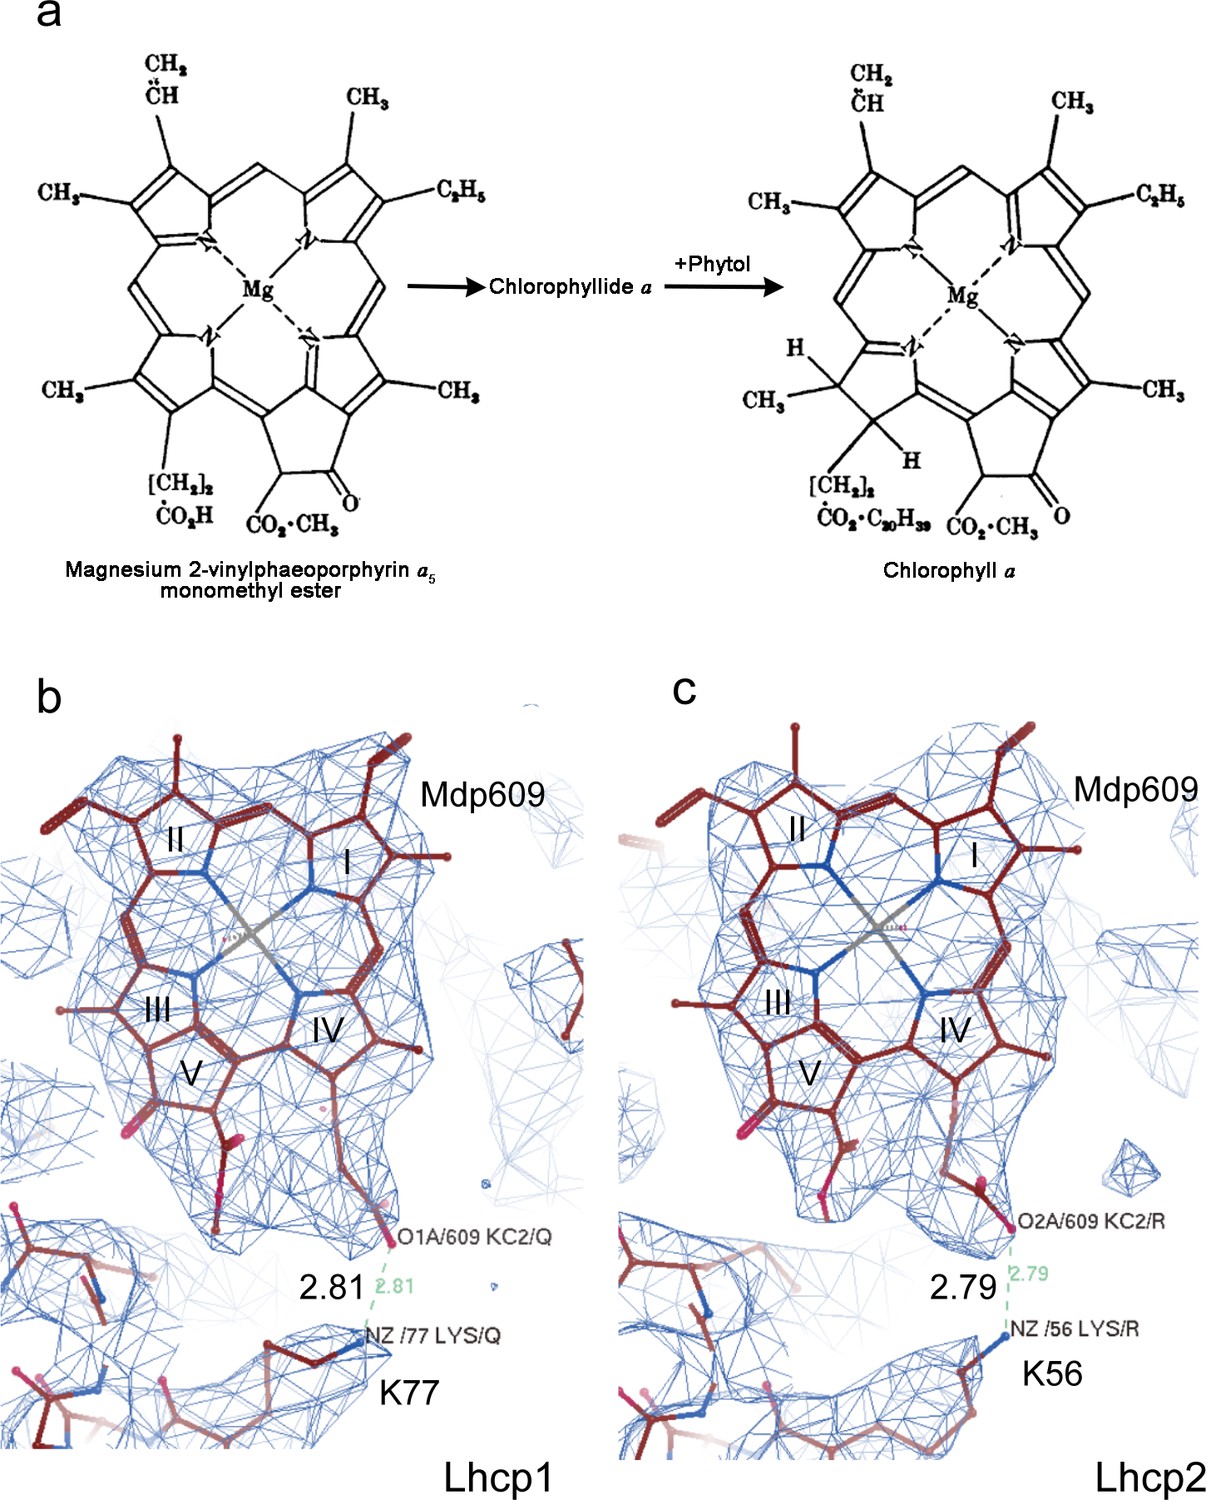
Cryo-EM density of Mdp609 and its interaction with nearby Lys77/56 of OtLhcp1/2 respectively.
residue. a, The chemical structures of Mdp and Chl a. The figure is adapted from Jones, O. T. G. Biochem. J. 89, 182 (1963). b and c, Cryo-EM density of Mdp609 in Lhcp1 (c) / Lhcp2 (d) and nearby Lys residues. The number labeled nearby the dash line indicate the distance (Å) between the adjacent group of Mdp609 and Lys77/56.
Tables
Table 1
Pigment composition in the A3L fraction as revealed by UPLC analysis.
Mean (±STD, n=3).
| Pigment | Molar ratio (Chl a=100) |
|---|---|
| Chl b | 36.2 (±0.1) |
| β-Carotene | 13.4 (±0.5) |
| Mdp | 3.8 (±0.1) |
| Uriolide | 4.9 (±0.1) |
| Prx | 11.8 (±0.1) |
| Nex | 3.6 (±0.1) |
| Vio | 3.3 (±0.1) |
| Micromonal | 2.3 (±0.1) |
| Dlt | 2.2 (±0.1) |
Table 2
Two-dimensional classification of the photosystem I (PSI) particles in the A3 and A3L fractions.
The RELION 2.1 package (Kimanius et al., 2016) was used for automated particle picking of particles and Two-dimensional (2D) classification into 50 classes as previously described (Watanabe et al., 2019). Classes of poor quality due to aggregation, contamination, micrograph edge, or extreme proximity were discarded. 2D classification was performed on the PSI particles and manually assigned to respective small and large PSI supercomplexes.
| Fraction | A3 | A3L |
|---|---|---|
| Small PSI (PSI-LHCI) | 2675 (100%) | 1030 (30%) |
| Large PSI (PSI-LHCI-Lhcp) | 2437 (70%) | |
| Total PSI particles | 2675 | 3467 |
Table 3
Statistics of structural analysis of the OtPSI-LHCI-Lhcp supercomplex.
| OtPSI-LHCI-Lhcp | |
|---|---|
| Data collection and processing | |
| Magnification | 130,000 |
| Voltage (kV) | 300 |
| Electron exposure (e- Å–2) | 60 |
| Defocus range (μm) | from –1.8 to –2.2 |
| Pixel size (Å) | 1.04 |
| Symmetry imposed | C1 |
| Initial particle images (no.) | 5,288,217 |
| Final particle images (no.) | 80,366 |
| Map resolution (Å) | 2.94 |
| FSC threshold | 0.143 |
| Map resolution range (Å) | 2.3–4.3 |
| Refinement | |
| Initial model used (PDB code) | 5ZJI, 7D0J |
| Model resolution (Å) | 3.0 |
| FSC threshold | 0.5 |
| Map sharpening B factor (Å2) | –110.961 |
| Model composition | |
| Nonhydrogen atoms | 64,836 |
| Protein residues | 5632 |
| Ligands | 450 |
| B factor (Å2) | |
| Protein | 56.82 |
| Ligand | 56.55 |
| R.m.s. deviations | |
| Bond lengths (Å) | 0.011 |
| Bond angles (°) | 1.79 |
| Validation | |
| MolProbity score | 1.51 |
| Clash score | 5.41 |
| Poor rotamers (%) | 0 |
| Ramachandran plot | |
| Favored (%) | 96.6 |
| Allowed (%) | 3.37 |
| Outliers (%) | 0.04 |
Table 4
Summarization of the components in the final structural model of the OtPSI-LHCI-Lhcp supercomplex.
| Subunit | Number of amino acid residues traced | Chlorophylls | Carotenoids | Lipids | Others |
|---|---|---|---|---|---|
| PsaA | 742 | 44 Chl a 1 Cl0 | 6 BCR | 2 PG 2 MGDG 1 DGDG | 1 PQN 1 Fe4S4 |
| PsaB | 732 | 40 Chl a | 8 BCR | 1 PG 1 DGDG | 1 PQN |
| PsaC | 80 | 2 Fe4S4 | |||
| PsaD | 143 | ||||
| PsaE | 62 | ||||
| PsaF | 165 | 3 Chl a | 1 BCR | ||
| PsaG | 95 | 3 Chl a | 1 BCR | ||
| PsaH | 96 | 3 Chl a | 1 SQDG | ||
| PsaI | 35 | 1 BCR | |||
| PsaJ | 41 | 1 Chl a | 1 BCR | 2 MGDG | |
| PsaK | 87 | 4 Chl a | 3 BCR | 1 PG | |
| PsaL | 158 | 5 Chl a | 4 BCR | 1 PG 1 MGDG | |
| PsaM | 31 | ||||
| PsaN | 91 | 2 Chl a | |||
| PsaO | 96 | 5 Chl a | 2 DLT | 2 MGDG | |
| Trimer 2 | 201(Lhcp2) | 8 Chl a 5 Chl b 1 DVP | 2 PRX 4 DLT 1 NEX | ||
| 225(Lhcp1) | 8 Chl a 5 Chl b 1 DVP | 2 PRX 4 DLT 1 NEX | |||
| 201(Lhcp2) | 8 Chl a 5 Chl b 1 DVP | 2 PRX 4 DLT 1 NEX | |||
| Trimer 1 | 202(Lhcp2) | 8 Chl a 5 Chl b 1 DVP | 2 PRX 4 DLT 1 NEX | ||
| 201(Lhcp2) | 8 Chl a 5 Chl b 1 DVP | 2 PRX 4 DLT | |||
| 201(Lhcp2) | 8 Chl a 5 Chl b 1 DVP | 1 BCR 2 PRX 3 DLT | |||
| Trimer 3 | 201(Lhcp2) | 8 Chl a 5 Chl b 1 DVP | 1 BCR 2 PRX 3 DLT | ||
| 200(Lhcp2) | 8 Chl a 5 Chl b 1 DVP | 2 PRX 4 DLT 1 NEX | |||
| 200(Lhcp2) | 8 Chl a 5 Chl b 1 DVP | 1 PRX 4 DLT | |||
| Lhca1 | 195 | 9 Chl a 2 Chl b | 1 XAT 1 PRX | ||
| Lhca2 | 205 | 11 Chl a 4 Chl b | 1 XAT 1 BCR 1 DLT 1 PRX | 1 PG 1 MGDG | |
| Lhca3 | 227 | 13 Chl a 1 Chl b | 1 XAT 3 BCR 1 PRX | 3 PG 1 MGDG | |
| Lhca4 | 205 | 11 Chl a 4 Chl b | 1 XAT 1 BCR 1 PRX | ||
| Lhca5 | 185 | 9 Chl a 1 Chl b | 1 XAT 1 PRX | 1 MGDG | |
| Lhca6 | 218 | 10 Chl a 3 Chl b | 1 XAT 1 PRX | 1 PG 1 MGDG 1 SQDG | |
| Chain Y | 4 H2O |
Table 5
Calculated FRET rates between Lhcp and photosystem I (PSI) core pigment pairs.
In each row of the pigment pair column, on either side of the arrow, the first letter, the second value, and the third subscript represent the Chl species, the Chl number, and the polypeptide chain, respectively.
| Pigment pair | FRET rate kFRET (ps–1) | Distance R (Å) | Dipole orientation factor Κ2 | Chl a – Chl a pair |
|---|---|---|---|---|
| b605Q → a305L | 0.27 | 13.53 | 1.00 | No |
| b605W → a2004O | 0.29 | 13.98 | 1.28 | No |
| b608Q → a224H | 0.19 | 16.56 | 2.38 | No |
| a612W → a201K | 0.29 | 16.24 | 0.95 | Yes |
| a614R → b606Lhca6 | 0.02 | 17.39 | 0.35 | No |
| b605T → a2003O | 0.05 | 16.84 | 0.66 | No |
| a610W → a201K | 0.00 | 18.46 | 0.01 | Yes |
| Mdp609Q → a224H | 0.01 | 19.08 | 1.36 | No |
| b606Q → a224H | 0.03 | 19.28 | 0.80 | No |
| b617T → a2004O | 0.05 | 19.40 | 1.63 | No |
| a612R → b606Lhca6 | 0.00 | 18.87 | 0.70 | No |
| b617W → a203K | 0.06 | 19.75 | 2.02 | No |
| b617W → a204K | 0.05 | 20.00 | 1.83 | No |
| a612R → a610Lhca6 | 0.15 | 19.37 | 1.42 | Yes |
| b605T → a2001O | 0.02 | 19.67 | 0.71 | No |
| a611R → a302H | 0.17 | 20.08 | 1.99 | Yes |
| b605Q → a2005O | 0.03 | 21.20 | 1.51 | No |
| b617R → a604Lhca6 | 0.02 | 20.83 | 0.87 | No |
| a611R → a609Lhca6 | 0.05 | 20.79 | 0.70 | Yes |
| b617W → a206K | 0.02 | 20.86 | 0.79 | No |
| b605Q → a224H | 0.01 | 21.37 | 0.79 | No |
| b617W → a2004O | 0.00 | 21.54 | 0.01 | No |
Additional files
-
Supplementary file 1
Polypeptides in the A3 and A3L fractions as identified by MS.
(a) Polypeptides in the A3L fraction (PSI-LHCI-Lhcp supercomplex) as identified by MS analysis. The peptides were evaluated using liquid chomatography tandem mass spectrometry analysis. Detected peptides were analyzed using Mascot ver.2.7.0 (Matrix Science, London W1U 7GB, UK) and Proteome Discoverer software (Thermo Fisher Scientific). Observed: Experimental m/z value, Mr(expet): Experimental m/z transformed to a relative molecular mass, Mr(calc): Relative molecular mass calculated from the matched peptide sequence, Score: The ions score is a value of matching level between product ion peak and calculated fragment by MASCOT. (b) Polypeptides in the A3 fraction (PSI-LHCI supercomplex) as identified by MS analysis. The bands corresponding to Lhca5 and Lhca6 (Bands 2 and 1, respectively) were excised from the SDS-PAGE gel and subsequently subjected to LC-MS/MS analysis following in-gel trypsin digestion, as described in Kubota-Kawai et al., 2019. Detected peptides were analyzed as in (a).
- https://cdn.elifesciences.org/articles/84488/elife-84488-supp1-v2.docx
-
MDAR checklist
- https://cdn.elifesciences.org/articles/84488/elife-84488-mdarchecklist1-v2.docx
Download links
A two-part list of links to download the article, or parts of the article, in various formats.
Downloads (link to download the article as PDF)
Open citations (links to open the citations from this article in various online reference manager services)
Cite this article (links to download the citations from this article in formats compatible with various reference manager tools)
The photosystem I supercomplex from a primordial green alga Ostreococcus tauri harbors three light-harvesting complex trimers
eLife 12:e84488.
https://doi.org/10.7554/eLife.84488


