The CD73 immune checkpoint promotes tumor cell metabolic fitness
- Centre de Recherche du Centre Hospitalier l’Université de Montréal, Canada
- Faculté de Pharmacie, Université de Montréal, Canada
- Institut du Cancer de Montréal, Canada
- McGill Goodman Cancer Research Centre, Canada
Figures
Figure 1 with 4 supplements
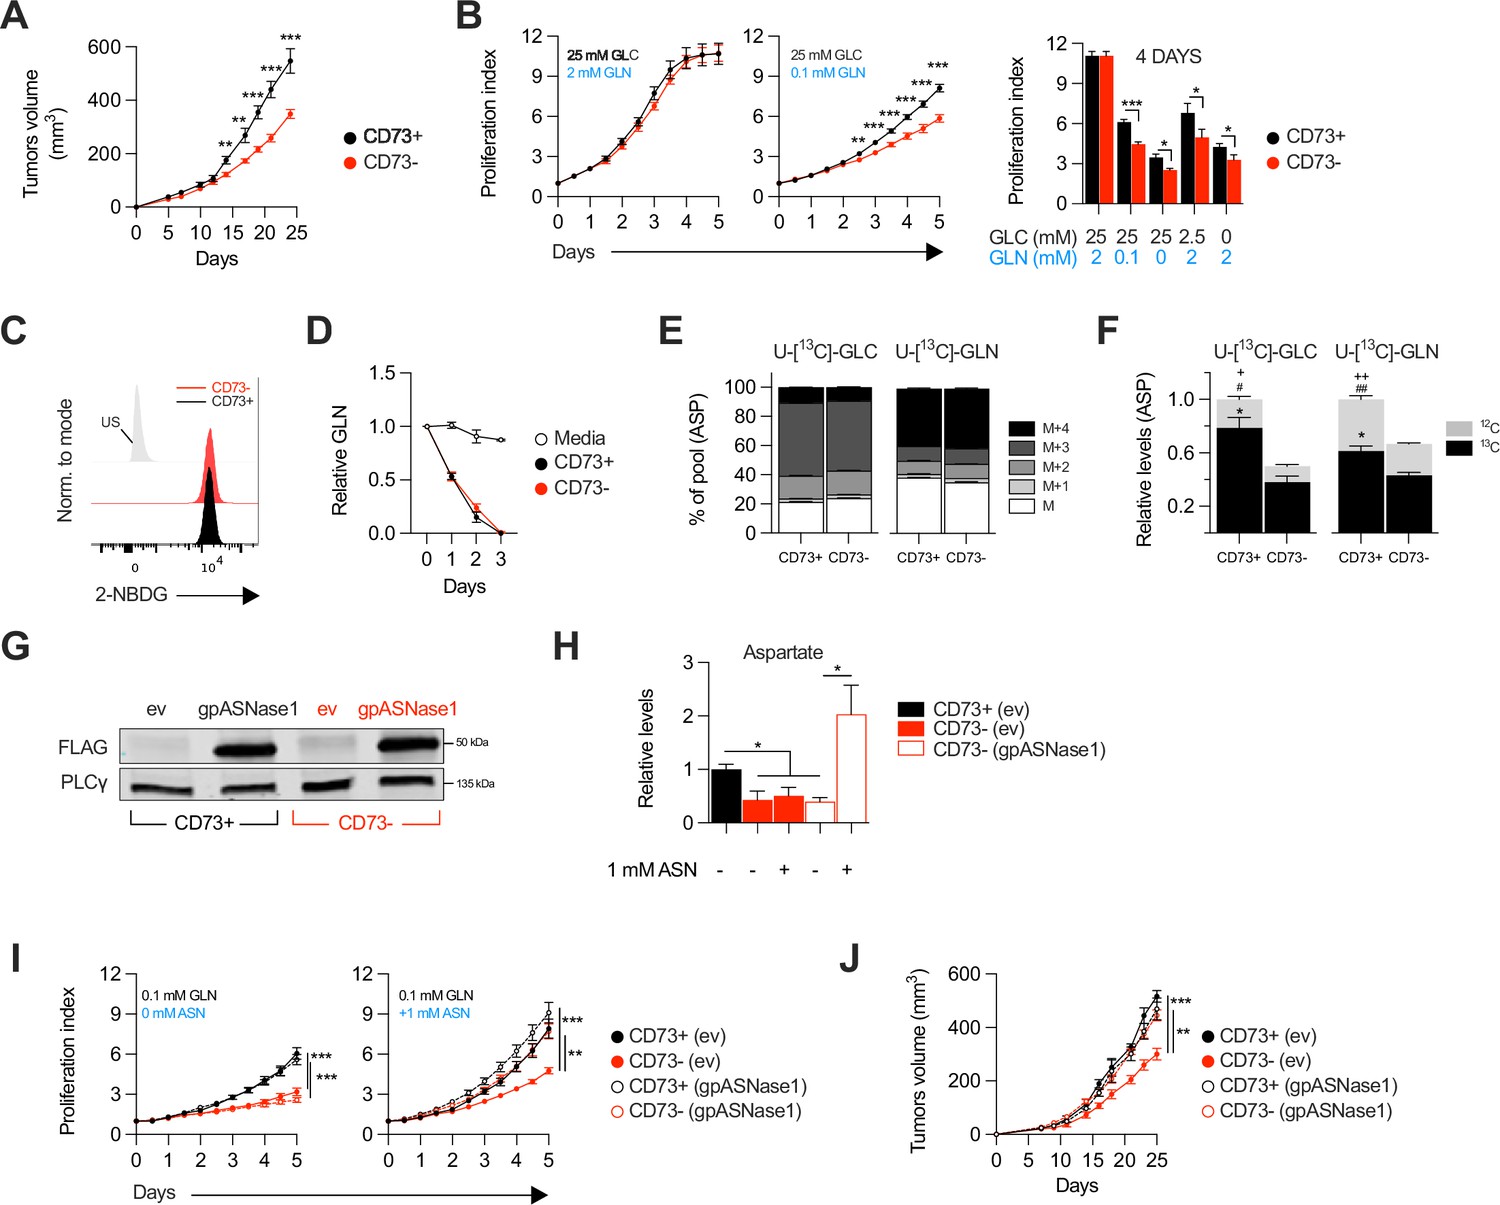
CD73-deficiency delays tumor growth independently from immune suppression through reduced aspartate biosynthesis.
(A) Sub-cutaneous tumor growth of CD73pos (CD73+) and CD73neg (CD73-) MDA-MB-231 tumors in immune-deficient NRG mice. Results shows combined data of two independent experiments cumulating 15 mice per groups. (B) In vitro proliferation of CD73 + and CD73- MDA-MB-231 cells was analyzed by Incucyte live imaging technology in presence of excess or restricted conditions of glucose (GLC) and glutamine (GLN). Data from representative proliferation curves (left panels) and pooled quantification of proliferation after 4 days of culture (right panel) are shown (n=3). (C) FACS analysis of in vitro incorporation of a fluorescent glucose analog (2-NBDG) in CD73 + and CD73- MDA-MB-231 cells (n=3). US = unstained control. (D) Glutamine depletion assay in culture media of MDA-MB-231 CD73 + and CD73- cells measured using a commercial kit (Promega). Cell-free media was used as a control. (E) Mass isotopomer distribution (MID) of U-[13C]-glucose-derived (U-[13C]-GLC; left panel) or U-[13C]-glutamine-derived (U-[13C]-GLN; right panel) aspartate compared between CD73 + and CD73- MDA-MB-231 cells (n=1). M represents the pool of unlabeled aspartate. M+1, M+2, M+3 and M+4 represent the pools of isopotologues labeled with 13C carbon. (F) SITA analysis of glucose (left panel) and glutamine (right panel) contribution to ASP intracellular biosynthesis (n=1). ASP levels were normalized on cell number and are shown relative to CD73 + cells. Stats: *comparison of 13C levels; #Comparison of 12C levels; + Comparison of total 13C+12C levels. (G) Western blot of CD73 + and CD73- MDA-MB-231 cells expressing empty vector (ev) or FLAG-tagged gpASNase1. PLCγ is shown as a loading control. (H) Intracellular ASP levels measured in cells expressing or not (ev) the gpASNase1 upon exposure to exogenous ASN (1 mM) for 24 h. ASP levels were normalized on cell number and are shown relative to CD73+ (ev) cells (n=1). (I) In vitro proliferation of gpASNase1-expressing and non-expressing (ev) MDA-MB-231 cells in presence (right panel) or not (left panel) of exogenous ASN (n=2). (J) In vivo tumor growth of 2×10⁶ gpASNase1-expressing or not (ev) CD73 + and CD73- MDA-MB-231 cells in NRG mice (CD73+ (ev) n=5; CD73- (ev) n=7; CD73+ (gpASNase1) n=8; CD73- (gpASNase1) n=8). Means +/- SEM are shown (*p<0.05; **p<0.01; ***p<0.001 by Student T tests).
-
Figure 1—source data 1
Original raw unedited blots and uncropped blots with the relevant bands labeled that composes Figure 1G.
- https://cdn.elifesciences.org/articles/84508/elife-84508-fig1-data1-v2.zip
-
Figure 1—source data 2
Stable isotope tracing analysis (SITA) raw data for both U-[13C]-glucose and U-[13C]-glutamine tracing in MDA-MB-231 CD73 +and CD73- cells that composes Figure 1E–F and Figure 1—figure supplement 3.
- https://cdn.elifesciences.org/articles/84508/elife-84508-fig1-data2-v2.zip
Figure 1—figure supplement 1
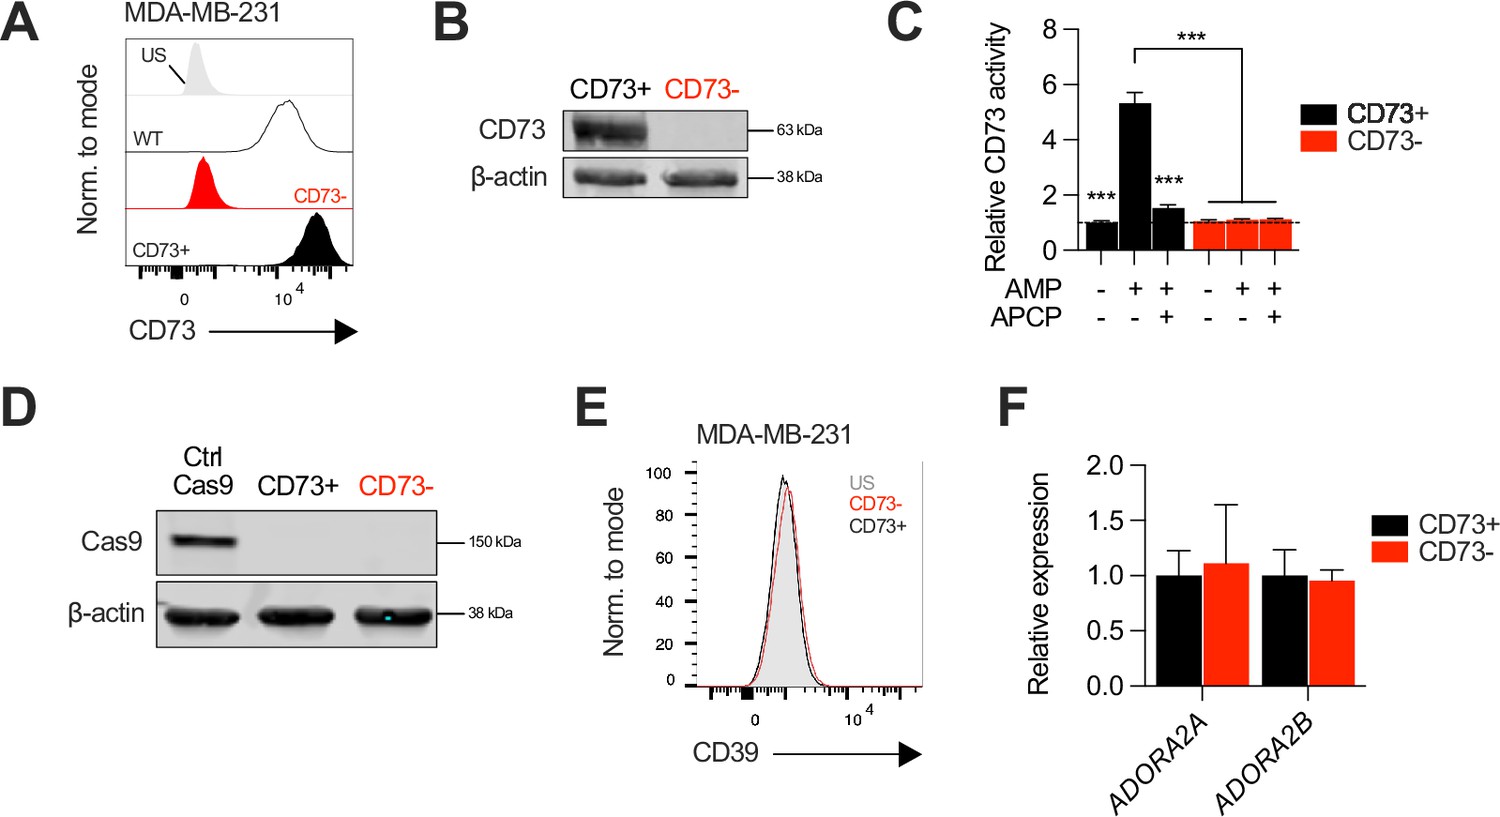
Generation of CD73-knockout MDA-MB-231 cell line.
(A-C) Knockout efficiency of CD73 on MDA-MB-231 cells following CRISPR-Cas9 gene edition. Cell sorting enrichment was confirmed by cell surface (A); FACS. US = unstained control and total (B); western blot CD73 expression. (C) Analysis of CD73 hydrolyzing enzymatic activity using malachite green assay compared between CD73 + and CD73- MDA-MB-231 cultures. APCP = CD73 inhibitor. (D) Western blot validating transient Cas9 expression in MDA-MB-231 cells. (E) CD39 surface protein expression levels on CD73 + and CD73- MDA-MB-231 cells analyzed by FACS. (F) A2a (ADORA2A) and A2b (ADORA2B) gene expression at the mRNA levels in CD73- MDA-MB-231 cells shown relative to CD73 + cells. Means +/- SEM are shown (***p<0.01 two-way ANOVA).
-
Figure 1—figure supplement 1—source data 1
Original raw unedited blots and uncropped blots with the relevant bands labeled that composes Figure 1—figure supplement 1B, D.
- https://cdn.elifesciences.org/articles/84508/elife-84508-fig1-figsupp1-data1-v2.zip
Figure 1—figure supplement 2
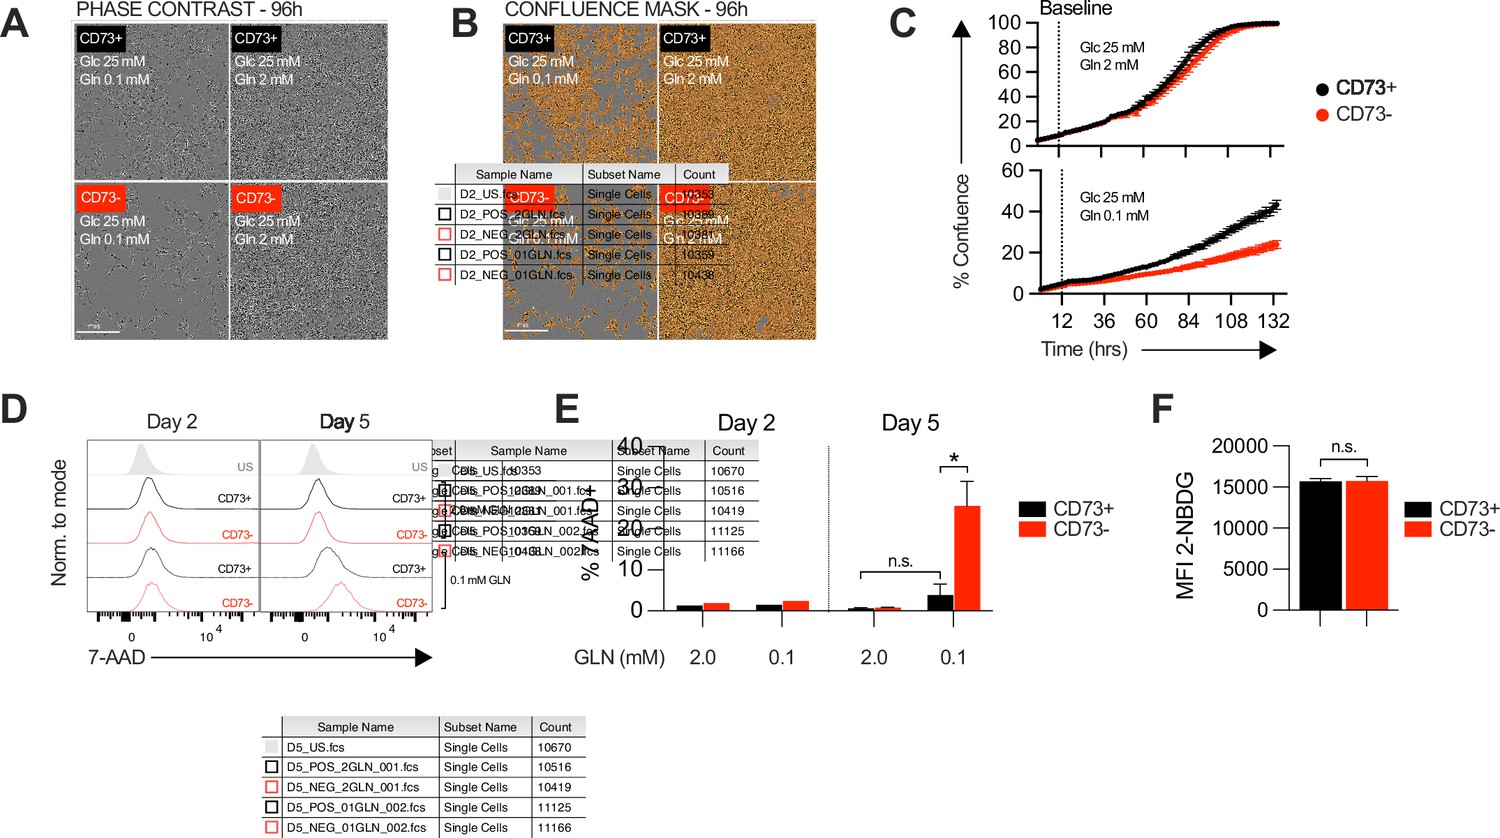
In vitro proliferation and viability analysis of CD73 + and CD73- MDA-MB-231 cells.
(A-B) Examples of in vitro proliferation imaging in presence of excess (2 mM) or limited (0.1 mM) amount of glutamine (Gln) measured using Incucyte technology. Proliferation was quantified by measuring confluence level at different timepoints. (A) Phase contrast representative images of CD73 + and CD73- MDA-MB-231 cell cultures 72 hr after initiation of assay. (B) Same images (as in A) with a confluence mask applied. (C) Percentage of well confluence over time (0–5 days). Cells were seeded in regular complete media for 8–12 hr before being switched to assay media (excess or limited Gln), which is defined as baseline confluence (dashed line). Proliferation index (Figure 1B) is expressed as a ratio of increased confluence every 0.5 days relative to baseline. (D) Analysis of viability analyzed by FACS with 7-AAD staining in CD73 + and CD73- MDA-MB-231 cells cultured in presence of excess (2 mM) or limited (0.1 mM) amount of glutamine (Gln) for 5 days. (E) Quantification of 7-AAD + cells analyzed by FACS shown in panel (D, F) MFI quantification of 2-NBDG uptake as displayed in Figure 1C. Means +/- SEM are shown (*p<0.05 by one-way ANOVA).
Figure 1—figure supplement 3
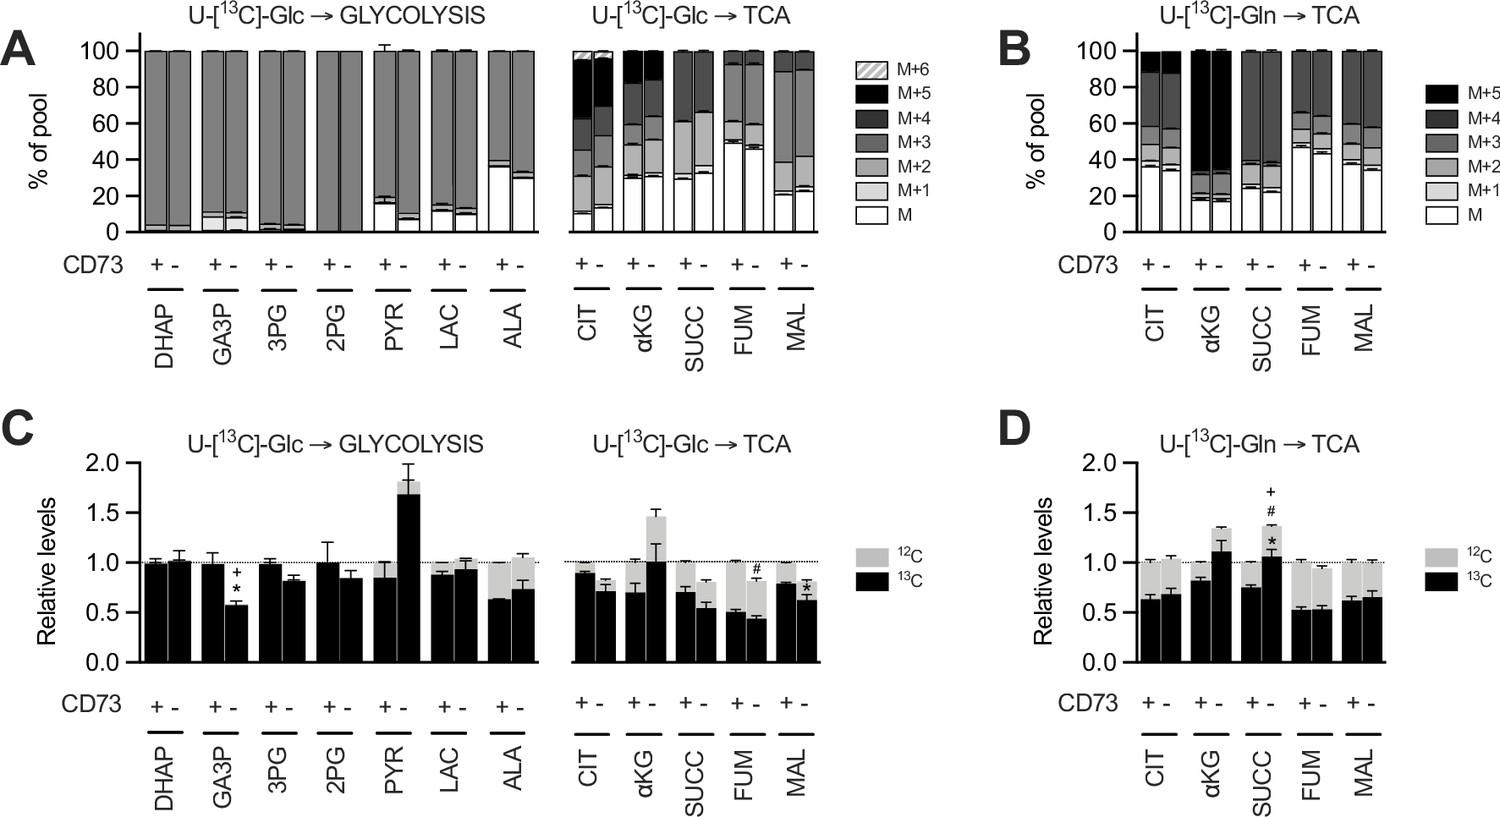
Glucose and glutamine SITA and transcriptional analysis of TCA cycle enzymes in MDA-231 cells.
(A-D) Mass isotopomer distribution (MID) of U-[13C]-glucose-derived (U-[13C]-GLC; A) or U-[13C]-glutamine-derived (U-[13C]-GLN; B) glycolysis or TCA cycle metabolites compared between CD73 +and CD73- MDA-MB-231 cells (n=1). M represents the pool of unlabeled metabolites. M+1 to M+6 represent the pools of isopotologues labeled with 13C carbon for each metabolite. Glucose (C) and glutamine (D) contribution to glycolytic and TCA intermediates. 13C and 12C represent the contribution of labeled and unlabeled glucose or glutamine respectively to each metabolite. Metabolites levels (C–D) were normalized on cell number and are shown relative to CD73 + cells (n=1 per tracer). Stats: *comparison of 13C levels; #Comparison of 12C levels;+Comparison of total 13C+12C levels. Means +/- SEM are shown (*p<0.05; ***p<0.001 by Student T tests (C–D)).
Figure 1—figure supplement 4

CD73 expression and enzymatic activity in gpASNase1-expressing MDA-MB-231 cells.
(A) CD73 surface protein expression levels on MDA-MB-231 CD73 +and CD73- cells transfected with pLHCX-ev or pLHCX-gpASNase1 plasmids. (B) CD73 enzymatic activity analyzed as in panel (C) compared between CD73+ (ev), CD73- (ev) and CD73- (gpASNase1) MDA-MB-231 cultures. Means +/- SEM are shown (***p<0.01 two-way ANOVA).
Figure 2 with 3 supplements
CD73 regulates metabolic fitness of cancer cells independently from adenosine signaling.
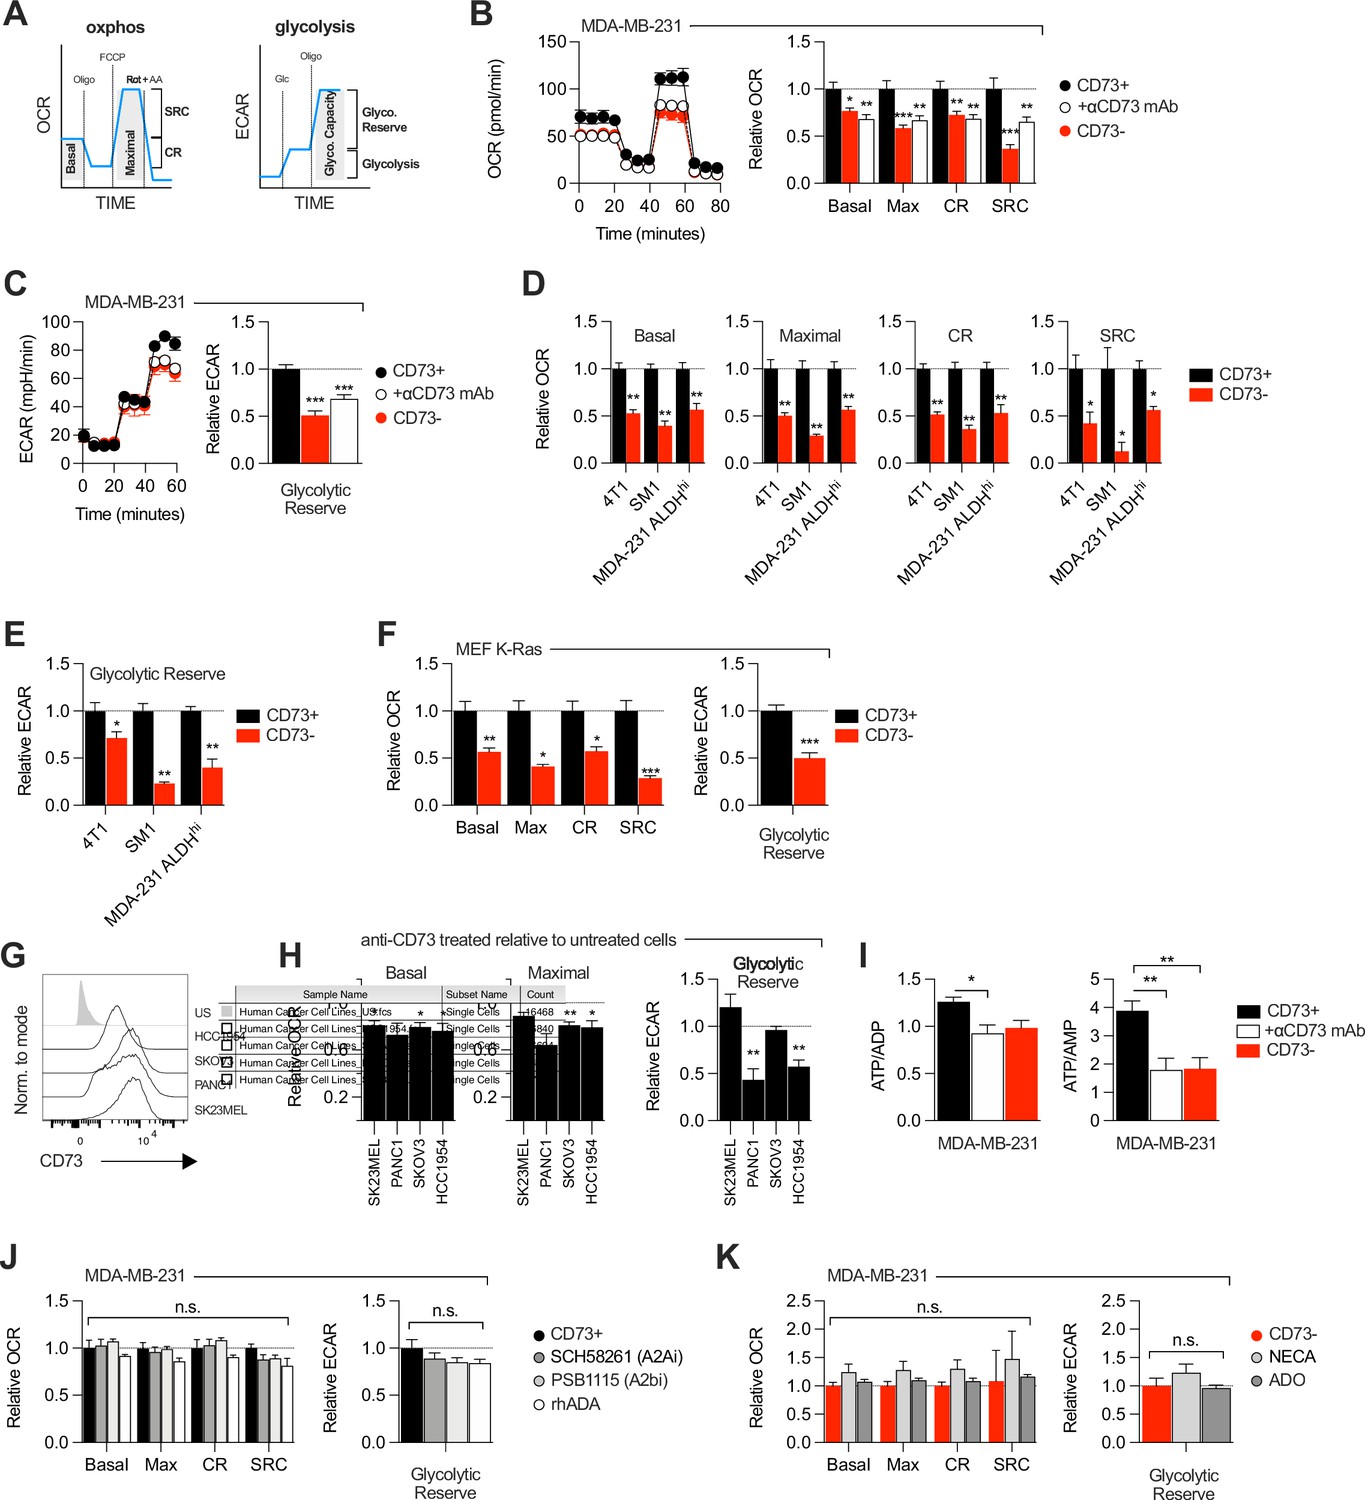
(A) Schematized metabolic profiling and parameters generated on a Seahorse analyzer. OXPHOS and glycolytic parameters were calculated using Agilent calculator tool. Rot = rotenone, AA = antimycin A, Oligo = oligomycin, Glc = glucose, OCR = oxygen consumption rate, ECAR = extracellular acidification rate, SCR = spare respiratory capacity which represents the difference between maximal OCR and basal OCR (indicator of cell fitness/flexibility), CR = coupled-respiration which represents the decrease of basal respiration upon inhibition of ATP synthase (indicator of basal respiration used for ATP production to meet energetic needs of the cells). (B) OXPHOS profile (left panel) and parameters (right panel) of CD73pos (CD73+;+/-1 μg/mL anti-CD73 mAb 7G2 for 48 hr) and CD73neg (CD73-) MDA-MB-231 cells. OXPHOS parameters are shown relative to CD73 + cells from pooled experiments (n=3). (C) Glycolytic profile (left panel) and glycolytic reserve (right panel) of CD73+ (+/-1 μg/mL anti-CD73 mAb 7G2 for 48 hr) and CD73- MDA-MB-231 cells. Glycolytic reserve is shown relative to CD73 + cells from pooled experiments (n=3). (D–E) Oxphos parameters (D) and glycolytic reserve (E) compared between various CD73-expressing and CD73 CRISPR-knockout cell lines. ALDHhi cells were sorted from MDA-MB-231 cells using the Aldefluor kit. Data are shown relative to CD73 + cells (MDA-231 ALDHhi n=1, 4T1 and SM1 LWT1 n=2). (F) OXPHOS parameters (left panel) and glycolytic reserve (right panel) compared between primary MEF isolated from WT and CD73-/- C57BL/6 mice and transformed with an oncogenic K-Ras. Data are shown relative to WT cells (n=2). (G) CD73 expression profile on various human cancer cell lines analyzed by FACS. US = unstained control. (H) OXPHOS parameters (left and middle panels) and glycolytic reserve (right panel) of anti-CD73 mAb (7G2)-treated cells compared to untreated cells. Data are shown relative to respective untreated cells (n=1 per cell line). (I) LC-MS analysis of total intracellular levels of ATP/ADP and ATP/AMP ratios in CD73+ (+/-1 μg/mL anti-CD73 mAb 7G2 for 48 h) and CD73- MDA-MB-231 cells (n=2). (J) OXPHOS parameters (left panel) and glycolytic reserve (right panel) of CD73 + MDA MB-231 cells treated with either A2A inhibitor SCH 58261, A2B inhibitor PSB 1115 or human recombinant ADA. Data are shown relative to untreated CD73 + cells (A2ai and A2bi n=2, rhADA n=1). (K) OXPHOS parameters (left panel) and glycolytic reserve (right panel) of NECA- or ADO-treated CD73- MDA-MB-231 cells. Data are shown relative to untreated CD73- cells (NECA n=2, ADO n=1). Means +/- SEM are shown (*p<0.05; **p<0.01; ***p<0.001 by Student T tests).
Figure 2—figure supplement 1
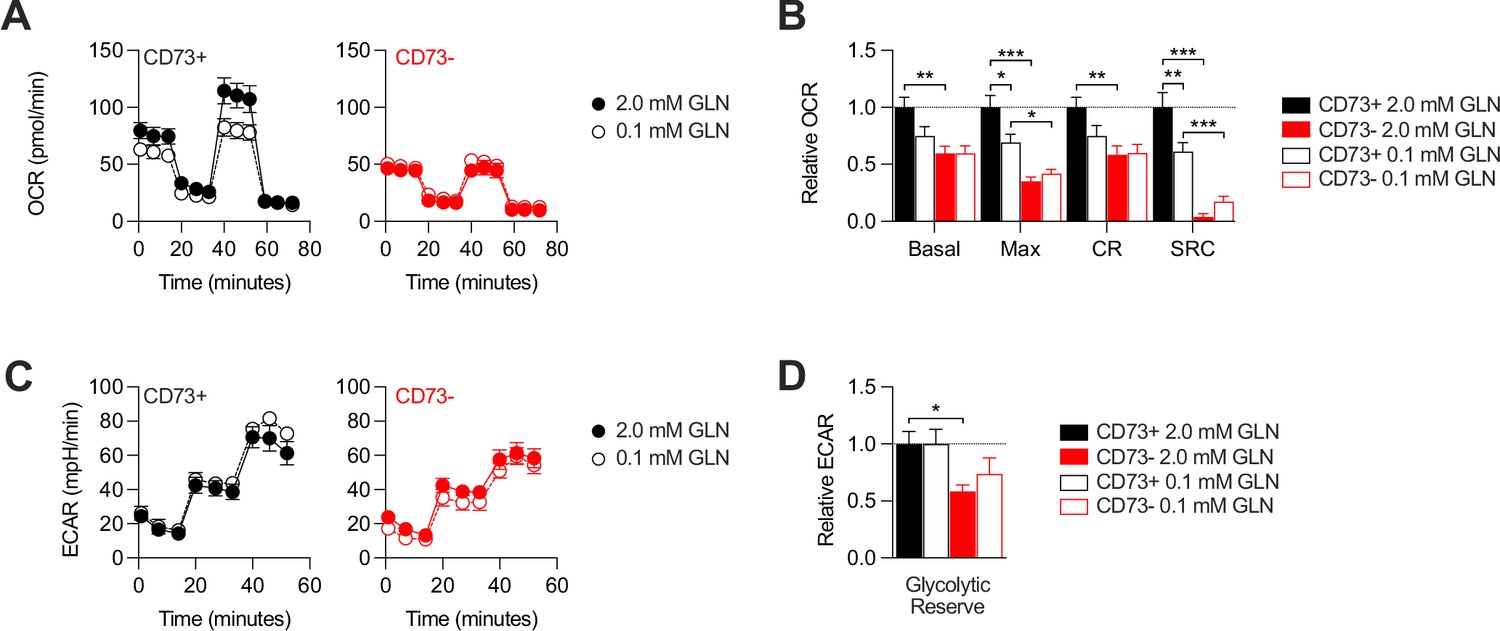
CD73-deficient MDA-MB-231 cells retain impaired metabolic flexibility in glutamine-limiting conditions.
CD73 + and CD73- MDA-MB-231 cells were analyzed on a seahorse instrument as in Figure 2 but in presence of either excess (2.0 mM) or limiting amount (0.1 mM) of glutamine in seahorse media. (A–B) OXPHOS profiles (A) and parameters (B) of CD73+ (left panel) and CD73- (right panel) cells assayed in 2.0 mM or 0.1 mM glutamine. OXPHOS parameters are shown relative to CD73 + cells assayed in 2.0 mM glutamine media from pooled experiments (n=2). (C–D) Glycolytic profile (C) and glycolytic reserve (D) of CD73+ (left panel) and CD73- (right panel) cells assayed in 2.0 mM or 0.1 mM glutamine. Glycolytic reserve is shown relative to CD73 + cells assayed in 2.0 mM glutamine media from pooled experiments (n=2). Means +/- SEM are shown (*p<0.05; **p<0.01; ***p<0.001 by one-way ANOVA).
Figure 2—figure supplement 2
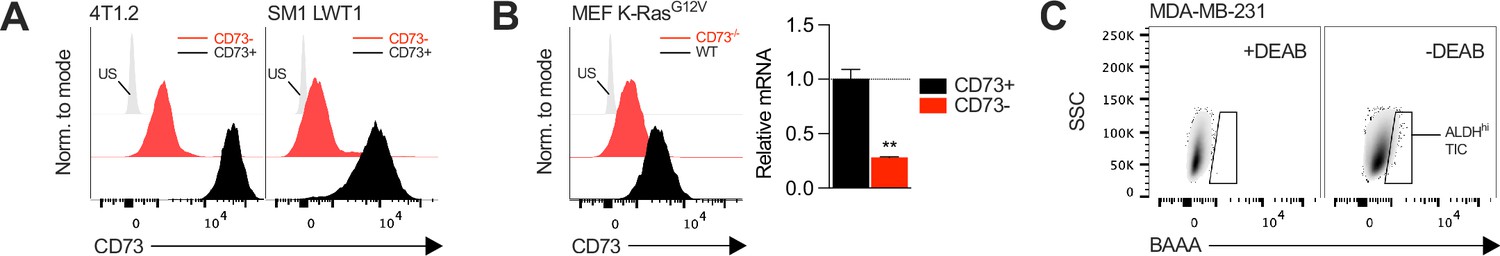
Generation of CD73-knockout cancer cell lines.
(A) Knockout efficiency of CD73 on 2 mouse cancer cell lines (4T1.2 and SM1 LWT1) following CRISPR-Cas9 Nt5e gene edition. Cell sorting enrichment was confirmed by FACS. (B) Mouse embryoblastic fibroblasts (MEF) were derived from WT and Nt5e-/- C57BL/6 mice and transformed with an oncogenic K-Ras in vitro. Emerging transformed clones were subsequently isolated by sub-culture and analyzed for CD73 surface protein expression and Nt5e gene expression (n=2). (C) Gating strategy for MDA-MB-231 TIC sorting based on ALDH-mediated conversion of fluorescent BAAA. The gating is defined in presence of DEAB according to manufacturer protocol, an inhibitor of ALDH enzymatic activity. Means +/- SEM are shown (**p<0.01 by Student T tests).
Figure 2—figure supplement 3
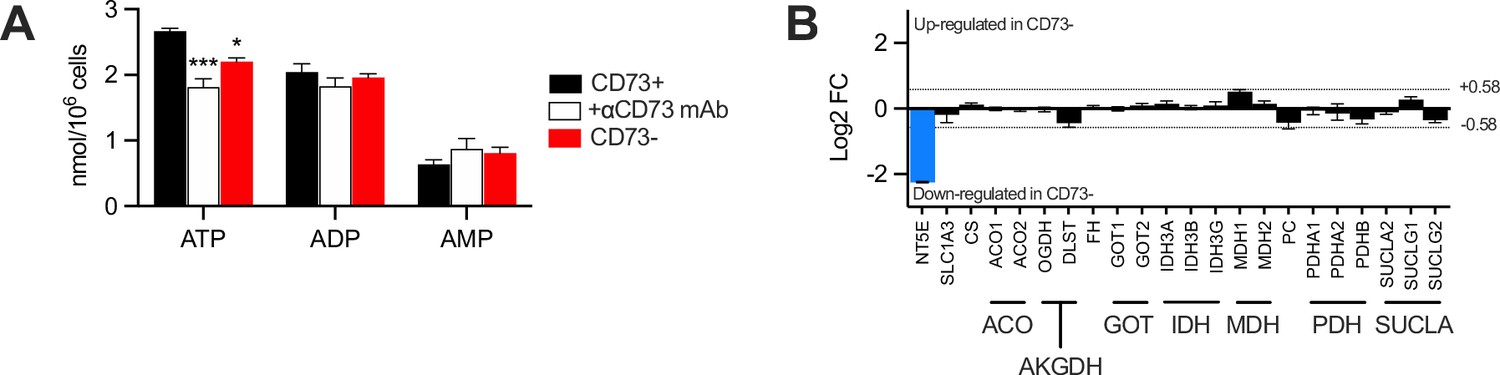
Intracellular ATP, ADP and AMP metabolites measurement and transcriptional analysis of metabolic enzymes in MDA-MB-231 CD73 +and CD73- cells.
(A) Absolute intracellular levels of total ATP, ADP, and AMP metabolites measured in CD73 +and CD73- MDA-MB-231 cells by LC-MS (complement to Figure 2I). (B) Transcriptional analysis by microarray of TCA enzymes showing gene regulation (Log2 of fold change; FC) in CD73- compared to CD73 +MDA MB-231 cells. Dashed line show threshold of 1.5-fold change (+/-0.58 Log2 of FC). CD73 (NT5E; blue bar) is shown as an internal control (n=1). Means +/- SEM are shown (*p<0.05; ***p<0.001 by Student T tests (A) or Spearman correlation (B)).
-
Figure 2—figure supplement 3—source data 1
Raw microarray data that composes Figure 2—figure supplement 3B.
- https://cdn.elifesciences.org/articles/84508/elife-84508-fig2-figsupp3-data1-v2.zip
Figure 3 with 1 supplement
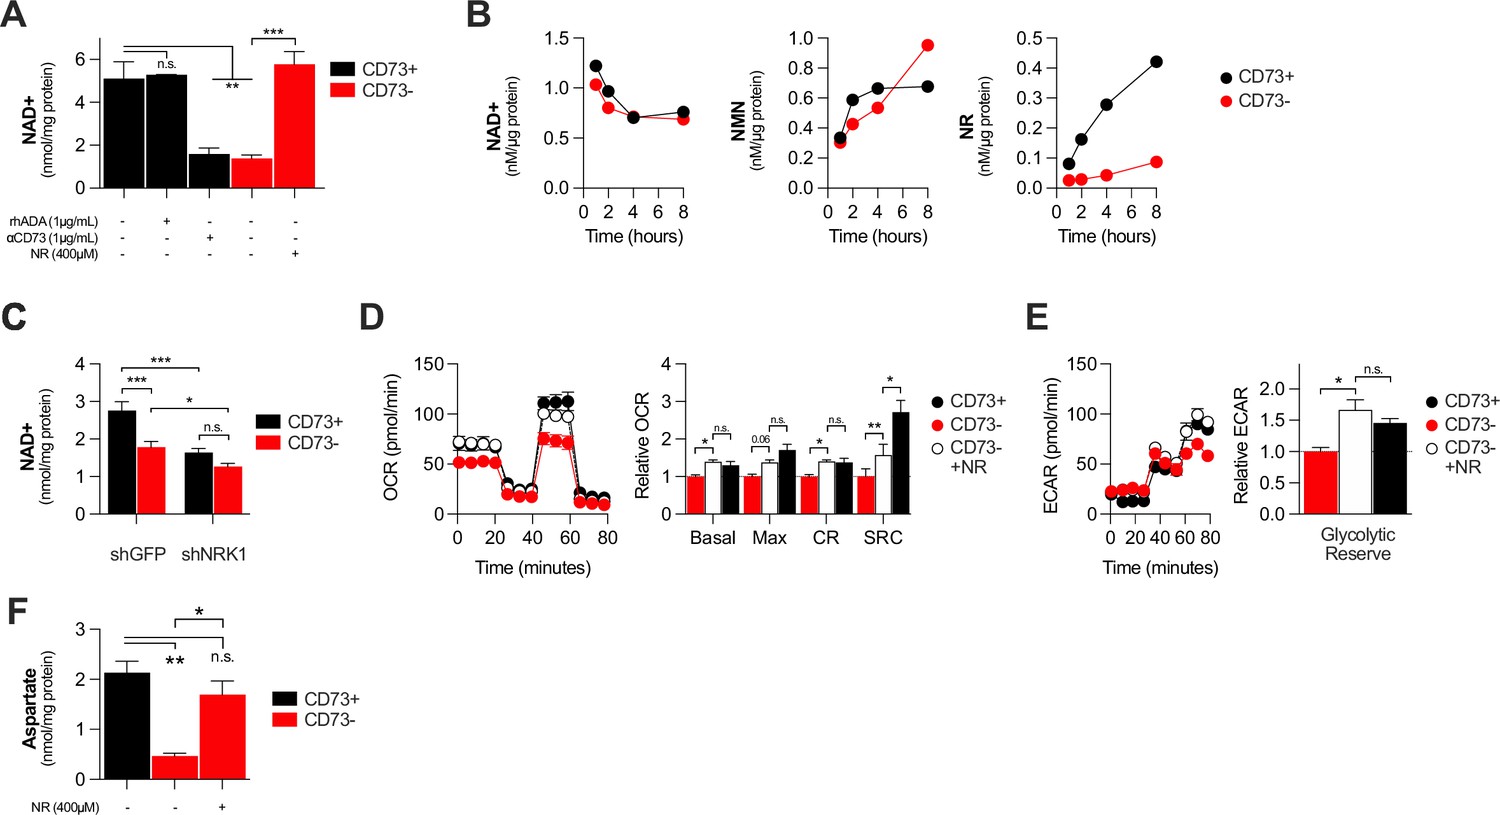
CD73 contributes to metabolic fitness of cancer cells through NAD synthesis.
(A) LC-MS analysis of intracellular nicotinamide adenine levels (NAD+) normalized to protein content of CD73pos (CD73+;+/-1 μg/mL αCD73 mAb or 1 μg/mL rhADA for 48 hr) and CD73neg (CD73-;+/-100 μM NR supplemented 2 x per day for 48 hr) MDA-MB-231 cells (n=2). (B) LC-MS analysis of endogenous extracellular production of NAD+ (left panel), NMN (middle panel) and NR (right panel) in supernatant of CD73 +and CD73- MDA-MB-231 cells. Levels were normalized on protein content of adherent cells (n=1). (C) LC-MS analysis of intracellular nicotinamide adenine levels (NAD+) normalized to protein content of CD73 + and CD73- MDA-MB-231 cells transfected with either shGFP or shNRK1 (n=2). (D) Oxygen consumption rate (OCR) profile (left panel) and OXPHOS parameters (right panel) of CD73- MDA-MB-231 cells cultured with 400 μM NR for 48 hr (n=3). CD73 + cells are shown as a control. (E) Extracellular acidification rate (ECAR) profile (left panel) and glycolytic reserve (right panel) of CD73- MDA-MB-231 cells cultured with 400 μM NR for 48 hr (n=3). CD73 + cells are shown as a control. (F) Intracellular aspartate levels measured in MDA-MB-231 CD73- cells exposed to exogenous NR (400 µM) for 48 hr. ASP levels were normalized on cell number. CD73 + cells are shown as a control. Means +/- SEM are shown (*p<0.05; **p<0.01; ***p<0.001 by one-way ANOVA).
Figure 3—figure supplement 1
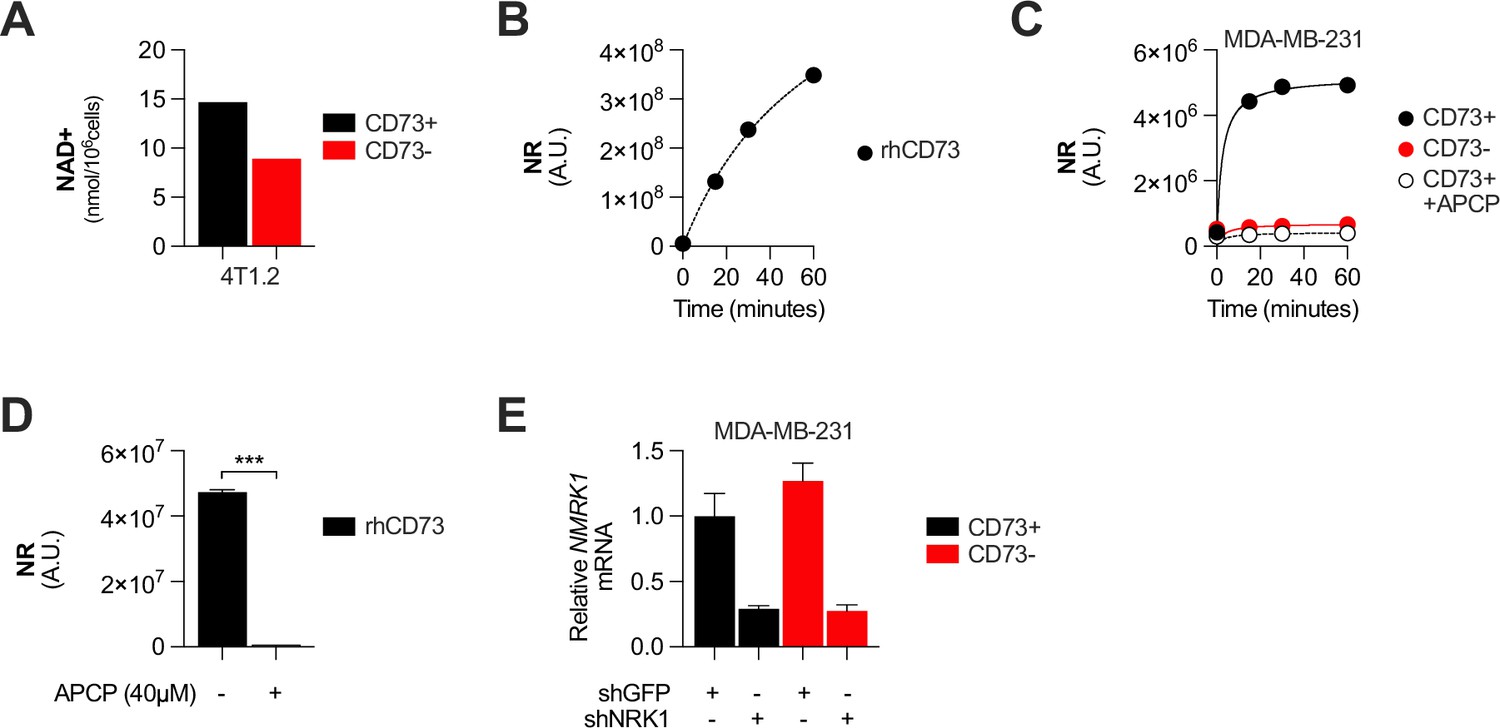
CD73 contributes to metabolic fitness of cancer cells through NAD synthesis.
(A) LC-MS analysis of intracellular nicotinamide adenine levels (NAD+) normalized to protein content of CD73pos (CD73+) and CD73neg (CD73-) 4T1.2 cells (n=1). (B) LC-MS analysis of nicotinamide riboside (NR) production over 60 min in supernatant of recombinant protein hCD73 incubated with 0.2 mM nicotinamide mononucleotide (NMN). NR levels are shown as area under peak by mass spectrometry analysis (n=1). (C) LC-MS analysis of nicotinamide riboside (NR) production over 60 min in supernatant of CD73 +and CD73- MDA-MB-231 cultures incubated with 0.2 mM nicotinamide mononucleotide (NMN). NR levels are shown as area under peak by mass spectrometry analysis (n=1). APCP = CD73 inhibitor. (D) LC-MS analysis of nicotinamide riboside (NR) production after 30 min in supernatant of recombinant protein hCD73 incubated with 0.2 mM nicotinamide mononucleotide (NMN) in presence of APCP (CD73 inhibitor). NR levels are shown as area under peak by mass spectrometry analysis (n=1).( E) NMRK1 mRNA expression analyzed by qPCR in shGFP- and shNRK1- transfected MDA-MB-231 CD73 +and CD73- cells. Means +/- SEM are shown (***p<0.001 by Student T tests).
Figure 4 with 1 supplement
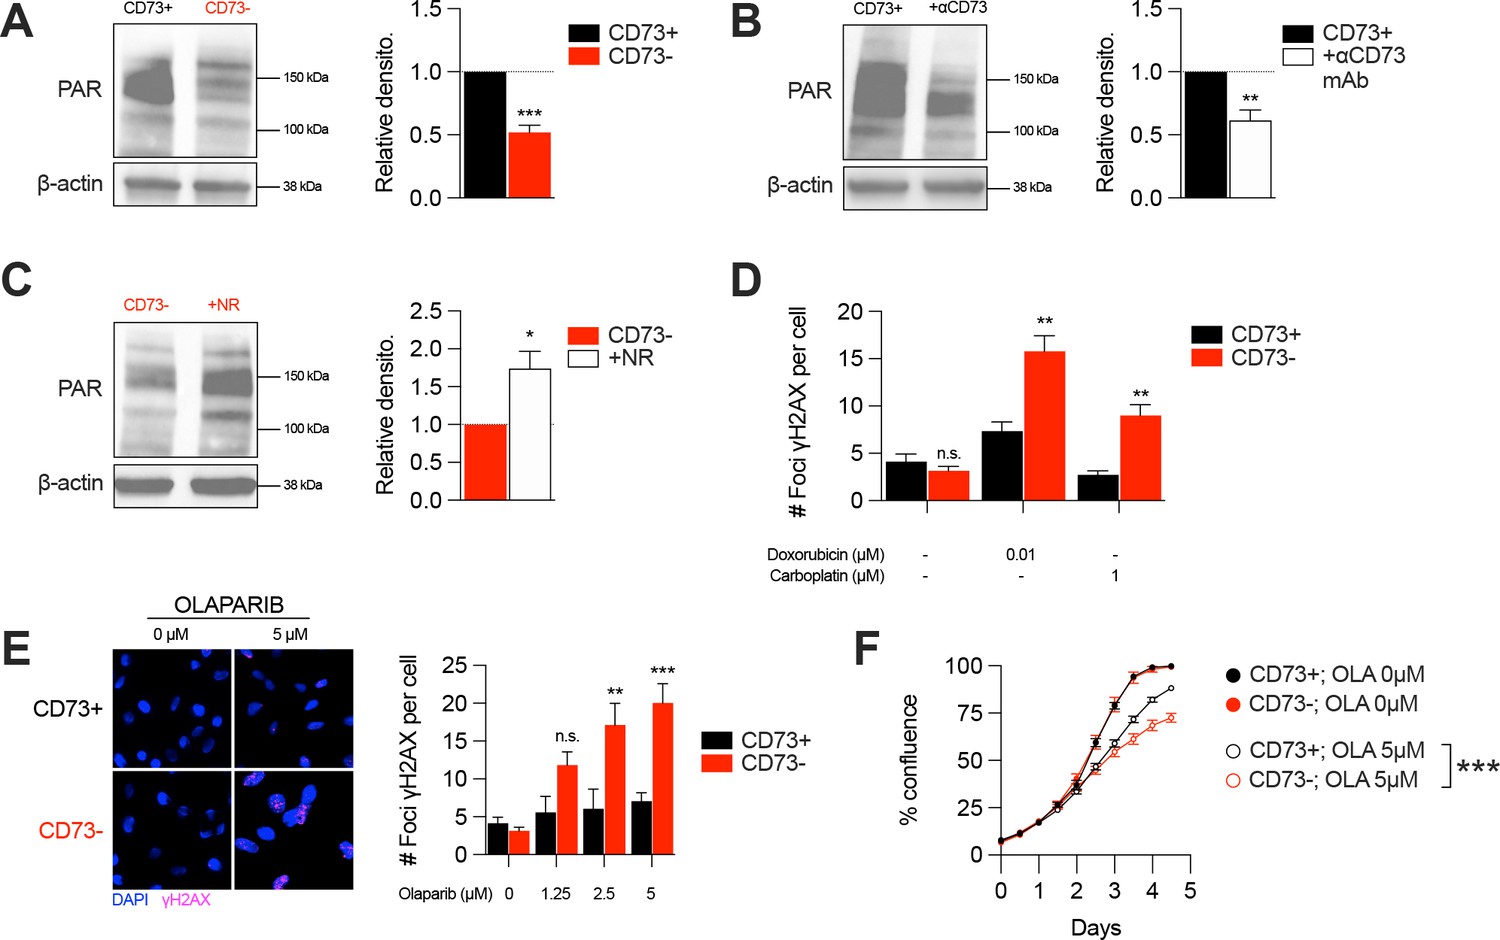
CD73 deficiency decreases PARP activity and sensitizes cancer cells to DNA-damaging agents.
(A) Western blot (left panel) showing PARylation levels in CD73pos (CD73+) and CD73neg (CD73-) MDA-MB-231 cells. Densitometry (right panel) is shown relative to CD73 + cells (n=5). (B) Western blot (left panel) showing PARylation levels in CD73 + MDA MB-231 cells treated with αCD73 mAb (1 μg/mL; clone 7G2; 48 hr). Densitometry (right panel) is shown relative to untreated CD73 + cells (n=2). (C) Western blot (left panel) showing PARylation levels in CD73- MDA-MB-231 cells treated with NR (400 μM; 48 hr). Densitometry (right panel) is shown relative to untreated CD73- cells (n=2). (D) Number of γH2AX foci per CD73 +and CD73- MDA-MB-231 cells treated with doxorubicin (0.01 μM) or carboplatin (1 μM) for 48 hr (n=2). (E) γH2AX staining of CD73 + and CD73- MDA-MB-231 cells treated with olaparib (0–5 μM) for 48 hr. Left panels show representative images for γH2AX (magenta) and DAPI (blue) staining. Data show number of γH2AX foci per cells (right panel; n=2). (F) In vitro proliferation of CD73 + and CD73- MDA-MB-231 cells treated with (0–5 μM) olaparib for 4 days. Confluence was measured using an Incucyte instrument (n=1). Means +/- SEM are shown (*p<0.05; **p<0.01; ***p<0.001 by Student T tests).
-
Figure 4—source data 1
Original raw unedited blots and uncropped blots with the relevant bands labeled that composes Figure 4A–C.
- https://cdn.elifesciences.org/articles/84508/elife-84508-fig4-data1-v2.zip
Figure 4—figure supplement 1
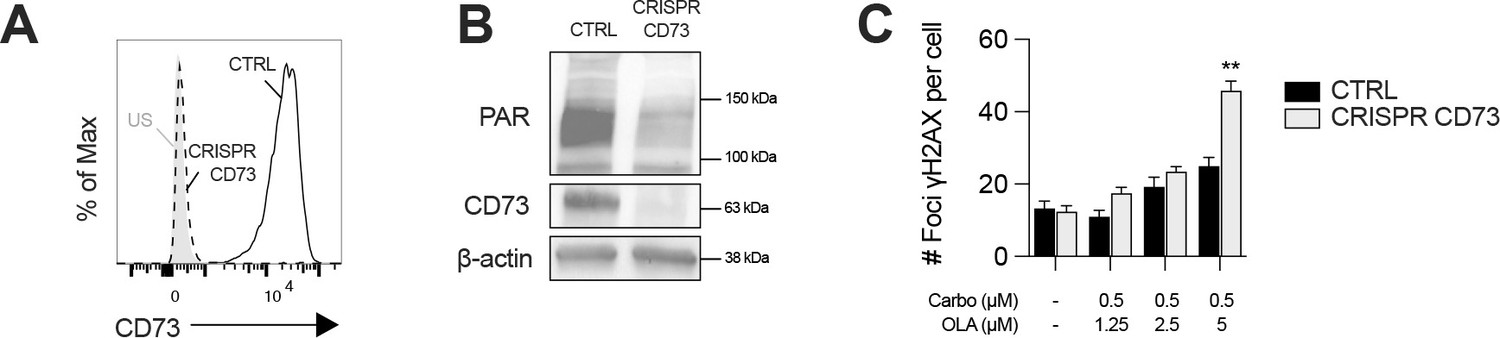
CD73 deficiency sensitizes UWB1.289+BRCA1 cells to DNA-damaging agents.
(A) Knockout efficiency of CD73 expression on UWB1.289+BRCA1 analyzed by FACS. US = unstained control. (B) Western blot showing CD73 protein levels and PARylation levels in CD73+ (CTRL) and CD73- (CRISPR CD73) UWB1.289+BRCA1 cells (n=2). β-actin is used as a loading control. (C) Number of γH2AX foci per CD73+ (CTRL) and CD73- (CRISPR CD73) UWB1.289+BRCA1 cells treated with carboplatin (0.5 μM) and olaparib (1.25–5 μM) for 48 hr (n=2). Means +/- SEM are shown (**p<0.01; by Student T tests).
-
Figure 4—figure supplement 1—source data 1
Original raw unedited blots and uncropped blots with the relevant bands labeled that composes Figure 4—figure supplement 1B.
- https://cdn.elifesciences.org/articles/84508/elife-84508-fig4-figsupp1-data1-v2.zip
Figure 5

Schematic representation of the role of CD73 in NAD + biosynthesis, metabolic function, and genomic stability in cancer cells.
We propose that CD73 regulates to NAD + biosynthesis intracellularly in a NRK1-dependent manner by hydrolyzing extracellular NMN into NR, which in turn favors DNA-damage response, mitochondrial respiration, aspartate synthesis and tumor growth intrinsically. NMN = nicotinamide mononucleotide, NR = nicotinamide riboside, ASP = aspartate, ETC = electron transport chain.
Tables
Key resources table
| Reagent type (species) or resource | Designation | Source or reference | Identifiers | Additional information |
|---|---|---|---|---|
| Antibody | Anti-human CD73 (7G2, mouse monoclonal) | Invitrogen | Cat#410200, RRID: AB_2533492 | Inhibition (1 µg/mL) |
| Antibody | Anti-human CD73 BV421 (mouse monoclonal) | BD Bioscience | Cat#562430, RRID: AB_11153119 | FACS (1:200) |
| Antibody | Anti-mouse CD73 PE-Cy7 (Rat monoclonal) | Thermo Fisher Scientific | Cat#25-0731-82, RRID: AB_10853348 | FACS (1:200) |
| Antibody | Anti-β-actin (mouse monoclonal) | Abcam | Cat#ab8226 | WB (1:5000) |
| Antibody | Anti-PLCγ (mouse polyclonal) | Millipore | Cat#05–163 | WB (1:2000) |
| Antibody | Anti-human CD73 (mouse monoclonal) | Abcam | Cat#Ab91086 | WB (1:1000) |
| Antibody | Anti-FLAG (rabbit polyclonal) | Millipore | Cat#F7425 | WB (1:1000) |
| Antibody | Anti-Cas9 S. pyogenes (rabbit monoclonal) | Cell Signaling Technology | Cat#19526 S | WB (1:1000) |
| Antibody | Anti-PAR (mouse monoclonal) | Trevigen | Cat#4335-MC-100 | WB (1:1000) |
| Antibody | HRP-conjugated anti-mouse IgG secondary (goat polyclonal) | Millipore | Cat#AP124P | WB (2.5:10,000) |
| Antibody | IRDye 800CW anti-Mouse IgG secondary (donkey polyclonal) | LI-COR | Cat#926–32212, RRID: AB_621847 | WB (1:10,000) |
| Antibody | IRDye 680RD anti-rabbit IgG secondary (donkey polyclonal) | LI-COR | Cat#926–68073, RRID: AB_10954442 | WB (1:10,000) |
| Antibody | Anti-phospho-Histone H2A.X Ser139 (mouse monoclonal) | Millipore | Cat#05–636 | IF (1:2000) |
| Antibody | Anti-Mouse IgG (H+L) Highly Cross-Adsorbed Secondary Alexa Fluor 488 (donkey polyclonal) | Thermo Fisher Scientific | Cat#A-21202, RRID: AB_141607 | IF (1:800) |
| Chemical compound, drug | Adenosine 5'-(α,β-methylene) diphosphate (APCP) | Sigma-Aldrich | Cat#M3763, CAS: 3768-14-7 | |
| Chemical compound, drug | Nicotinamide riboside (NR) | Cayman Chemical | Cat#23132, CAS: 1341-23-7 | |
| Chemical compound, drug | Nicotinamide mononucleotide (NMN) | Sigma-Aldrich | Cat#N3501, CAS: 1094-61-7 | |
| Chemical compound, drug | 5'-N-Ethylcarboxamidoadenosine (NECA) | Tocris | Cat#1691, CAS: 35920-39-9 | |
| Chemical compound, drug | SCH58261 | Tocris | Cat#2270, CAS: 160098-96-4 | |
| Chemical compound, drug | PSB1115 | Tocris | Cat#2009, CAS: 152529-79-8 | |
| Chemical compound, drug | Olaparib (AZD2281) | Selleckchem | Cat#S1060, CAS: 763113-22-0 | |
| Chemical compound, drug | Doxorubicin | CRCHUM pharmacy | CAS: 23214-92-8 | |
| Chemical compound, drug | Carboplatin | CRCHUM pharmacy | CAS: 41575-94-4 | |
| Chemical compound, drug | 2-deoxy-2-[(7-nitro-2,1,3- benzoxadiazol-4-yl)amino]- D-glucose (2-NBDG) | Cayman Chemical | Cat#11046, CAS: 186689-07-6 | |
| Chemical compound, drug | U-[13C]-glucose | Cambridge Isotope Laboratories | Cat#CLM-1396, CAS: 110187-42-3 | |
| Chemical compound, drug | U-[13C]-glutamine | Cambridge Isotope Laboratories | Cat#CLM-1822, CAS: 184161-19-1 | |
| Chemical compound, drug | Oligomycin | Sigma-Aldrich | Cat#O4876, CAS: 1404-19-9 | |
| Chemical compound, drug | Carbonyl cyanide p- trifluoromethoxyphenylhydrazone (FCCP) | Sigma-Aldrich | Cat#C2920, CAS: 370-86-5 | |
| Chemical compound, drug | Rotenone | Sigma-Aldrich | Cat#R8875, CAS: 83-79-4 | |
| Chemical compound, drug | Antimycin A from Streptomyces sp. | Sigma-Aldrich | Cat#A8674, CAS: 1397-94-0 | |
| Chemical compound, drug | CelLytic M buffer | Sigma-Aldrich | Cat#C2978 | |
| Chemical compound, drug | Halt protease and phosphatase cocktail inhibitors | Sigma-Aldrich | Cat#78440 | |
| Chemical compound, drug | Bradford protein assay dye reagent | Bio-Rad | Cat#500–0006 | |
| Chemical compound, drug | Protein Block DAKO solution | Agilent | Cat#X0909 | |
| Chemical compound, drug | Fluoromount Aqueous Mounting Medium | Sigma-Aldrich | Cat#F4680 | |
| Chemical compound, drug | Formalin solution, neutral buffered, 10% | Sigma-Aldrich | Cat#HT5011 | |
| Chemical compound, drug | Triton X-100 reduced | Sigma-Aldrich | Cat#X100RS; CAS: 92046-34-9 | |
| Chemical compound, drug | 7-amino-actinomycin D (7-AAD) | eBioscience | Cat#00-6993-50 | |
| Peptide, recombinant protein | Recombinant human adenosine deaminase (rhADA) | R&D systems | Cat#7048-AD, Acc#P00813 | |
| Peptide, recombinant protein | Recombinant human CD73 (rhCD73) | R&D systems | Cat#5795-EN, Acc#AAH659937 | |
| Commercial assay, kit | Malachite green phosphate detection kit | R&D systems | Cat#DY996 | |
| Commercial assay, kit | SuperScript VILO cDNA Synthesis Kit | Thermo Fisher Scientific | Cat#11754050 | |
| Commercial assay, kit | RNeasy mini kit | QIAGEN | Cat#74104 | |
| Commercial assay, kit | ALDEFLUOR kit | Stemcell | Cat#01700 | |
| Commercial assay, kit | Amersham ECL prime detection reagent | GE healthcare lifescience | Cat#RPN2232 | |
| Commercial assay, kit | Glutamine/Glutamate-Glo Assay kit | Promega | Cat#J8021 | |
| Cell line (homo-sapiens) | MDA-MB-231 (TNBC) | ATCC | HTB-26 | |
| Cell line (homo-sapiens) | PANC-1 (pancreatic cancer) | ATCC | CRL-1469 | |
| Cell line (homo-sapiens) | SK23MEL (metastatic melanoma) | MSK Cancer Center | RRID: CVCL_6027 | |
| Cell line (homo-sapiens) | HCC1954 (breast cancer) | ATCC | CRL-2338 | |
| Cell line (homo-sapiens) | OV1369 (ovarian cancer) | Dr. Anne-Marie Mes-Masson | Fleury et al., 2019 | |
| Cell line (homo-sapiens) | SKOV3 (ovarian cancer) | ATCC | HTB-77 | |
| Cell line (homo-sapiens) | HEK293FT (human embryonic kidney) | Dr. Francis Rodier | RRID: CVCL_6911 | |
| Cell line (homo-sapiens) | UWB1.289+BRCA1 | Dr. Madhuri Koti | RRID: CVCL_B078 | |
| Cell line (Mus musculus) | 4T1.2 (mammary cancer) | ATCC | CRL-2539 | |
| Cell line (Mus musculus) | SM1 LWT1 (metastatic melanoma) | Dr. Mark Smyth | ||
| Cell line (Mus musculus) | MEF from C57BL/6 J | This paper | Generated in Dr. Stagg’s laboratory | |
| Cell line (Mus musculus) | MEF from Nt5e-/- C57BL/6 J | This paper | Generated in Dr. Stagg’s laboratory | |
| Strain, strain background (mouse) | NOD.Cg-Rag1tm1Mom Il2rgtm1Wjl/SzJ (NRG) | Jackson Laboratory | JAX: 007799 | |
| Strain, strain background (mouse) | C57BL/6 J | Jackson Laboratory | JAX: 000664 | |
| Strain, strain background (mouse) | B6.129S1-Nt5etm1Lft/J (CD73-/- C57BL/6 J) | Dr. Linda Thompson | JAX: 018986 | |
| Sequence-based reagent | Nt5e | Thermo Fisher Scientific | Cat#4331182, Mm00501910_m1 | |
| Sequence-based reagent | Actb | Thermo Fisher Scientific | Cat#4331182, Mm00607939_s1 | |
| Sequence-based reagent | NMRK1 | Thermo Fisher Scientific | Cat#4331182, Hs00944470_m1 | |
| Sequence-based reagent | ACTB | Thermo Fisher Scientific | Cat#4331182, Hs99999903_m1 | |
| Sequence-based reagent | ADORA2A | Thermo Fisher Scientific | Cat#4331182, Hs00169123_m1 | |
| Sequence-based reagent | ADORA2B | Thermo Fisher Scientific | Cat#4331182, Hs00386497_m1 | |
| Recombinant DNA reagent | pLenti-PGK-ER- KRAS G12V (plasmid) | Dr. Francis Rodier | Rodier et al., 2009; Addgene#35635 | |
| Recombinant DNA reagent | pLHCX (plasmid) | Dr. Lucas Sullivan | Sullivan et al., 2018 | |
| Recombinant DNA reagent | pLHCX-gpASNase1 | Dr. Lucas Sullivan | Sullivan et al., 2018; Addgene#121526 | |
| Recombinant DNA reagent | shGFP | Sigma-Aldrich | TRCN0000075219 | |
| Recombinant DNA reagent | shNRK1 | Sigma-Aldrich | TRCN0000160469 | |
| Other | DMEM | Wisent | Cell culture reagent | |
| Other | Glucose/glutamine/sodium pyruvate-free DMEM | Wisent | Cell culture reagent | |
| Other | RPMI 1640 | Wisent | Cell culture reagent | |
| Other | OSE | Wisent | Cell culture reagent | |
| Other | Dialyzed FBS | Wisent | Cell culture reagent | |
| Other | Seahorse base media | Agilent | Cell culture reagent | |
| Other | Glutamax | Gibco | Cat#35050–061 | Cell culture reagent |
| Other | D-(+)-glucose (cell culture grade) | Sigma-Aldrich | Cat#G7021, CAS: 50-99-7 | Cell culture reagent |
| Other | L-glutamine (cell culture grade) | Sigma-Aldrich | Cat#G8540, CAS: 56-85-9 | Cell culture reagent |
| Software, algorithm | FlowJo (10.8.0) | FlowJo | RRID:SCR_008520 | |
| Software, algorithm | GraphPad Prism 9 (9.2.0) | GraphPad | RRID:SCR_002798 | |
| Software, algorithm | StepOne (2.3) | Thermo Fisher Scientific | RRID:SCR_014281 | |
| Software, algorithm | Incucyte base analysis software | Sartorius | RRID:SCR_019874 | |
| Software, algorithm | Seahorse Wave software | Agilent | RRID:SCR_014526 | |
| Software, algorithm | Image Lab Software (6.0.1) | Bio-Rad | RRID:SCR_014210 | |
| Software, algorithm | Visiomorph software | B&B microscopes | http://www.bbmicro.com/products/product.php?pid=204 |
Additional files
Download links
A two-part list of links to download the article, or parts of the article, in various formats.
Downloads (link to download the article as PDF)
Open citations (links to open the citations from this article in various online reference manager services)
Cite this article (links to download the citations from this article in formats compatible with various reference manager tools)
The CD73 immune checkpoint promotes tumor cell metabolic fitness
eLife 12:e84508.
https://doi.org/10.7554/eLife.84508


