Association of close-range contact patterns with SARS-CoV-2: a household transmission study
- Centre for Respiratory Diseases and Meningitis, National Institute for Communicable Diseases of the National Health Laboratory Service, South Africa
- School of Public Health, Faculty of Health Sciences, University of the Witwatersrand, South Africa
- ISI Foundation, Italy
- Institute for Research on Sustainable Development, France
- Department of Sociology and Social Research, University of Trento, Italy
- Perinatal HIV Research Unit, University of the Witwatersrand, South Africa
- Johns Hopkins University Center for TB Research, United States
- School of Pathology, Faculty of Health Sciences, University of the Witwatersrand, South Africa
- Department of Informatics, University of Turin, Italy
Figures
Figure 1
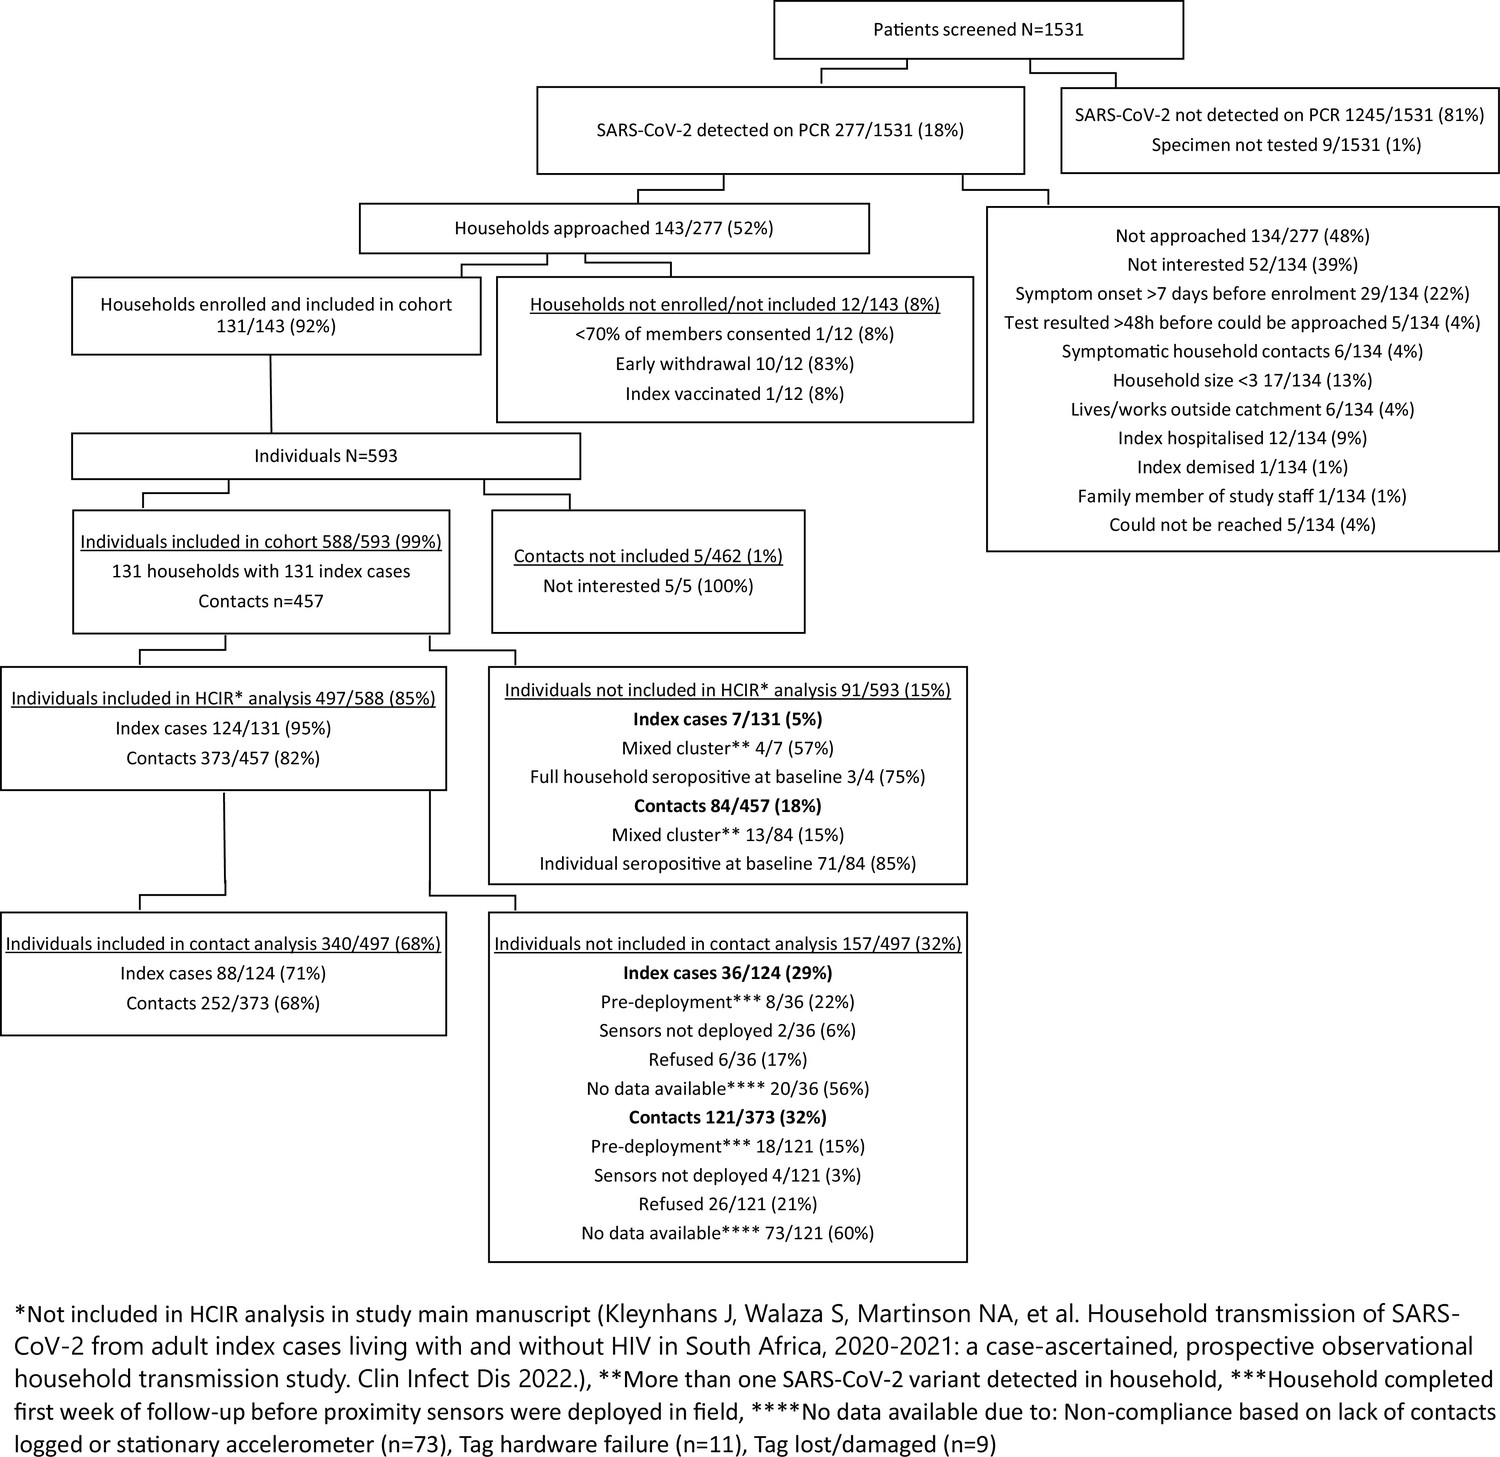
Participants screened, enrolled, included in household transmission study, and included in contact analysis, Klerksdorp and Soweto, South Africa, 2020–2021.
Figure 2
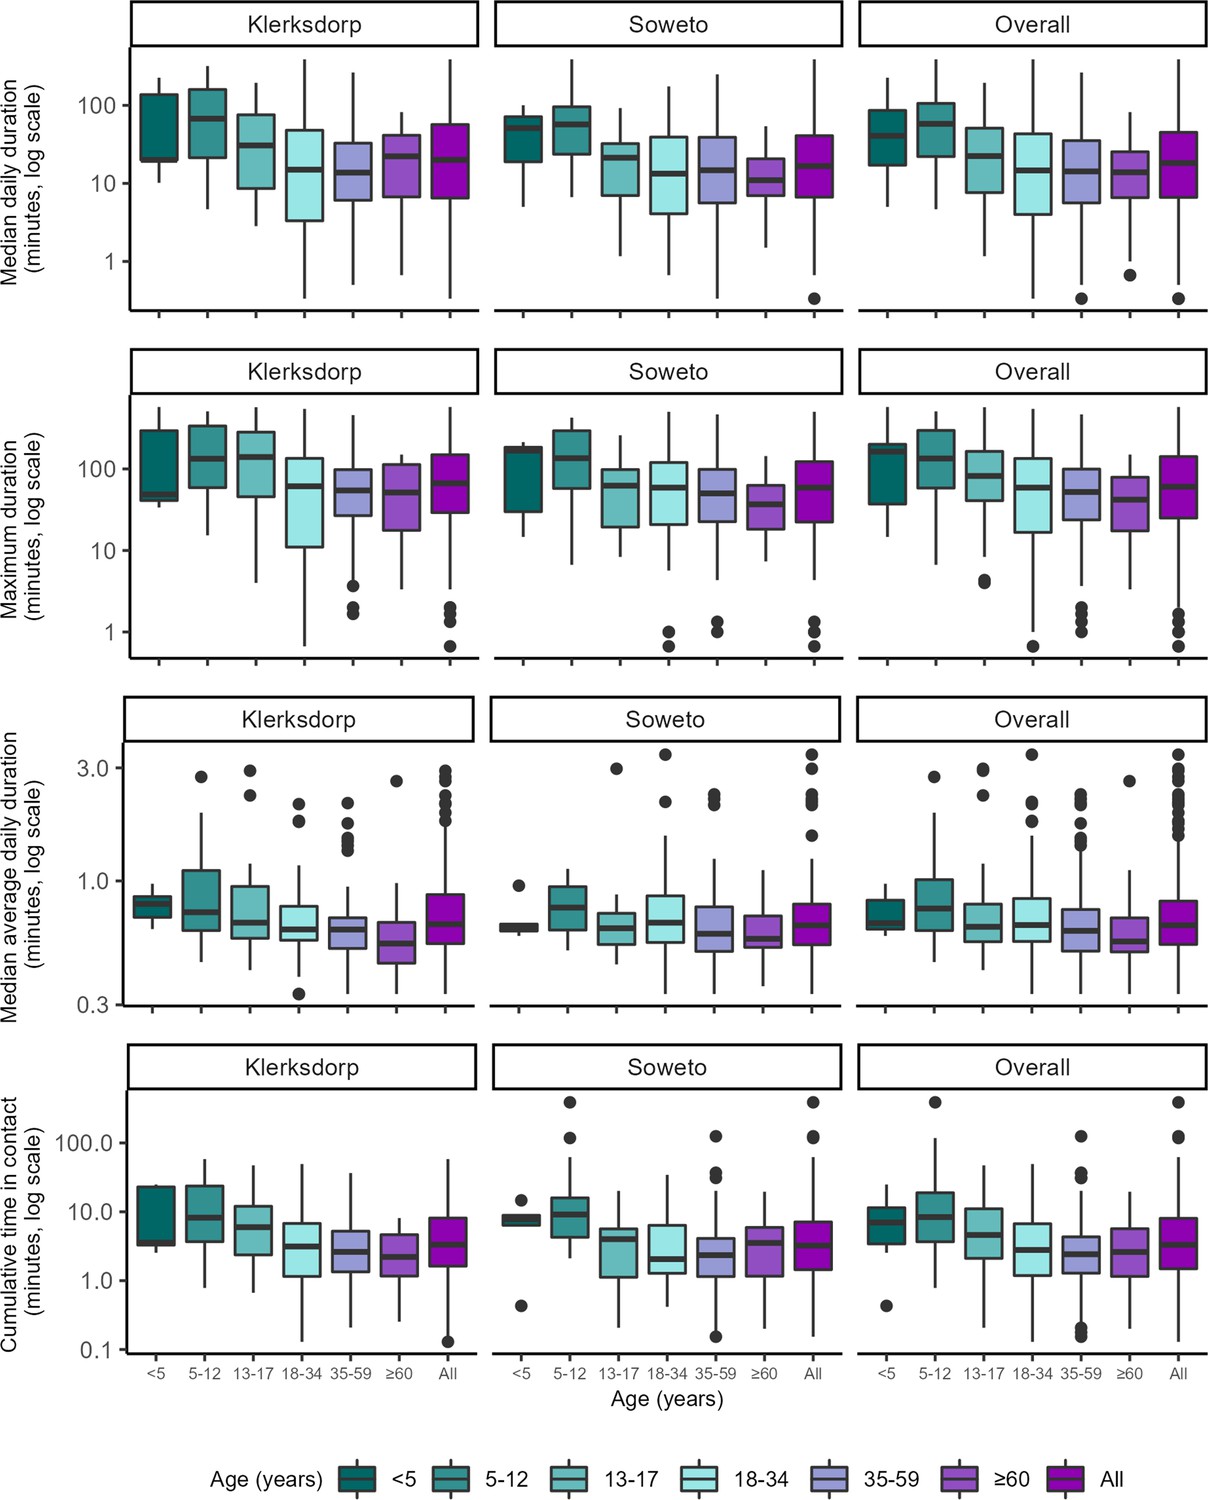
Contact parameters related to the duration of all close-range proximity events within households by age group (year) and site, Klerksdorp (n=143) and Soweto (n=197), South Africa, September 2020–October 2021.
Median daily duration: median of cumulative duration of close-range proximity events for each day of deployment, in minutes. Maximum duration: longest duration of a close-range proximity event during deployment, in minutes. Median average daily duration: median of cumulative duration of close-range proximity events in the day divided by the cumulative number of close-range proximity events during that day, in minutes. Cumulative time in contact: cumulative duration of close-range proximity events over the deployment period divided by the number of days sensor was worn, in minutes. Horizontal line represents the median, box represents the 25th and 75th percentile, whiskers represent the 1st and 99th percentile, and circles indicate outliers.
Figure 3
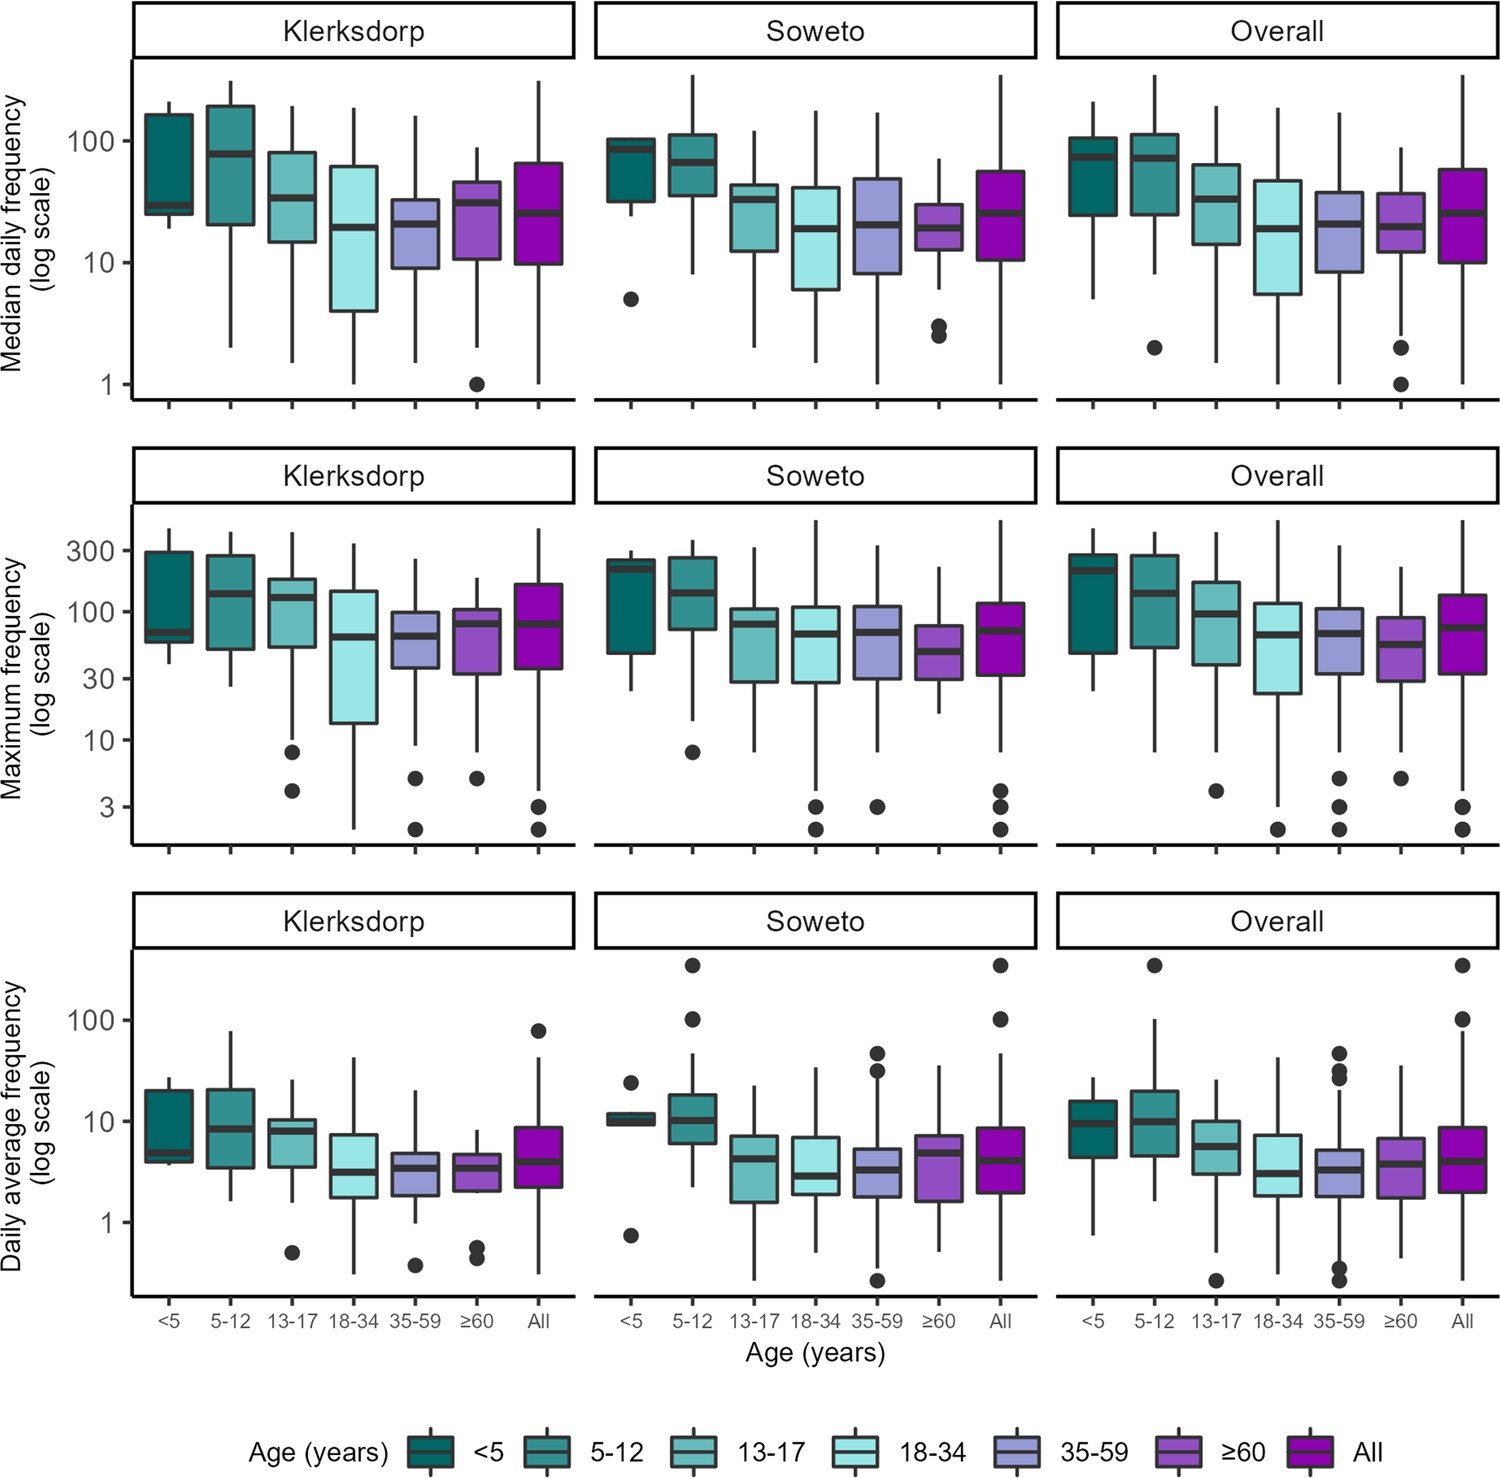
Contact parameters related to the frequency of all close-range proximity events within households by age group (year) and site, Klerksdorp (n=143) and Soweto (n=197), South Africa, September 2020–October 2021.
Median daily frequency: median of number of close proximity events for each day of deployment. Maximum frequency: highest number of close proximity events in one day during deployment. Daily average frequency: cumulative duration of close-range proximity events over the deployment period divided by the cumulative number of close-range proximity events during the deployment period. Horizontal line represents the median, box represents the 25th and 75th percentile, whiskers represent 1st and 99th percentile, and circles indicate outliers.
Figure 4
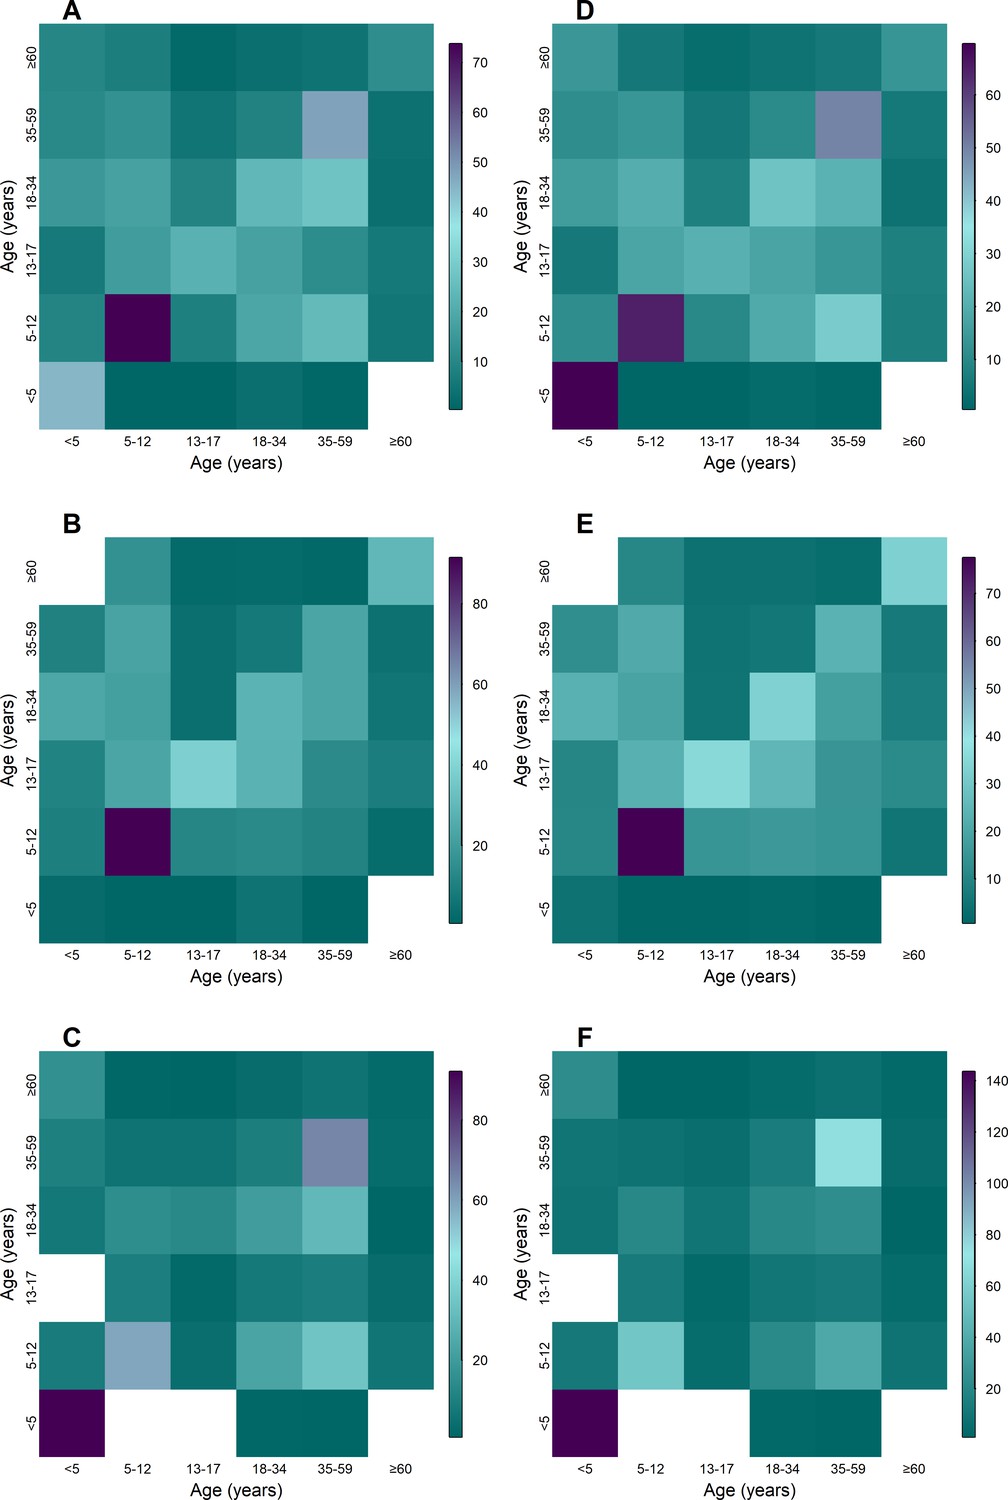
Aged-based contact matrices based close-proximity event duration (A–C) and frequency (D–E) for the entire deployment period overall (A, D) Klerksdorp (B,D, n=143), and Soweto (C,F, n=193), September 2020–October 2021.
Teal denotes the lowest value, purple highest, and white no data for age group combination.
Tables
Table 1
Baseline characteristics of SARS-CoV-2 index cases (n=124) and their household contacts (n=373) included in the household cumulative infection risk study and included in the contact study, Klerksdorp and Soweto, South Africa, September 2020–October 2021.
| Overall | No contact data | Included in contact analysis | p-value | ||
|---|---|---|---|---|---|
| n=497 | n=157 | n=340 | |||
| Site | |||||
| Klerksdorp | 234 (47.1) | 91 (58.0) | 143 (42.1) | 0.001 | |
| Soweto | 263 (52.9) | 66 (42.0) | 197 (57.9) | ||
| Index | |||||
| Index | 124 (24.9) | 36 (22.9) | 88 (25.9) | 0.551 | |
| Contact | 373 (75.1) | 121 (77.1) | 252 (74.1) | ||
| Household size | |||||
| 3–5 | 347 (69.8) | 122 (77.7) | 225 (66.2) | 0.012 | |
| 6–10 | 150 (30.2) | 35 (22.3) | 115 (33.8) | ||
| Rooms used for sleeping | |||||
| 1–2 | 244 (49.1) | 76 (48.4) | 168 (49.4) | 0.387 | |
| 3–4 | 203 (40.8) | 69 (43.9) | 134 (39.4) | ||
| >4 | 50 (10.1) | 12 (7.6) | 38 (11.2) | ||
| Crowding | |||||
| No | 353 (71.0) | 112 (71.3) | 241 (70.9) | 1 | |
| Yes | 144 (29.0) | 45 (28.7) | 99 (29.1) | ||
| Child <5 years | |||||
| No | 423 (85.1) | 136 (86.6) | 287 (84.4) | 0.611 | |
| Yes | 74 (14.9) | 21 (13.4) | 53 (15.6) | ||
| HH member smokes inside | |||||
| No | 401 (80.7) | 116 (73.9) | 285 (83.8) | 0.013 | |
| Yes | 96 (19.3) | 41 (26.1) | 55 (16.2) | ||
| Main water source inside home | |||||
| No | 350 (70.4) | 120 (76.4) | 230 (67.6) | 0.059 | |
| Yes | 147 (29.6) | 37 (23.6) | 110 (32.4) | ||
| Main cooking fuel | |||||
| Electricity | 480 (96.6) | 152 (96.8) | 328 (96.5) | 1 | |
| Gas/Paraffin | 17 (3.4) | 5 (3.2) | 12 (3.5) | ||
| Monthly household income (US$) | |||||
| 0–50 | 42 (8.5) | 20 (12.7) | 22 (6.5) | 0.125 | |
| 51–100 | 41 (8.2) | 16 (10.2) | 25 (7.4) | ||
| 101–190 | 90 (18.1) | 25 (15.9) | 65 (19.1) | ||
| 191–375 | 77 (15.5) | 21 (13.4) | 56 (16.5) | ||
| 376–750 | 36 (7.2) | 12 (7.6) | 24 (7.1) | ||
| >750 | 20 (4.0) | 9 (5.7) | 11 (3.2) | ||
| Refused to disclose | 191 (38.4) | 54 (34.4) | 137 (40.3) | ||
| Age (years) | |||||
| <5 | 19 (3.8) | 8 (5.1) | 11 (3.2) | 0.711 | |
| 5–12 | 73 (14.7) | 25 (15.9) | 48 (14.1) | ||
| 13–17 | 60 (12.1) | 18 (11.5) | 42 (12.4) | ||
| 18–34 | 130 (26.2) | 45 (28.7) | 85 (25.0) | ||
| 35–59 | 163 (32.8) | 47 (29.9) | 116 (34.1) | ||
| 60+ | 52 (10.5) | 14 (8.9) | 38 (11.2) | ||
| Sex | |||||
| Male | 196 (39.4) | 61 (38.9) | 135 (39.7) | 0.935 | |
| Female | 301 (60.6) | 96 (61.1) | 205 (60.3) | ||
| Level of education* | |||||
| No schooling/kindergarten | 18 (3.6) | 5 (3.2) | 13 (3.8) | 0.959 | |
| Primary | 23 (4.6) | 8 (5.1) | 15 (4.4) | ||
| Secondary | 110 (22.1) | 32 (20.4) | 78 (22.9) | ||
| Matriculation | 169 (34.0) | 52 (33.1) | 117 (34.4) | ||
| Post-secondary | 20 (4.0) | 7 (4.5) | 13 (3.8) | ||
| Unknown | 157 (31.6) | 53 (33.8) | 104 (30.6) | ||
| Employment* | |||||
| Unemployed | 170 (34.2) | 52 (33.1) | 118 (34.7) | 0.876 | |
| Student | 33 (6.6) | 9 (5.7) | 24 (7.1) | ||
| Employed | 109 (21.9) | 34 (21.7) | 75 (22.1) | ||
| Unknown | 185 (37.2) | 62 (39.5) | 123 (36.2) | ||
| Smoking cigarettes ‡ | |||||
| No | 65 (13.1) | 22 (14.0) | 43 (12.6) | 0.558 | |
| Yes | 426 (85.7) | 132 (84.1) | 294 (86.5) | ||
| Unknown | 6 (1.2) | 3 (1.9) | 3 (0.9) | ||
| Living with HIV | |||||
| No | 241 (48.5) | 87 (55.4) | 154 (45.3) | 0.095 | |
| Yes | 56 (11.3) | 17 (10.8) | 39 (11.5) | ||
| Unknown | 200 (40.2) | 53 (33.8) | 147 (43.2) | ||
| Underlying illness† | |||||
| No | 416 (83.7) | 128 (81.5) | 288 (84.7) | 0.395 | |
| Yes | 71 (14.3) | 24 (15.3) | 47 (13.8) | ||
| Unknown | 10 (2.0) | 5 (3.2) | 5 (1.5) | ||
| Body-mass index | |||||
| Underweight | 28 (5.6) | 8 (5.1) | 20 (5.9) | 0.757 | |
| Normal weight | 207 (41.6) | 67 (42.7) | 140 (41.2) | ||
| Overweight | 100 (20.1) | 31 (19.7) | 69 (20.3) | ||
| Obese | 152 (30.6) | 46 (29.3) | 106 (31.2) | ||
| Unknown | 10 (2.0) | 5 (3.2) | 5 (1.5) | ||
| SARS-CoV-2 infection | |||||
| Negative | 153 (30.8) | 54 (34.4) | 99 (29.1) | 0.478 | |
| Positive (index) | 124 (24.9) | 36 (22.9) | 88 (25.9) | ||
| Positive (not index) | 220 (44.3) | 67 (42.7) | 153 (45.0) | ||
-
Values in headers indicate the number of individuals. p-values calculated using the Chi-squared test.
-
*
For individuals ≥18 years old.
-
†
Self-reported history of diabetes, hypertension, asthma, lung disease, heart disease, stroke, spinal cord injury, epilepsy, cancer, liver disease, renal disease, and pre-maturity.
-
‡
For individuals ≥15 years old.
Table 2
Close-range proximity event parameters by age group (year) and site, Klerksdorp and Soweto, South Africa, September 2020–October 2021.
| Median daily duration * | Maximum duration † | Median average daily duration ‡ | Cumulative time in contact (per day) § | Median daily frequency ¶ | Maximum frequency ** | Daily average frequency †† | ||
|---|---|---|---|---|---|---|---|---|
| Both sites | n | Median (IQR) | ||||||
| Overall | 340 | 18.2 (6.6–45.1) | 60.5 (25.0–141.7) | 0.7 (0.5–0.8) | 3.3 (1.5–8.0) | 25.5 (10.0–58.1) | 75.0 (32.8–134.2) | 4.0 (2.0–8.7) |
| <5 | 11 | 40.7 (17.3–87.2) | 163.0 (37.3–200.8) | 0.7 (0.6–0.8) | 7.0 (3.4–11.8) | 73.5 (24.5–105.2) | 209.0 (48.5–277.0) | 9.5 (4.4–16.2) |
| 5–12 | 48 | 58.0 (22.1–106.3) | 134.3 (58.3–296.7) | 0.8 (0.6–1.0) | 8.4 (3.7–18.9) | 72.2 (24.8–112.5) | 139.0 (52.5–273.5) | 9.9 (4.6–19.8) |
| 13–17 | 42 | 22.4 (7.7–51.2) | 82.0 (40.8–164.1) | 0.6 (0.6–0.8) | 4.6 (2.1–11.1) | 33.2 (14.1–63.5) | 96.0 (38.5–169.5) | 5.6 (3.0–10.0) |
| 18–34 | 85 | 14.7 (4.0–43.2) | 59.0 (16.7–134.3) | 0.7 (0.6–0.8) | 2.8 (1.2–6.7) | 19.0 (5.5–47.0) | 66.0 (23.0–116.0) | 3.0 (1.8–7.3) |
| 35–59 | 116 | 14.2 (5.6–35.3) | 52.2 (23.8–99.5) | 0.6 (0.5–0.8) | 2.4 (1.3–4.3) | 20.8 (8.4–37.6) | 67.5 (32.8–105.5) | 3.3 (1.8–5.2) |
| ≥60 | 38 | 14.0 (6.6–25.4) | 42.0 (17.4–79.6) | 0.6 (0.5–0.7) | 2.6 (1.2–5.7) | 19.8 (12.2–36.9) | 55.5 (28.8–89.8) | 3.8 (1.8–6.8) |
| Klerksdorp | ||||||||
| Overall | 143 | 20.0 (6.5–56.8) | 66.7 (29.2–149.2) | 0.7 (0.5–0.9) | 3.3 (1.6–8.1) | 25.5 (9.8–65.2) | 80.0 (36.0–163.0) | 4.0 (2.2–8.7) |
| <5 | 5 | 20.0 (20.0–137.2) | 48.7 (41.0–294.3) | 0.8 (0.7–0.9) | 3.6 (3.3–22.9) | 29.5 (25.0–163.5) | 69.0 (58.0–290.0) | 4.9 (4.0–20.1) |
| 5–12 | 21 | 67.5 (21.3–159.7) | 133.3 (59.0–336.3) | 0.7 (0.6–1.1) | 8.2 (3.7–23.7) | 78.0 (20.5–192.0) | 138.0 (51.0–273.0) | 8.4 (3.5–20.5) |
| 13–17 | 23 | 30.7 (8.8–75.7) | 140.0 (45.8–282.8) | 0.7 (0.6–0.9) | 6.0 (2.4–12.0) | 34.0 (14.8–81.2) | 129.0 (53.0–179.0) | 8.0 (3.5–10.3) |
| 18–34 | 38 | 15.0 (3.5–48.0) | 61.5 (11.0–134.8) | 0.6 (0.6–0.8) | 3.1 (1.2–6.8) | 19.5 (4.0–61.6) | 63.5 (13.5–144.5) | 3.1 (1.8–7.4) |
| 35–59 | 42 | 13.8 (6.1–32.8) | 54.5 (26.8–98.1) | 0.6 (0.5–0.7) | 2.6 (1.3–5.2) | 20.8 (9.0–32.8) | 64.5 (36.5–98.8) | 3.4 (1.8–4.8) |
| ≥60 | 14 | 22.2 (6.8–41.9) | 51.7 (19.8–114.7) | 0.5 (0.5–0.7) | 2.2 (1.2–4.8) | 31.0 (10.8–45.9) | 80.5 (34.0–104.0) | 3.4 (2.1–4.7) |
| Soweto | ||||||||
| Overall | 197 | 16.7 (6.7–40.8) | 59.0 (22.3–122.7) | 0.6 (0.5–0.8) | 3.2 (1.4–7.1) | 25.5 (10.5–56.0) | 71.0 (32.0–116.0) | 4.1 (2.0–8.6) |
| <5 | **6 | 52.5 (21.2–71.6) | 167.8 (53.5–184.4) | 0.6 (0.6–0.7) | 7.9 (6.4–8.9) | 86.2 (36.4–103.1) | 215.0 (74.0–253.2) | 9.9 (9.3–11.9) |
| 5–12 | 27 | 57.0 (23.7–95.8) | 135.3 (57.7–294.0) | 0.8 (0.6–0.9) | 9.1 (4.3–16.1) | 66.5 (35.5–111.8) | 140.0 (73.0–263.5) | 10.2 (6.1–18.3) |
| 13–17 | 19 | 21.3 (7.2–32.5) | 62.3 (20.0–98.3) | 0.6 (0.5–0.7) | 4.0 (1.2–5.7) | 33.0 (12.5–43.5) | 80.0 (28.5–105.0) | 4.2 (1.6–7.1) |
| 18–34 | 47 | 13.3 (4.1–39.2) | 59.0 (20.8–120.2) | 0.7 (0.6–0.9) | 2.1 (1.3–6.4) | 19.0 (6.0–41.2) | 67.0 (28.0–108.5) | 2.9 (1.9–6.9) |
| 35–59 | 74 | 14.8 (5.6–39.0) | 50.2 (22.6–98.8) | 0.6 (0.5–0.8) | 2.3 (1.1–4.1) | 20.5 (8.1–49.1) | 69.0 (30.0–109.8) | 3.3 (1.8–5.3) |
| ≥60 | 24 | 11.0 (7.0–20.7) | 37.0 (18.2–62.8) | 0.6 (0.5–0.7) | 3.6 (1.2–5.9) | 19.2 (12.8–30.0) | 49.0 (29.8–77.8) | 4.9 (1.6–7.2) |
-
*
Median daily duration (median of cumulative duration of close-range proximity events for each day of deployment, in minutes).
-
†
Maximum duration (longest duration of a close-range proximity event during deployment, in minutes).
-
‡
Median average daily duration (median of cumulative duration of close-range proximity events in the day divided by the cumulative number of close-range proximity events during that day, in minutes).
-
§
Cumulative time in contact (cumulative duration of close-range proximity events over the deployment period divided by the number of days sensor was worn, in minutes).
-
¶
Median daily frequency (median of number of close proximity events for each day of deployment).
-
**
Maximum frequency (highest number of close proximity events in one day during deployment).
-
††
Daily average frequency (cumulative duration of close-range proximity events over the deployment period divided by the cumulative number of close-range proximity events during the deployment period).
Table 3
Association of contact parameters with SARS-CoV-2 household acquisition * using the Wilcoxon rank-sum test, Klerksdorp and Soweto, South Africa, September 2020–October 2021.
| Contact parameter | p-value (including all households) |
|---|---|
| Median daily duration with index † | 0.83 |
| Maximum duration with index ‡ | 0.32 |
| Median average daily duration with index § | 0.78 |
| Cumulative time in contact with index ¶ | 0.83 |
| Median daily frequency with index ** | 0.71 |
| Maximum frequency with index †† | 0.57 |
| Daily average frequency with index ‡ ‡ | 0.54 |
| Median daily duration with infected household members † | 0.25 |
| Maximum duration with infected household members ‡ | 0.79 |
| Median average daily duration with infected household members § | 0.27 |
| Cumulative time in contact with infected household members ¶ | 0.14 |
| Median daily frequency with infected household members ** | 0.32 |
| Maximum frequency with infected household members †† | 0.76 |
| Daily average frequency with infected household members ‡ ‡ | 0.18 |
-
*
Outcome investigated: testing positive for SARS-CoV-2.
-
†
Median daily duration (median of cumulative duration of close-range proximity events for each day of deployment, in minutes).
-
‡
Maximum duration (longest duration of a close-range proximity event during deployment, in minutes).
-
§
Median average daily duration (median of cumulative duration of close-range proximity events in the day divided by the cumulative number of close-range proximity events during that day, in minutes).
-
¶
Cumulative time in contact (cumulative duration of close-range proximity events over the deployment period divided by the number of days sensor was worn, in minutes).
-
**
Median daily frequency (median of number of close proximity events for each day of deployment).
-
††
Maximum frequency (highest number of close proximity events in one day during deployment).
-
‡ ‡
Daily average frequency (cumulative duration of close-range proximity events over the deployment period divided by the cumulative number of close-range proximity events during the deployment period).
Table 4
Factors associated with SARS-CoV-2 household transmission from index cases and acquisition in household contacts (contact parameters with index case), Klerksdorp and Soweto, South Africa, 2020–2021 (n=252).
| SARS-CoV-2 infection* | Univariate analysis | Multivariable analysis | Multivariable analysis (including contact parameter) | |||||||||
|---|---|---|---|---|---|---|---|---|---|---|---|---|
| Negative n=99 | Positive n=153 | OR (95% CI) | aOR (95% CI) | aOR (95% CI) | aOR (95% CI) | aOR (95% CI) | aOR (95% CI) | aOR (95% CI) | aOR (95% CI) | aOR (95% CI) | ||
| Index Characteristics | ||||||||||||
| Site | ||||||||||||
| Klerksdorp | 47/106 (44%) | 59/106 (56%) | Reference | |||||||||
| Soweto | 52/146 (36%) | 94/146 (64%) | 1.73 (0.72–4.14) | |||||||||
| Age (years) | ||||||||||||
| 18–34 | 36/76 (47%) | 40/76 (53%) | Reference | Reference | Reference | Reference | Reference | Reference | Reference | Reference | Reference | |
| 35–59 | 48/137 (35%) | 89/137 (65%) | 2.20 (0.80–6.02) | 2.21 (0.80–6.14) | 2.24 (0.79–6.32) | 2.17 (0.77–6.14) | 2.21 (0.79–6.15) | 2.51 (0.85–7.40) | 2.43 (0.85–6.94) | 2.19 (0.77–6.23) | 2.64 (0.89–7.85) | |
| ≥60 | 15/39 (38%) | 24/39 (62%) | 1.86 (0.47–7.37) | 2.08 (0.51–8.50) | 2.10 (0.50–8.82) | 1.96 (0.47–8.25) | 2.06 (0.49–8.57) | 2.40 (0.55–10.49) | 2.34 (0.55–9.98) | 2.03 (0.48–8.59) | 2.43 (0.55–10.80) | |
| Minimum Ct value | ||||||||||||
| >35 | 17/21 (81%) | 4/21 (19%) | Reference | Reference | Reference | Reference | Reference | Reference | Reference | Reference | Reference | |
| 30–35 | 23/50 (46%) | 27/50 (54%) | 7.58 (1.21–47.43) | 7.07 (0.75–66.23) | 7.23 (0.76–68.84) | 6.83 (0.72–64.85) | 6.88 (0.72–65.28) | 7.98 (0.79–80.47) | 7.62 (0.78–74.23) | 6.59 (0.68–64.07) | 8.06 (0.78–83.67) | |
| <30 | 58/178 (33%) | 120/178 (67%) | 16.84 (3.05–93.06) | 10.60 (1.40–80.08) | 10.77 (1.41–82.26) | 10.39 (1.36–79.27) | 10.36 (1.36–79.23) | 11.04 (1.38–88.37) | 11.08 (1.42–86.47) | 10.04 (1.29–78.05) | 11.05 (1.35–90.60) | |
| Unknown | 1/3 (33%) | 2/3 (67%) | 15.69 (0.31–793.51) | 7.22 (0.12–438.47) | 7.27 (0.12–450.06) | 6.79 (0.11–423.55) | 7.37 (0.12–465.42) | 7.55 (0.11–503.58) | 7.42 (0.12–467.86) | 6.85 (0.10–453.16) | 7.92 (0.11–558.92) | |
| SARS-CoV-2 variant | ||||||||||||
| non-Alpha/Beta/Delta | 5/14 (36%) | 9/14 (64%) | 1.22 (0.22–6.93) | 2.04 (0.31–13.41) | 2.12 (0.32–14.08) | 2.15 (0.32–14.51) | 2.06 (0.31–13.72) | 2.00 (0.29–13.76) | 1.99 (0.30–13.26) | 1.99 (0.29–13.61) | 2.07 (0.29–14.67) | |
| Alpha | 2/13 (15%) | 11/13 (85%) | 4.81 (0.59–39.19) | 5.02 (0.52–48.39) | 5.15 (0.48–55.49) | 5.48 (0.53–57.15) | 4.71 (0.43–51.12) | 3.45 (0.33–36.67) | 4.59 (0.47–44.90) | 5.02 (0.50–50.59) | 4.91 (0.47–51.69) | |
| Beta | 70/171 (41%) | 101/171 (59%) | Reference | Reference | Reference | Reference | Reference | Reference | Reference | Reference | Reference | |
| Delta | 8/38 (21%) | 30/38 (79%) | 3.24 (0.93–11.32) | 3.76 (0.97–14.55) | 3.90 (0.99–15.29) | 3.79 (0.96–14.95) | 3.81 (0.97–14.89) | 3.86 (0.96–15.53) | 3.88 (0.99–15.27) | 3.87 (0.97–15.53) | 3.94 (0.96–16.23) | |
| Variant Unknown | 14/16 (88%) | 2/16 (12%) | 0.06 (0.01–0.41) | 0.15 (0.01–1.60) | 0.16 (0.02–1.67) | 0.16 (0.01–1.66) | 0.15 (0.01–1.57) | 0.14 (0.01–1.56) | 0.14 (0.01–1.50) | 0.14 (0.01–1.55) | 0.14 (0.01–1.61) | |
| Contact characteristics | ||||||||||||
| Age (years) | ||||||||||||
| <5 | 8/11 (73%) | 3/11 (27%) | 0.17 (0.03–1.05) | 0.28 (0.04–1.90) | 0.30 (0.04–2.04) | 0.31 (0.05–2.11) | 0.28 (0.04–1.90) | 0.24 (0.03–1.66) | 0.24 (0.03–1.70) | 0.27 (0.04–1.97) | 0.22 (0.03–1.59) | |
| 5–12 | 21/48 (44%) | 27/48 (56%) | 0.69 (0.25–1.93) | 0.54 (0.19–1.52) | 0.53 (0.18–1.54) | 0.55 (0.19–1.56) | 0.51 (0.18–1.46) | 0.49 (0.17–1.42) | 0.47 (0.16–1.37) | 0.51 (0.17–1.48) | 0.48 (0.17–1.41) | |
| 13–17 | 11/42 (26%) | 31/42 (74%) | 2.55 (0.78–8.32) | 2.41 (0.72–8.08) | 2.42 (0.72–8.16) | 2.42 (0.72–8.17) | 2.38 (0.70–8.03) | 2.47 (0.72–8.45) | 2.46 (0.73–8.34) | 2.39 (0.71–8.12) | 2.57 (0.75–8.83) | |
| 18–34 | 22/60 (37%) | 38/60 (63%) | Reference | Reference | Reference | Reference | Reference | Reference | Reference | Reference | Reference | |
| 35–59 | 27/68 (40%) | 41/68 (60%) | 0.72 (0.28–1.87) | 0.60 (0.23–1.57) | 0.60 (0.23–1.59) | 0.61 (0.23–1.61) | 0.59 (0.22–1.56) | 0.60 (0.23–1.59) | 0.59 (0.22–1.57) | 0.58 (0.22–1.55) | 0.62 (0.23–1.65) | |
| ≥60 | 10/23 (43%) | 13/23 (57%) | 0.78 (0.21–2.93) | 0.61 (0.17–2.24) | 0.61 (0.17–2.27) | 0.61 (0.17–2.27) | 0.61 (0.16–2.23) | 0.65 (0.17–2.46) | 0.64 (0.17–2.37) | 0.61 (0.16–2.26) | 0.66 (0.17–2.54) | |
| Sex | ||||||||||||
| Male | 52/108 (48%) | 56/108 (52%) | Reference | Reference | Reference | Reference | Reference | Reference | Reference | Reference | Reference | |
| Female | 47/144 (33%) | 97/144 (67%) | 2.51 (1.25–5.02) | 2.38 (1.17–4.84) | 2.37 (1.15–4.86) | 2.44 (1.18–5.03) | 2.32 (1.14–4.74) | 2.25 (1.09–4.63) | 2.20 (1.07–4.53) | 2.36 (1.14–4.88) | 2.21 (1.07–4.59) | |
| Sleep in same room as index | ||||||||||||
| No | 68/171 (40%) | 103/171 (60%) | Reference | |||||||||
| Yes | 31/81 (38%) | 50/81 (62%) | 0.94 (0.47–1.88) | |||||||||
| Cared for by index | ||||||||||||
| No | 84/212 (40%) | 128/212 (60%) | Reference | |||||||||
| Yes | 15/40 (38%) | 25/40 (62%) | 0.92 (0.36–2.34) | |||||||||
| Median daily duration † | 5 (1-11) | 4 (2-12) | 0.99 (0.98–1.01) | 1.00 (0.98–1.02) | ||||||||
| Maximum duration ‡ | 17 (5–48) | 14 (4–38) | 1.00 (0.99–1.00) | 1.00 (0.99–1.01) | ||||||||
| Median average daily duration § | 0.53 (0.43–0.69) | 0.56 (0.44–0.67) | 1.15 (0.60–2.21) | 1.08 (0.50–2.30) | ||||||||
| Cumulative time in contact ¶ | 0.87 (0.37–1.80) | 0.90 (0.33–2.27) | 1.04 (0.92–1.17) | 1.08 (0.94–1.25) | ||||||||
| Median daily frequency ¶ | 6 (3-15) | 7 (3-15) | 1.00 (0.98–1.02) | 1.01 (0.99–1.03) | ||||||||
| Maximum frequency ** | 22 (8–52) | 19 (7–41) | 1.00 (0.99–1.01) | 1.00 (0.99–1.01) | ||||||||
| Daily average frequency †† | 1.00 (0.57–2.77) | 1.16 (0.53–2.70) | 1.06 (0.95–1.18) | 1.10 (0.96–1.25) | ||||||||
-
*
n/ row N (%); Median (interquartile range).
-
†
Median daily duration (median of cumulative duration of close-range proximity events for each day of deployment, in minutes).
-
‡
Maximum duration (longest duration of a close-range proximity event during deployment, in minutes).
-
§
Median average daily duration (median of cumulative duration of close-range proximity events in the day divided by the cumulative number of close-range proximity events during that day, in minutes).
-
¶
Cumulative time in contact (cumulative duration of close-range proximity events over the deployment period divided by the number of days sensor was worn, in minutes).
-
**
Maximum frequency (highest number of close proximity events in one day during deployment).
-
††
Daily average frequency (cumulative duration of close-range proximity events over the deployment period divided by the cumulative number of close-range proximity events during the deployment period). aOR: adjusted odds ratio. Significant associations on multivariable analysis in boldface. Factors investigated but not found significant on multivariable analysis: index sex, HIV status, underlying conditions, body mass index, current smoking, episode duration, serostatus at follow-up end; contact HIV status, underlying conditions, body mass index, current smoking, cared for by index.
Table 5
Factors associated with SARS-CoV-2 household transmission from index cases and acquisition in household contacts (contact parameters with index case) in households with no members excluded from analysis, Klerksdorp and Soweto, South Africa, 2020–2021, (n=192).
| SARS-CoV-2 infection* | Univariate analysis | Multivariable analysis | Multivariable analysis (including contact parameter) | |||||||||||
|---|---|---|---|---|---|---|---|---|---|---|---|---|---|---|
| Negative n=66 | Positive n=126 | OR (95% CI) | aOR (95% CI) | aOR (95% CI) | ||||||||||
| Index Characteristics | ||||||||||||||
| Site | ||||||||||||||
| Klerksdorp | 25/70 (36%) | 45/70 (64%) | Reference | |||||||||||
| Soweto | 41/122 (34%) | 81/122 (66%) | 1.30 (0.42–4.00) | |||||||||||
| Age (years) | ||||||||||||||
| 18–34 | 20/48 (42%) | 28/48 (58%) | Reference | Reference | Reference | Reference | Reference | Reference | Reference | Reference | Reference | |||
| 35–59 | 32/111 (29%) | 79/111 (71%) | 2.52 (0.70–9.13) | 2.13 (0.60–7.55) | 1.88 (0.58–6.15) | 1.99 (0.60–6.55) | 2.09 (0.63–6.97) | 1.98 (0.55–7.11) | 2.02 (0.59–6.89) | 1.86 (0.54–6.38) | 2.09 (0.63–7.00) | |||
| ≥60 | 14/33 (42%) | 19/33 (58%) | 1.01 (0.20–5.19) | 1.41 (0.24–8.22) | 1.22 (0.23–6.62) | 1.31 (0.24–7.23) | 1.38 (0.24–7.84) | 1.34 (0.23–7.74) | 1.35 (0.24–7.72) | 1.26 (0.23–6.94) | 1.43 (0.26–7.91) | |||
| Minimum Ct value | ||||||||||||||
| >35 | 16/18 (89%) | 2/18 (11%) | Reference | Reference | Reference | Reference | Reference | Reference | Reference | Reference | Reference | |||
| 30–35 | 15/38 (39%) | 23/38 (61%) | 22.18 (2.39–205.39) | 23.38 (1.23–445.33) | 21.38 (1.41–325.01) | 22.55 (1.43–354.91) | 23.36 (1.40–389.09) | 21.73 (1.24–381.17) | 21.25 (1.30–347.22) | 18.86 (1.18–301.62) | 22.49 (1.37–368.46) | |||
| <30 | 34/133 (26%) | 99/133 (74%) | 48.47 (5.80–404.75) | 39.72 (2.69–585.90) | 37.61 (3.28–431.72) | 38.32 (3.24–452.80) | 39.80 (3.20–495.62) | 37.67 (2.76–513.85) | 36.87 (3.03–448.62) | 32.87 (2.61–413.51) | 38.58 (3.14–473.57) | |||
| Unknown | 1/3 (33%) | 2/3 (67%) | 30.11 (0.61–1,497.22) | 14.55 (0.18–1,148.81) | 13.46 (0.22–836.17) | 14.11 (0.22–923.86) | 15.49 (0.22–1,110.09) | 14.21 (0.20–1,025.63) | 13.14 (0.19–918.99) | 11.86 (0.19–755.20) | 13.83 (0.20–952.08) | |||
| SARS-CoV-2 variant | ||||||||||||||
| non-Alpha/Beta/Delta | 3/8 (38%) | 5/8 (62%) | 0.68 (0.09–5.16) | 0.68 (0.09–5.16) | 1.79 (0.13–24.54) | 1.71 (0.14–20.48) | 1.76 (0.14–21.84) | 1.85 (0.14–23.74) | 1.75 (0.14–22.72) | 1.71 (0.13–21.95) | 1.60 (0.13–20.06) | |||
| Alpha | 1/11 (9.1%) | 10/11 (91%) | 7.00 (0.47–103.30) | 7.00 (0.47–103.30) | 5.58 (0.32–96.65) | 8.18 (0.32–206.89) | 6.52 (0.32–132.55) | 5.76 (0.25–133.53) | 7.47 (0.29–194.23) | 5.51 (0.29–103.13) | 5.83 (0.36–94.07) | |||
| Beta | 45/130 (35%) | 85/130 (65%) | Reference | Reference | Reference | Reference | Reference | Reference | Reference | Reference | Reference | |||
| Delta | 7/33 (21%) | 26/33 (79%) | 2.17 (0.61–7.64) | 2.17 (0.61–7.64) | 3.01 (0.67–13.53) | 2.82 (0.68–11.69) | 2.90 (0.68–12.35) | 3.01 (0.69–13.17) | 2.91 (0.68–12.50) | 2.85 (0.66–12.41) | 2.73 (0.65–11.51) | |||
| Variant Unknown | 10/10 (100%) | 0/10 (0%) | NA | NA | NA | NA | NA | NA | NA | NA | NA | |||
| Contact characteristics | ||||||||||||||
| Age (years) | ||||||||||||||
| <5 | 7/8 (88%) | 1/8 (12%) | 0.01 (0.00–0.27) | 0.03 (0.00–0.50) | 0.03 (0.00–0.51) | 0.03 (0.00–0.48) | 0.03 (0.00–0.46) | 0.03 (0.00–0.52) | 0.03 (0.00–0.48) | 0.03 (0.00–0.65) | 0.03 (0.00–0.44) | |||
| 5–12 | 14/37 (38%) | 23/37 (62%) | 0.38 (0.10–1.40) | 0.33 (0.09–1.20) | 0.38 (0.10–1.34) | 0.35 (0.10–1.23) | 0.33 (0.10–1.16) | 0.34 (0.09–1.23) | 0.35 (0.10–1.24) | 0.37 (0.10–1.37) | 0.33 (0.09–1.14) | |||
| 13–17 | 7/33 (21%) | 26/33 (79%) | 1.68 (0.38–7.41) | 1.66 (0.34–8.03) | 1.57 (0.33–7.58) | 1.63 (0.33–7.96) | 1.65 (0.33–8.22) | 1.61 (0.34–7.72) | 1.68 (0.34–8.31) | 1.63 (0.35–7.65) | 1.66 (0.33–8.25) | |||
| 18–34 | 10/42 (24%) | 32/42 (76%) | Reference | Reference | Reference | Reference | Reference | Reference | Reference | Reference | Reference | |||
| 35–59 | 23/57 (40%) | 34/57 (60%) | 0.36 (0.11–1.19) | 0.35 (0.11–1.13) | 0.36 (0.11–1.10) | 0.35 (0.11–1.10) | 0.35 (0.11–1.09) | 0.34 (0.10–1.09) | 0.36 (0.11–1.11) | 0.36 (0.11–1.16) | 0.34 (0.11–1.08) | |||
| ≥60 | 5/15 (33%) | 10/15 (67%) | 0.47 (0.08–2.68) | 0.42 (0.08–2.30) | 0.41 (0.08–2.09) | 0.42 (0.08–2.16) | 0.43 (0.08–2.22) | 0.41 (0.08–2.19) | 0.43 (0.08–2.23) | 0.41 (0.08–2.19) | 0.41 (0.08–2.12) | |||
| Sex | ||||||||||||||
| Male | 33/79 (42%) | 46/79 (58%) | Reference | Reference | Reference | Reference | Reference | Reference | Reference | Reference | Reference | |||
| Female | 33/113 (29%) | 80/113 (71%) | 2.40 (1.05–5.46) | 2.28 (0.96–5.43) | 2.42 (1.04–5.66) | 2.38 (1.01–5.62) | 2.30 (0.99–5.36) | 2.36 (0.99–5.63) | 2.34 (0.99–5.55) | 2.45 (1.02–5.87) | 2.29 (0.97–5.39) | |||
| Sleep in same room as index | ||||||||||||||
| No | 46/133 (35%) | 87/133 (65%) | Reference | |||||||||||
| Yes | 20/59 (34%) | 39/59 (66%) | 0.90 (0.39–2.08) | |||||||||||
| Cared for by index | ||||||||||||||
| No | 54/160 (34%) | 106/160 (66%) | Reference | |||||||||||
| Yes | 12/32 (38%) | 20/32 (62%) | 0.60 (0.19–1.86) | |||||||||||
| Median daily duration † | 6 (1-14) | 4 (1-12) | 0.99 (0.97–1.01) | 0.99 (0.97–1.02) | ||||||||||
| Maximum duration ‡ | 18 (5–51) | 13 (3–37) | 1.00 (0.99–1.00) | 1.00 (0.99–1.01) | ||||||||||
| Median average daily duration § | 0.53 (0.43–0.75) | 0.52 (0.42–0.67) | 1.10 (0.53–2.27) | 1.00 (0.42–2.34) | ||||||||||
| Cumulative time in contact ¶ | 1.01 (0.37–2.26) | 0.88 (0.32–2.34) | 0.98 (0.85–1.12) | 0.96 (0.80–1.16) | ||||||||||
| Median daily frequency ** | 9 (3-16) | 7 (3-15) | 0.99 (0.97–1.01) | 1.00 (0.97–1.02) | ||||||||||
| Maximum frequency †† | 24 (8–68) | 19 (6–40) | 0.99 (0.98–1.00) | 0.99 (0.98–1.01) | ||||||||||
| Daily average frequency ‡ ‡ | 1.40 (0.60–3.15) | 1.07 (0.50–2.70) | 0.98 (0.84–1.15) | 0.98 (0.81–1.18) | ||||||||||
-
*
n/ row N (%); Median (interquartile range).
-
†
Median daily duration (median of cumulative duration of close-range proximity events for each day of deployment, in minutes).
-
‡
Maximum duration (longest duration of a close-range proximity event during deployment, in minutes).
-
§
Median average daily duration (median of cumulative duration of close-range proximity events in the day divided by the cumulative number of close-range proximity events during that day, in minutes).
-
¶
Cumulative time in contact (cumulative duration of close-range proximity events over the deployment period divided by the number of days sensor was worn, in minutes).
-
**
Median daily frequency (median of number of close proximity events for each day of deployment).
-
††
Maximum frequency (highest number of close proximity events in one day during deployment).
-
‡ ‡
Daily average frequency (cumulative duration of close-range proximity events over the deployment period divided by the cumulative number of close-range proximity events during the deployment period). aOR: adjusted odds ratio. Significant associations on multivariable analysis in boldface.
Table 6
Factors associated with SARS-CoV-2 acquisition within the household (contact parameters with SARS-CoV-2 infected household members), Klerksdorp and Soweto, South Africa, 2020–2021, (n=340).
| SARS-CoV-2 infection | Univariate analysis | Multivariable analysis | Multivariable analysis (including contact parameter) | ||||||||
|---|---|---|---|---|---|---|---|---|---|---|---|
| Negative n=99 | Positive n=241 | OR (95% CI) | aOR (95% CI) | aOR (95% CI) | aOR (95% CI) | aOR (95% CI) | aOR (95% CI) | aOR (95% CI) | aOR (95% CI) | aOR (95% CI) | |
| Site | |||||||||||
| Klerksdorp | 47/143 (33%) | 96/143 (67%) | Reference | ||||||||
| Soweto | 52/197 (26%) | 145/197 (74%) | 1.70 (0.64–4.51) | ||||||||
| Contact Age (years) | |||||||||||
| <5 | 8/11 (73%) | 3/11 (27%) | 0.06 (0.01–0.41) | 1.88 (0.25–14.08) | 0.09 (0.01–0.71) | 0.12 (0.01–0.96) | 0.11 (0.01–0.89) | 0.08 (0.01–0.65) | 0.09 (0.01–0.75) | 0.15 (0.02–1.21) | 0.08 (0.01–0.63) |
| 5–12 | 21/48 (44%) | 27/48 (56%) | 0.20 (0.07–0.57) | 9.43 (1.17–75.88) | 0.17 (0.05–0.56) | 0.24 (0.08–0.75) | 0.21 (0.07–0.62) | 0.16 (0.05–0.48) | 0.18 (0.05–0.59) | 0.25 (0.08–0.76) | 0.15 (0.05–0.48) |
| 13–17 | 11/42 (26%) | 31/42 (74%) | 0.87 (0.28–2.70) | 10.08 (1.34–76.04) | 0.96 (0.28–3.28) | 1.00 (0.30–3.36) | 1.12 (0.34–3.74) | 0.93 (0.28–3.06) | 0.95 (0.28–3.25) | 1.05 (0.32–3.44) | 0.92 (0.28–3.04) |
| 18–34 | 22/85 (26%) | 63/85 (74%) | Reference | Reference | Reference | Reference | Reference | Reference | Reference | Reference | Reference |
| 35–59 | 27/116 (23%) | 89/116 (77%) | 0.98 (0.41–2.30) | 8.79 (1.14–67.74) | 0.87 (0.34–2.23) | 0.91 (0.36–2.30) | 0.84 (0.34–2.12) | 0.86 (0.35–2.13) | 0.88 (0.34–2.24) | 0.92 (0.37–2.27) | 0.87 (0.35–2.15) |
| ≥60 | 10/38 (26%) | 28/38 (74%) | 1.11 (0.34–3.58) | 8.71 (0.98–77.54) | 0.86 (0.24–3.05) | 0.86 (0.25–3.00) | 0.82 (0.24–2.78) | 0.85 (0.25–2.87) | 0.87 (0.25–3.05) | 0.89 (0.27–2.97) | 0.85 (0.25–2.88) |
| Contact Sex | |||||||||||
| Male | 52/135 (39%) | 83/135 (61%) | Reference | ||||||||
| Female | 47/205 (23%) | 158/205 (77%) | 2.64 (1.40–4.95) | ||||||||
| Body mass index | |||||||||||
| Normal weight | 50/140 (36%) | 90/140 (64%) | Reference | ||||||||
| Underweight | 7/20 (35%) | 13/20 (65%) | 0.89 (0.22–3.53) | 0.90 (0.22–3.67) | 0.87 (0.20–3.87) | 1.04 (0.24–4.56) | 0.88 (0.21–3.73) | 0.78 (0.19–3.29) | 0.90 (0.20–3.96) | 1.01 (0.25–4.09) | 0.81 (0.19–3.38) |
| Overweight | 22/69 (32%) | 47/69 (68%) | 1.61 (0.70–3.71) | 1.17 (0.49–2.76) | 1.17 (0.47–2.91) | 1.15 (0.47–2.83) | 1.17 (0.49–2.78) | 1.18 (0.49–2.82) | 1.16 (0.47–2.89) | 1.14 (0.48–2.67) | 1.17 (0.49–2.80) |
| Obese | 17/106 (16%) | 89/106 (84%) | 7.47 (3.10–17.98) | 4.14 (1.54–11.11) | 4.31 (1.54–12.03) | 3.83 (1.40–10.48) | 3.91 (1.44–10.62) | 4.40 (1.62–11.92) | 4.20 (1.51–11.69) | 3.84 (1.44–10.23) | 4.33 (1.60–11.69) |
| Unknown | 3/5 (60%) | 2/5 (40%) | 0.53 (0.03–10.58) | NA | NA | NA | NA | NA | NA | NA | NA |
| Current smoking | |||||||||||
| Yes | 18/43 (42%) | 25/43 (58%) | Reference | Reference | Reference | Reference | Reference | Reference | Reference | Reference | Reference |
| No | 80/294 (27%) | 214/294 (73%) | 3.02 (1.19–7.63) | 3.24 (1.15–9.18) | 3.12 (1.04–9.39) | 3.33 (1.12–9.94) | 3.54 (1.23–10.15) | 3.14 (1.10–8.97) | 3.16 (1.05–9.53) | 3.42 (1.21–9.69) | 3.10 (1.09–8.80) |
| Unknown | 1/3 (33%) | 2/3 (67%) | 8.06 (0.17–386.04) | NA | NA | NA | NA | NA | NA | NA | NA |
| SARS-CoV-2 variant | |||||||||||
| non-Alpha/Beta/Delta | 5/19 (26%) | 14/19 (74%) | 1.21 (0.15–9.96) | 1.19 (0.14–10.06) | 1.13 (0.12–10.46) | 1.61 (0.18–14.66) | 1.27 (0.13–12.50) | 1.08 (0.12–9.43) | 1.17 (0.13–10.77) | 1.49 (0.18–12.64) | 1.08 (0.13–9.25) |
| Alpha | 2/17 (12%) | 15/17 (88%) | 3.19 (0.24–42.01) | 4.61 (0.31–69.26) | 3.79 (0.24–60.31) | 7.77 (0.49–122.66) | 18.70 (0.95–368.10) | 3.19 (0.19–53.63) | 4.30 (0.28–65.69) | 5.42 (0.36–82.77) | 3.92 (0.26–60.08) |
| Beta | 70/230 (30%) | 160/230 (70%) | Reference | Reference | Reference | Reference | Reference | Reference | Reference | Reference | Reference |
| Delta | 8/50 (16%) | 42/50 (84%) | 3.00 (0.64–13.99) | 3.00 (0.60–14.89) | 2.78 (0.54–14.39) | 3.63 (0.72–18.44) | 4.08 (0.73–22.94) | 2.29 (0.44–11.95) | 2.92 (0.57–14.94) | 3.40 (0.69–16.67) | 2.33 (0.45–12.09) |
| Variant Unknown | 14/24 (58%) | 10/24 (42%) | 0.48 (0.09–2.57) | 0.45 (0.08–2.48) | 0.45 (0.08–2.67) | 0.47 (0.08–2.72) | 0.37 (0.06–2.29) | 0.46 (0.08–2.56) | 0.46 (0.08–2.70) | 0.46 (0.09–2.44) | 0.46 (0.08–2.56) |
| Median daily duration * | 460 (165–1,250) | 680 (160–1,760) | 1.00 (1.00–1.00) | 1.00 (1.00–1.00) | |||||||
| Maximum duration † | 39 (10–81) | 39 (13–96) | 0.99 (0.99–1.00) | 1.00 (0.99–1.00) | |||||||
| Median average daily duration ‡ | 33 (28–44) | 37 (28–47) | 0.98 (0.96–0.99) | 0.98 (0.96–0.99) | |||||||
| Cumulative time in contact § | 95 (46–198) | 127 (40–363) | 1.00 (1.00–1.00) | 1.00 (1.00–1.00) | |||||||
| Median daily frequency ¶ | 13 (5–27) | 18 (4–38) | 0.99 (0.99–1.00) | 1.00 (0.99–1.01) | |||||||
| Maximum frequency ** | 41 (15–83) | 46 (18–100) | 0.99 (0.99–1.00) | 1.00 (0.99–1.00) | |||||||
| Daily average frequency †† | 2.4 (1.0–3.7) | 2.9 (1.0–6.8) | 1.01 (0.98–1.04) | 1.03 (0.97–1.10) | |||||||
-
1 n/ row N (%); Median (interquartile range).
-
*
Median daily duration (median of cumulative duration of close-range proximity events for each day of deployment, in minutes).
-
†
Maximum duration (longest duration of a close-range proximity event during deployment, in minutes).
-
‡
Median average daily duration (median of cumulative duration of close-range proximity events in the day divided by the cumulative number of close-range proximity events during that day, in minutes).
-
§
Cumulative time in contact (cumulative duration of close-range proximity events over the deployment period divided by the number of days sensor was worn, in minutes).
-
¶
Median daily frequency (median of number of close proximity events for each day of deployment).
-
**
Maximum frequency (highest number of close proximity events in one day during deployment).
-
††
Daily average frequency (cumulative duration of close-range proximity events over the deployment period divided by the cumulative number of close-range proximity events during the deployment period). aOR: adjusted odds ratio. Significant associations on multivariable analysis in boldface. Factors investigated but not found significant on multivariable analysis: sex, HIV status, and underlying conditions.
Additional files
Download links
A two-part list of links to download the article, or parts of the article, in various formats.
Downloads (link to download the article as PDF)
Open citations (links to open the citations from this article in various online reference manager services)
Cite this article (links to download the citations from this article in formats compatible with various reference manager tools)
Association of close-range contact patterns with SARS-CoV-2: a household transmission study
eLife 12:e84753.
https://doi.org/10.7554/eLife.84753


