A computational method for predicting the most likely evolutionary trajectories in the stepwise accumulation of resistance mutations
- Department of Infection Biology, London School of Hygiene and Tropical Medicine, United Kingdom
- Department of Infectious Disease Epidemiology, London School of Hygiene and Tropical Medicine, United Kingdom
Figures
Figure 1

The probability of simulated evolutionary pathways to quadruple mutations (a) N51I,C59R,S108N,I164L in P. falciparum dihydrofolate reductase (PfDHFR) and (b) N50I,S58R,S117N,I173L in P. vivax DHFR (PvDHFR).
Line thickness indicates the total probability of a mutation when considering all pathways it can occur in, determined from the frequency of that step in all realised mutational pathways from all runs. Dotted lines indicate zero probability of a mutation at that step. The most likely pathway in total is denoted by a red star. The most likely pathway to the quadruple mutation is highlighted in dark red and the second most likely pathway to the quadruple mutation is highlighted in lighter red. The probabilities corresponding to these plots can be found in supplementary files ‘PfDHFR_total_pathway_probabilities.csv’ and ‘PvDHFR_total_pathway_probabilities.csv’ on Zenodo for (a) and (b), respectively.
Figure 2

The total frequency of the combinations of mutations found in our isolate data for sets of four mutations (a) N51I, C59R, S108N, and I164L in P. falciparum dihydrofolate reductase (PfDHFR), and (b) N50I, S58R, S117N, and I173L in P. vivax DHFR (PvDHFR).
All frequencies have been multiplied by a factor of 10 to enable clear identification of those mutations occurring in one isolate only. The frequencies are also given as the percentage of the total number of isolates, which for PfDHFR is 6762 and PvDHFR is 847.
Figure 3

The P. falciparum dihydrofolate reductase (PfDHFR) isolate data was grouped into seven geographical areas: South America, West Africa, Middle Africa, Eastern Africa, Southern Asia, Southeastern Asia, and Melanesia.
The bar charts display the frequency (log scale) of the combinations of the four mutations N51I, C59R, S108N, and I164L. The frequency data has been multiplied by a factor of 10 to enable clear identification of those mutations occurring in one isolate only. The most likely evolutionary trajectory inferred from the frequency of combinations are included above the corresponding frequency chart from which the pathways were inferred indicated by mutations separated by dark red arrows. Alternative pathways are indicated by mutations separated by light red arrows. Where only single mutations are present a pathway is not inferred. (See Supplementary data folder ‘PfDHFR/IsolateMutationFrequency’ for the frequency of all mutations found in the isolate data from these regions.)
Figure 4
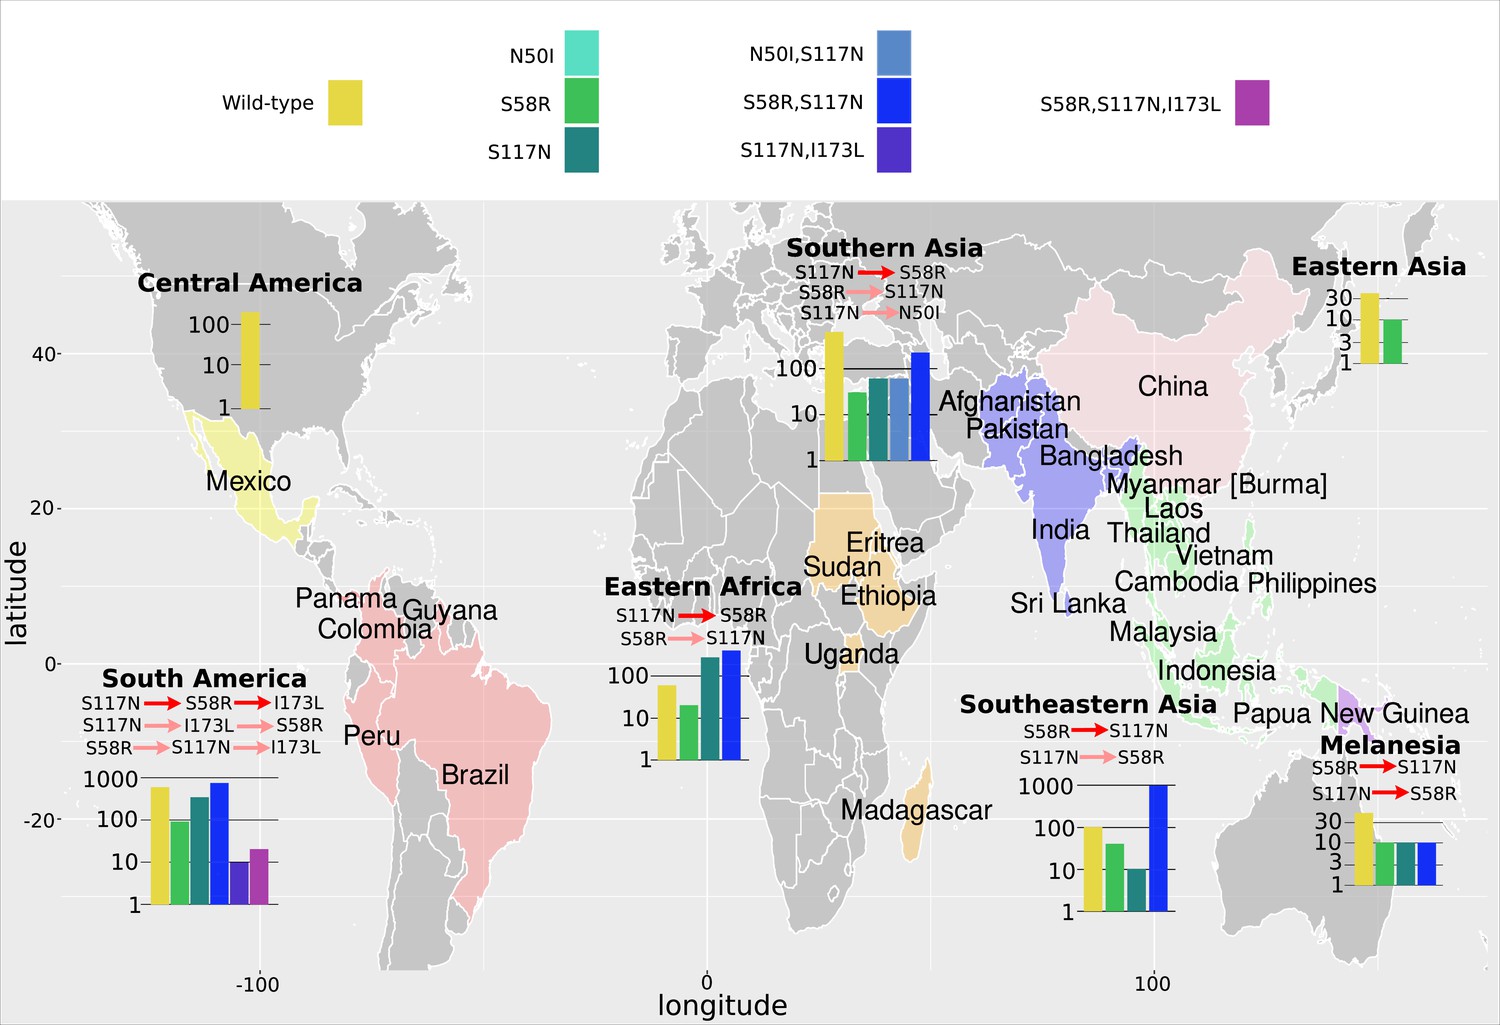
The P. vivax dihydrofolate reductase (PvDHFR) isolate data was grouped into seven geographical areas: Central America, South America, Eastern Africa, Southern Asia, Eastern Asia, Southeastern Asia, and Melanesia.
The bar charts display the frequency (log scale) of the combinations of the four mutations N50I, S58R, S117N, and I173L. The frequency data has been multiplied by a factor of 10 to enable clear identification of those mutations occurring in one isolate only. The most likely evolutionary trajectory inferred from the frequency of combinations are included above the corresponding frequency chart from which the pathways were inferred indicated by mutations separated by dark red arrows. Alternative pathways are indicated by mutations separated by light red arrows. Where only single mutations are present a pathway is not inferred.
Appendix 1—figure 1

The distribution of pyrimethamine-P. falciparum dihydrofolate reductase (PfDHFR) binding free energy changes predicted by Flex ddG for 35 runs for subset of mutations considered in Sirawaraporn et al., 1997, namely (a) N51I, (b) C59R, (c) S108N, (d) I164L, (e) N51I,S108N, (f) C59R,S108N, (g) N51I,C59R,S108N, (h) C59R,S108N,I164L, and (i) N51I,C59R,S108N,I164L.
Appendix 1—figure 2

The distribution of pyrimethamine-P. falciparum dihydrofolate reductase (PfDHFR) binding free energy changes predicted by Flex ddG for 250 runs for subset of mutations considered in Sirawaraporn et al., 1997, namely (a) N51I, (b) C59R, (c) S108N, (d) I164L, (e) N51I,S108N, (f) C59R,S108N, (g) N51I,C59R,S108N, (h) C59R,S108N,I164L, and (i) N51I,C59R,S108N,I164L.
Appendix 1—figure 3
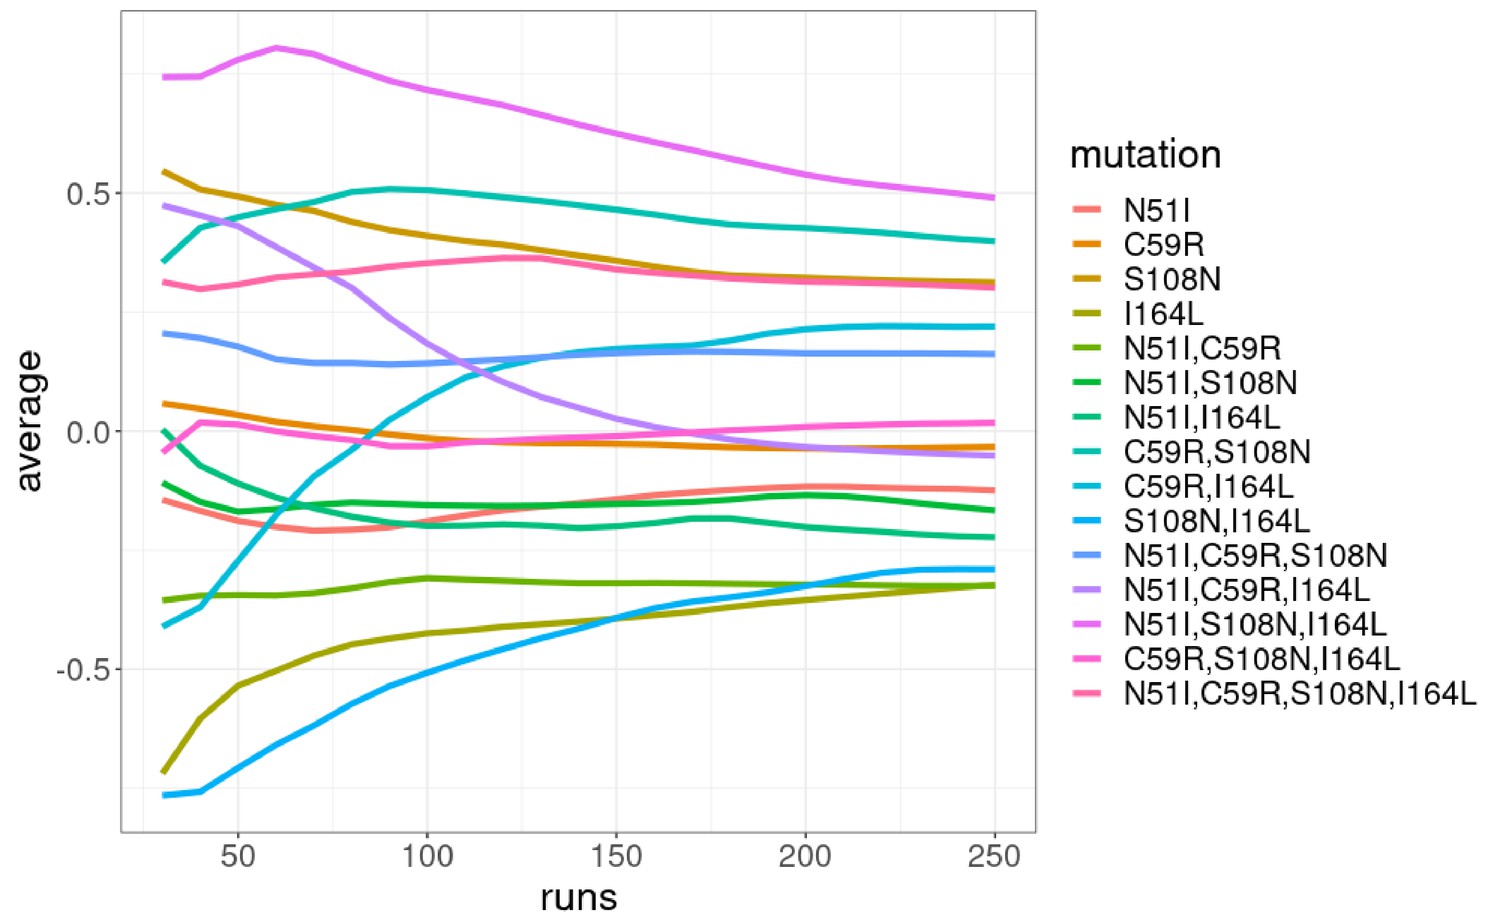
The running average of the Flex ddG prediction distributions for n=30,…,250 runs in intervals of 10 for the P. falciparum dihydrofolate reductase (PfDHFR) mutation combinations.
Appendix 1—figure 4
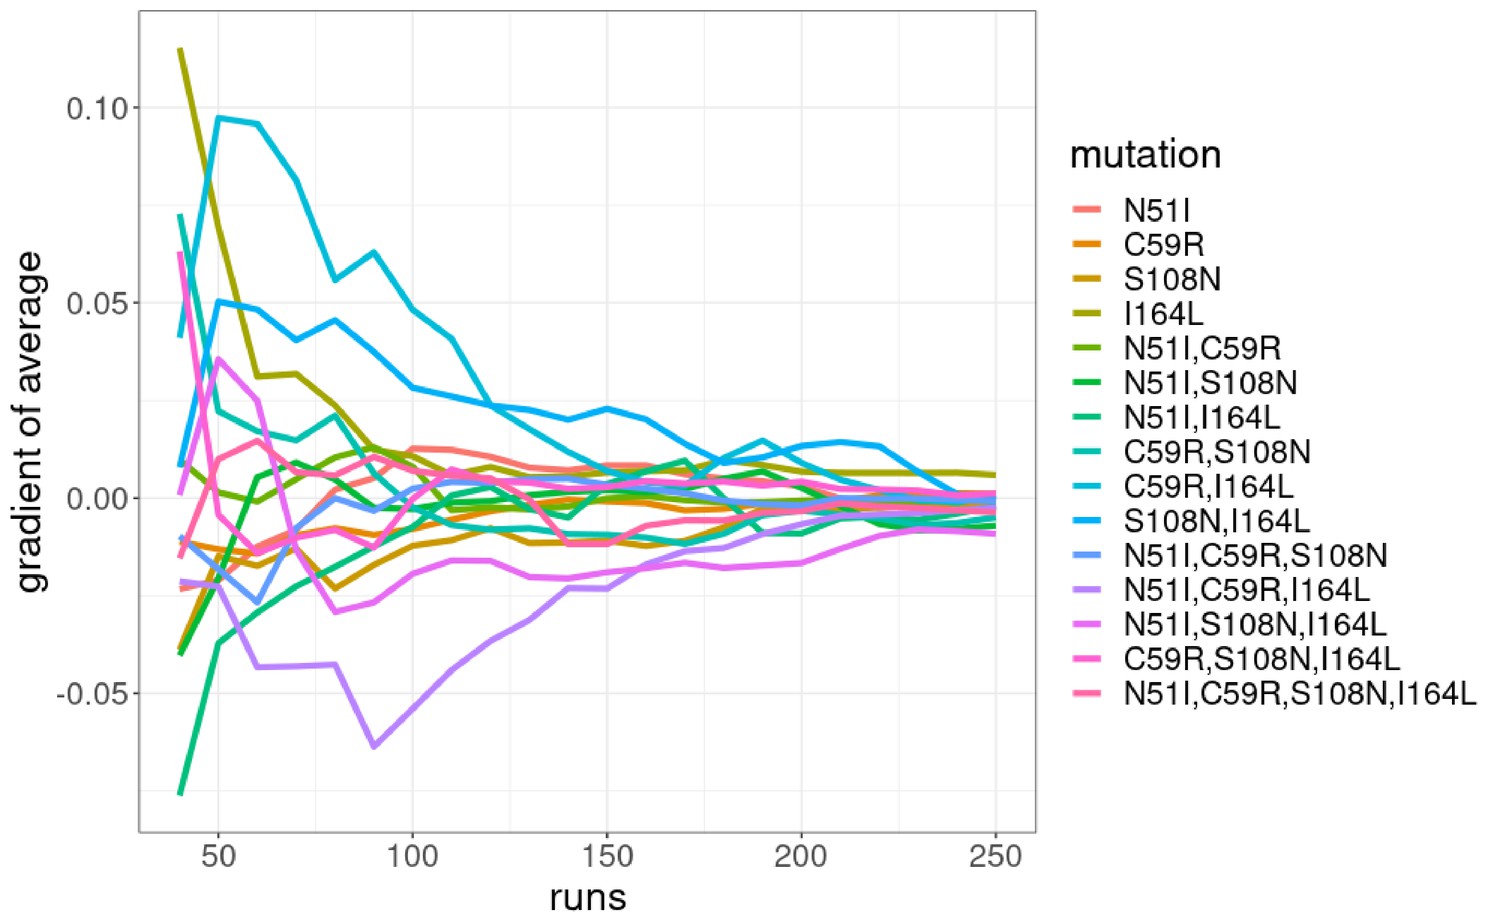
The gradient of the running average of the Flex ddG prediction distributions for n=30,…,250 runs in intervals of 10 for the P. falciparum dihydrofolate reductase (PfDHFR) mutation combinations.
Appendix 2—figure 1

Fitness hypercube for combinatorically complete set of 24 P. falciparum dihydrofolate reductase (PfDHFR) genotypes.
Paths of increasing fitness are shown inn green. Grey lines depict increasing fitness between genotypes separated by a single mutation. The fitness of each genotype is predicted using the average of each Flex ddG distribution to parameterise Equation 1.
Appendix 3—figure 1
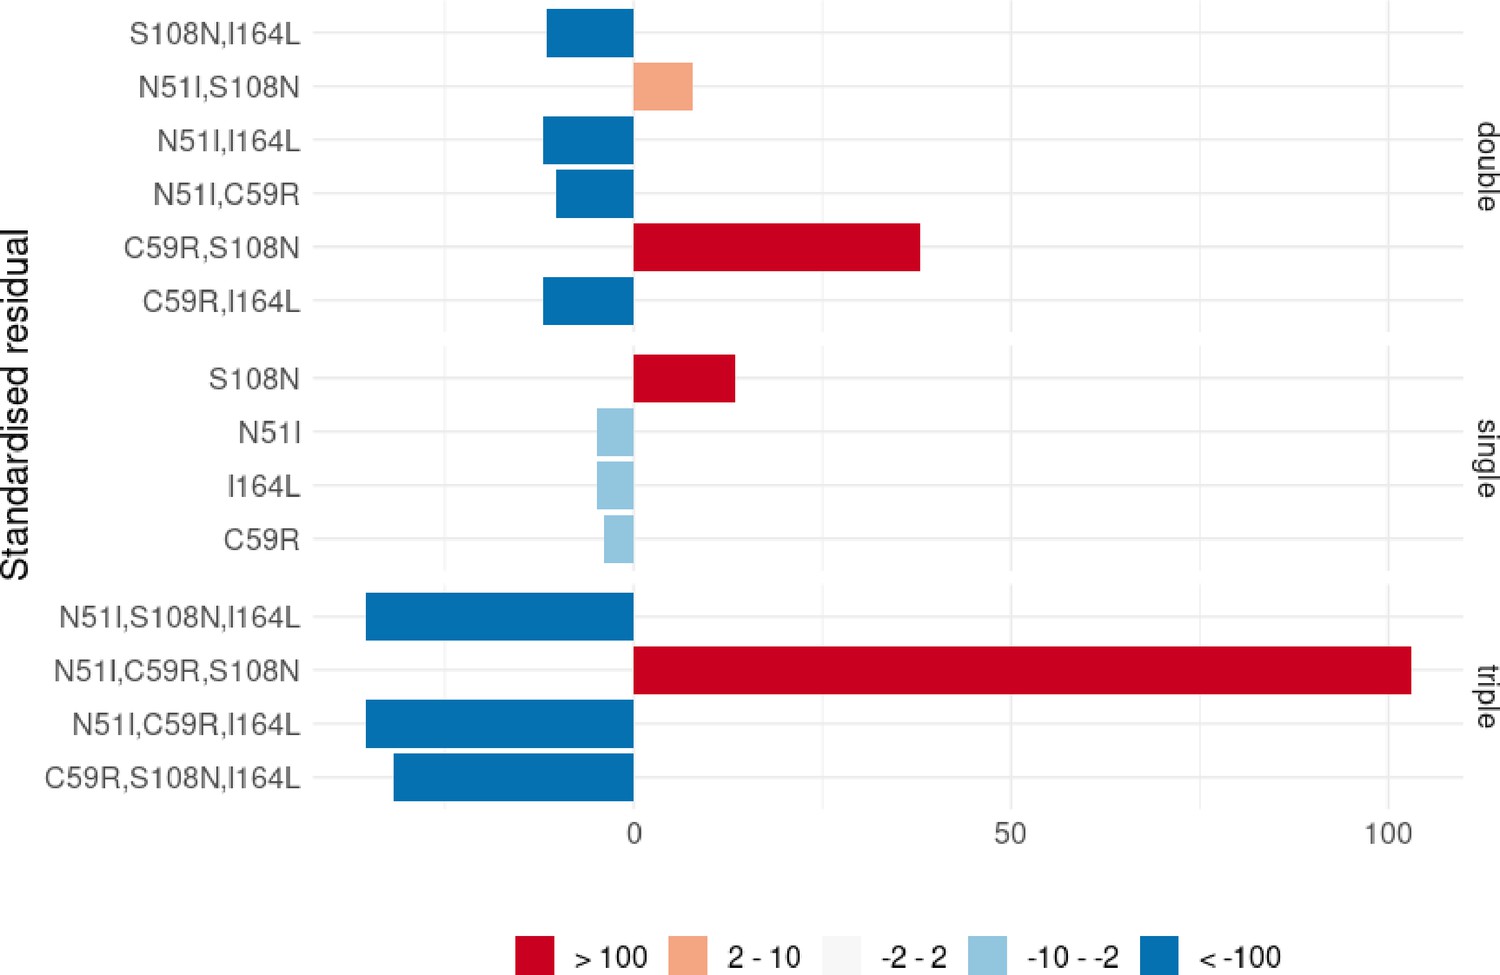
The standardised residuals of the individual P. falciparum dihydrofolate reductase (PfDHFR) mutations from the Chi-squared tests applied to single, double, and triple mutants.
Appendix 3—figure 2

The standardised residuals of the individual P. vivax dihydrofolate reductase (PvDHFR) mutations from the Chi-squared tests applied to single and double mutants.
Appendix 4—figure 1
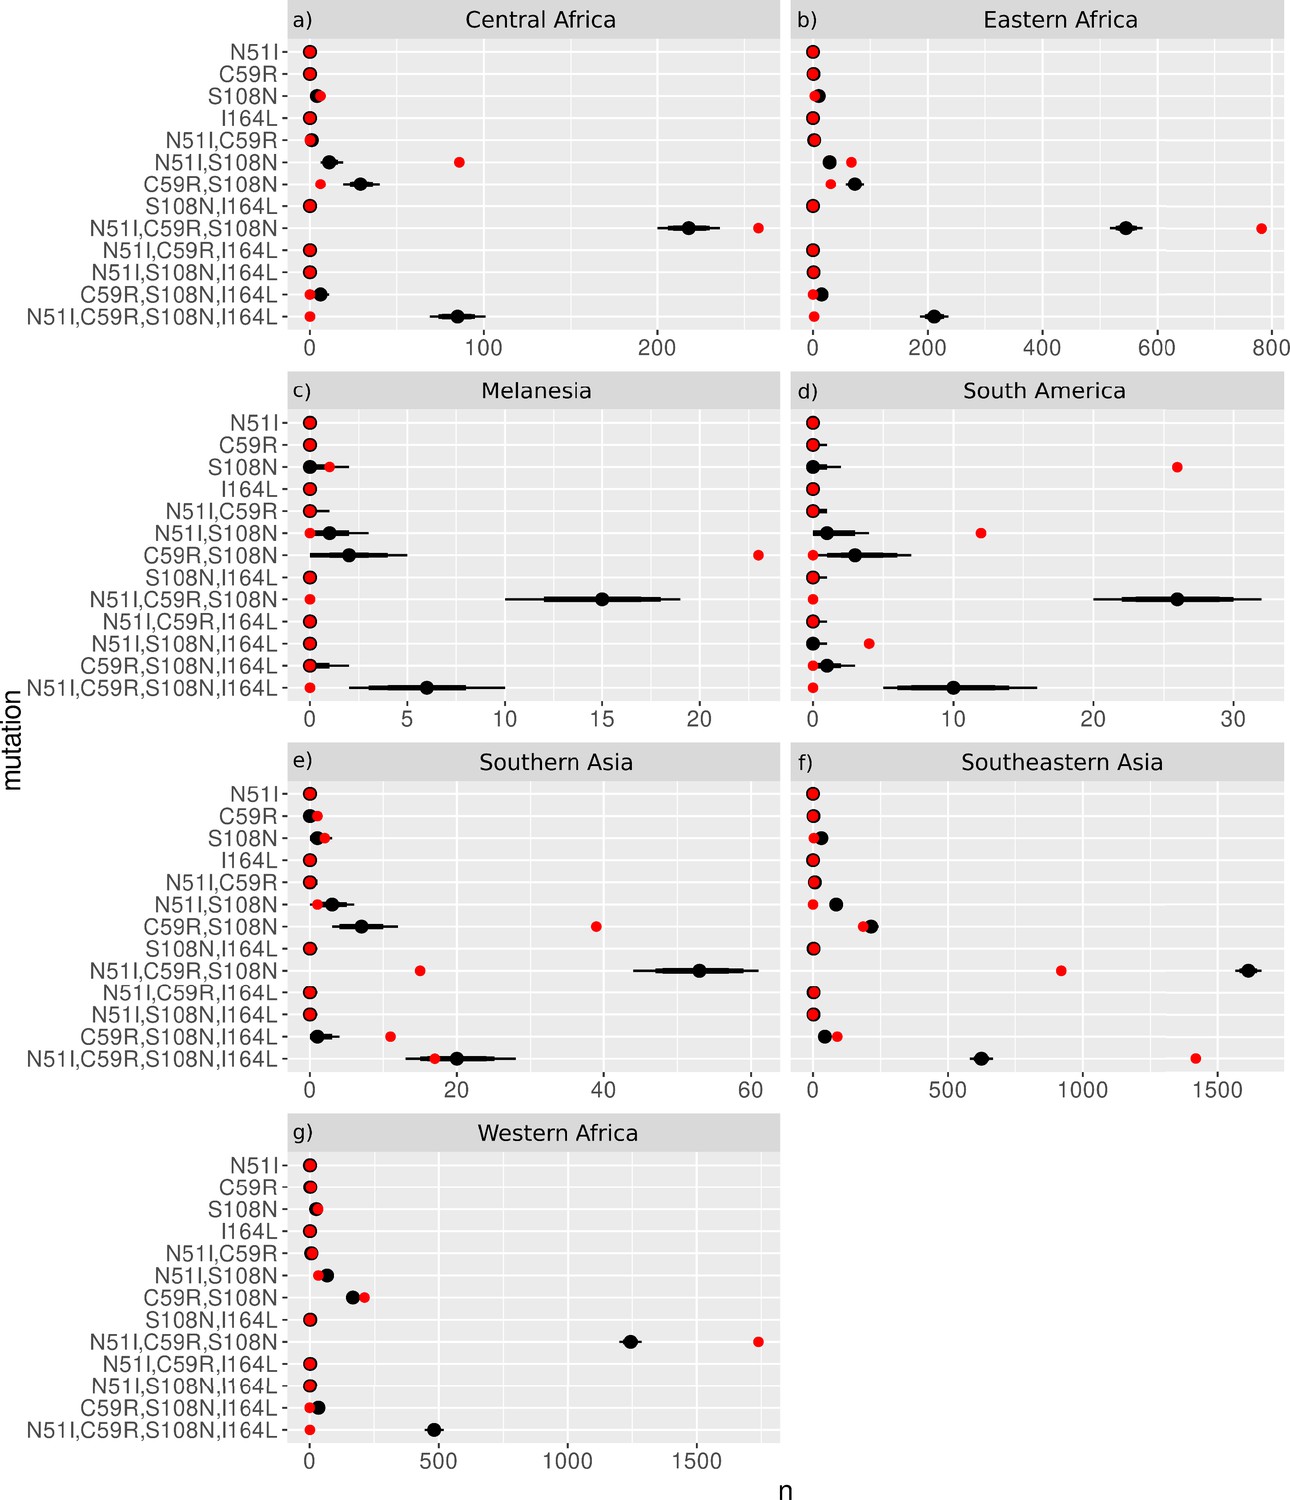
The frequency distributions of the P. falciparum dihydrofolate reductase (PfDHFR) mutations from the 50,000 samples taken from the worldwide distribution with replacement for sample sizes (N) equal to the regional datasets from (a) Middle Africa (N=359), (b) Eastern Africa (N=904), (c) Melanesia (N=119), (d) South America (N=50), (e) Southern Asia (N=86), (f) Southeastern Asia (N=2650), and (g) Western Africa (N=2594).
The red dots show the frequency of each mutation from the regional datasets and the black distributions show the 69%, 80%, and 90% quantile intervals of frequency distributions from the samples.
Appendix 4—figure 2
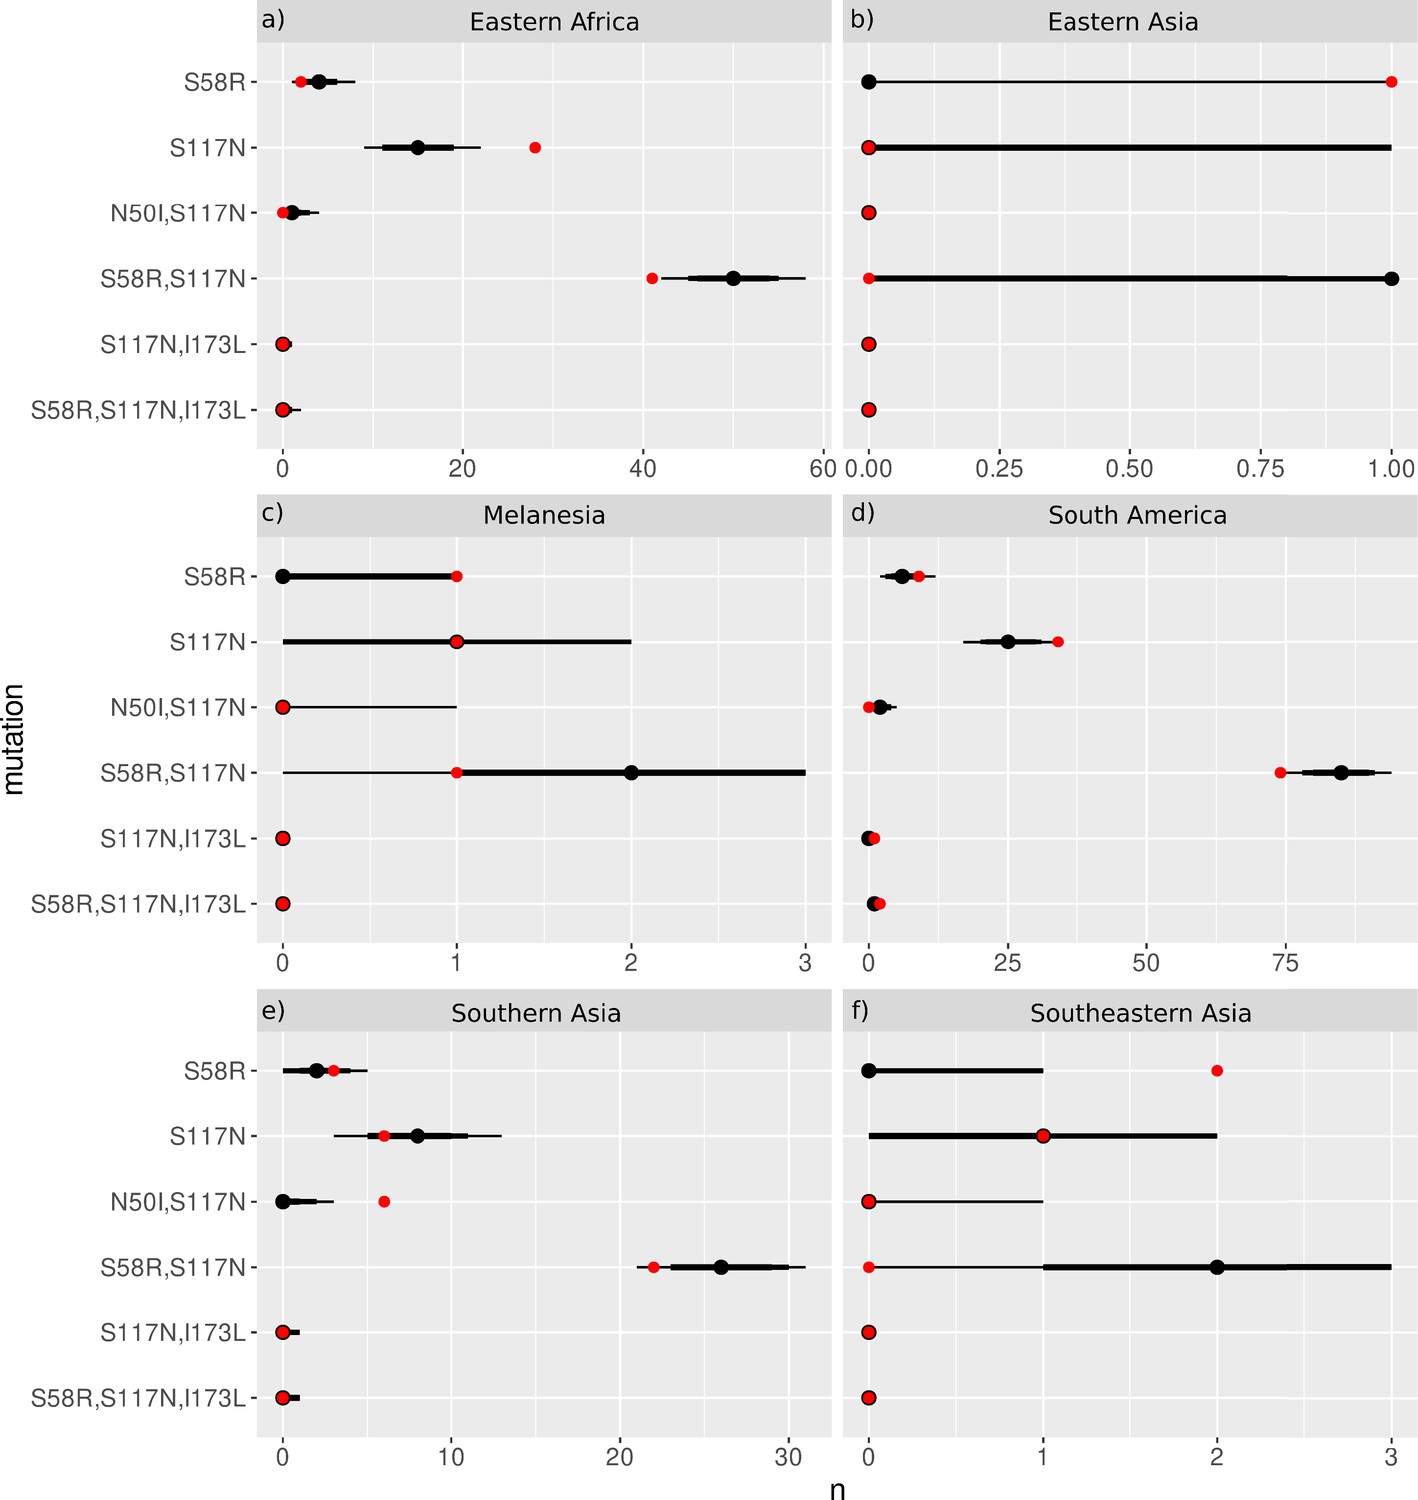
The frequency distributions of the P. vivax dihydrofolate reductase (PvDHFR) mutations from the 50,000 samples taken from the worldwide distribution with replacement for sample sizes (N) equal to the regional datasets from (a) Eastern Africa (N=84), (b) Eastern Asia (N=12), (c) Melanesia (N=26), (d) South America (N=257), (e) Southern Asia (N=37), and (f) Southeastern Asia (N=334).
The distribution from Central America was not analysed because it did not contain any combinations of the four PvDHFR mutations being studied. The red dots show the frequency of each mutation from the regional datasets and the black distributions show the 69%, 80%, and 90% quantile intervals of frequency distributions from the samples.
Tables
Table 1
Correlation between Flex ddG predictions for 250 runs and experimental data (see table 4 of Sirawaraporn et al., 1997) for P. falciparum dihydrofolate reductase (PfDHFR) pyrimethamine resistance mutations.
| Mutation | *(kcal/mol) | Exp. sum† | Exp I.E.‡ | §(kcal/mol) | Sum¶ | I.E.§** |
|---|---|---|---|---|---|---|
| N51I | –0.783 | –0.124 | ||||
| C59R | –0.184 | –0.033 | ||||
| S108N | 1.297 | 0.312 | ||||
| I164L | –0.351 | –0.323 | ||||
| N51I,S108N | 1.89 | 0.514 | 1.376 | –0.166 | 0.188 | –0.354 |
| C59R,S108N | 2.29 | 1.113 | 1.177 | 0.399 | 0.279 | 0.119 |
| N51I,C59R,S108N | 2.595 | 0.33 | 2.265 | 0.162 | 0.155 | 0.007 |
| C59R,S108N,I164L | 3.283 | 0.762 | 2.521 | 0.018 | –0.043 | 0.061 |
| N51I,C59R,S108N,I164L | 3.761 | –0.021 | 3.782 | 0.301 | –0.168 | 0.469 |
| Pearson correlation | 0.611 | 0.660 | 0.756 | |||
| Correctly classified | 8/9 | 4/5 | 4/5 |
-
*
Experimentally measured PfDHFR pyrimethamine binding free energy change data from Sirawaraporn et al., 1997.
-
†
Sum of experimental values of binding free energy change for independent mutations.
-
‡
Interaction energy calculated as the difference between experimentally measured values of binding free energy change of multiple mutant compared to the sum of the independent mutations involved.
-
§
Change in PfDHFR pyrimethamine binding free energy predicted by Flex ddG calculated as the average of the distribution of runs. Free energy predictions from Rosetta are in Rosetta Energy Units, however the authors of Flex ddG applied a generalised additive model to reweight the predictions and make the output more comparable to units of kcal/mol (Barlow et al., 2018).
-
¶
Sum of Flex ddG predictions for independent mutations.
-
**
Interaction energy calculated as the difference between Flex ddG predicted binding free energy change of multiple mutant compared to the sum of the independent mutations.
Appendix 1—table 1
Correlation between Flex ddG predictions for 35 runs and experimental data (see Table 4 of Sirawaraporn et al., 1997) for P. falciparum dihydrofolate reductase (PfDHFR) pyrimethamine resistance mutations.
| Mutation | *(kcal/mol) | Exp. sum† | Exp I.E. ‡ | §(kcal/mol) | Sum¶ | I.E.§** |
|---|---|---|---|---|---|---|
| N51I | –0.783 | –0.156 | ||||
| C59R | –0.184 | 0.059 | ||||
| S108N | 1.297 | 0.521 | ||||
| I164L | –0.351 | –0.661 | ||||
| N51I,S108N | 1.89 | 0.514 | 1.376 | –0.132 | 0.365 | –0.497 |
| C59R,S108N | 2.29 | 1.113 | 1.177 | 0.399 | 0.580 | –0.183 |
| N51I,C59R,S108N | 2.595 | 0.33 | 2.265 | 0.196 | 0.425 | –0.228 |
| C59R,S108N,I164L | 3.283 | 0.762 | 2.521 | –0.004 | –0.081 | 0.077 |
| N51I,C59R,S108N,I164L | 3.761 | –0.021 | 3.782 | 0.306 | –0.237 | 0.542 |
| Pearson correlation | 0.536 | 0.580 | 0.900 | |||
| Correctly classified | 5/9 | 4/5 | 2/5 |
-
*
Experimentally measured PfDHFR pyrimethamine binding free energy change data from Sirawaraporn et al., 1997.
-
†
Sum of experimental values of binding free energy change for independent mutations.
-
‡
Interaction energy calculated as the difference between experimentally measured values of binding free energy change of multiple mutant compared to the sum of the independent mutations involved.
-
§
Change in PfDHFR pyrimethamine binding free energy predicted by Flex ddG calculated as the average of the distribution of runs. Free energy predictions from Rosetta are in Rosetta Energy Units, however the authors of Flex ddG applied a generalised additive model to reweight the predictions and make the output more comparable to units of kcal/mol (Barlow et al., 2018).
-
¶
Sum of Flex ddG predictions for independent mutations
-
**
Interaction energy calculated as the difference between Flex ddG predicted binding free energy change of multiple mutant compared to the sum of the independent mutations.
Additional files
Download links
A two-part list of links to download the article, or parts of the article, in various formats.
Downloads (link to download the article as PDF)
Open citations (links to open the citations from this article in various online reference manager services)
Cite this article (links to download the citations from this article in formats compatible with various reference manager tools)
A computational method for predicting the most likely evolutionary trajectories in the stepwise accumulation of resistance mutations
eLife 12:e84756.
https://doi.org/10.7554/eLife.84756


