Genetically engineered mesenchymal stem cells as a nitric oxide reservoir for acute kidney injury therapy
- Nankai University School of Medicine, China
- The Key Laboratory of Bioactive Materials, Ministry of Education, Nankai University, the College of Life Sciences, China
- National Key Laboratory of Kidney Diseases, Chinese PLA General Hospital, China
- Jiangxi Engineering Research Center for Stem Cell, Shangrao, China
- Tianjin Key Laboratory of Engineering Technologies for Cell Pharmaceutical, National Engineering Research Center of Cell Products, AmCellGene Co., Ltd, China
- Beijing Engineering Laboratory of Perinatal Stem Cells, Beijing Institute of Health and Stem Cells, Health & Biotech Co, China
- Tianjin Key Laboratory of Human Development and Reproductive Regulation, Tianjin Central Hospital of Gynecology Obstetrics, Nankai University Affiliated Hospital of Obstetrics and Gynecology, China
Figures
Figure 1 with 5 supplements
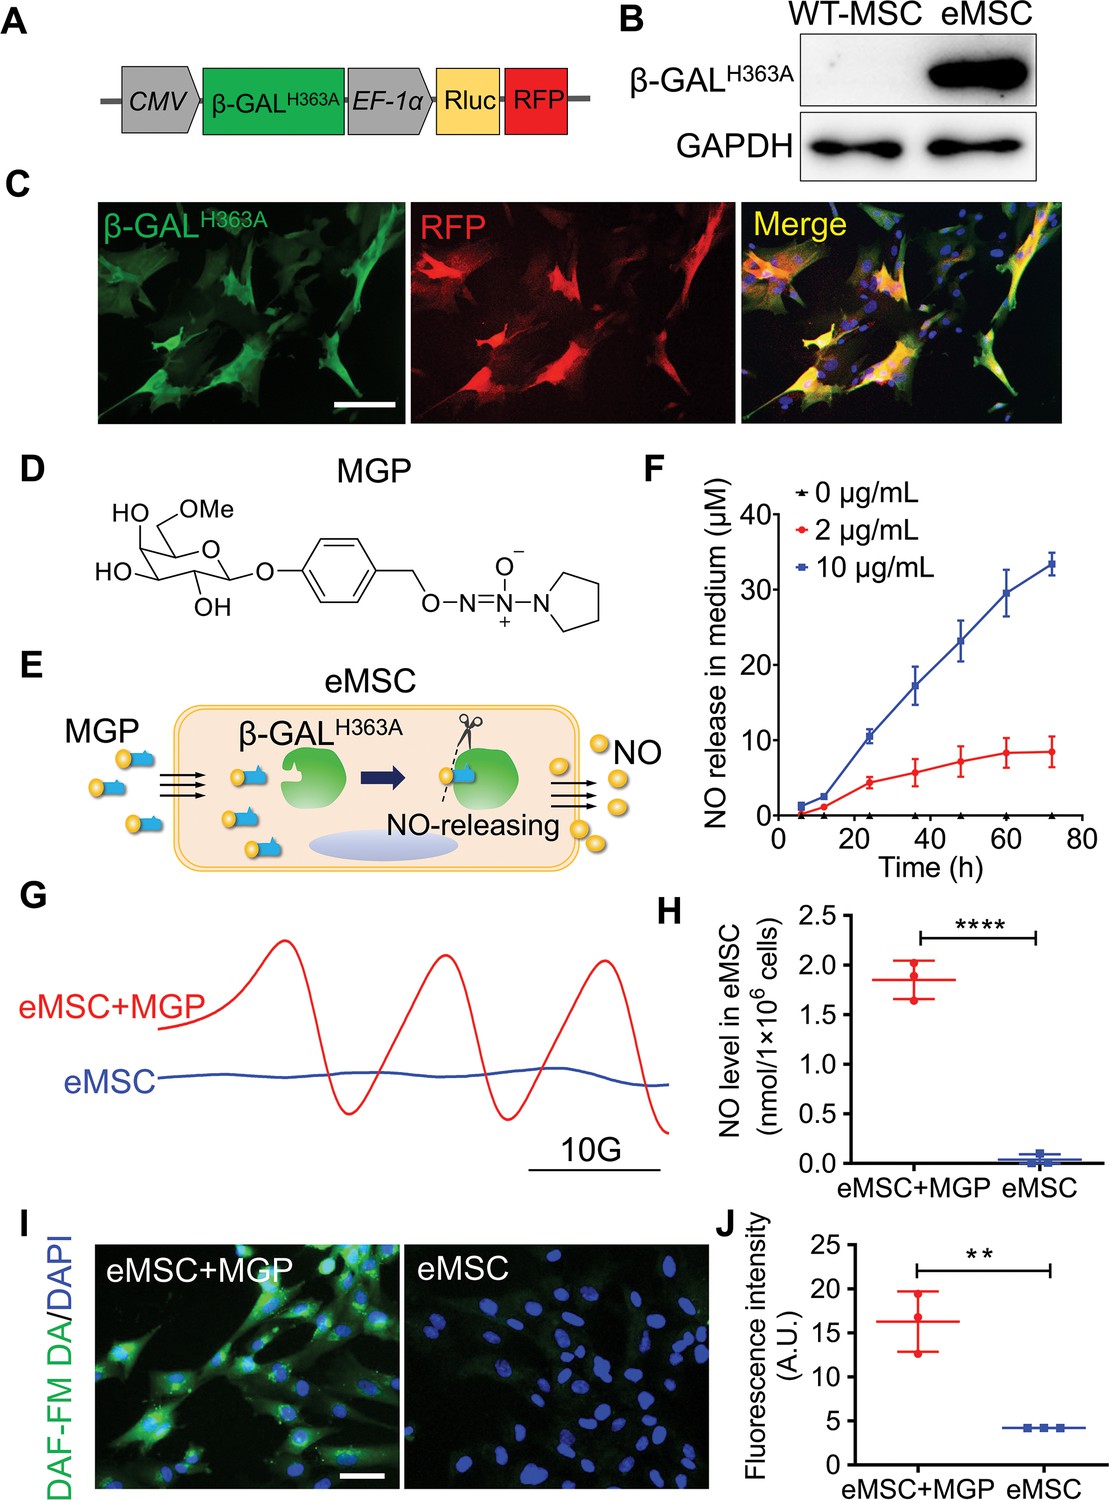
Evaluation of the nitric oxide (NO)-engineered mesenchymal stem cell (eMSC) system in NO generation and release.
(A) Genetically modifying placenta-derived MSCs to express mutant β-galactosidase (β-GALH363A) through a lentiviral transduction system, thus enabling continuous production of β-GALH363A for NO delivery. Moreover, the MSCs also stably expressed Renilla luciferase (Rluc) and red fluorescence protein (RFP) for in vivo bioluminescence imaging and immunofluorescence analysis, respectively. (B) The protein expression of β-GALH363A in eMSCs was evaluated by 6×His tag protein detection due to β-GALH363A carrying a C-terminal 6×His tag. (C) Immunofluorescence staining of β-GALH363A (green) in eMSCs. Scale bars, 50 μm. (D) Structure of the NO prodrug MGP, 6-methyl-galactose-benzyl-oxy NONOate. (E) Construction of the NO-eMSC system and the mechanism of NO release from this system. (F) The NO release profile from eMSCs administered at different concentrations of NO-prodrug MGP was determined using the Griess assay. n=3. (G) NO release from eMSCs with MGP administration in vitro was assessed by electron paramagnetic resonance (EPR), and the characteristic triplet EPR signal was observed. eMSCs served as controls. (H) The amount of NO-Fe (DETC)2 was calibrated using TEMPO as a standard. A total of 1×10⁶ eMSCs approximately released 1 nmol NO in 1 hr. n=3. (I) The intracellular NO release in eMSCs treated with MGP was measured by diaminofluorescein (DAF) staining, in which DAF-FM DA is a cell-permeable fluorescent probe for the detection of intracellular NO. Scale bar, 25 μm. (J) Quantification of DAF fluorescence intensity in eMSCs in the presence of 5 µg/mL MGP for 6 hr. eMSC+MGP, eMSCs with MGP administration. All data are presented as the mean ± SD, **p<0.01, ***p<0.001, ****p<0.0001.
-
Figure 1—source data 1
Synthesis route of the NO-prodrug MGP.
- https://cdn.elifesciences.org/articles/84820/elife-84820-fig1-data1-v2.docx
Figure 1—figure supplement 1
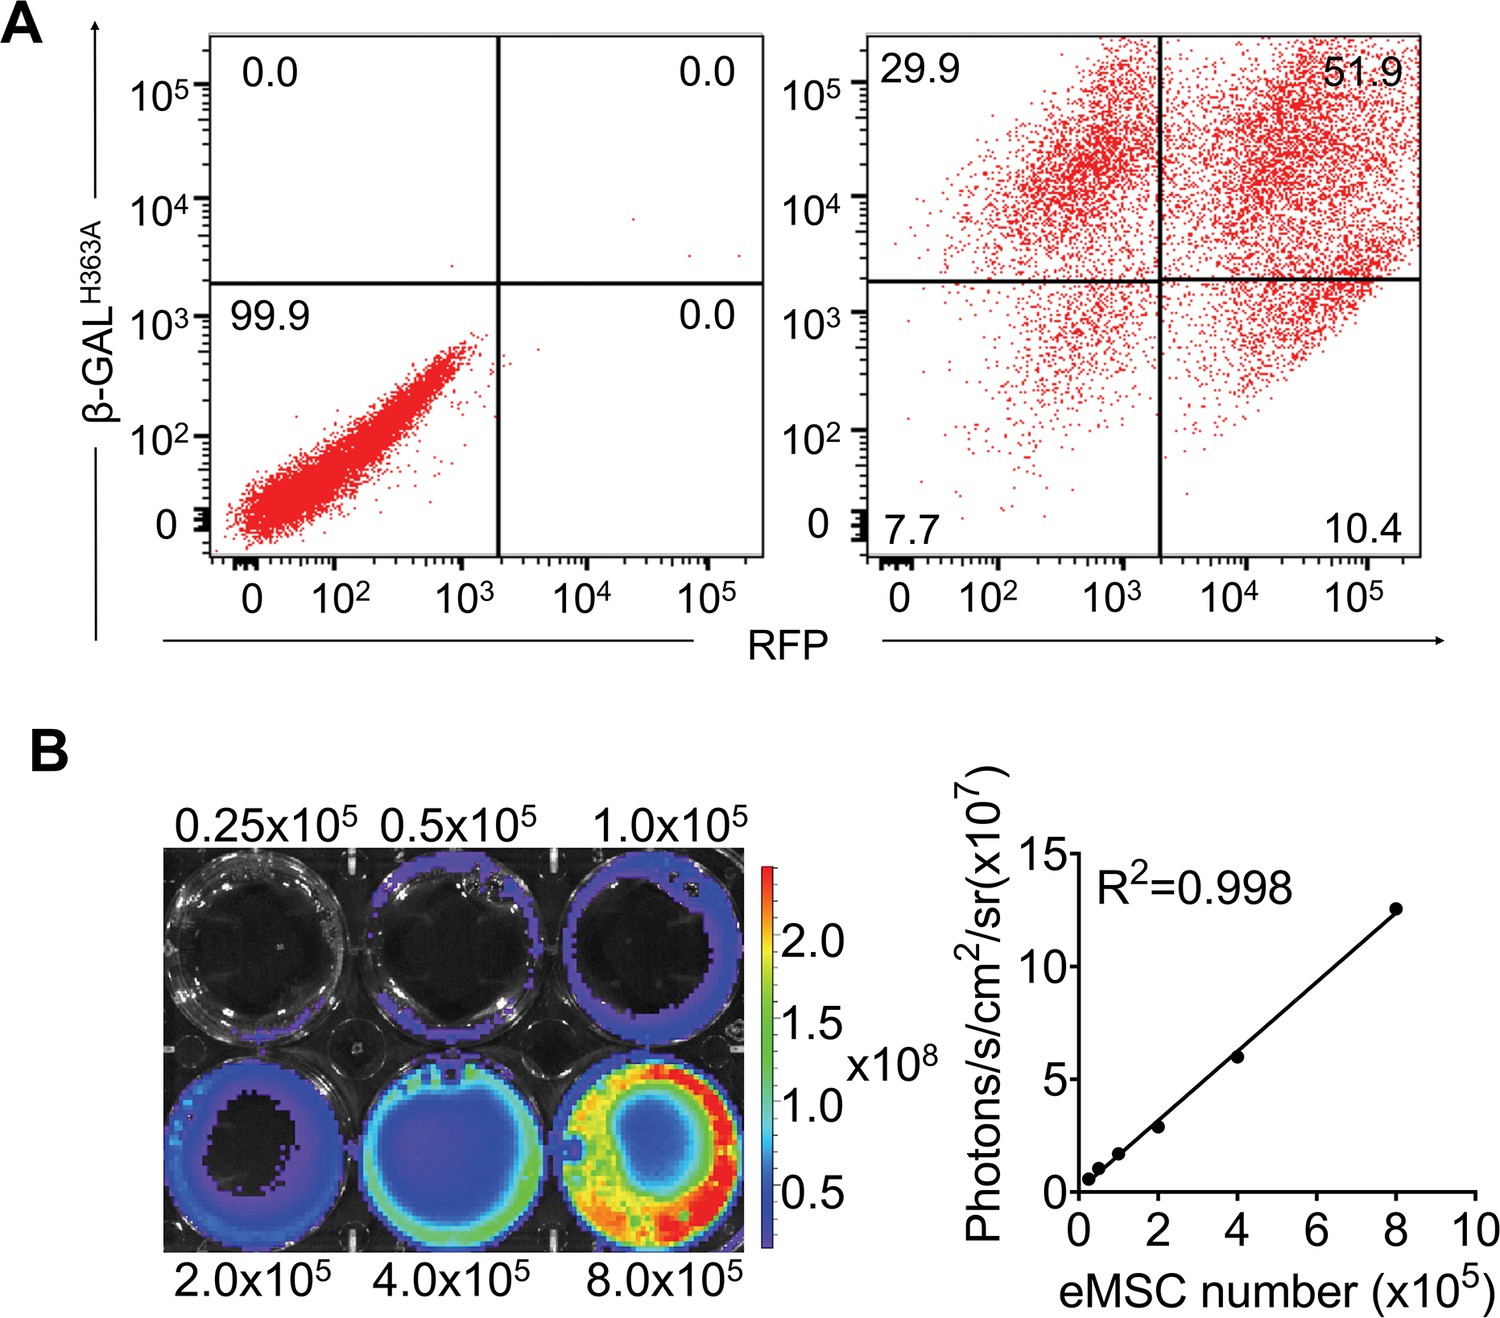
Transduction of hP-mesenchymal stem cells (MSCs) with lentiviral vectors carrying β-GALH363A, Renilla luciferase (Rluc), and red fluorescence protein (RFP).
(A) The percentage of cells that are positive for both β-GALH363A and RFP by flow cytometry. FACS analysis showed that approximately 51.9% of cells were β-GALH363A and RFP double-positive after lentiviral transduction at 48 hr. β-GALH363A and RFP double-positive cells were isolated by FACS for further experiments. (B) Ex vivo bioluminescence imaging (BLI) of eMSCs showed a robust linear relationship (R2=0.998) of Rluc expression with cell numbers in the presence of coelenterazine.
Figure 1—figure supplement 2

Characterization of the engineered mesenchymal stem cell (eMSC).
(A) Comparison of immunophenotypes between wild-type MSCs and eMSCs. Negative: CD45, CD31 and CD34; positive: CD90 and CD44. (B) Morphology of wild-type MSCs and eMSCs. Scale bars, 100 μm. Data are expressed as the mean ± SD; data are not statistically significant when p values are not shown; n=3 per group.
Figure 1—figure supplement 3
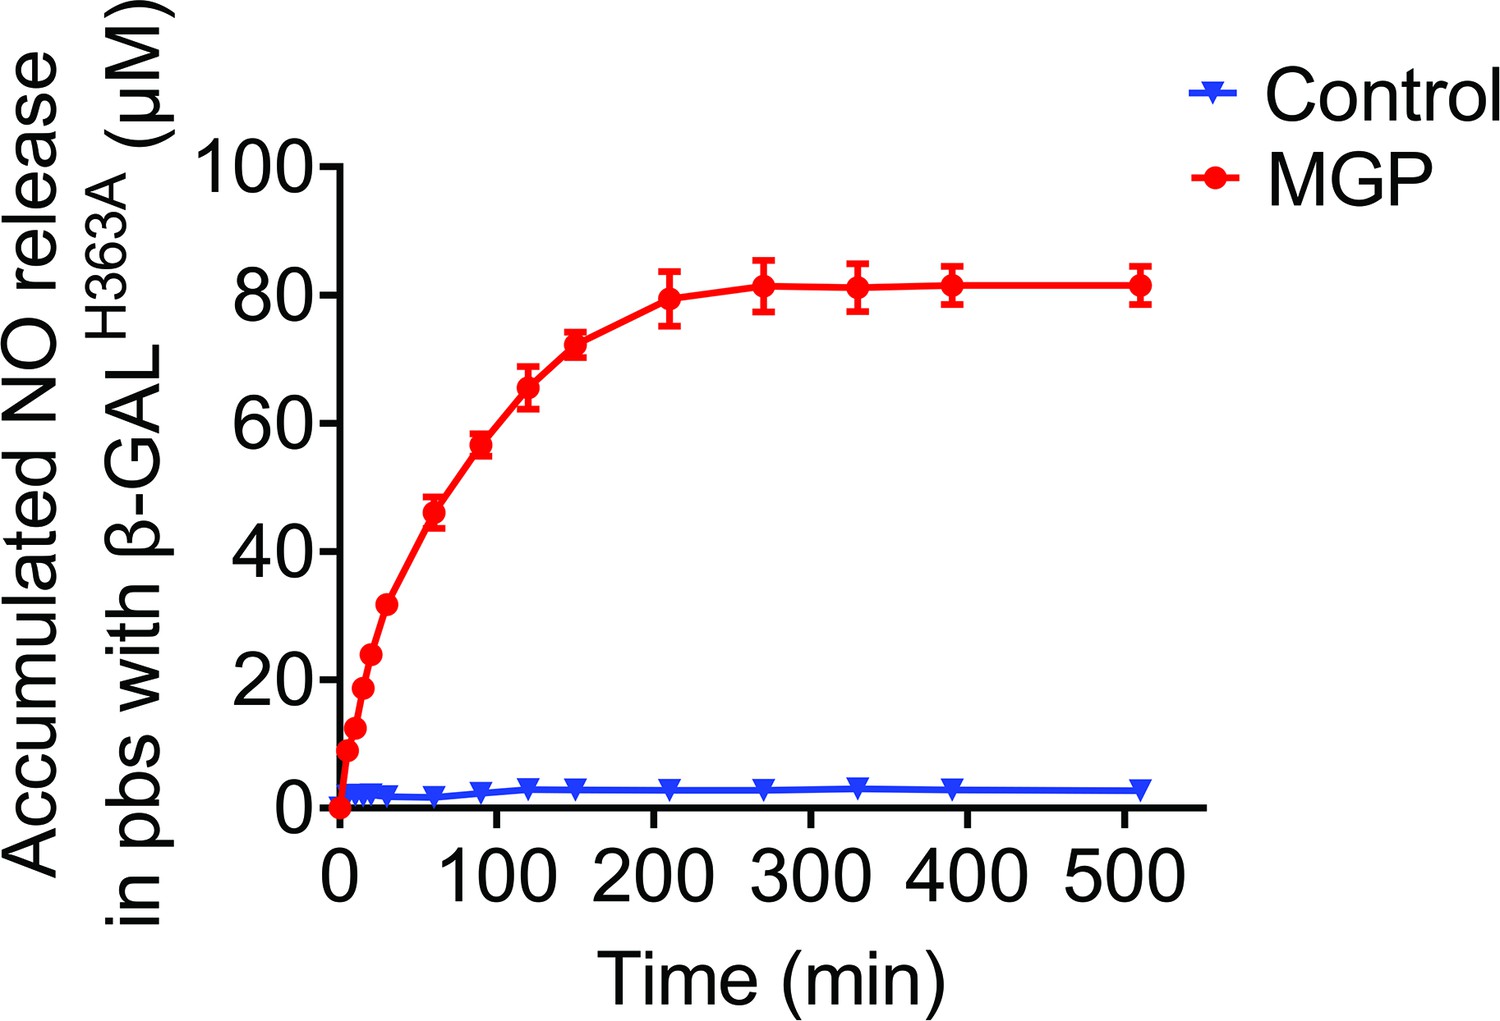
The redesigned NO-prodrug MGP could release NO specifically by β-GALH363A catalysis.
The NO release profile of MGP-NO in response to β-GALH363A in PBS was measured by Griess assay. PBS was used as a control.
Figure 1—figure supplement 4

NO release facilitated the proliferation potential of engineered mesenchymal stem cells (eMSCs) in vitro.
(A) CCK-8 assay showed cell proliferation after administration of different concentrations of NO-prodrug MGP. n = 3. (B) Representative imaging of proliferation marker Ki-67 (red) immunofluorescence staining. Scale bars, 100 μm. (C) Quantification of Ki-67-positive cells. n = 3. (D) Growth factor-related gene (bFGF, HGF, and IGF-1) mRNA levels in cells treated with different concentrations of NO-prodrug MGP. n = 3. (E) The proliferation of eMSCs and eMSCs with MGP administration (2 μg/mL) was analyzed by bioluminescence imaging (BLI) (left); quantification of BLI signals (right); n = 3. (F) Real-time quantitative polymerase chain reaction (qPCR) analysis of the expression of a panel of functional-related genes treated with eMSCs and eMSCs with MGP administration (2 μg/mL) for 24 hr. All data are presented as the mean ± SD, *p < 0.05.
Figure 1—figure supplement 5
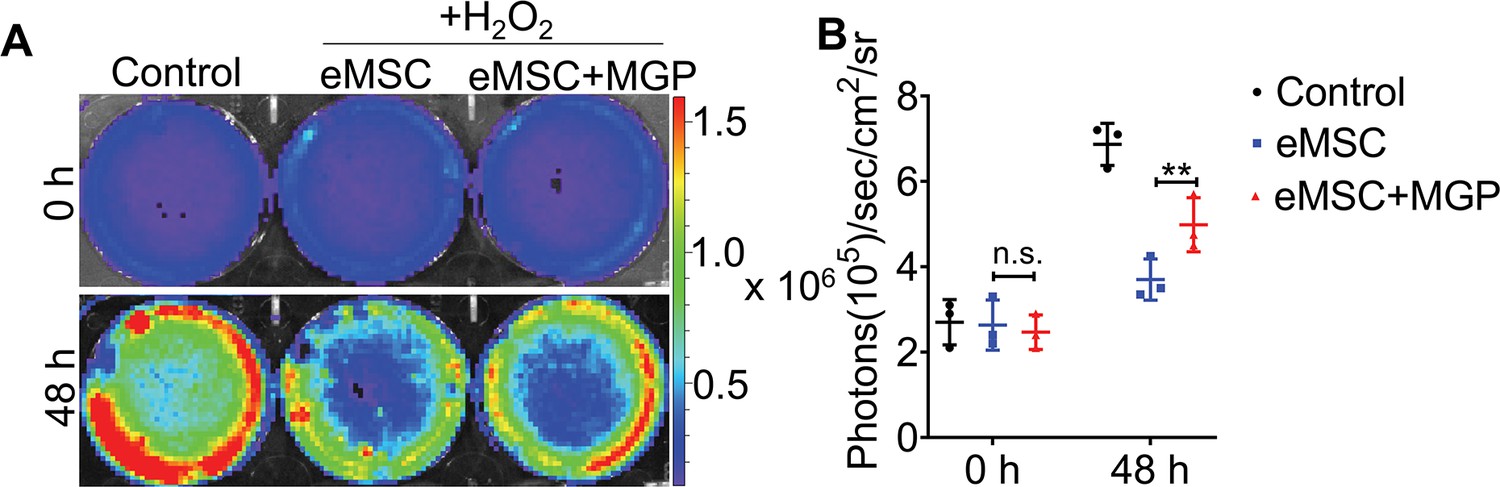
The survival of engineered mesenchymal stem cells (eMSCs) and eMSCs with MGP administration upon exposure to 200 μM H2O2 for 48 hr was analyzed by bioluminescence imaging (BLI).
(A) Representative BLI photographs of eMSCs and eMSCs with MGP administration. (B) Detailed quantitative analysis of signals (signal activity is expressed as photons/s/cm2/sr). All data are presented as the mean ± SD, **p < 0.01, n = 3.
Figure 2 with 2 supplements
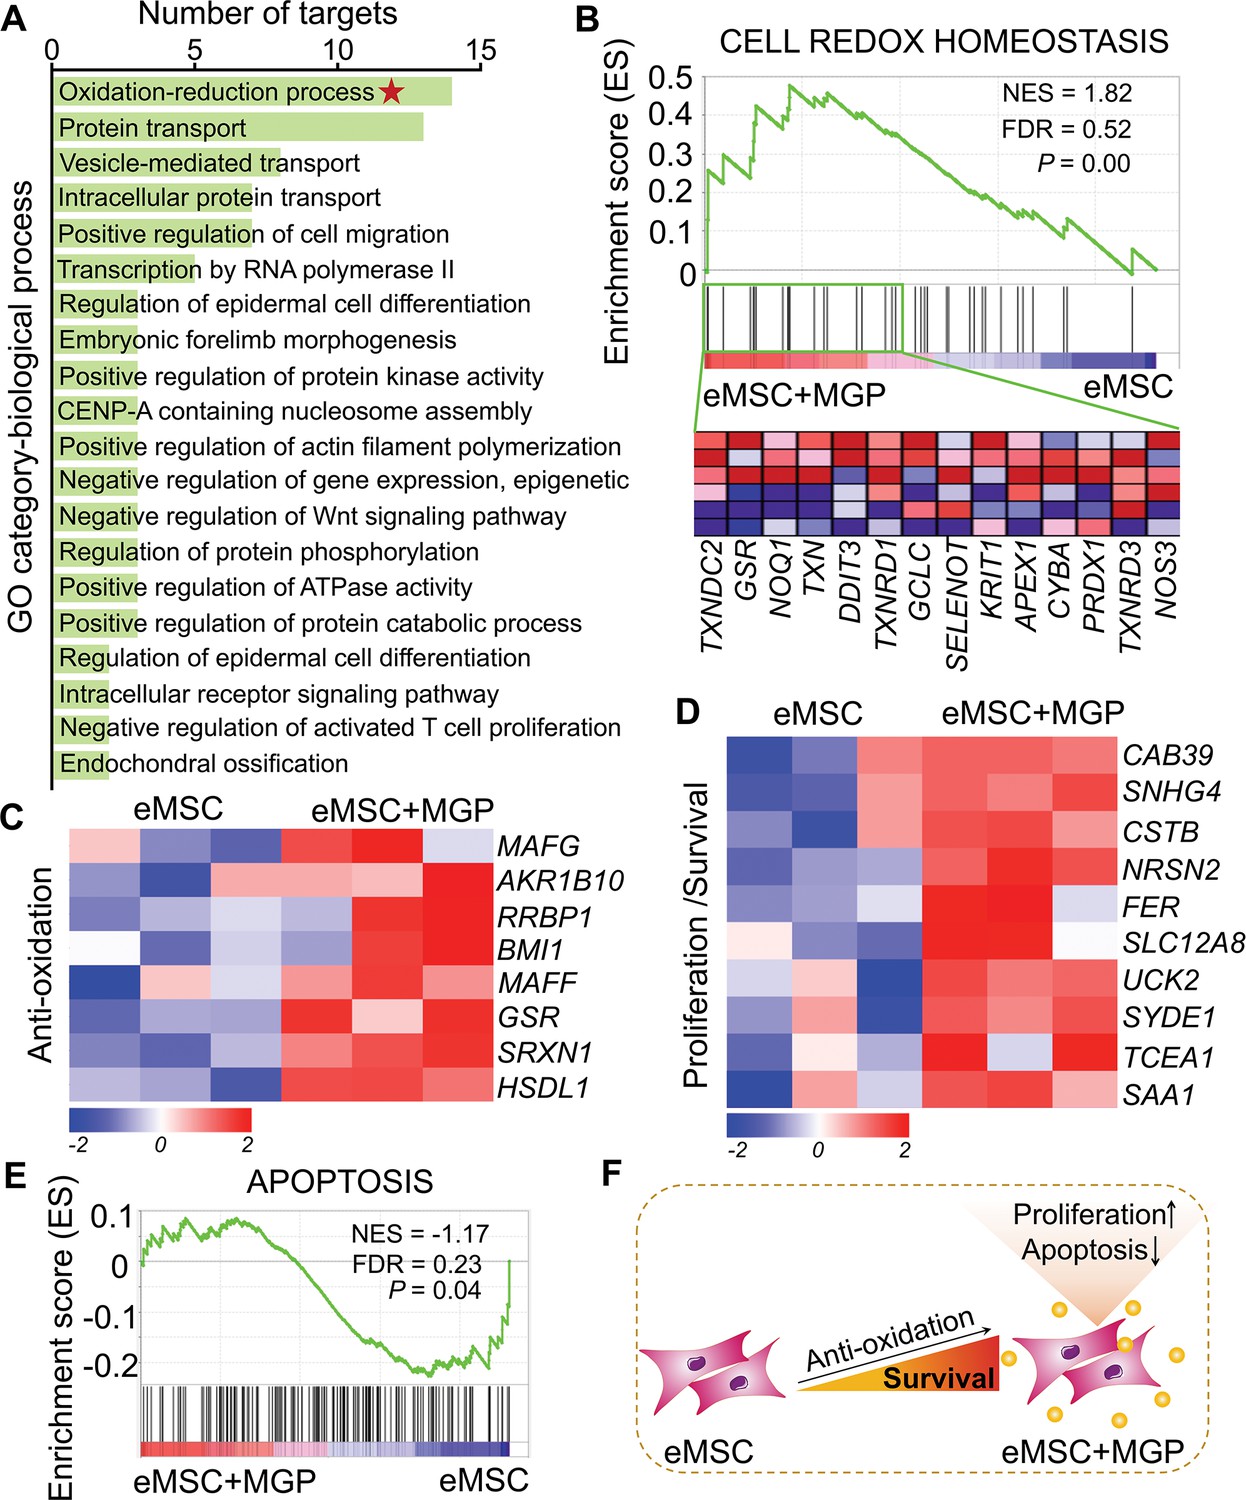
RNA sequencing (RNA-seq) analysis revealed that nitric oxide (NO) improves the antioxidant capacity of engineered mesenchymal stem cells (eMSCs).
(A) Gene Ontology (GO) category analysis of differentially expressed genes (DEGs) for biological processes. Only significantly enriched terms with corrected p< 0.05 are indicated. The top 20 enriched biological processes are ranked by the number of DEGs. (B) Gene set expression analysis (GSEA) revealed enrichment for the cell redox homeostasis pathway. The normalized enrichment score (NES), false discovery rate (FDR), and p value are indicated in the insert. (C, D) Heatmap of representative antioxidation (C) and proliferation/survival (D)-related genes. Fold change > 1.5, p < 0.05. Red indicates upregulation, and blue indicates downregulation. (E) GSEA revealed enrichment for apoptosis pathways. (F) Schematic representation of the prosurvival potential of the NO-eMSC system. eMSC+MGP, eMSCs with MGP administration.
Figure 2—figure supplement 1

Quality control of RNA sequencing (RNA-seq).
(A, B) Sequence counts for each sample. Duplicate read counts are an estimate only. (C) The mean quality value across each base position in the read. (D) The number of reads with average quality scores. (E) Spearman correlation between samples.
Figure 2—figure supplement 2

RNA sequencing (RNA-seq) analysis revealed that the nitric oxide (NO)-engineered mesenchymal stem cell (eMSC) system improved eMSC functionality.
(A) Volcano plot illustrating differentially expressed gene (DEG) expression between eMSCs and eMSCs with MGP administration. (B) Gene set expression analysis (GSEA) revealed enrichment for the reactive oxygen species (ROS) pathway. FDR, false discovery rate; NES, normalized enrichment score. (C) Heatmap of representative angiogenesis-related genes. (D) GSEA revealed enrichment for angiogenesis pathways. (E) Kyoto Encyclopedia of Genes and Genomes (KEGG) pathway annotation of DEGs.
Figure 3 with 1 supplement
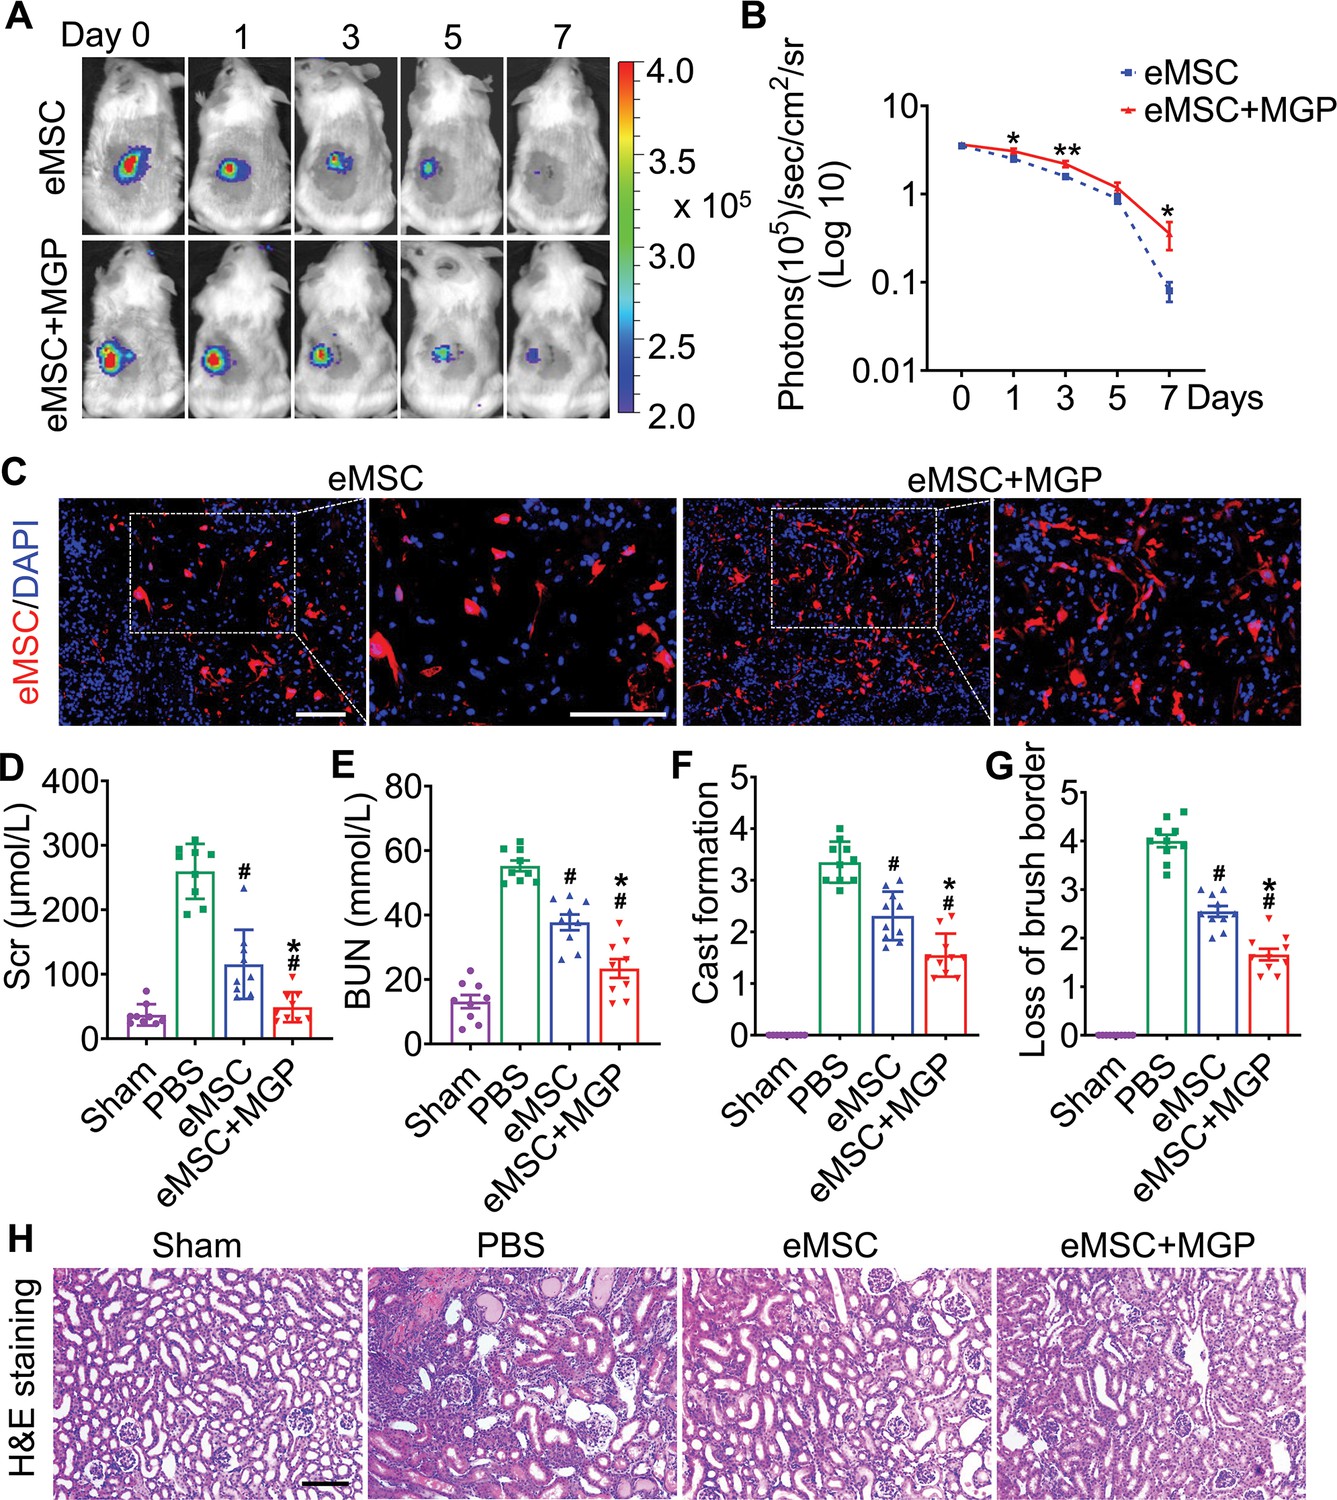
The nitric oxide (NO)-engineered mesenchymal stem cell (eMSC) system confers renoprotection by increasing eMSC survival in vivo.
(A) The survival ratio of eMSCs and eMSCs with MGP administration after transplantation in ischemia/reperfusion (I/R)-induced acute kidney injury (AKI) model mice was tracked by bioluminescence imaging (BLI). Images are from representative animals receiving 1×10⁶ eMSCs alone or eMSCs with MGPs. (B) Quantitative analysis of BLI signals demonstrates that eMSCs with MGP administration could prolong cell survival. Data are presented as the mean ± SD, *p<0.05, **p<0.01. (C) Representative photomicrographs display the engraftment of eMSCs and eMSCs with MGP administration (RFP, red) within kidneys on day 3. Cell nuclei were stained with DAPI (blue). Scale bar, 50 μm. (D and E) Renal function indexes, including serum creatine (D) and blood urea nitrogen (E) levels, were measured on day 3 after AKI. n=9. (F and G) Semi-quantitative histological assessment of cast formation (F) and loss of brush border (G) of H&E staining on day 3 after AKI. n=10. (H) Representative images of H&E staining on day 3 post AKI. eMSC+MGP, eMSCs with MGP administration. Scale bar, 100 μm. All data are presented as the mean ± SD, eMSC+MGP, eMSCs with MGP administration. *p<0.05 versus eMSC; #p<0.05 versus PBS.
Figure 3—figure supplement 1

The nitric oxide (NO)-engineered mesenchymal stem cell (eMSC) system protected against kidney injury by rescuing renal tubules.
(A, B) Representative images of Kim-1 immunohistochemical staining on day 3 after acute kidney injury (AKI). Scale bar, 25 μm. n = 8. (C, D) Caspase-3 immunohistochemical staining on day 3 after AKI. Scale bar, 100 μm. n = 5. All data are presented as the mean ± SD, *p < 0.05 versus eMSC; #p < 0.05 versus PBS.
Figure 4
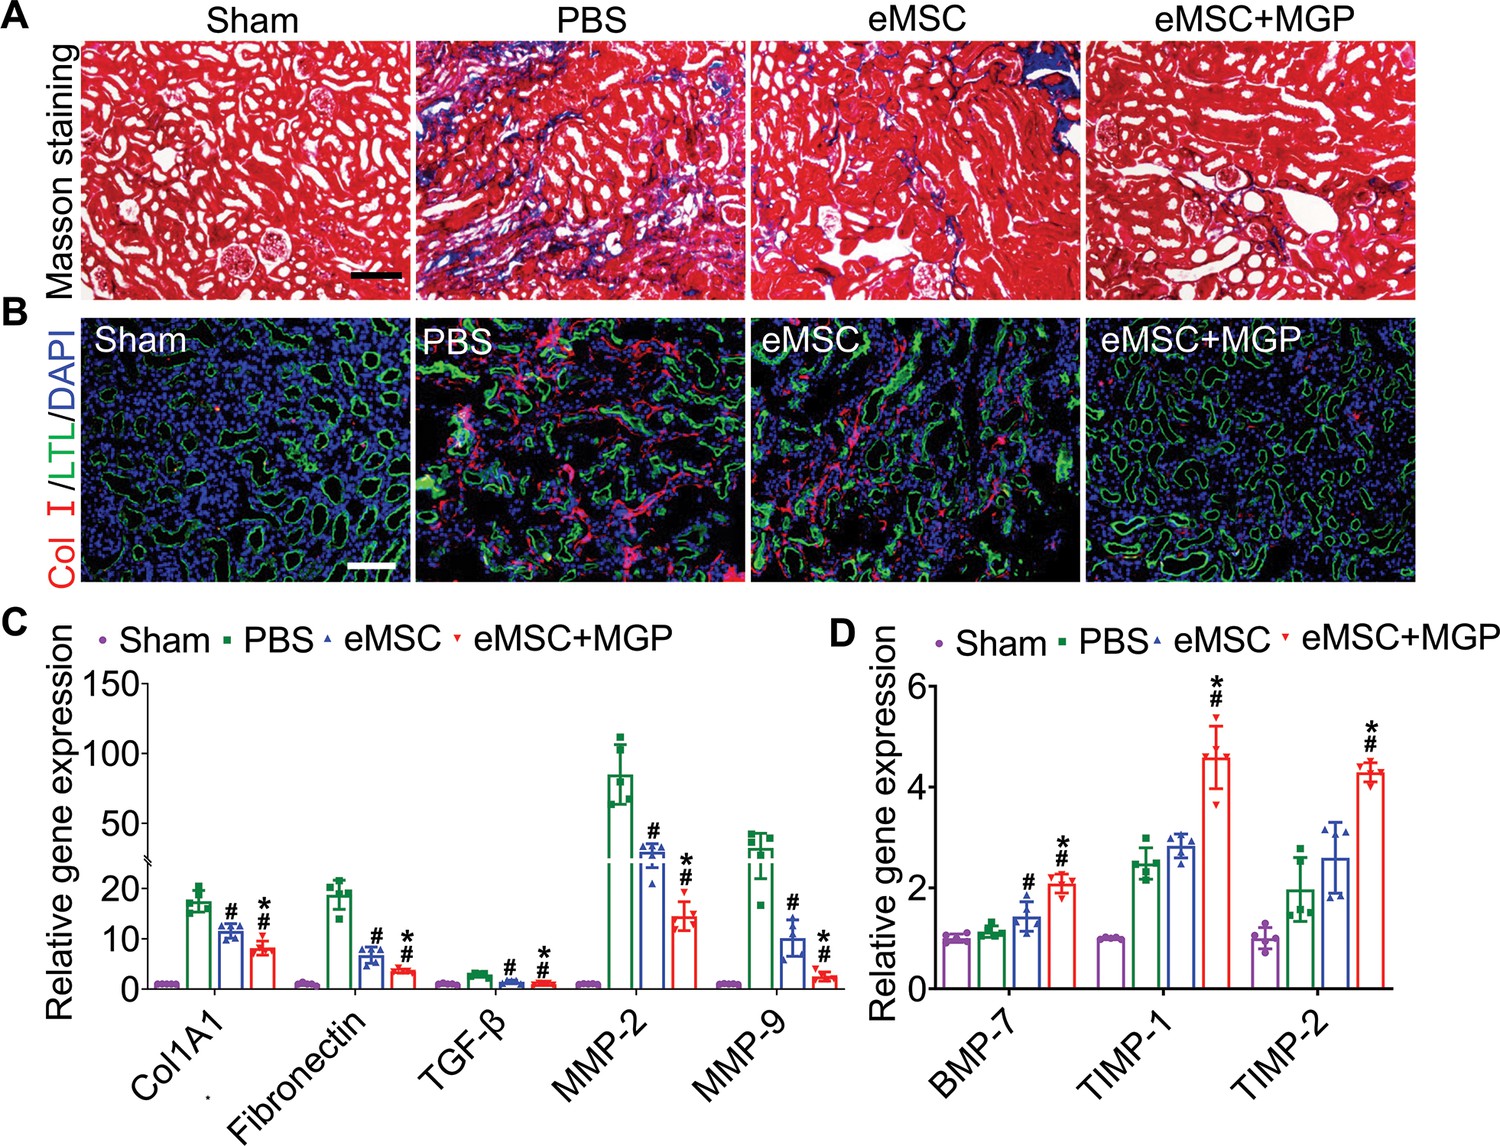
Engineered mesenchymal stem cells (eMSCs) with MGP administration attenuate renal fibrosis.
(A) Masson trichrome staining was performed to examine kidney fibrosis on day 28 post acute kidney injury (AKI). Scale bar, 100 μm. (B) COL-I immunofluorescence staining was performed to examine kidney fibrosis on day 28 post AKI. Scale bar, 100 μm. (C and D) Real-time polymerase chain reaction (PCR) analysis of fibrosis-related gene expression in the kidney on day 28 after AKI. n=5. All data are presented as the mean ± SD, *p<0.05 versus eMSC; #p<0.05 versus PBS.
Figure 5 with 3 supplements
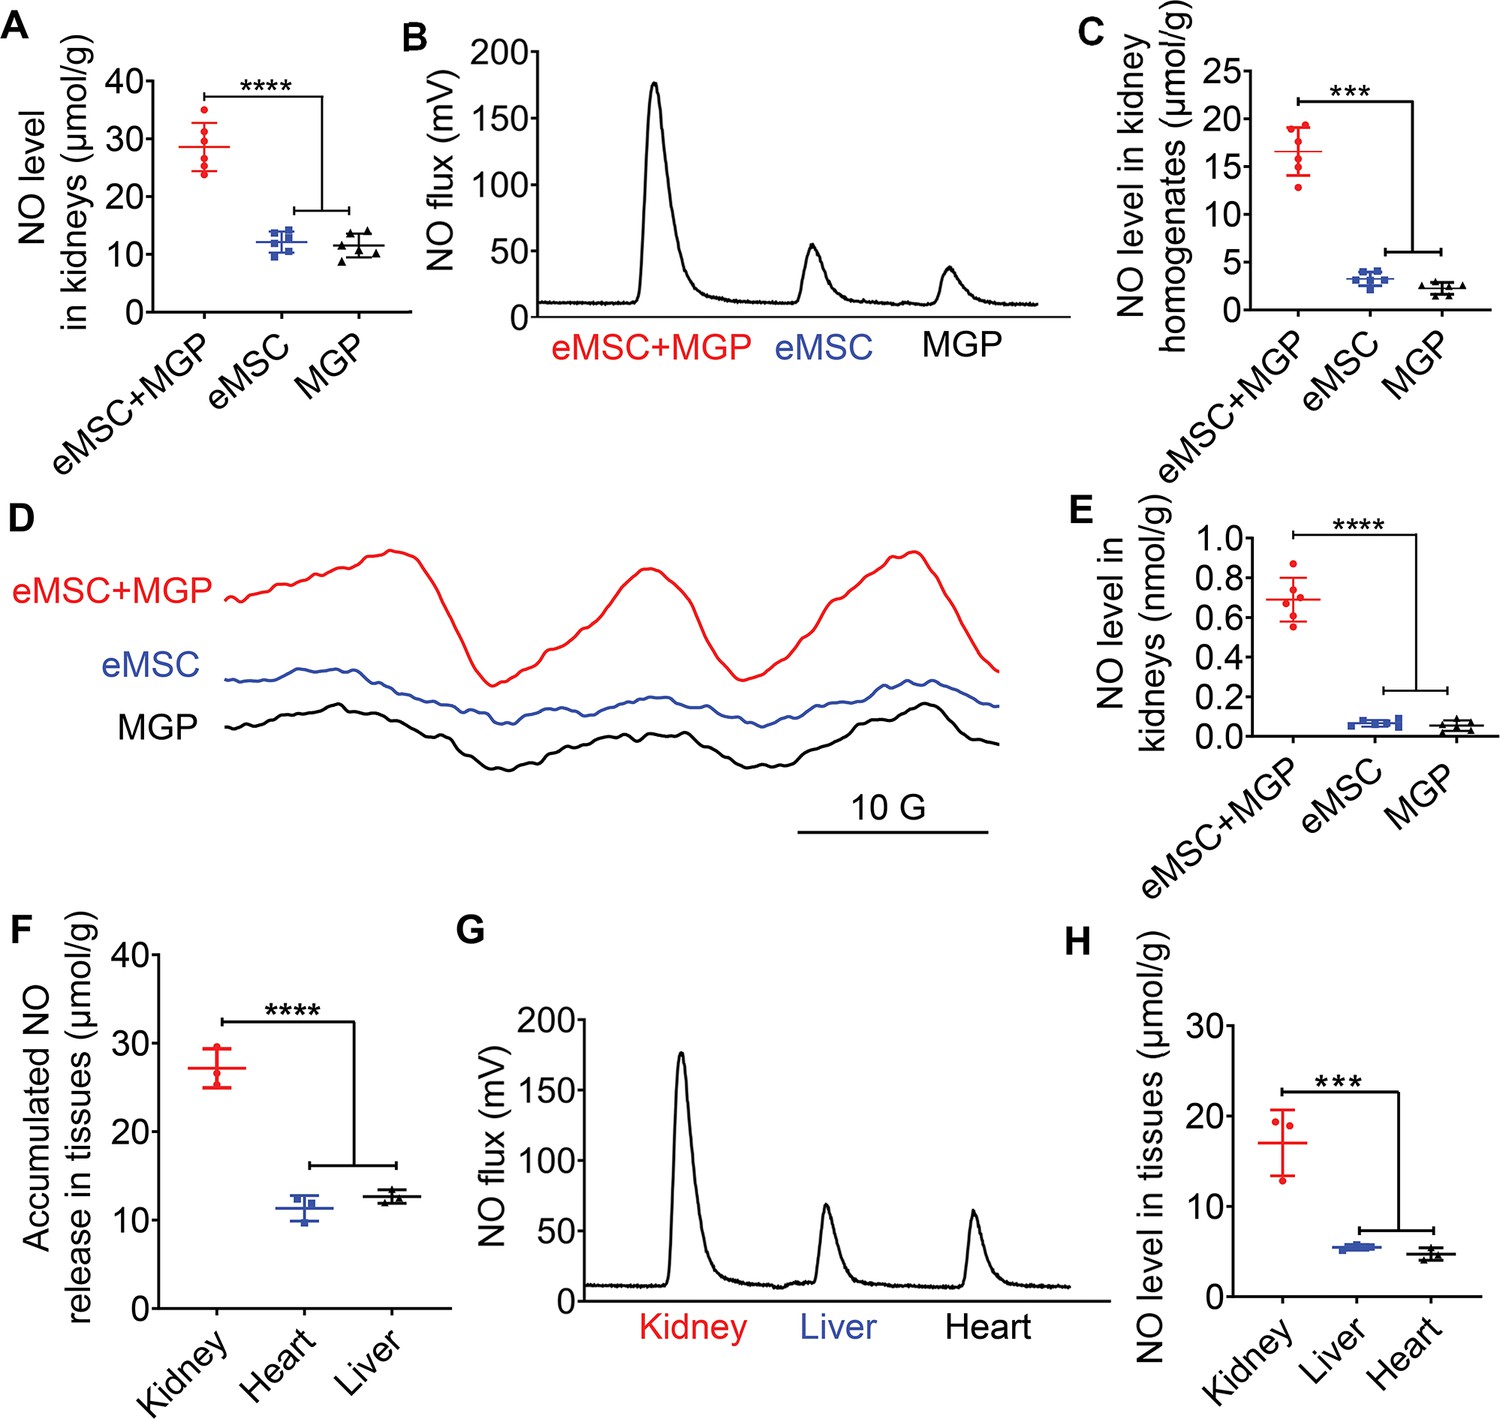
Detection of NO release from the NO-engineered mesenchymal stem cell (eMSC) system in vivo.
(A) The Griess kit assay was used to measure NO levels in kidneys with MGP alone, eMSC alone, or eMSC treated with MGP. n=6. (B) Detection and quantification of NO levels in kidneys in vivo using chemiluminescence. The area of each peak represents the corresponding amount of NO. (C) Calculation of the NO concentration in each group from the standard curve. n=6. (D) NO release from eMSCs with MGP administration in kidneys was assessed by electron paramagnetic resonance (EPR). MGP and eMSC served as controls. (E) Quantitative analysis of NO production in each group. The amount of NO-Fe(DETC)2 was calibrated using TEMPO as a standard. n=6. (F) A Griess kit assay was used to measure NO levels in various tissues of renal eMSC-transplanted mice. n=3. (G) Detection and quantification of NO levels in different tissues from renal eMSC-transplanted mice in vivo using chemiluminescence. The area of each peak represents the corresponding amount of NO. (H) Calculation of the NO concentration in each group from the standard curve. n=3. eMSC+MGP, eMSCs with MGP administration. All data are presented as the mean ± SD, ***p<0.001, ****p<0.0001.
Figure 5—figure supplement 1

The nitric oxide (NO)-engineered adipose-derived mesenchymal stem cell (eAD-MSC) system confers renoprotection.
(A) NO release from eAD-MSCs with MGP administration in kidneys was assessed by electron paramagnetic resonance (EPR). MGP and eAD-MSCs served as controls. (B) Quantitative analysis of NO production in each group. The amount of NO-Fe(DETC)2 was calibrated using TEMPO as a standard. n = 3. **p < 0.01. (C) The Griess kit assay was used to measure NO levels in eAD-MSCs treated with MGP. n=3. (D) Calculation of the NO concentration in each group from the standard curve. n = 3. **p < 0.01. (E) Renal function indexes, including serum creatine and blood urea nitrogen levels, were measured on day 3 after acute kidney injury (AKI). n = 3. *p < 0.05 versus eAD-MSC; #p < 0.05 versus PBS.
Figure 5—figure supplement 2

The nitric oxide (NO)-engineered human umbilical cord mesenchymal stem cell (ehUC-MSC) system confers renoprotection.
(A) NO release from ehUC-MSCs with MGP administration in kidneys was assessed by electron paramagnetic resonance (EPR). MGP and ehUC-MSCs served as controls. (B) Quantitative analysis of NO production in each group. The amount of NO-Fe(DETC)2 was calibrated using TEMPO as a standard. n = 3. *p < 0.05. (C) The Griess kit assay was used to measure NO levels in ehUC-MSC treated with MGP. n=3. (D) Calculation of the NO concentration in each group from the standard curve. n = 3. *p < 0.05. (E) Renal function indexes, including serum creatine and blood urea nitrogen levels, were measured on day 3 after acute kidney injury (AKI). n = 3. All data are presented as the mean ± SD, *p < 0.05 versus eAD-MSC; #p<0.05 versus PBS.
Figure 5—figure supplement 3
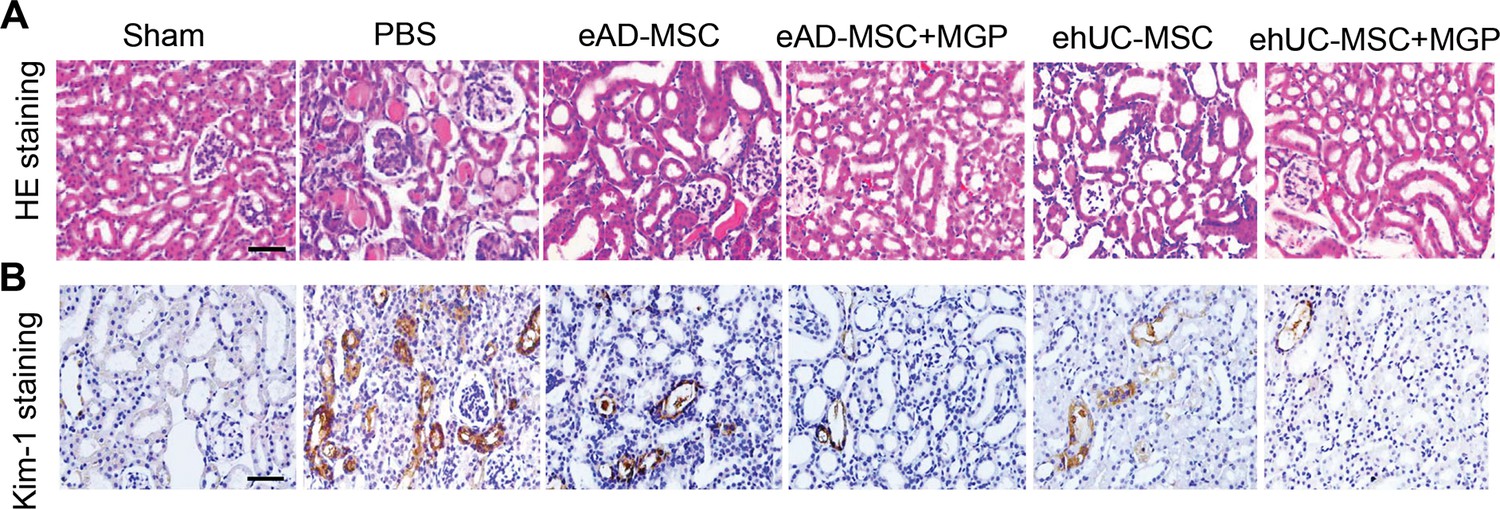
Renoprotection of engineered adipose-derived mesenchymal stem cell (eAD-MSCs) and engineered human umbilical cord mesenchymal stem cells (ehUC-MSCs).
(A) Representative images of H&E staining on day 3 post acute kidney injury (AKI). (B) Representative images of Kim-1 immunostaining on day 3 post AKI. Scale bar, 100 μm.
Figure 6 with 3 supplements
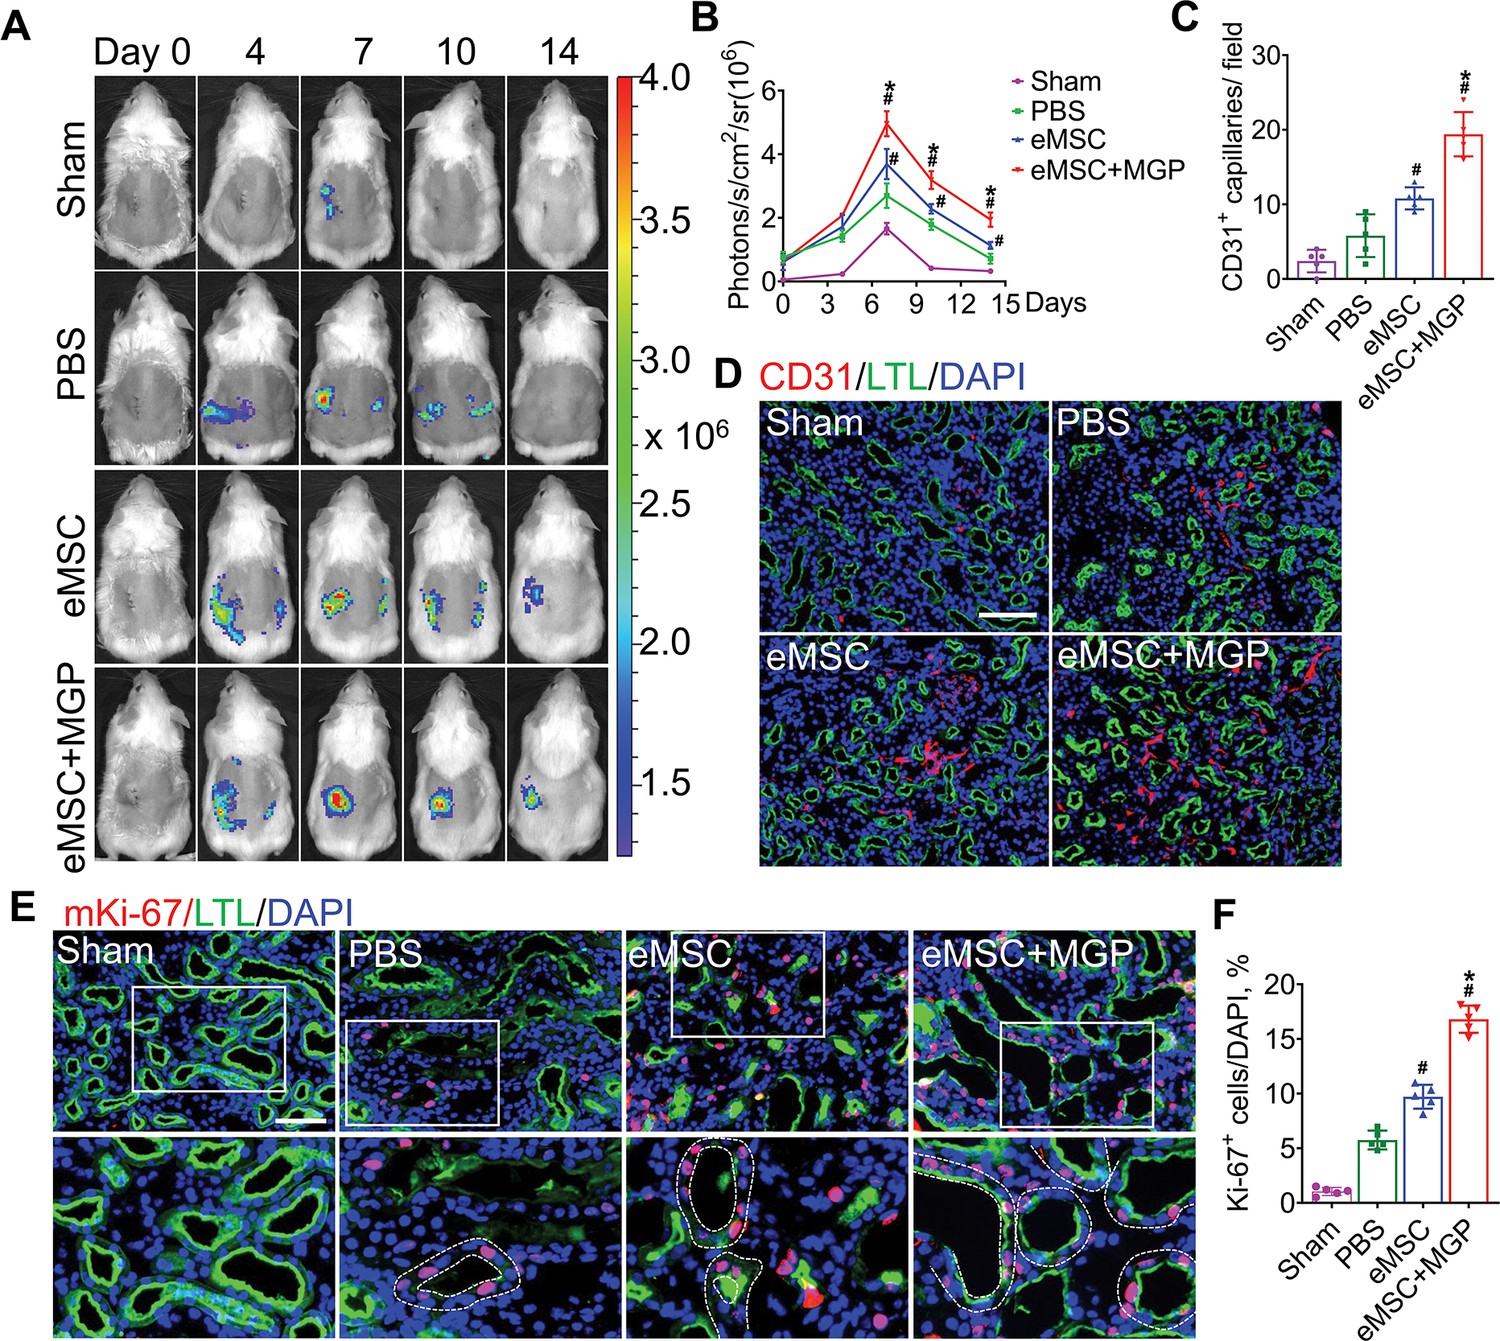
The nitric oxide (NO)-engineered mesenchymal stem cell (eMSC) system promoted kidney regeneration after acute kidney injury (AKI).
(A) In vivo bioluminescence imaging (BLI) was used to monitor the spatiotemporal dynamics of VEGFR2 expression following eMSC administration in a mouse AKI model using Vegfr2-Fluc transgenic mice. (B) Quantification of BLI signals revealed that eMSCs with MGP could enhance angiogenesis in injured kidneys. The average radiance of Fluc was expressed as photons/s/cm2/sr. n=3. (C) Quantification of CD31-positive capillaries in injured kidneys on day 7 after AKI. CD31 is a marker of endothelial cells and can be used for angiogenesis evaluation. n=5. (D) Immunofluorescence staining of CD31 was performed on day 7 after AKI. Scale bar, 100 μm. LTL (green) was used to reveal proximal tubules. (E) Representative images of immunofluorescence staining of Ki67. (F) Quantification of the percentage of Ki67-positive cells in kidneys on day 3 after AKI. n=5. Scale bar, 50 μm. eMSC+MGP, eMSCs with MGP administration. All data are presented as the mean ± SD, *p<0.05 versus eMSCs; #p<0.05 versus PBS.
Figure 6—figure supplement 1

Schematic representation of VEGFR2-Fluc-KI transgenic mice to characterize angiogenesis.
Figure 6—figure supplement 2
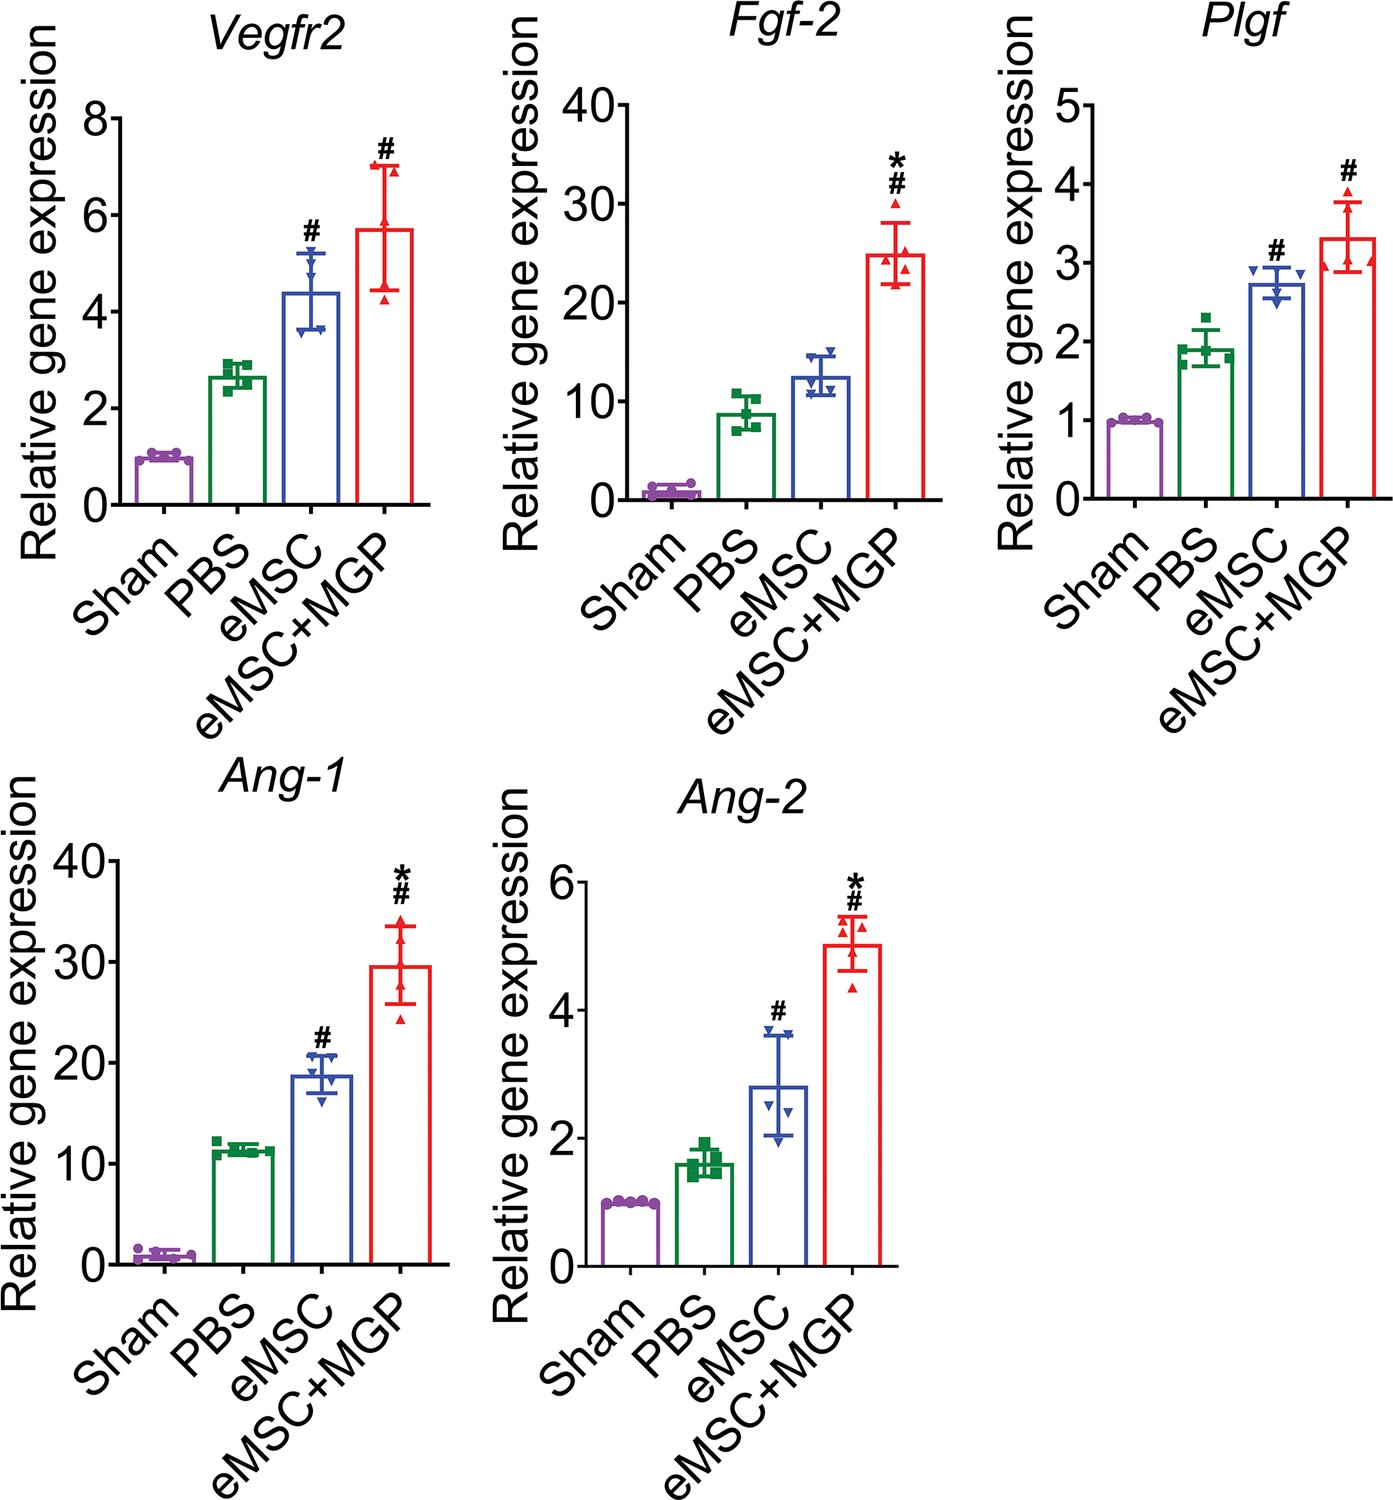
Enhanced angiogenic effects of the nitric oxide (NO)-engineered mesenchymal stem cell (eMSC) system.
mRNA levels of angiogenesis-related genes (VEGFR2, bFGF, PLGF, Ang-1, and Ang-1) in kidney tissues on day 7 after acute kidney injury (AKI). All data are presented as the mean ± SD, n=5 per group, *p < 0.05 versus eMSCs; #p < 0.05 versus PBS.
Figure 6—figure supplement 3
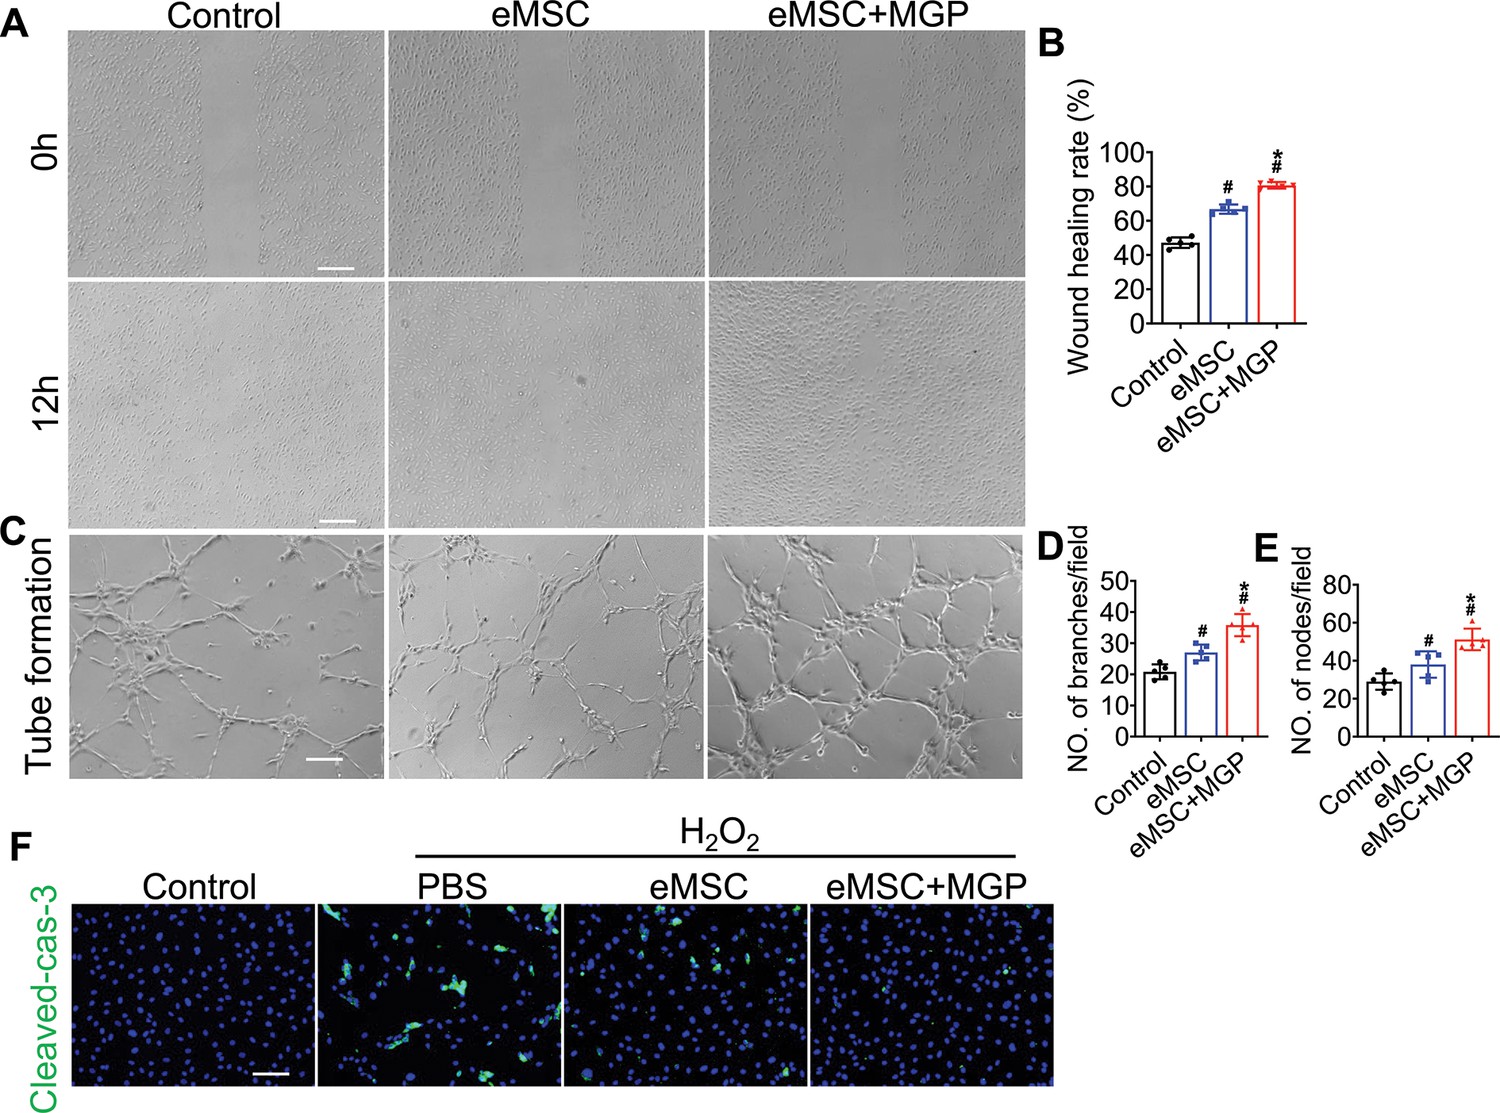
Engineered mesenchymal stem cells (eMSCs) with MGP administration enhanced the proangiogenic potential of human umbilical vein endothelial cells (HUVECs) in vitro.
(A) Representative images of the wound-healing migration assay in HUVECs cocultured with eMSCs and eMSCs with MGP administration. Scale bar, 200 μm. (B) Quantitative analysis of the wound-healing percentage ratio. n = 5. (C) Representative images of tube formation of HUVECs cocultured with eMSCs and eMSCs with MGP administration. Scale bar, 100 μm. (D to E) Quantitative analysis of node number (D) and branch number (E) in three random fields in each group. n = 5. (F) Cleaved caspase-3 immunostaining in HUVECs cocultured with eMSCs and eMSCs with MGP administration following exposure to 200 μM H2O2. Scale bars, 50 μm. DAPI demarcates nuclei. All data are presented as the mean ± SD, *p < 0.05 versus eMSC; #p < 0.05 versus control.
Figure 7 with 1 supplement
The nitric oxide (NO)-engineered mesenchymal stem cell (eMSC) system modulates the inflammatory response by reshaping macrophage polarization.
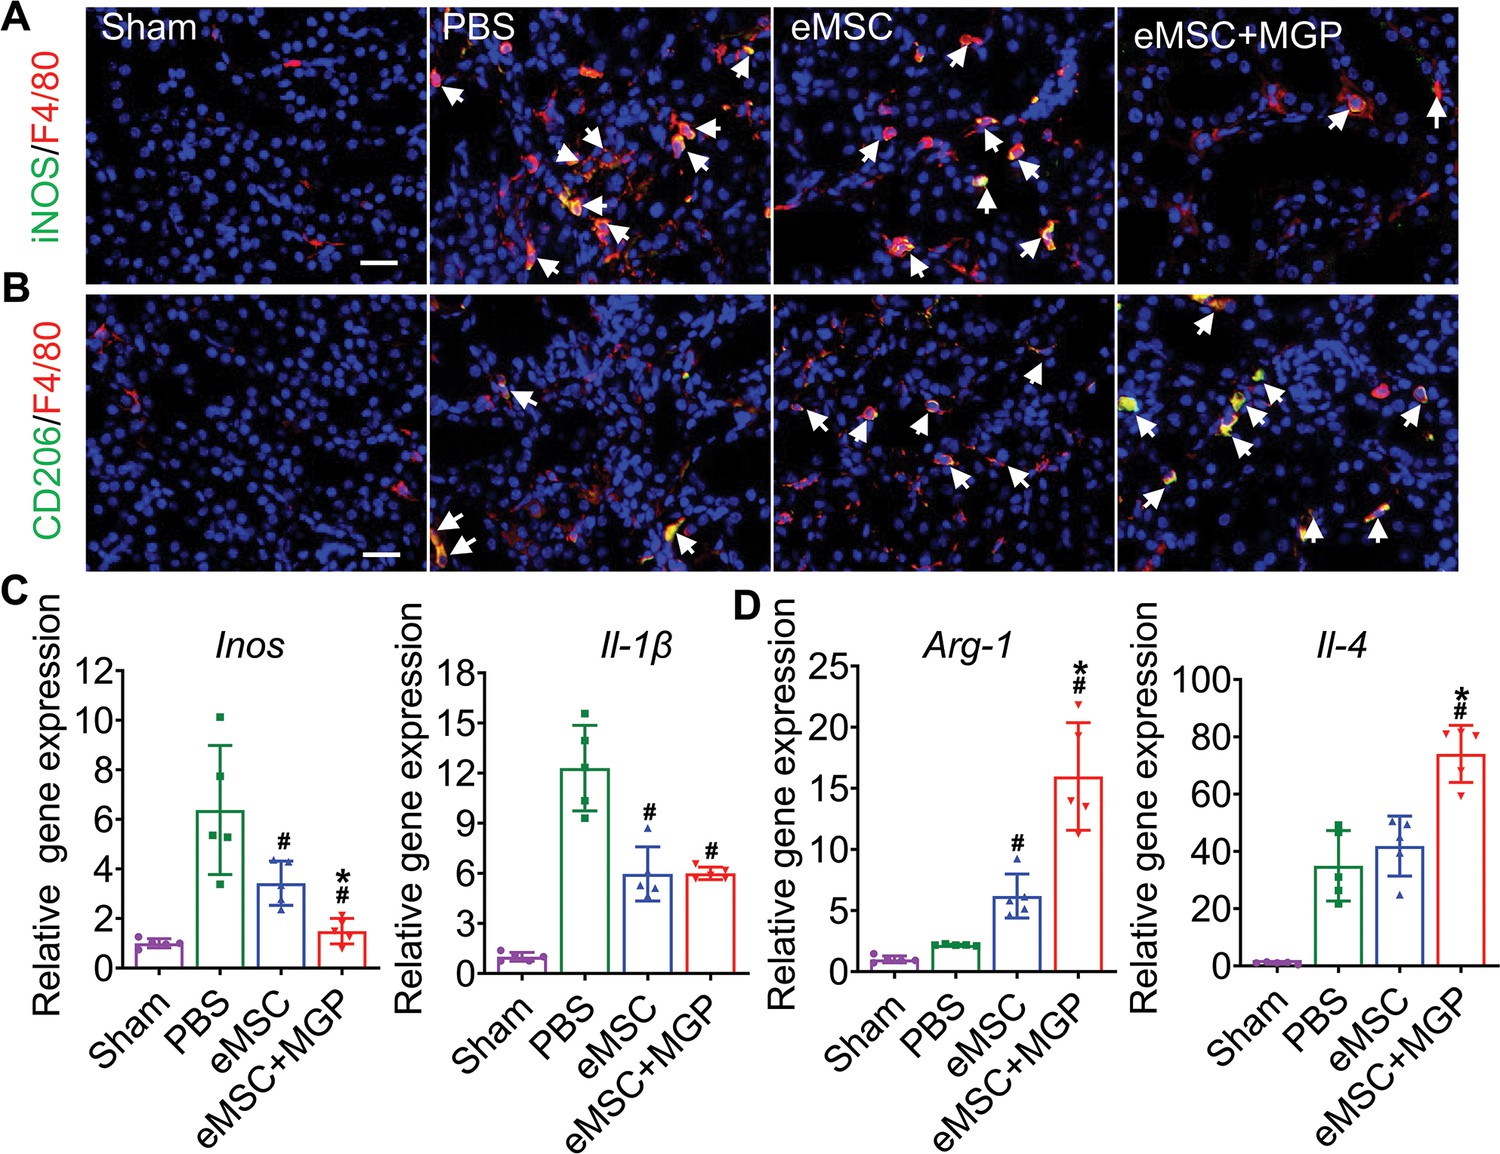
(A) Immunofluorescence images by costaining for the M1 macrophage marker iNOS (green) and pan-macrophage marker F4/80 (red) in injured kidneys on day 3 after acute kidney injury (AKI). M1 macrophages are indicated by white arrows. Scale bar, 50 μm. (B) Immunofluorescence images by costaining for the M2 macrophage marker CD206 (green) and pan-macrophage marker F4/80 (red) in injured kidneys on day 3 after AKI. M2 macrophages are indicated by white arrows. Scale bar, 50 μm. (C) Real-time polymerase chain reaction (RT-PCR) analysis of M1 macrophage-related gene (iNOS and IL-1β) expression in kidney tissues on day 3 after AKI. n=5. (D) RT-PCR analysis of M2 macrophage-related gene (IL-4 and Arg-1) expression in kidney tissues on day 3 after AKI. n=5. eMSC+MGP, eMSCs with MGP administration. All data are presented as the mean ± SD, *p<0.05 versus eMSCs; #p<0.05 versus PBS.
Figure 7—figure supplement 1
The nitric oxide (NO)-engineered mesenchymal stem cell (eMSC) system ameliorates oxidative stress by protecting against antioxidation.
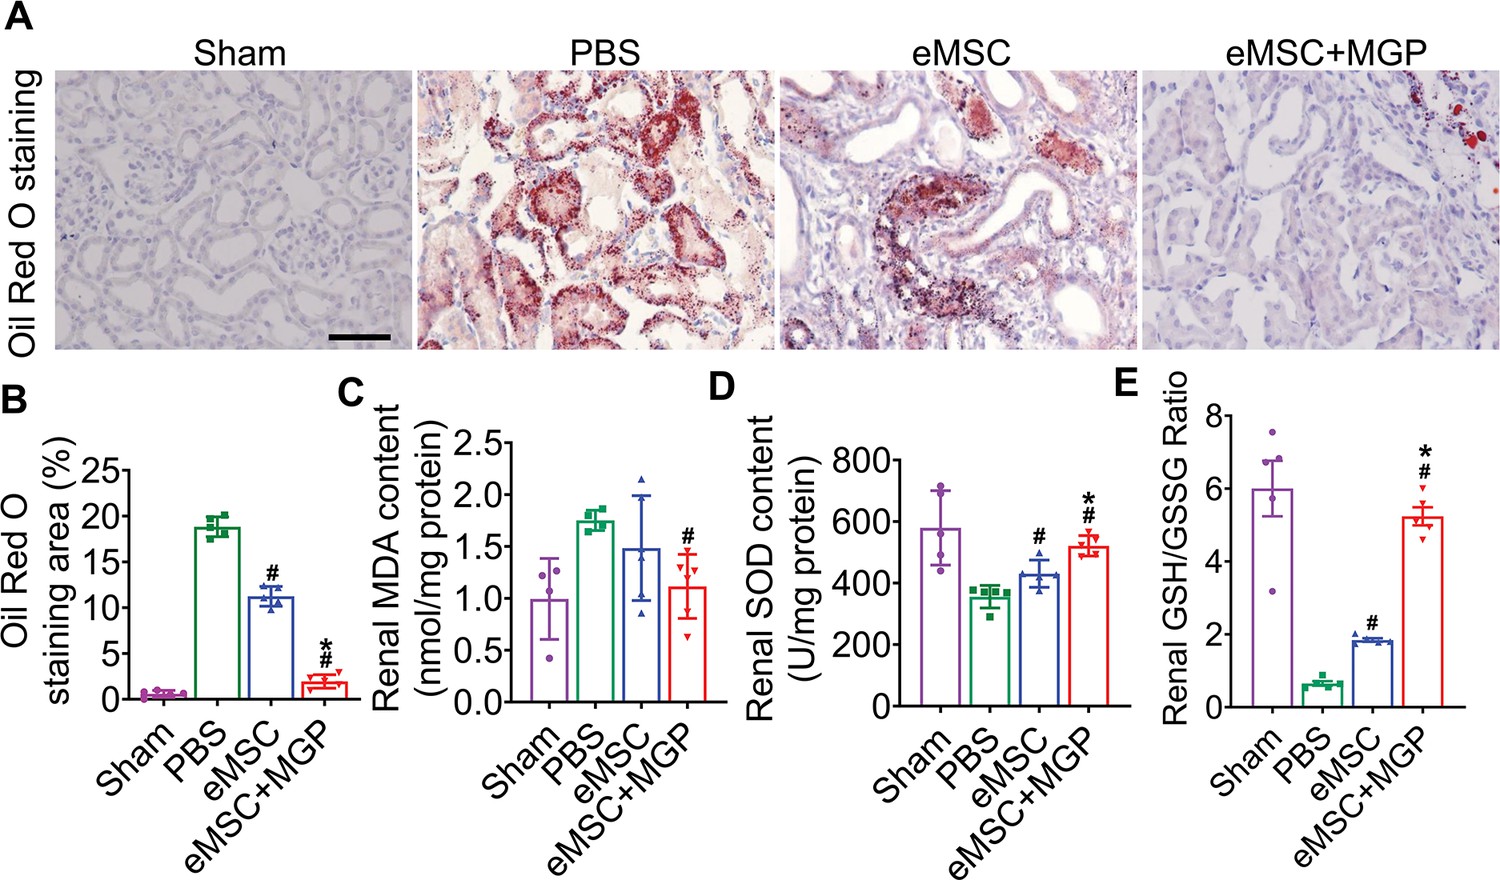
(A) Representative images of Oil red O staining in proximal tubules at 3 days after acute kidney injury (AKI). Scale bars, 50 μm. (B) Quantification of the Oil Red O-positive area. (C, D, E) Renal MDA (C), SOD (D) contents, and GSH/GSSG ratio (E) 3 days after AKI. All data are presented as the mean ± SD, n=5, *p < 0.05 versus eMSCs; #p < 0.05 versus PBS.
Additional files
-
Supplementary file 1
Antibodies used for western blotting and immunostaining analysis.
- https://cdn.elifesciences.org/articles/84820/elife-84820-supp1-v2.docx
-
Supplementary file 2
List of human primer sequences used for quantitative polymerase chain reaction (qPCR) analysis in this study.
- https://cdn.elifesciences.org/articles/84820/elife-84820-supp2-v2.docx
-
Supplementary file 3
List of mouse primer sequences used for quantitative polymerase chain reaction (qPCR) analysis in this study.
- https://cdn.elifesciences.org/articles/84820/elife-84820-supp3-v2.docx
-
MDAR checklist
- https://cdn.elifesciences.org/articles/84820/elife-84820-mdarchecklist1-v2.docx
Download links
A two-part list of links to download the article, or parts of the article, in various formats.
Downloads (link to download the article as PDF)
Open citations (links to open the citations from this article in various online reference manager services)
Cite this article (links to download the citations from this article in formats compatible with various reference manager tools)
Genetically engineered mesenchymal stem cells as a nitric oxide reservoir for acute kidney injury therapy
eLife 12:e84820.
https://doi.org/10.7554/eLife.84820


